Article

Energy Commitment for a Power System Supplied by Multiple Energy Carriers System using Following Optimization Algorithm

by
Mohammad Dehghani
1,
Mohammad Mardaneh
1,
Om Parkash Malik
2,
Josep M. Guerrero
3,
Ruben Morales-Menendez
4,
Ricardo A. Ramirez-Mendoza
4,*,
José Matas
5 and
Abdullah Abusorrah
6
1
Department of Electrical and Electronics Engineering, Shiraz University of Technology, Shiraz 71557-13876, Iran
2
Department of Electrical and Computer Engineering, University of Calgary, Calgary, AB T2N 1N4, Canada
3
CROM Center for Research on Microgrids, Department of Energy Technology, Aalborg University, 9220 Aalborg, Denmark
4
School of Engineering and Sciences, Tecnologico de Monterrey, Monterrey 64849, Mexico
5
Electric Engineering Department, Polytechnic University of Catalonia (EEBE-UPC), 08019 Barcelona, Spain
6
Center of Research Excellence in Renewable Energy and Power Systems, Department of Electrical and Computer Engineering, Faculty of Engineering, K. A. CARE Energy Research and Innovation Center, King Abdulaziz University, Jeddah 21589, Saudi Arabia
*
Author to whom correspondence should be addressed.
Appl. Sci. 2020, 10(17), 5862; https://doi.org/10.3390/app10175862
Submission received: 29 July 2020 / Revised: 10 August 2020 / Accepted: 12 August 2020 / Published: 24 August 2020
(This article belongs to the Special Issue Control, Optimization and Planning of Power Distribution Systems)

Abstract

:
In today’s world, the development and continuation of life require energy. Supplying this energy demand requires careful and scientific planning of the energy provided by a variety of products, such as oil, gas, coal, electricity, etc. A new study on the operation of energy carriers called Energy Commitment (EC) is proposed. The purpose of the EC is to set a pattern for the use of energy carriers to supply energy demand, considering technical and economic constraints. EC is a constrained optimization problem that can be solved by using optimization methods. This study suggests the Following Optimization Algorithm (FOA) to solve the EC problem to achieve technical and economic benefits. Minimizing energy supply costs for the total study period is considered as an objective function. The FOA simulates social relationships among the community members who try to improve their community by following each other. Simulation is carried out on a 10-unit energy system supplied by various types of energy carriers that includes transportation, agriculture, industrial, residential, commercial, and public sectors. The results show that the optimal energy supply for a grid with 0.15447 Millions of Barrels of Oil Equivalent (MBOE) of energy demand costs 9.0922 millions dollar for a 24-h study period. However, if the energy supply is not optimal, the costs of operating energy carriers will increase and move away from the optimal economic situation. The economic distribution of electrical demand between 10 power plants and the amount of production units per hour of the study period is determined. The EC outputs are presented, which include an appropriate pattern of energy carrier utilization, energy demand supply costs, appropriate combination of units, and power plant production. The behavior and process of achieving the answer in the convergence curve for the implementation of FOA on EC indicates the exploration and exploitation capacity of FOA. Based on the simulated results, EC provides more information than Unit Commitment (UC) and analyzes the network more efficiently and deeply.

Graphical Abstract

1. Introduction

An energy carrier is a substance—for example, fuel, or sometimes a phenomenon (energy system)—that contains energy, which can be later converted to other forms, such as mechanical work or heat, or operate chemical or physical processes. Today’s societies use several energy carriers in the industry, service, residential, and transportation sectors. Among the various energy carriers, oil is of paramount importance, since its price has a considerable effect on economic growth. Besides, neither oil nor any of the fossil fuels such as coal and natural gas have endless sources. The growing demand on the one hand and declining fossil resources, on the other hand, necessitate full consideration for the operation of energy. Therefore, the operation of energy carriers to supply the energy demand, called the Energy Commitment (EC) problem, is studied, in particular from the perspective of an electric power system.
Unit Commitment (UC) is a significant study carried out in the operation of the electricity grid. An essential criterion in UC is the supply of power demand with the least fuel cost and optimal combination of different power plants [1]. It forms the basis of energy carrier commitment.
The UC issue has been of great interest to researchers as evident from the following representative literature. In [2], uncertainty in the production of virtual power plants is investigated, and transmission line constraints in solving the UC problem for large-scale networks are studied in [3]. The UC problem in the presence of Flexible AC Transmission System (FACTS) devices and energy storage devices is investigated in [4]. To solve the UC problem, a novel annual analysis is proposed for the thermal power generator and pumped storages under a massive introduction of renewable energy sources [5]. Ref. [6], the authors proposed the implementation of the UC in the presence of energy storage systems and its optimal size for a region in northern Chile. Solving the UC problem in the presence of wind, nuclear, and thermal power plants has been studied by considering the security constraints of the transmission line and the influence of wind power uncertainty on the spinning reserve capacity of the system in China [7]. A new method based on the Particle Swarm Optimization (PSO) algorithm, [8], and the solution of the UC problem using genetic algorithm was proposed in [9]. Other algorithms, such as the Gray Wolf Optimizer (GWO) [10], Whale Optimization Algorithm (WOA) [11], simulated annealing [12], and shuffled frog-leaping algorithm [13] have also been suggested to find the solution to the UC problem.
In recent years, Multi-Carrier Energy (MCE) systems that improve energy efficiency and reliability have received much attention. Each of the gas, electrical, and heat networks consists of energy sources, several loads, and a set of transmission lines or pipes that supply energy demand through the resources of the system. The flow value of the supply lines of each of these grids can be calculated mathematically by the quantities of those lines [14].
A mathematical model for intelligent loads participation in load response programs in an MCE system management is proposed, [15]. In this model, the optimal operation is performed using an energy storage system. The effects of load response programs on the efficiency and operating costs of MCE systems in the presence and absence of wind energy and energy storage are evaluated and analyzed in [16]. The teaching and learning-based optimization algorithm is applied to optimize the operation of MCE systems in [17].
In general, an Energy Hub (EH) is an interface between the production, consumption, and transmission of different forms of energy. EHs are connected to electric power grids and perform energy conversion operations from one state to another or improve the quality of energy delivered to the load. Thus, the inputs of an EH consist of different forms of energy, and its outputs are system loads. The purpose of the EH is to provide the required energy for load demand through its input and internal equipment [18].
The concept of EH has been introduced in various residential, commercial, and other applications. In this regard, economy and energy savings in a hospital have been studied [19], and linear integer programming is presented to improve the performance of an electric micro-grid in the presence of cooling, thermal, and electrical loads [20]. The optimal operation of a residential house as an EH using the PSO algorithm is proposed in [21]. The optimal operation of an EH has been studied considering the energy storage systems in [22]. The EH has also been proposed for economic and reliability purposes in [23] with the aim of proper selection of the internal EH equipment. Furthermore, the energy management of smart hubs is discussed in [24].
As mentioned in the previous subsections, in UC, the goal is to determine the appropriate pattern of power plant production to supply the electrical demand. In an MCE system, gas, electrical, and heat networks are examined, and the purpose of the EH is to supply the required energy demand through its input and internal equipment. Although very valuable studies have been conducted by researchers in the operation of power systems, the operation of an integrated grid called the energy grid and determining the appropriate pattern of use of energy carriers to supply energy demand in this network has been less studied. Therefore, a new study named the Energy Commitment (EC) problem that determines a suitable pattern of energy carriers utilization to supply the energy demand in particular from the perspective of an electric power system is proposed. In the proposed EC study, more details of the network such as the simulation of oil refining and the impact of the imports and exports of energy carriers are considered.
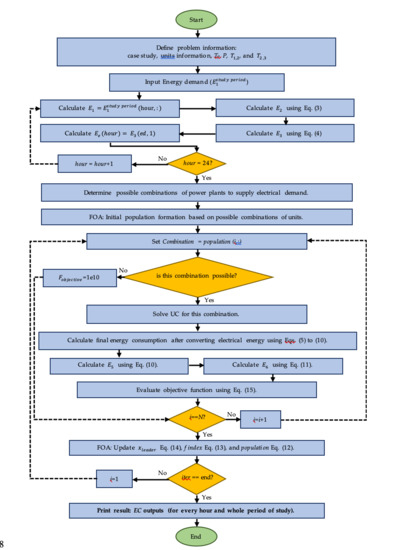
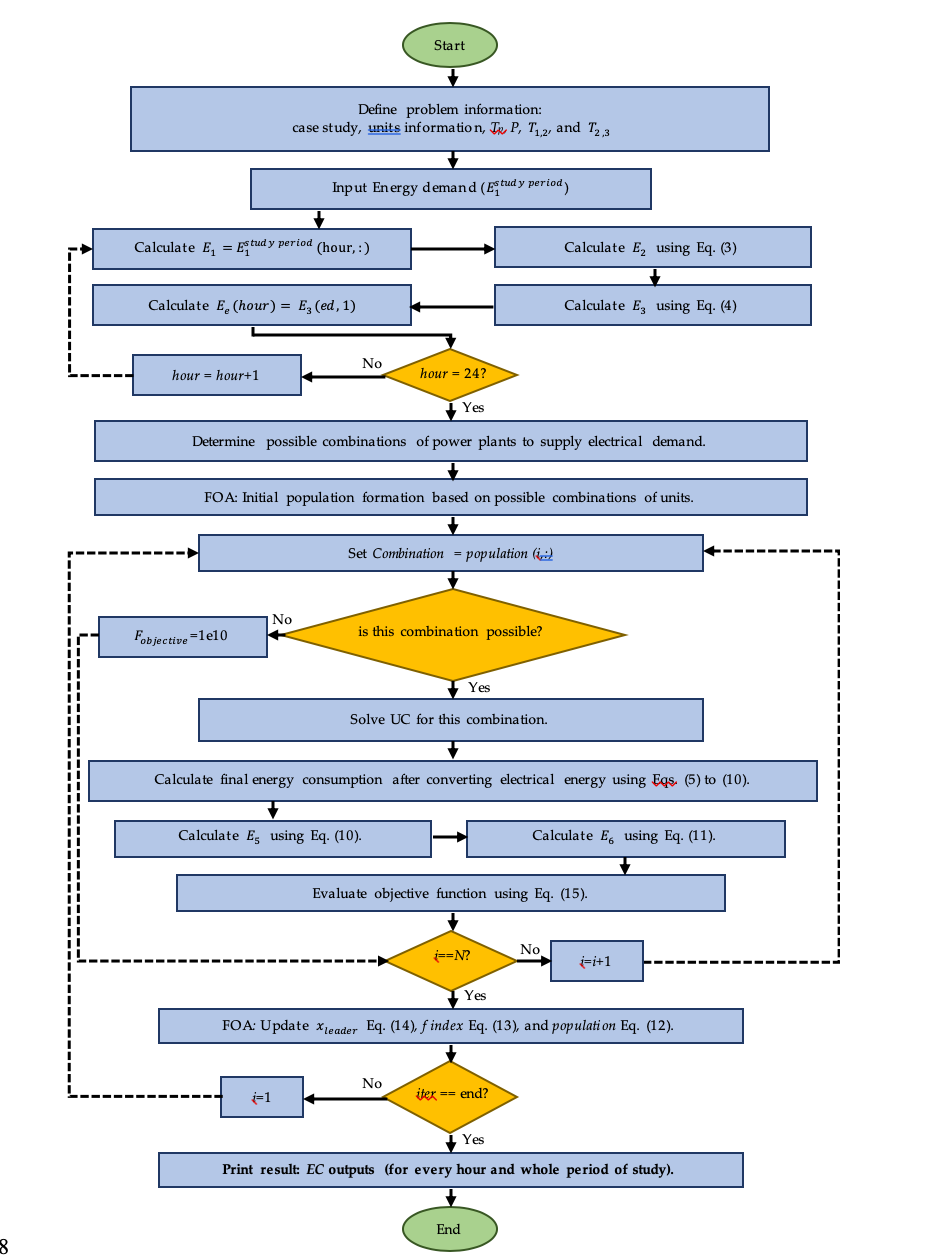
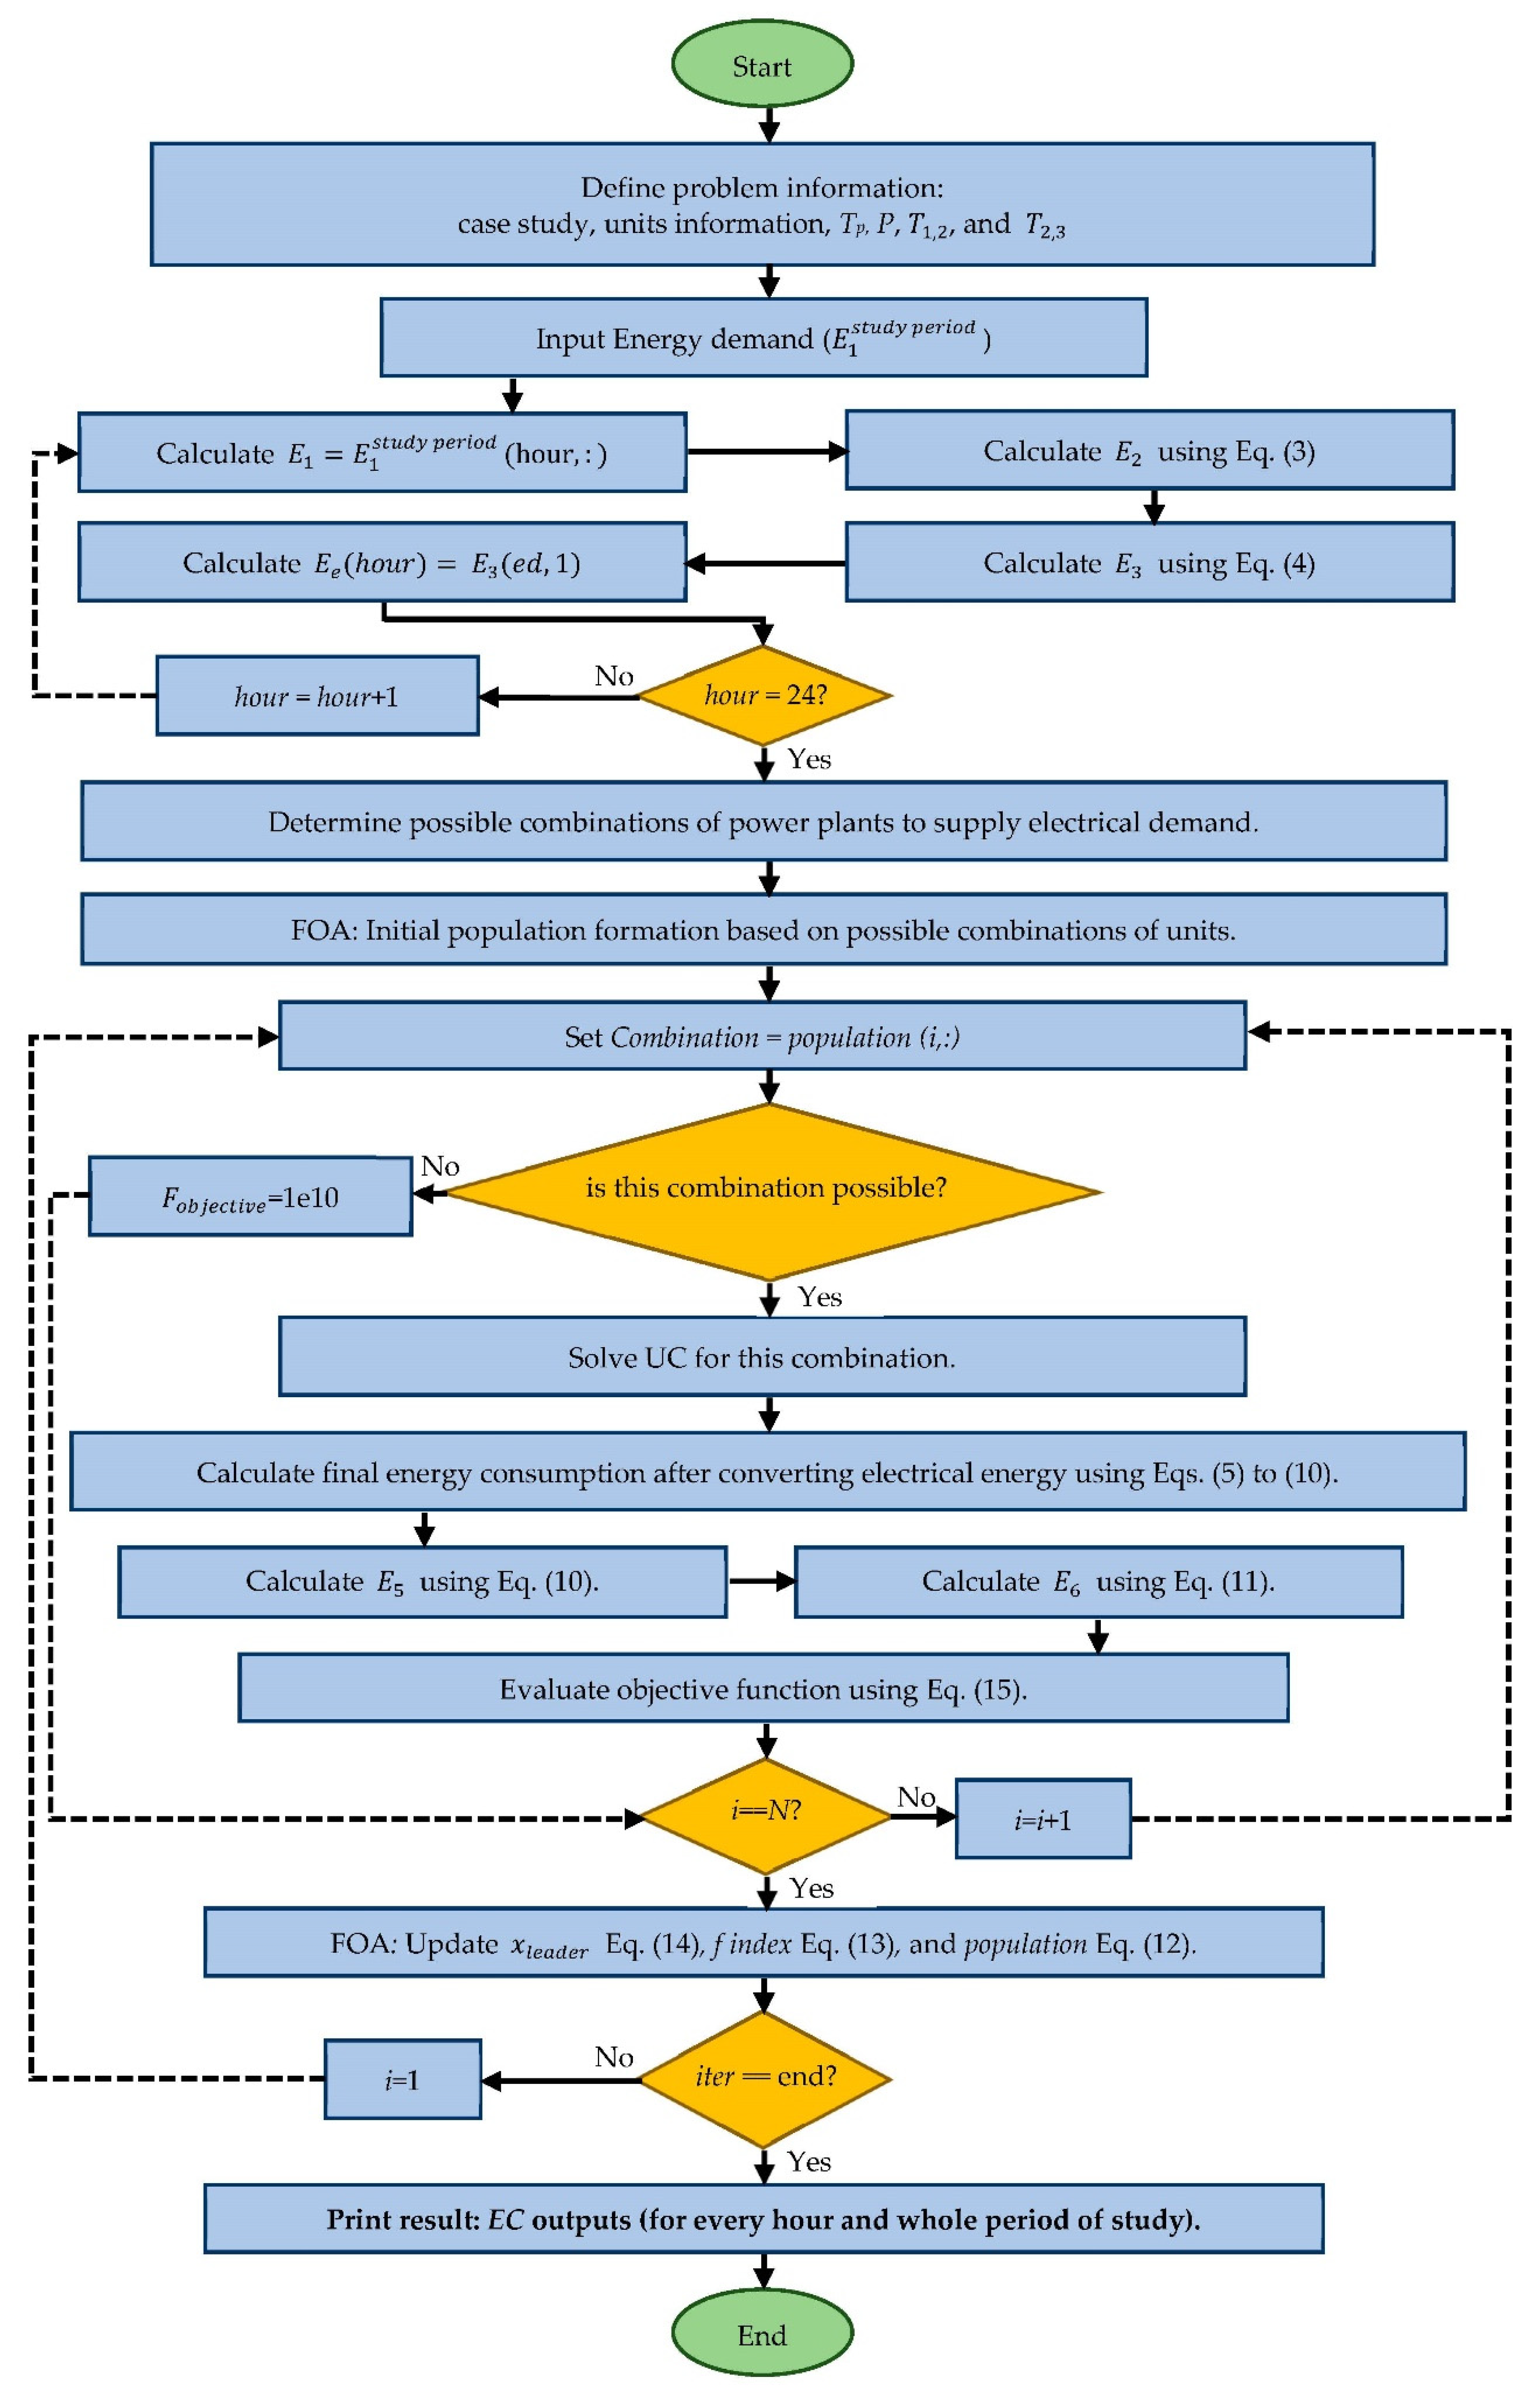
The EC problem in a multi-carrier energy system is proposed to be studied using the Following Optimization Algorithm (FOA). Therefore, the optimal operation of energy carriers can be obtained. The proposed study aims to realize the following:
  • Mathematical modeling and formulation for an EC problem.
  • Objective function is considered as minimizing energy supply costs for the total study period.
  • The FOA is used to solve the EC problem, which is a constrained optimization problem.
  • Study the technical aspect of supply energy demand in various sections (with different types of energy carriers).
  • Applying the proposed study to a standard energy grid that includes different sectors of energy consumption (transportation, agriculture, industrial, residential, commercial, and public).
  • Studying the simulation of refinery and oil-refining process.
  • Studying the impact of import and export of energy carriers on EC.
  • Determining the appropriate pattern for the use of energy carriers to supply energy demand, considering technical and economic constraints.
  • Increasing the awareness of the importance of an EC study to enhance the operation of energy systems.
The introduction and background of the topic are presented in Section 1. The problem definition and problem formulation are described, respectively, in Section 2 and Section 3. Application of the proposed study is investigated and discussed in Section 4, while the conclusions are presented in Section 5.

2. Problem Definition

2.1. Energy Commitment

Researchers have provided valuable studies on energy and energy management [25,26,27,28,29]. A significant issue in energy studies is the operation of energy carriers. The primary energy carriers are those that are directly extracted from natural sources such as crude oil, hard coal, and natural gas. All carriers of energy, not primary but produced from primary energy, are called secondary energy carriers [30]. Table 1 shows an overview of renewable versus non-renewable energy and primary versus secondary energy.
Researchers over time have conducted wide research into the operation of power systems and power supply to consumers. In the unit commitment study, the on or off status of the units and the optimal production of each unit are determined for a specific period of study based on the predicted electric demand. Although resolving the UC provides valuable information, dependencies between energy carriers are not considered.
Therefore, the following can be mentioned:
  • The UC focuses solely on the study of the electrical grid and the supply of electrical demand.
  • In the UC, only the forecast of electricity demand is available.
  • Independent optimization of energy networks does not necessarily lead to the optimization of the entire energy network.
  • In the UC, possible substitutions between energy carriers are not considered.
The study of EC is introduced with the attitude of operation of energy carriers in an integrated energy network, considering the possibility of possible substitutions between energy carriers. In the proposed EC study, instead of forecasting electricity consumption, forecasting energy demand for other energy carriers is also available, and based on this, the optimal operation of energy carriers is presented simultaneously.
EC determines the most appropriate pattern of using energy carriers wherein first technical problems and then economic issues are adequately addressed. If the energy carriers are used according to the peak demand, it will cost a lot. In fact, energy carriers should be optimally utilized, as managing energy resources properly can save a considerable amount of money. In the EC issue, first, the energy demand (actually the energy demand curve) must be determined. This energy demand curve, similar to the UC problem, can be a 24-h curve. In the UC problem, for every hour of the study, there is an electricity demand that must be met by the appropriate combination of units. However, in the EC, for every hour of the study, there is an energy demand of different types, including electricity, gas, car fuel, aircraft fuel, etc., which must be met using the appropriate combination of energy carriers.

2.2. Energy Grid

The EC study should be done in a proper space called the energy grid. The various sectors of the proposed energy grid are transportation, agriculture, industrial, residential, commercial, and public sectors.
In the energy grid, the energy demand is calculated as the sum of the demand in the various subdivisions of the grid using (1):
E C f = E C 1 + E C 2 + + E C N =   i = 1 N E C i
where E C f is the total energy demand, E C i is the energy demand of the i-th sector of the grid, and N is the number of different sectors of the energy grid.
The primary constraint on the EC problem is to supply the total energy demand. The energy consumption in different parts is (2):
E 1 =   [ E C 1   E C 2 E C i   E C N ] T
where E 1 is the energy demand matrix in the various energy sectors. This energy demand can include a variety of energy carriers such as natural gas, electricity, coal, etc. For the energy grid proposed, the energy demand is considered to be as below:
E 1 = [ E C 1 total   energy   demand   in   residential ,   commercial ,   and   public   sector E C 2 total   energy   demand   in   industrial   sector E C 3 total   energy   demand   in   transportation   sector E C 4 total   energy   demand   in   agriculture   sector E C 5 total   energy   demand   in   other   sector E C 6 total   energy   demand   in   non - energy   sector ]

3. Problem Formulation

Energy network matrix modeling is presented. This modeling is performed in several steps, from the lowest energy level (final energy consumption) to the highest energy level (primary energy carriers).
Final energy consumption based on different energy carriers is specified as:
E 2 =   T 1 , 2   ×   E 1
where E 2 is the final energy consumption based on different energy carriers and T 1 , 2 is the transform matrix of different sectors to different energy carriers. The values of T 1 , 2 are determined based on the simulation of experimental and practical data.
Energy loss is modeled using (4).
E 3 =   T 2 , 3   ×   E 2
where E 3 is the final energy consumption based on different energy carriers considering losses and T 2 , 3 is the efficiency matrix. The values of T 2 , 3 are determined based on the simulation of experimental and practical data.
At this stage, the electrical energy is proportioned to the energy carriers. In fact, at this point, the UC problem must be resolved. The electrical energy of different power plants is determined as shown in (5):
E u =   T u   ×   E e
where E u is the electrical energy of different power plants, T u is the separation matrix of electricity generated by various power plants that is calculated based on solving UC, and E e is the total electricity demand.
Input fuel for different power plants is determined by (6):
E e 1 =   T u , f   ×   E u
where E e 1 is the input fuel for different power plants and T u , f is the power plant efficiency matrix.
The source energy carrier for electricity generation is determined using (7).
E e 2 =   T f , c   ×   E e 1
where E e 2 is the source energy carrier for electricity generation and T f , c is the conversion matrix of input fuel to energy carriers.
After the calculation of electrical energy, the final energy consumption is calculated using (8).
E 4 =   E 3 + E e 2 E e
where E 4 is the final energy consumption after converting electrical energy to input carriers to units.
At this stage, the process of refining crude oil is simulated using (9).
E p 1 =   T p   ×   E p
where E p 1 represents the energy carriers produced by refining, T p is the separation matrix of products created from refining crude oil, and E p is the maximum capacity of refineries.
After simulation of the refining crude oil process, the final energy consumption is calculated using (10).
E 5 =   E 4 + E p E p 1
where E 5 is the final energy consumption after refining crude oil. Actually, E 5 determines the energy carriers that supply the energy demand.
Import and export of energy carriers are determined by (11):
E 6 =   E 5 P
where P is the domestic production of energy carriers, and E 6   is the import and/or export of energy carriers. In E 6 , the positive sign means import and negative sign means export of energy carriers.

4. Simulation Studies

Optimization algorithms have the ability to solve complex problems. In this regard, various optimization algorithms have been introduced by researchers [31,32,33,34,35,36,37,38,39,40] and have been applied by scientists in various fields such as energy [41], protection [42], electrical engineering [43,44,45,46], and energy carriers [47,48] to achieve the optimal solution. The EC problem is simulated on an MCE system, and the Following Optimization Algorithm (FOA) [49] as an optimization method is used in the simulations to find the best solution of the EC problem.

4.1. Case Study

The EC problem is tested on an energy grid with 10 generating plants. The final energy consumption for a 24-hour period is presented in Table A8. The transform matrix of different sectors to different energy carriers ( T 1 , 2 ) is specified in Table A9. The energy unit used in this article is Millions of Barrels of Oil Equivalent (MBOE).

4.2. Simulation Studies and Discussion

4.2.1. Electrical Energy

A network with 10 electric power plants is used. Information on these plants is provided in Appendix A. According to Algorithm 1, at each hour of the study, the economic distribution of electrical energy is solved for all possible combinations of power plants.

4.2.2. Following Optimization Algorithm (FOA)

In FOA, [49], which is a swarm-based algorithm, search factors are indeed members of the community that try to improve the community by ‘following’ each other. (12) to (14) are the main equations of the FOA.
x i d = ( 1 f r ) x i , 0 d + f r   x l e a d e r d
f = 1 e x p   ( t 1.5 T )
x l e a d e r = { f o r   m i n i m i z a t i o n   p r o b l e m :   l o c a t i o n   o f   min ( f i t j )           j { 1 : N } f o r   m a x i m i z a t i o n   p r o b l e m : l o c a t i o n   o f   max ( f i t j )           j { 1 : N }
In the above equations, x i , 0 d refers to the initial balance point along with the d dimension of member i, and r represents a random number with a uniform distribution within the [0–1] span used to preserve the search random state. x l e a d e r shows the values of the problem variables for the best member of the community, which is named the leader. Moreover, x l e a d e r d is the d-th dimension of the position of the mentioned leader. Symbol ‘f’ represents the ‘following’ co-efficient, t is the iteration count, T is the maximum number of iterations, and fit is the community fitness vector.

4.2.3. Objective Function and Constraints

The objective function for the EC problem is defined in (15). The constraints on start-up costs and production range of units are specified in (16) and (18), respectively.
F o b j e c t i v e = m i n { t = 1 T [ i = 1 N c c a r r i e r i t × p r i c e i + i = 1 N g S C i t + i = 1 N g C i u i t ]   }
S C i t = { S C i ,     u i t > u i t 1 0 ,     e l s e
P g i m i n P g i P g i m a x
i = 1 N g P g i t = l o a d t
where T is the study period, N c is the number of various carriers, c a r r i e r i t in the need for the i-th carrier at the t-th hour, and p r i c e i is its price, N g is the number of units, S C i t is the start-up cost for the i-th unit in the t-th hour, C i is the fixed cost for the i-th unit and u i t is the status (on or off) of it in the t-th hour, P g i is the production of the i-th unit, and l o a d t is the electricity demand in the t-th hour.
The EC problem solution steps are shown in Algorithm 1. The flowchart of the EC solution method using the FOA algorithm is also shown in Figure 1.
Algorithm 1. EC algorithm.
START EC
1:Problem information.
2:Inputs data: E 1 s t u d y   p e r i o d   , T 1 , 2
3:hour = 1: Study period (24 h)
4: E 1 = E 1 s t u d y   p e r i o d   ( hour , : ) .
5: E 2 Equation (3): E 2 =   T 1 , 2   ×   E 1 # calculate final energy consumption
6: E 3 Equation (4):   E 3 =   T 2 , 3   ×   E 2 # calculate final energy consumption considering losses
7: E e =   E 3 ( e d , 1 ) and e d = row number of electrical demand in E 3 .
8:END hour
9:Determine possible combinations of power plants to supply electrical demand.
10:FOA
11:Initial population formation based on possible combinations of units.
12: ITER = 1:T
13: For i=1:Npopulatio
14: Combination = population (i,:).
15: IF is this combination possible?
16: UC Problem solving.
17: input energy calculation to power plants.
18: END UC solving.
19: E 4 Equation (5):   E u =   T u   ×   E e # calculate final energy consumption after converting electrical energy
Equation (6):   E e 1 =   T u , f   ×   E u
Equation (7):   E e 2 =   T f , c   ×   E e 1
Equation (8):   E 4 =   E 3 + E e 2 E e
20: E p 1 Equation ( 9 ) :   E p 1 =   T p   ×   E p # calculate refining crude oil process
21: E 5 Equation (10): E 5 =   E 4 + E p E p 1 # calculate final energy consumption after refining crude oil
22: E 6 Equation (11): E 6 =   E 5 P # calculate import and export of energy carriers
# calculate objective function
23: F o b j e c t i v e F o b j e c t i v e = m i n { t = 1 T [ i = 1 N c c a r r i e r i t × p r i c e i + i = 1 N g S C i t + i = 1 N g C i u i t ] }
24: Else if the combination is impossible.
25: Fitness = 1e10.
26: END if
27: x l e a d e r Equation (14): l o c a t i o n   o f   min ( f i t j )   j { 1 : N } # update leader
28: f index Equation (13): f = 1 e x p   ( t 1.5 T ) # update ‘following’ co-efficient
29: population Equation (12): x i d = ( 1 f r ) x i , 0 d + f r   x l e a d e r d # update population
30: END FOR
31: END ITER
32:# EC outputs (for every hour and whole period of study).
33: Determining the most appropriate pattern of using energy carriers.
34: Import and export of energy carriers.
35: Cost of energy supply.
36: Convergence curve.
END EC

4.2.4. Results and Finding

The proposed EC operation is simulated on the mentioned energy grid with 10 power plants and energy demand in different sectors of transportation, agriculture, industrial, residential, commercial, and public. The EC problem is coded in MATLAB and executed on a system with a quad-core 3.3 GHz processor and 8 GB of RAM.
Table 2 presents one of the most important outputs of EC i.e., determining the appropriate combination of power plant units to meet the electricity demand. For each hour of operation, different combinations of power plant units are available to meet the electricity demand. However, a combination of units must be chosen that is also economical. According to Table 2, the appropriate combination for the entire 24-h study period is the combination: (2,2,3,3,4,5,6,7,8,9,10,10,9,6,5,5,5,5,7,7,7,3,3,3). The value of the objective function based on this combination is 9.0922 million dollars.
Table 3 presents the need for energy carriers to meet the total energy demand as another important output of EC. In this table, for each hour of operation, the optimal amount of energy carriers is determined, which also includes the losses of the energy network. For example, in the network studied, 104.1298 BOE of liquid gas, 520.0702 BOE of fuel oil, 634.0488 BOE of gas oil, 235.3108 BOE of kerosene, 602.9689 BOE of gasoline, 32.33808 BOE of plane fuel, 2639.622 BOE of natural gas, 16.21232 BOE of coke gas, and 35.83295 BOE coal are needed to meet the energy demand in the first hour of operation.
Moreover, according to domestic production, the results of the import and export of energy carriers are shown in Table 4. According to this table, petroleum (171,897), fuel oil (8857.3), gas oil (1952.09), kerosene (127.814), and coke gas (39.72) are in the export section, and liquid gas (1055.61), gasoline (8777.53), plane fuel (1263.726), natural gas (2964.27), and coal (390.38) are in the import section.
Table 5 presents the optimal combination and amount of production of power plant units for each hour of the study period. In fact, this table contains information about the two important outputs of the energy commitment i.e., ED and UC. ED is to determine the most appropriate production pattern of units according to economic and technical constraints.According to this table, it is clear that the mentioned energy network has the peak of energy demand in the 12th hour of operation. In addition, at the 11th hour of operation, the amount of electricity demand is such that all units are turned on to supply it.
The convergence curve of the performance of FOA in solving the EC problem is shown in Figure 2. This curve is plotted based on the best solution obtained until each iteration in terms of algorithm iteration. As shown in this figure, FOA converged in iteration number 115 and provided the optimal solution of 9.0922 million dollars.
Based on the outputs presented from the implementation of the EC, as well as the mentioned topics, the following findings are identified.
  • EC is a constrained optimization problem that can be solved using various methods, especially optimization algorithms.
  • The goal in EC is determination of the most appropriate pattern of using energy carriers to supply energy demand, wherein first technical problems and then economic issues are adequately addressed.
  • In the EC study, various sectors of energy consumption including transportation, agriculture, industrial, residential, commercial, and public sectors are considered.
  • EC is a more accurate and in-depth study than UC, as UC and ED are part of the outputs of energy commitment.
  • EC study provides more details and information about the grid than UC studies.
  • UC focuses only on the operation of electrical energy demand, while the EC also considers other energy carriers.
  • By implementing the EC on an energy grid, important outputs are obtained, including the need to differentiate energy carriers, ED and UC information, and the import and export of energy carriers.
  • FOA algorithm has a good performance in solving the EC problem by presenting a smooth convergent curve and achieving the optimal solution in the appropriate number of iterations.

5. Conclusions and Future Works

Energy consumption is one of the criteria for determining the level of development and quality of life in a country. The continuity of energy supply and ensuring long-term access to resources have required a comprehensive energy plan. Energy carriers are one of the critical topics in the field of energy operation. Thus, this paper presents a methodology called Energy Commitment (EC) for the optimized operation of energy carriers using the Following Optimization Algorithm (FOA).
The goal in EC is determination of the most appropriate pattern of using energy carriers to supply energy demand considering technical and economic issues. EC is a constrained optimization problem that can be solved using various methods, especially the optimization algorithms. In this paper, the FOA algorithm has been applied to solve the EC problem.
EC has been implemented on an energy grid with 10 power plants and including different consumption sectors of transportation, agriculture, industrial, residential, commercial, and general. Important outputs and information have been obtained by the implementation of an EC study on this energy network. This information and output signify the need for different energy carriers to meet the energy demand, the optimal combination and production of units (UC and EC outputs), and the amount of imports and exports of energy carriers.
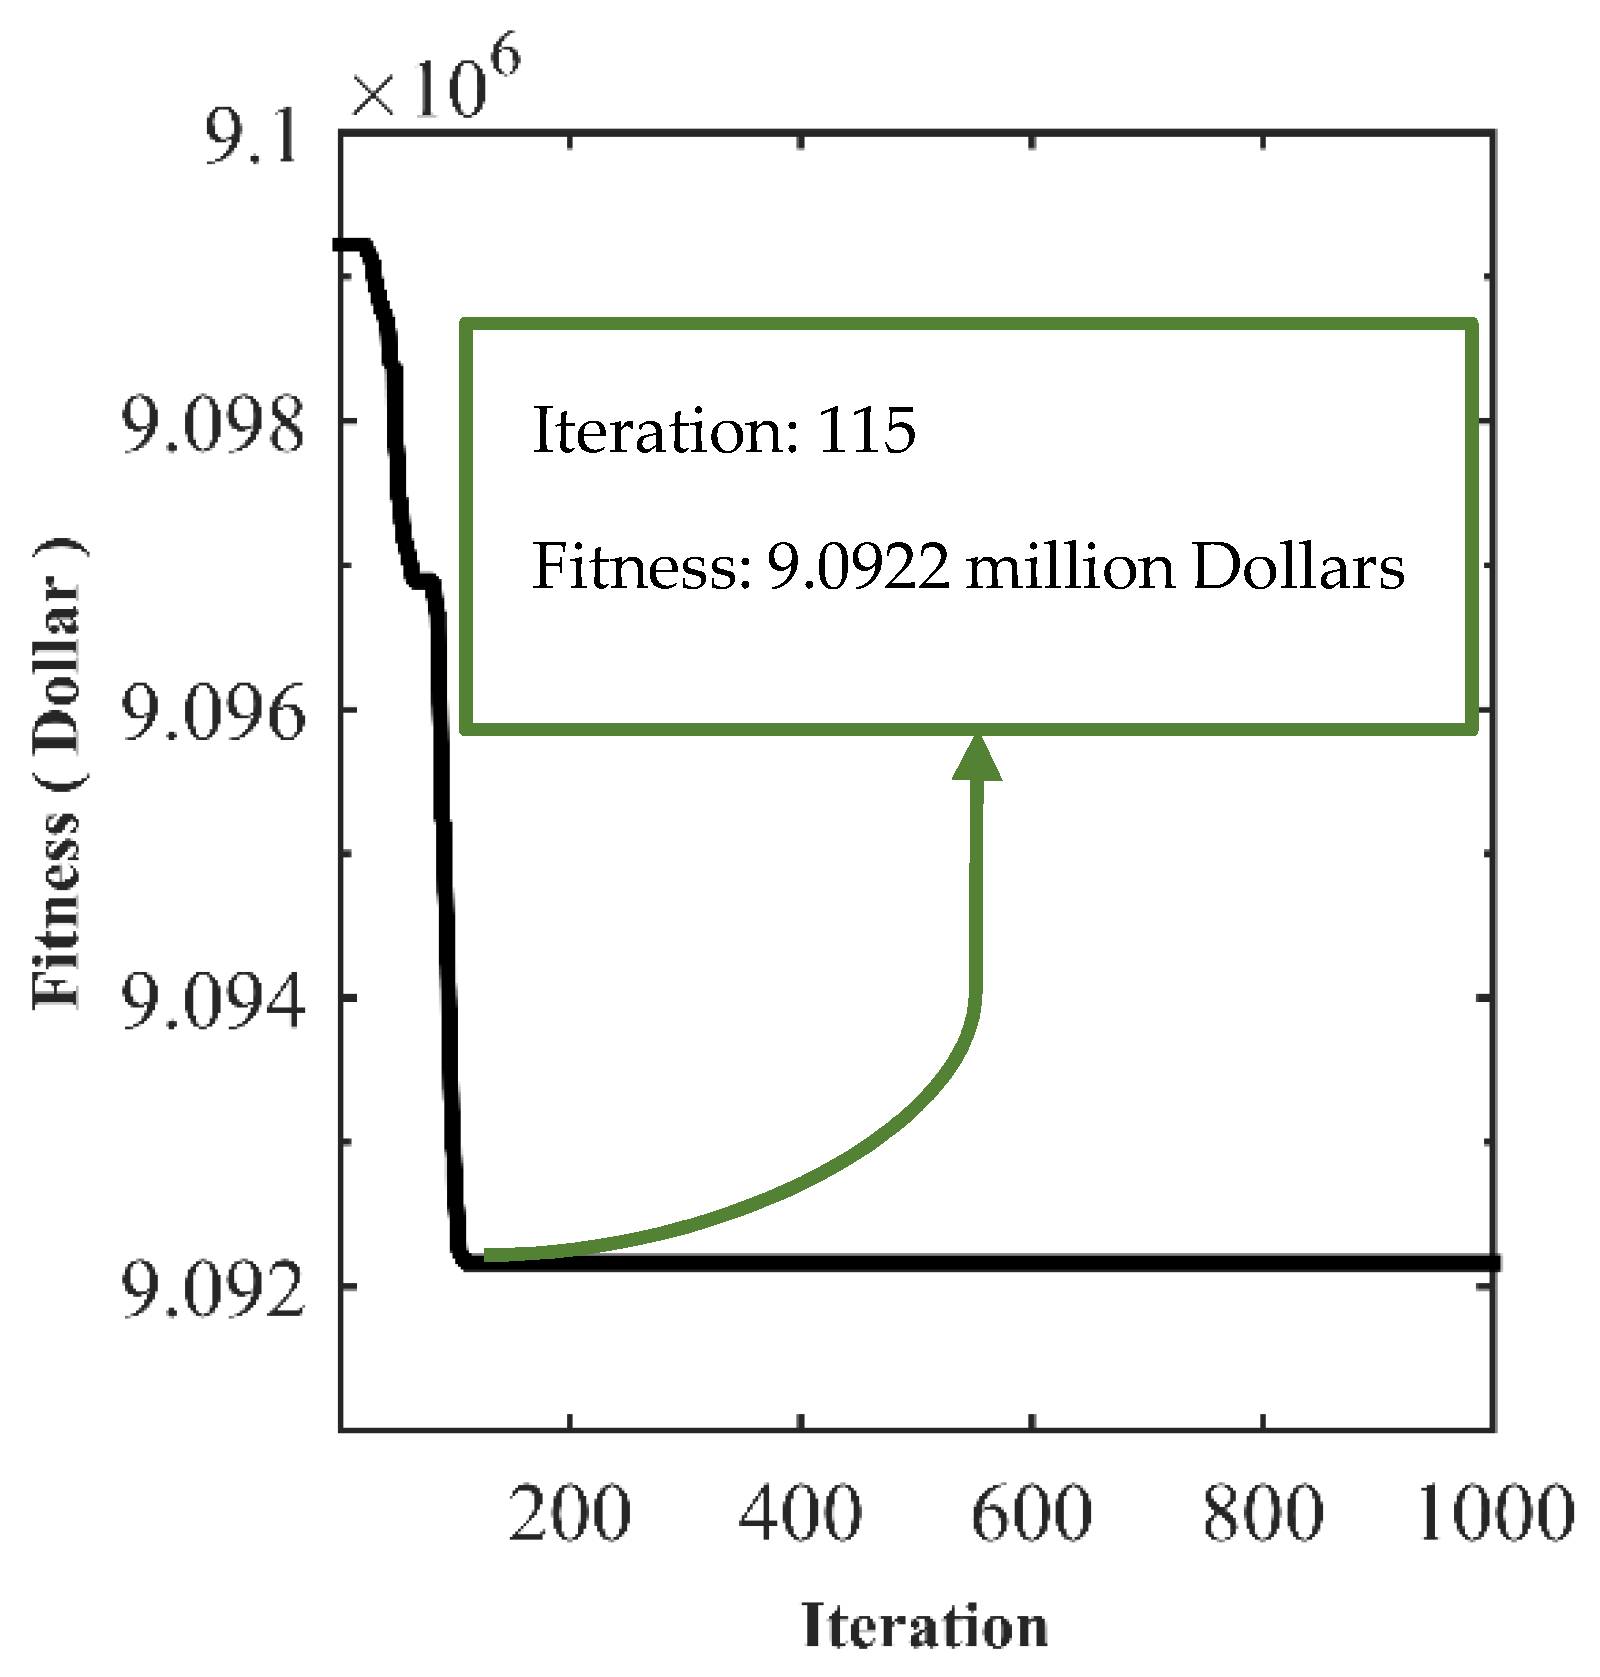
Various combinations of power plants are available to supply the electricity demand for every hour of operation. According to the different fuel inputs to each power plant, different combinations of energy carriers are obtained. The appropriate combination of power plants and proper energy combination carriers to supply the energy consumption has been determined using the FOA. The FOA has a good performance in solving the EC problem by presenting a smooth convergent curve and achieving the optimal solution in the appropriate number of iterations.
The simulation results of the proposed study on the energy grid show that the EC analyzes the energy grid more efficiently and accurately than the UC. UC only studies the electrical energy network, while the EC operates energy carriers in an integrated energy network with energy demand for different energy carriers. Therefore, UC is one of the important outputs of the EC study and in fact, UC is a subset of the EC study.
The authors suggest implementing EC on various energy networks and scenarios, as well as using other optimization techniques for future studies. Ideas for further studies and future research include the introduction of new objective functions with new constraints such as the impact of CO2 and EC solving considering the response time required by each energy storage/carrier.

Author Contributions

Conceptualization, M.D., M.M., R.A.R.-M., R.M.-M., A.A. and J.M.G.; methodology, M.D.; software, M.D.; validation, J.M.G., J.M., R.A.R.-M., R.M.-M., A.A. and O.P.M.; formal analysis, R.M.-M., O.P.M.; investigation, M.D. and O.P.M.; resources, J.M.G.; data curation, A.A.; writing—original draft preparation, M.D. and M.M.; writing—review and editing, O.P.M., R.A.R.-M., R.M.-M., A.A. and J.M.G.; visualization, M.D.; supervision, M.M.; project administration, M.D. and M.M.; funding acquisition, R.A.R.-M., R.M.-M. All authors have read and agreed to the published version of the manuscript.

Funding

The current project was funded by Tecnológico de Monterrey and FEMSA Foundation (grant CAMPUSCITY project).

Conflicts of Interest

The authors declare no conflict of interest. The authors declare that they have no known competing financial interests or personal relationships that could have appeared to influence the work reported in this paper.

Nomenclature

ECEnergy Commitment
EDEconomic Dispatch
UCUnit Commitment
MCEMulti-Carrier Energy
EHEnergy Hub
MBOEMillions of Barrels of Oil Equivalent
E C f Total energy demand
E C i Energy demand of the i-th sector
N Number of different sectors
E 1 Energy demand matrix in the various energy sectors
E C 1 Total   energy   demand   in   residential ,   commercial ,   and   public   sector
E C 2 Total   energy   demand   in   industrial   sector
E C 3 Total   energy   demand   in   transportation   sector
E C 4 Total   energy   demand   in   agriculture   sector
E C 5 Total   energy   demand   in   other   sector
E C 6 Total   energy   demand   in   non energy   sector
E 2 Final energy consumption based on different energy carriers
T 1 , 2 The transform matrix of different sectors to different energy carriers
E 3 Final energy consumption based on different energy carriers considering losses
T 2 , 3 Efficiency matrix
E u Electrical energy of different power plants
T u Separation matrix of electricity generated by various power plants
E e Total electricity demand
E e 1 Input fuel for different power plant
T u , f Power plant efficiency matrix
E e 2 Source energy carrier for electricity generation
T f , c Conversion matrix of input fuel to energy carriers
E 4 Final energy consumption after converting electrical energy to input carriers to units
E p 1 Energy carriers produced by refining
T p Separation matrix of products created from refining crude oil
E p Maximum capacity of refineries
E 5 Final energy consumption after refining crude oil
E 6   Import and/or export of energy carriers
PDomestic production of energy carriers
x i , 0 d Initial balance point along with the d dimension of member i
rRandom number with a uniform distribution within [0,1] span
x l e a d e r Best values of variables
f‘Following’ co-efficient
tIteration count
TMaximum number of iterations
fitCommunity fitness vector
N c Number of various carriers
c a r r i e r i t Need to i-th carrier in t-th hour
p r i c e i Price of i-th carrier
N g Number of units
S C i t Start-up cost for i-th unit in t-th hour
C i Fixed cost for i-th unit
u i t Status (on or off) of i-th unit in t-th hour
P g i Production of i-th unit
l o a d t Electricity demand in t-th hour

Appendix A

Table A1. Unit Information.
RowPower PlantThe Capacity of the Unit (MW)EfficiencyConstant CostPriority
MinMax
1Thermal1504550.36811
2Thermal1504550.34522
3Combined Cycle201300.45533
4Thermal201300.31744
5Gas251620.355
6Combined Cycle20800.4766
7Thermal25850.3577
8Thermal10550.3588
9Combined Cycle10550.599
10Gas10550.251010
Table A2. The time information of units.
RowPower PlantMUTMDTCold StartInitial Conditions
1Thermal8858
2Thermal8858
3Combined Cycle554−5
4Thermal554−5
5Gas664−6
6Combined Cycle332−3
7Thermal332−3
8Thermal110−1
9Combined Cycle110−1
10Gas110−1
Table A3. Startup cost (US dollar).
RowPower PlantHot startCold Start
1Thermal unit45009000
2Thermal unit500010,000
3Combined Cycle unit5501100
4Thermal unit5601120
5Gas unit9001800
6Combined Cycle unit170340
7Thermal unit260520
8Thermal unit3060
9Combined Cycle unit3060
10Gas unit3060
Table A4. Matrix Tp.
Petroleum0
liquid gas0.032
Fuel oil0.293
Gas oil0.293
Kerosene0.099
Gasoline0.157
plane fuel0
Other products0.058
natural gas0
Coke gas0
Coal0
Non-commercial fuels0
Electricity(power)0
Table A5. Conversion matrix input energy to fuel power plants.
Power PlantThermal UnitCombined Cycle UnitGas Unit
Fuel oil0.25400
Gas oil0.0030.0820.166
natural gas0.7430.9180.834
Table A6. Domestic supplies of energy carriers.
RowEnergy CarrierEnergy (boe)
1Petroleum11,086
2liquid gas0
3Fuel oil0
4Gas oil0
5Kerosene0
6Gasoline0
7plane fuel0
8Other products0
9natural gas42,461
10Coke gas28.0532
11Coal42.0799
12Non-commercial fuels169.6553
13Electricity(power)0
Table A7. Heating value [47] and energy rates [48].
Energy CarrierHeating ValueEnergy Rates
Petroleum38.5 MJ Lit 48 dollar/boe
liquid gas46.15 MJ Kg 374 dollar/tone
Fuel oil42.18 MJ Kg 180 dollar/tone
Gas oil43.38 MJ Kg 350 dollar/tone
Kerosene43.32 MJ Kg 500 dollar/tone
Gasoline44.75 MJ Kg 450 dollar/tone
plane fuel45.03 MJ Kg 555 dollar/tone
natural gas39 MJ m 3 237 dollar/1e3m3
Coke gas16.9 MJ Kg 157 dollar/tone
coal26.75 MJ Kg 61 dollar/tone
Table A8. Final energy consumption (BOE).
Hour12345678
Residential, commercial, and public1640.431757.6031991.952226.2972343.4712577.8182694.9922812.165
Industrial772.0152827.1591937.4471047.7351102.8791213.1671268.3111323.455
Transportation1043.1641117.6761266.6991415.7231490.2341639.2581713.7691788.281
Agriculture137.0101146.7966166.3694185.9423195.7288215.3016225.0881234.8745
Other10.2552510.9877712.452813.9178414.6503616.1153916.8479117.58043
Non-energy349.9091374.9026424.8896474.8766499.8702549.8572574.8507599.8442
Hour910111213141516
Residential, commercial, and public3046.5123398.0333632.383878.4443515.2063280.8592812.1652460.645
Industrial1433.7421599.1741709.4621825.2641654.3181544.031323.4551158.023
Transportation1937.3052160.842309.8632466.3382235.3512086.3281788.2811564.746
Agriculture254.4474283.8067303.3796323.9311293.5931274.0203234.8745205.5152
Other19.0454621.2430222.7080524.2463421.9755320.510517.5804315.38287
Non-energy649.8312724.8117774.7987827.2851749.8052699.8182599.8442524.8637
Hour1718192021222324
Residential, commercial, and public2343.4712812.1653280.8593046.5122577.8182109.1241991.951874.777
Industrial1102.8791323.4551544.031433.7421213.167992.5909937.447882.3031
Transportation1490.2341788.2812086.3281937.3051639.2581341.2111266.6991192.187
Agriculture195.7288234.8745274.0203254.4474215.3016176.1559166.3694156.583
Other14.6503617.5804320.510519.0454616.1153913.1853212.452811.72028
Non-energy499.8702599.8442699.8182649.8312549.8572449.8831424.8896399.8961
Table A9. T 1 , 2 Matrix.
Residential, Commercial and PublicIndustrialTransportationAgricultureOtherNon-Energy
Petroleum000000
Liquid gas0.0510.0130.01000
Fuel oil0.0230.2120.014000
Gas oil0.0550.0870.3630.68900
Kerosene0.1410.00200.01800
Gasoline0.0020.0020.5730.00300
Plane fuel000.031000
Other products000000.402
Natural gas0.5640.5210.007000.497
Coke gas00.0210000
Coal0.000300000.101
Non-commercial fuels0.06400000
Electricity (power)0.1020.1420.00040.2910
Table A10. Matrix T23.
Petroleum1000000000000
Liquid gas0100000000000
Fuel oil0010000000000
Gas oil0001000000000
Kerosene0000100000000
Gasoline0000010000000
Plane fuel0000001000000
Other products0000000100000
Natural gas000000001.16010000
Coke gas0000000001000
Coal0000000000100
Non-commercial fuels0000000000010
Electricity (power)0000000000001.3158

References

  1. Montazeri, Z.; Niknam, T. Optimal Utilization of Electrical Energy from Power Plants Based on Final Energy Consumption Using Gravitational Search Algorithm. Електрoтехніка Електрoмеханіка 2018, 4, 70–73. [Google Scholar] [CrossRef] [Green Version]
  2. Babaei, S.; Zhao, C.; Fan, L. A Data-Driven Model of Virtual Power Plants in Day-Ahead Unit Commitment. IEEE Trans. Power Syst. 2019, 34, 5125–5135. [Google Scholar] [CrossRef]
  3. Xavier, A.S.; Qiu, F.; Wang, F.; Thimmapuram, P.R. Transmission Constraint Filtering in Large-Scale Security-Constrained Unit Commitment. IEEE Trans. Power Syst. 2019, 34, 2457–2460. [Google Scholar] [CrossRef]
  4. Luburić, Z.; Pandžić, H. FACTS Devices and Energy Storage in Unit Commitment. Int. J. Electrical. Power Energy Syst. 2019, 104, 311–325. [Google Scholar] [CrossRef]
  5. Mitani, T.; Aziz, M.; Oda, T.; Uetsuji, A.; Watanabe, Y.; Kashiwagi, T. Annual assessment of large-scale introduction of renewable energy: Modeling of unit commitment schedule for thermal power generators and pumped storages. Energies 2017, 10, 738. [Google Scholar] [CrossRef] [Green Version]
  6. Suazo-Martínez, C.; Pereira-Bonvallet, E.; Palma-Behnke, R. A simulation framework for optimal energy storage sizing. Energies 2014, 7, 3033–3055. [Google Scholar] [CrossRef]
  7. Ju, Y.; Wang, J.; Ge, F.; Lin, Y.; Dong, M.; Li, D.; Shi, K.; Zhang, H. Unit Commitment Accommodating Large Scale Green Power. Appl. Sci. 2019, 9, 1611. [Google Scholar] [CrossRef] [Green Version]
  8. Ting, T.; Rao, M.; Loo, C. A Novel Approach for Unit Commitment Problem via an Effective Hybrid Particle Swarm Optimization. IEEE Trans. Power Syst. 2006, 21, 411–418. [Google Scholar] [CrossRef]
  9. Nemati, M.; Braun, M.; Tenbohlen, S. Optimization of Unit Commitment and Economic Dispatch in Microgrids Based on Genetic Algorithm and Mixed Integer Linear Programming. Appl. Energy 2018, 210, 944–963. [Google Scholar] [CrossRef]
  10. Panwar, L.K.; Reddy, S.; Verma, A.; Panigrahi, B.K.; Kumar, R. Binary Grey Wolf Optimizer for Large Scale Unit Commitment Problem. Swarm Evol. Comput. 2018, 38, 251–266. [Google Scholar] [CrossRef]
  11. Reddy, K.S.; Panwar, L.; Panigrahi, B.; Kumar, R. Binary Whale Optimization Algorithm: A New Metaheuristic Approach for Profit-Based Unit Commitment Problems in Competitive Electricity Markets. Eng. Optim. 2019, 51, 369–389. [Google Scholar] [CrossRef]
  12. Simopoulos, D.N.; Kavatza, S.D.; Vournas, C.D. Reliability Constrained Unit Commitment Using Simulated Annealing. IEEE Trans. Power Syst. 2006, 21, 1699–1706. [Google Scholar] [CrossRef]
  13. Ebrahimi, J.; Hosseinian, S.H.; Gharehpetian, G.B. Unit Commitment Problem Solution Using Shuffled Frog Leaping Algorithm. IEEE Trans. Power Syst. 2011, 26, 573–581. [Google Scholar] [CrossRef]
  14. Geidl, M.; Andersson, G. Optimal Power Flow of Multiple Energy Carriers. IEEE Trans. Power Syst. 2007, 22, 145–155. [Google Scholar] [CrossRef]
  15. Solanki, B.V.; Raghurajan, A.; Bhattacharya, K.; Cañizares, C.A. Including Smart Loads for Optimal Demand Response in Integrated Energy Management Systems for Isolated Microgrids. IEEE Trans. Smart Grid 2015, 8, 1739–1748. [Google Scholar] [CrossRef]
  16. Pazouki, S.; Haghifam, M.-R. Comparison between Demand Response Programs in Multiple Carrier Energy Infrastructures in Presence of Wind and Energy Storage Technologies. In Proceedings of the 2014 Smart Grid Conf (SGC), Tehran, Iran, 9–10 December 2014; pp. 1–6. [Google Scholar]
  17. Shabanpour-Haghighi, A.; Seifi, A.R.; Niknam, T. A Modified Teaching–Learning Based Optimization for Multi-Objective Optimal Power Flow Problem. Energy Convers. Manag. 2014, 77, 597–607. [Google Scholar] [CrossRef]
  18. Sadeghi, H.; Rashidinejad, M.; Moeini-Aghtaie, M.; Abdollahi, A. The Energy Hub: An Extensive Survey on the State-of-the-Art. Appl. Therm. Eng. 2019, 161, 114071. [Google Scholar] [CrossRef]
  19. Biglia, A.; Caredda, F.V.; Fabrizio, E.; Filippi, M.; Mandas, N. Technical-Economic Feasibility of CHP Systems in Large Hospitals through the Energy Hub Method: The Case of Cagliari AOB. Energy Build. 2017, 147, 101–112. [Google Scholar] [CrossRef]
  20. Ma, T.; Wu, J.; Hao, L. Energy Flow Modeling and Optimal Operation Analysis of the Micro Energy Grid Based on Energy HUB. Energy Convers. Manag. 2017, 133, 292–306. [Google Scholar] [CrossRef]
  21. Huo, D.; Le Blond, S.; Gu, C.; Wei, W.; Yu, D. Optimal Operation of Interconnected Energy Hubs by Using Decomposed Hybrid Particle Swarm and Interior-Point Approach. Int. J. Electr. Power Energy Syst. 2018, 95, 36–46. [Google Scholar] [CrossRef]
  22. Asl, D.K.; Hamedi, A.; Seifi, A.R. Planning, Operation and Flexibility Contribution of Multi-Carrier Energy Storage Systems in Integrated Energy Systems. IET Renew. Power Gener. 2019, 14, 408–416. [Google Scholar]
  23. Shahmohammadi, A.; Moradi-Dalvand, M.; Ghasemi, H.; Ghazizadeh, M. Optimal Design of Multicarrier Energy Systems Considering Reliability Constraints. IEEE Trans. Power Deliv. 2014, 30, 878–886. [Google Scholar] [CrossRef]
  24. Sheikhi, A.; Bahrami, S.; Ranjbar, A.M. An Autonomous Demand Response Program for Electricity and Natural Gas Networks in Smart Energy HUBs. Energy 2015, 89, 490–499. [Google Scholar] [CrossRef]
  25. Li, J.; Niu, D.; Wu, M.; Wang, Y.; Li, F.; Dong, H. Research on Battery Energy Storage as Backup Power in the Operation Optimization of a Regional Integrated Energy System. Energies 2018, 11, 2990. [Google Scholar] [CrossRef] [Green Version]
  26. Huang, Y.; Yang, K.; Zhang, W.; Lee, K.Y. Hierarchical Energy Management for the Multienergy Carriers System with Different Interest Bodies. Energies 2018, 11, 2834. [Google Scholar] [CrossRef] [Green Version]
  27. Hazem Mohammed, O.; Amirat, Y.; Benbouzid, M. Economical Evaluation and Optimal Energy Management of a Stand-Alone Hybrid Energy System Handling in Genetic Algorithm Strategies. Electronics 2018, 7, 233. [Google Scholar] [CrossRef] [Green Version]
  28. Veras, J.M.; Silva, I.R.S.; Pinheiro, P.R.; Rabêlo, R.A.L.; Veloso, A.F.S.; Borges, F.A.S.; Rodrigues, J.J.P.C. A Multi-Objective Demand Response Optimization Model for Scheduling Loads in a Home Energy Management System. Sensors 2018, 18, 3207. [Google Scholar] [CrossRef] [Green Version]
  29. Jiang, T.; Zhang, C.; Zhu, H.; Gu, J.; Deng, G. Energy-Efficient Scheduling for a Job Shop Using an Improved Whale Optimization Algorithm. Mathematics 2018, 6, 220. [Google Scholar] [CrossRef] [Green Version]
  30. IEA. Energy Statistics Manual; OECD Publishing: Paris, France, 2004.
  31. Dehghani, M.; Montazeri, Z.; Dehghani, A.; Seifi, A. Spring Search Algorithm: A New Meta-Heuristic Optimization Algorithm Inspired by Hooke’s Law. In Proceedings of the 2017 IEEE 4th International Conference on Knowledge-Based Engineering and Innovation (KBEI), Tehran, Iran, 22 December 2017; pp. 0210–0214. [Google Scholar]
  32. Dehghani, M.; Montazeri, Z.; Dehghani, A.; Nouri, N.; Seifi, A. BSSA: Binary Spring Search Algorithm. In Proceedings of the 2017 IEEE 4th International Conference on Knowledge-Based Engineering and Innovation (KBEI), Tehran, Iran, 22 December 2017; pp. 0220–0224. [Google Scholar]
  33. Dehghani, M.; Montazeri, Z.; Malik, O.P.; Ehsanifar, A.; Dehghani, A. OSA: Orientation Search Algorithm. Int. J. Ind. Electron. Control Optim. 2019, 2, 99–112. [Google Scholar]
  34. Dehghani, M.; Montazeri, Z.; Malik, O.P.; Dhiman, G.; Kumar, V. BOSA: Binary Orientation Search Algorithm. Int. J. Innov. Technol. Explor. Eng. (IJITEE) 2019, 9, 5306–5310. [Google Scholar]
  35. Dehghani, M.; Montazeri, Z.; Malik, O.P. DGO: Dice Game Optimizer. Gazi Univ. J. Sci. 2019, 32, 871–882. [Google Scholar] [CrossRef] [Green Version]
  36. Dehghani, M.; Montazeri, Z.; Dehghani, A.; Malik, O.P. GO: Group Optimization. Gazi Univ. J. Sci. 2020, 33, 381–392. [Google Scholar] [CrossRef]
  37. Mohammad, D.; Zeinab, M.; Malik, O.P.; Givi, H.; Guerrero, J.M. Shell Game Optimization: A Novel Game-Based Algorithm. Int. J. Intell. Eng. Syst. 2020, 13, 10. [Google Scholar]
  38. Dehghani, M.; Montazeri, Z.; Saremi, S.; Dehghani, A.; Malik, O.P.; Al-Haddad, K.; Guerrero, J.M. HOGO: Hide Objects Game Optimization. Int. J. Intell. Eng. Syst. 2020, 13, 10. [Google Scholar]
  39. Dehghani, M.; Mardaneh, M.; Malik, O.P.; NouraeiPour, S.M. DTO: Donkey Theorem Optimization. In Proceedings of the 2019 27th Iranian Conference on Electrical Engineering (ICEE), Yazd, Iran, 30 April–2 May 2019; pp. 1855–1859. [Google Scholar]
  40. Dhiman, G.; Garg, M.; Nagar, A.K.; Kumar, V.; Dehghani, M. A Novel Algorithm for Global Optimization: Rat Swarm Optimizer. J. Ambient Intell. Humaniz. Comput. 2020. Available online: https://hira.hope.ac.uk/id/eprint/3100/ (accessed on 12 August 2020).
  41. Dehghani, M.; Montazeri, Z.; Malik, O. Energy Commitment: A Planning of Energy Carrier Based on Energy Consumption. Электрoтехника Электрoмеханика 2019, 4, 69–72. [Google Scholar] [CrossRef]
  42. Ehsanifar, A.; Dehghani, M.; Allahbakhshi, M. Calculating The Leakage Inductance for Transformer Inter-Turn Fault Detection Using Finite Element Method. In Proceedings of the 2017 Iranian Conference on Electrical Engineering (ICEE), Tehran, Iran, 2–4 May 2017; pp. 1372–1377. [Google Scholar]
  43. Dehghani, M.; Montazeri, Z.; Malik, O. Optimal Sizing and Placement of Capacitor Banks and Distributed Generation in Distribution Systems Using Spring Search Algorithm. Int. J. Emerg. Electr. Power Syst. 2020, 21, 1–7. [Google Scholar] [CrossRef] [Green Version]
  44. Dehghani, M.; Montazeri, Z.; Malik, O.P.; Al-Haddad, K.; Guerrero, J.M.; Dhiman, G. A New Methodology Called Dice Game Optimizer for Capacitor Placement in Distribution Systems. Электрoтехника Электрoмеханика 2020, 1, 61–64. [Google Scholar] [CrossRef] [Green Version]
  45. Dehbozorgi, S.; Ehsanifar, A.; Montazeri, Z.; Dehghani, M.; Seifi, A. Line Loss Reduction and Voltage Profile Improvement in Radial Distribution Networks Using Battery Energy Storage System. In Proceedings of the 2017 IEEE 4th International Conference on Knowledge-Based Engineering and Innovation (KBEI), Tehran, Iran, 22 December 2017; pp. 0215–0219. [Google Scholar]
  46. Dehghani, M.; Mardaneh, M.; Montazeri, Z.; Ehsanifar, A.; Ebadi, M.; Grechko, O. Spring Search Algorithm for Simultaneous Placement of Distributed Generation and Capacitors. Электрoтехника Иэлектрoмеханика 2018, 6, 68–73. [Google Scholar] [CrossRef]
  47. Dehghani, M.; Montazeri, Z.; Ehsanifar, A.; Seifi, A.; Ebadi, M.; Grechko, O. Planning of Energy Carriers Based on Final Energy Consumption Using Dynamic Programming and Particle Swarm Optimization. Электрoтехника Электрoмеханика 2018, 5, 62–71. [Google Scholar] [CrossRef] [Green Version]
  48. Montazeri, Z.; Niknam, T. Energy Carriers Management Based on Energy Consumption. In Proceedings of the 2017 IEEE 4th International Conference on Knowledge-Based Engineering and Innovation (KBEI), Tehran, Iran, 22 December 2017; pp. 0539–0543. [Google Scholar]
  49. Dehghani, M.; Mardaneh, M.; Malik, O. FOA: Following Optimization Algorithm for Solving Power Engineering Optimization Problems. J. Oper. Autom. Power Eng. 2020, 8, 57–64. [Google Scholar]
Figure 1. Energy Commitment (EC) flowchart.
Applsci 10 05862 g001
Figure 2. Convergence curve of Following Optimization Algorithm (FOA).
Applsci 10 05862 g002
Table 1. Terminology for Energy Commodities [30].
PrimarySecondary
Combustible
Non-renewablenuclear
  • Coals
  • Crude oil
  • Liquid Gas
  • Natural gas
  • Oil shale
  • Petroleum products
  • Manufactured solid fuels
  • Gases
Heat and electricity
Renewableheat and non-thermal electricity
  • Biofuels
  • Any fuels derived from renewables
Table 2. The appropriate combination of units and total cost for energy supply.
Hour123456789101112131415161718192021222324Cost (Millions Dollar)
Combination223345678910109655557773339.0922
Table 3. The need for energy carriers (BOE) to supply the energy demand. BOE: Barrels of Oil Equivalent.
Hour12345678
Liquid gas104.1298111.5676126.4433141.3189148.7568163.6325171.0703178.5081
Fuel oil520.0702558.1365625.2257691.7656717.0365755.9679786.1914826.9545
Gas oil634.0488679.3489772.0559864.8909913.36751020.2231067.9491113.281
Kerosene235.3108252.1187285.7345319.3504336.1583369.7741386.582403.3899
Gasoline602.9689646.0381732.1765818.3149861.3841947.5225990.59171033.661
Plane fuel32.3380834.6479539.2676743.887446.1972650.8169953.1268555.43671
Natural gas2639.6222830.8533211.6443592.3343783.394181.0174377.4974576.617
Coke gas16.2123217.3703419.6863922.0024323.1604625.476526.6345227.79255
Coal35.8329538.3924543.5114448.6304351.1899356.3089258.8684261.42791
hour910111213141516
Liquid gas193.3838215.6973230.573246.1925223.1352208.2595178.5081156.1946
Fuel oil881.7413928.02731002.5761044.985966.8135894.5986832.8839732.4652
Gas oil1224.6971402.6971497.3241611.0151448.6531355.621113.497971.3697
Kerosene437.0058487.4295521.0453556.342504.2374470.6216403.3899352.9662
Gasoline1119.7991249.0071335.1451425.5911292.0761205.9381033.661904.4533
Plane fuel60.0564466.9860371.6057576.4564769.2958964.6761755.4367148.50712
Natural gas5002.4895643.056045.2056465.6255843.645444.8864579.1593990.681
Coke gas30.1085933.5826635.8987138.3305534.7406832.4246427.7925524.31848
Coal66.546974.2253979.3443984.7193376.7848971.665961.4279153.74942
hour1718192021222324
Liquid gas148.7568178.5081208.2595193.3838163.6325133.8811126.4433119.0054
Fuel oil717.0365832.8839907.5986876.7413760.8939663.2921625.2257587.1594
Gas oil920.79561113.4971352.6261228.7161019.635817.3559772.0559726.7558
Kerosene336.1583403.3899470.6216437.0058369.7741302.5425285.7345268.9266
Gasoline861.38411033.6611205.9381119.799947.5225775.2457732.1765689.1073
Plane fuel46.1972655.4367164.6761760.0564450.8169941.5775439.2676736.95781
Natural gas3803.6334579.1595447.6765008.3524188.1863402.8753211.6443020.413
Coke gas23.1604627.7925532.4246430.1085925.476520.8444119.6863918.52836
Coal51.1899361.4279171.665966.546956.3089246.0709343.5114440.95194
Table 4. Import and export of carriers (BOE).
HourImportExport
Petroleum0171,897
Liquid gas1055.610
Fuel oil08857.3
Gas oil01952.09
Kerosene0127.814
Gasoline8777.530
Plane fuel1263.7260
Natural gas2964.2690
Coke gas039.7234
Coal390.3840
Table 5. Unit Commitment (UC) result (MW).
Unit 1Unit 2Unit 3HourUnit 4Unit 5Unit 6Unit 7Unit 8Unit 9Unit 10
1455245.895200000000
2455295.959100000000
3455376.087200000000
445545541.214860000000
545545571.278820000000
645545513036.406682500000
745545513066.4706125200000
845545513091.53455252025000
945545513013076.6624320251000
1045545513013016274.854252510100
11455455130130162808534.982131010
124554551301301628085555550.11641
134554551301301628069.9181910100
1445545513013016269.790310000
1545545513013031.5345500000
1645545596.34274202500000
1745545546.2788202500000
1845545513013031.5345500000
1945545513013016244.7903125000
2045545513013086.662432025000
21455455101.406720252025000
22455426.1509200000000
23455376.087200000000
24455326.023200000000

