One-Dimensional Computation Method of Supercritical CO2 Labyrinth Seal

 ,
, 
Abstract
1. Introduction
2. 1-D Computation Method
2.1. Computation Hypotheses
2.1.1. 1-D Flow Hypothesis
2.1.2. Governing Equation
2.2. Computational Process
2.2.1. Isentropic Expansion Process
- The expected mass flow is provided for computation of labyrinth seal performance;
- For the computation site n − 0.5, P (n − 1) has been obtained, and an initial static pressure difference δP is provided. In this case, P (n − 0.5) is determined.
- s(n − 0.5) is obtained from the governing equation s(n − 1) = s(n − 0.5). Using (P, s) to query the National Institute of Standards and Technology (NIST) reference fluid thermodynamic and transport properties database (REFPROP) [19], the thermodynamic states (T, h, p, …) at n − 0.5 can be obtained.
- Based on the total enthalpy conservation, the unit kinetic energy k(n − 0.5) at n − 0.5 is computed, and then the flow velocity at n − 0.5 is obtained. The mass flow is computed and compared with the expected mass flow . If is smaller, the static pressure is increased by the pressure difference δP; or if is larger, the provided static is reduced by the pressure difference δP.
- Iteration is performed under the error between and is within the iterative error δ(δ = 0.002 kg/s in this study). End the iteration process and enter the computation process of the computational site n − 0.5 to n.
2.2.2. Isobaric Dissipation Process
2.2.3. Overall Performance Computation of Labyrinth Seal
3. Internal Flow Property of SCO2 Labyrinth Seal
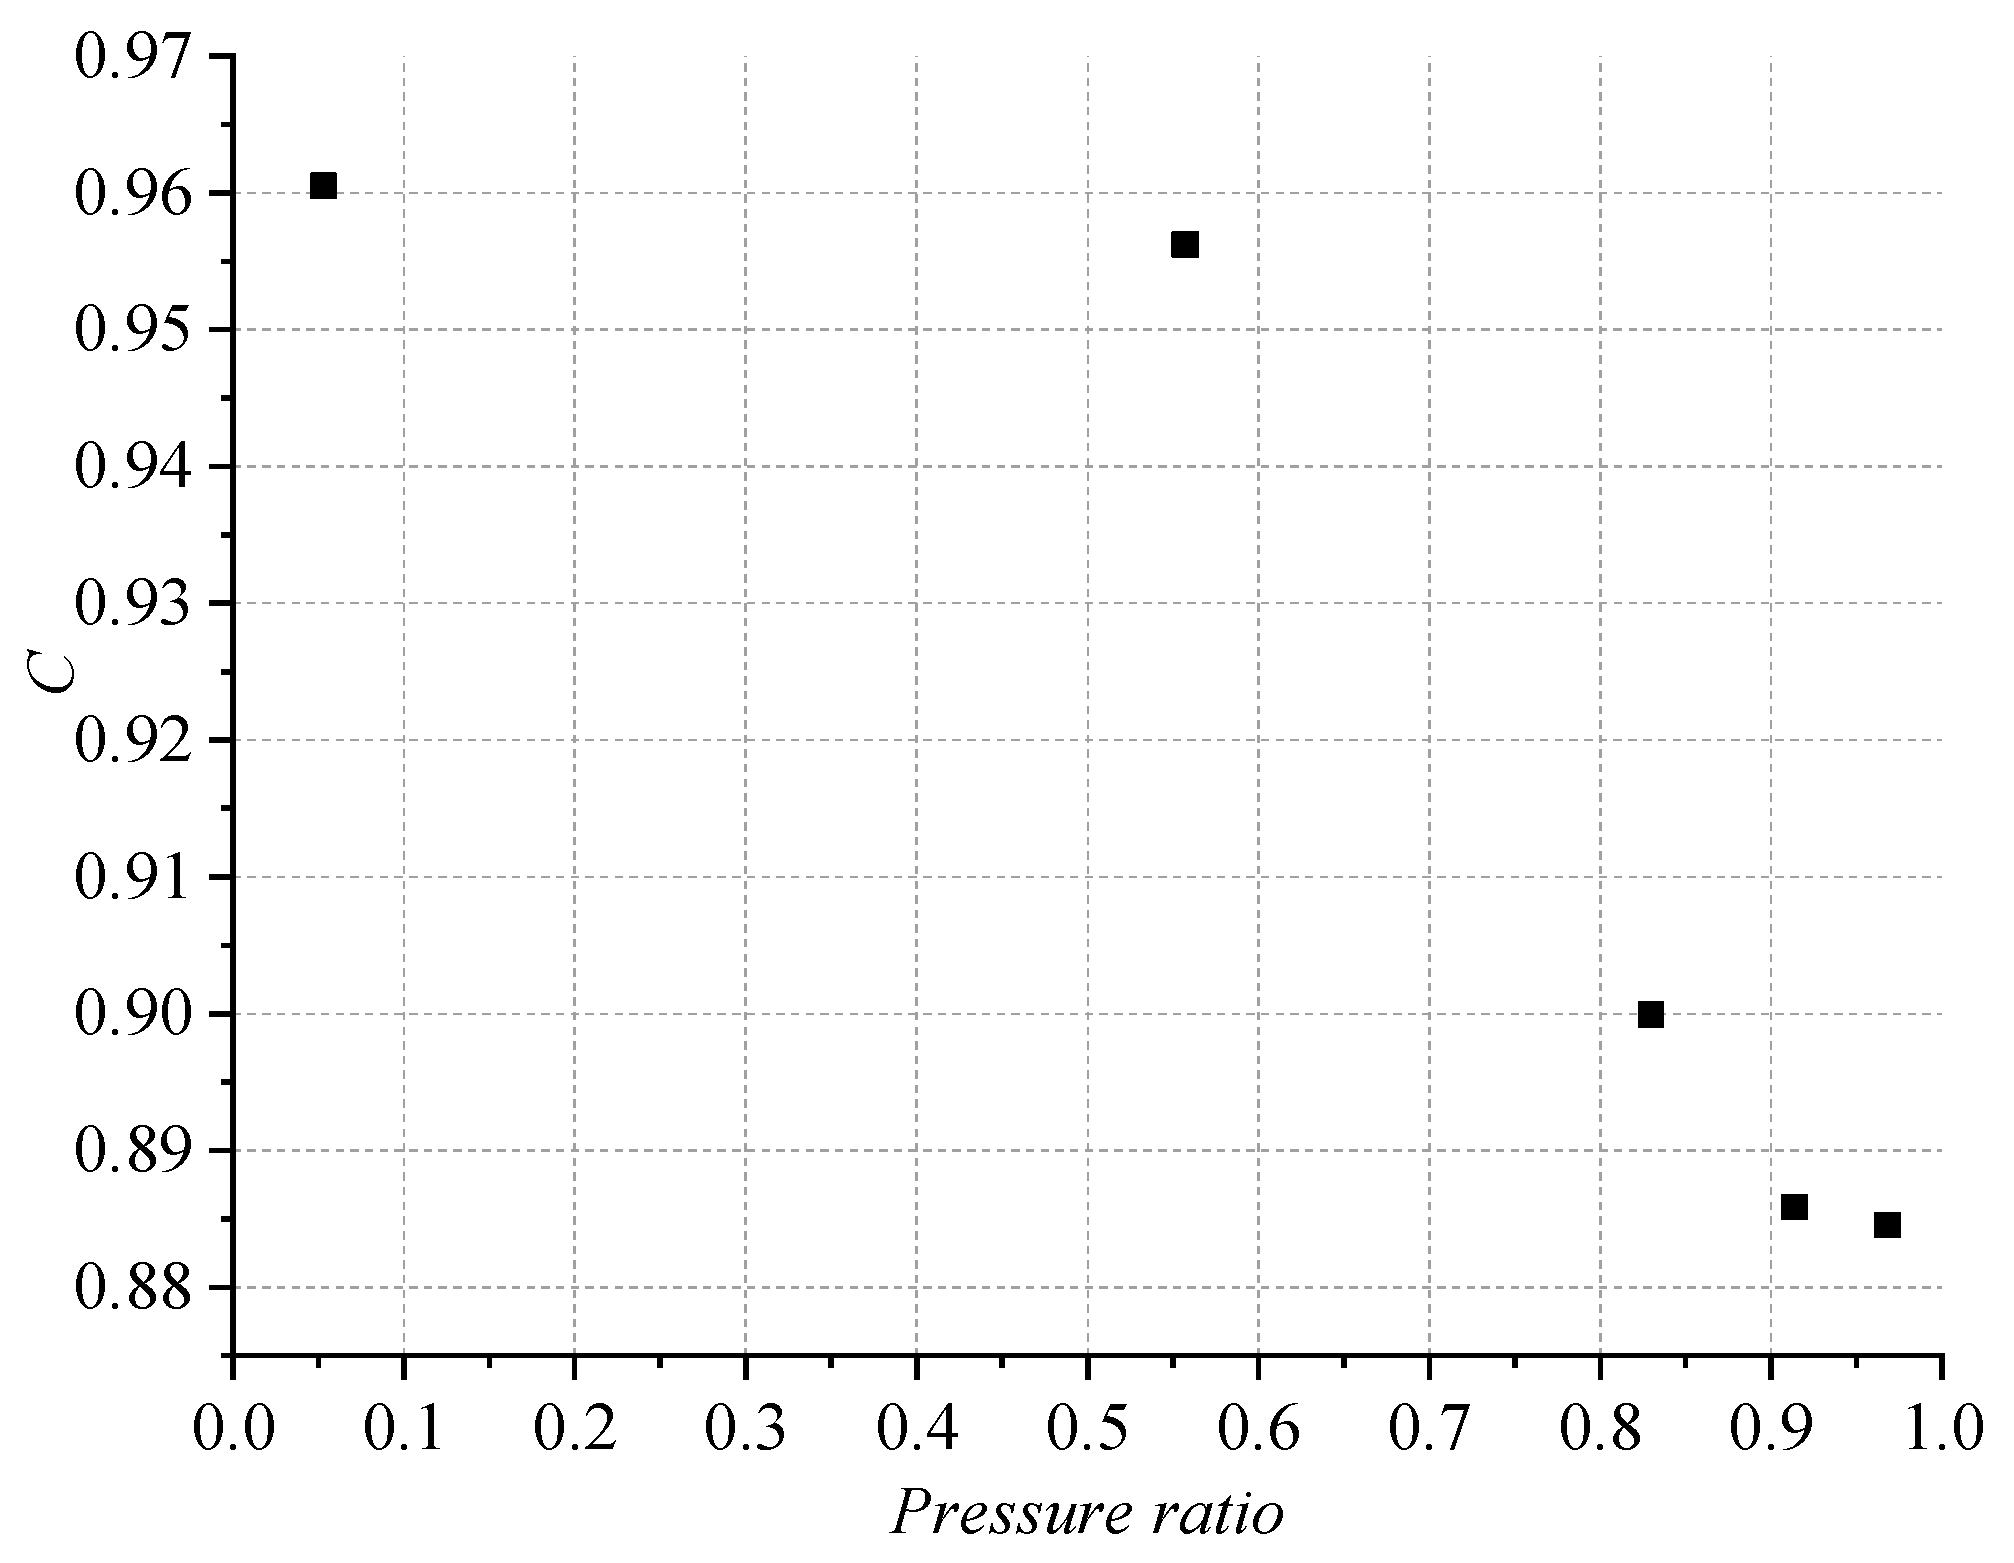
3.1. Flow Discharge Coefficient C of SCO2 Labyrinth Seal
3.1.1. Particularity of Flow Discharge Coefficient in SCO2 Labyrinth Seal
3.1.2. The Correlation of Flow Discharge Coefficient C in SCO2 Labyrinth Seal
3.2. Residual Kinetic Energy Coefficient θ of SCO2 Labyrinth Seal
3.2.1. Particularity of Residual Kinetic Energy Coefficient θ of SCO2 Labyrinth Seal
3.2.2. The Experimental Correlation of Kinetic Residual Coefficient θ
3.3. Two-Phase Critical Flow in SCO2 Labyrinth Seal
4. Results and Discussion
4.1. Verification of 1-D Computation Method
4.1.1. Round Hole Labyrinth Seal
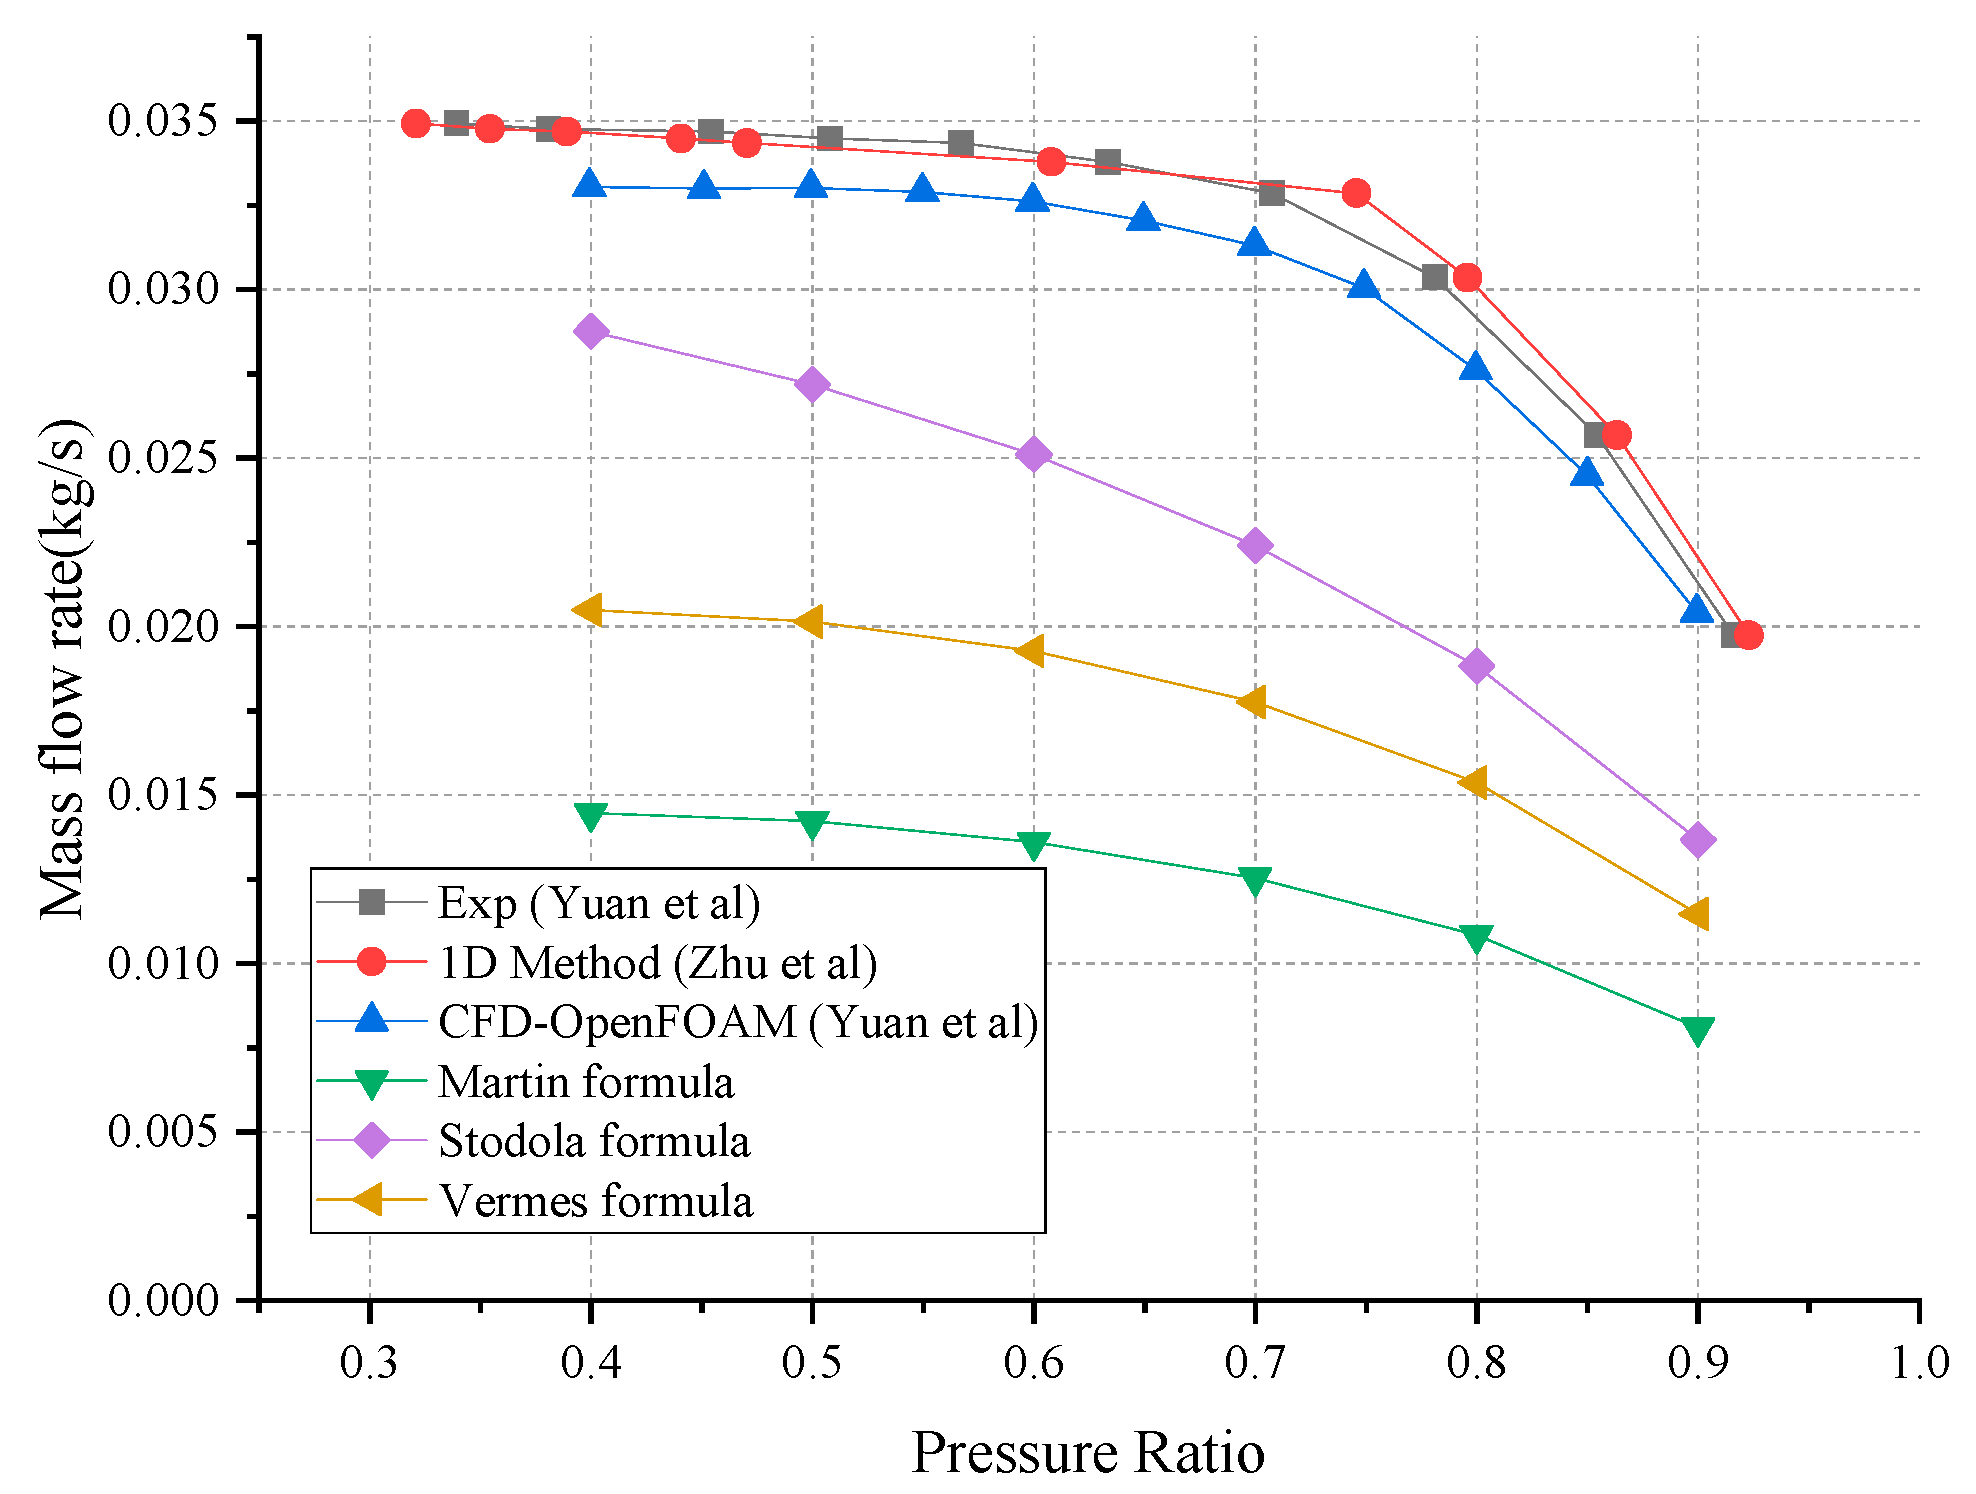
4.1.2. See-through Labyrinth Seal
4.1.3. Stepped-Staggered Labyrinth Seal
4.2. Sealing Efficiency of SCO2 Labyrinth Seal
4.2.1. Effect of Pressure Ratio
4.2.2. Effect of Inlet Condition
4.2.3. Effect of Teeth Number Z
4.2.4. Effect of Labyrinth Seal Type
5. Conclusions
- (a)
- The sealing efficiency increases as the pressure ratio increases and increases slowly when the pressure ratio is far from the critical pressure.
- (b)
- The minimum values of the sealing efficiency exist and are at the inlet temperatures near the pseudo-critical temperature.
- (c)
- As the teeth number continues to increase, the growth rate of the sealing efficiency slows down.
- (d)
- The staggered labyrinth seal has more advantages on the inlet condition of gas-like SCO2 improving the sealing efficiency by 22% compared with the see-through labyrinth seal.
Author Contributions
Funding
Conflicts of Interest
Nomenclature and Units
| Abbreviation | |
| 1-D | one-dimensional |
| CFD | computational fluid dynamics |
| SCO2 | Supercritical CO2 |
| C | flow discharge coefficient |
| Z | teeth number |
| P | pressure, MPa |
| T | temperature, K |
| R | ideal gas constant, J/(mol·kg) |
| G | mass flux, kg/(m2s) |
| mass flow rate, kg/s | |
| h | enthalpy, J/kg the height of sealing chamber, mm |
| s | entropy, kJ/(kg·K) |
| A | cross section area, m2 |
| n | the computational site |
| k | unit kinetic energy, m2/s2 |
| u | flow velocity, m/s |
| l | characteristic length, m |
| w | characteristic length, m |
| c | tooth clearance, m |
| δP | pressure difference, MPa |
| δG | iterative error, kg/s |
| Re | Reynolds number |
| Ma | Mach number |
| Greek symbol | |
| ρ | density kg/m3 |
| μ | dynamic viscosity, Pa∙s |
| θ | residual kinetic energy coefficient |
| ν | specific volume, m3/kg |
| λ | adiabatic exponent |
| γ | carry-over coefficient |
| β | expansion angle, ° |
| η | sealing efficiency, % |
| Subscription | |
| P0 | inlet pressure, MPa |
| Pout | out pressure, Mpa |
| Pc | the critical pressure of flow, Mpa |
| h0 | total enthalpy, kJ/k |
| h00 | inlet total enthalpy, kJ/k |
| inlet mass flow rate, kg/s | |
References
- Brun, K.; Friedman, P.; Dennis, R. Fundamentals and Applications of SCO2 (sCO2) Based Power Cycles; Woodhead Publishing: Cambridge, UK, 2017. [Google Scholar]
- Persichilli, M.; Kacludis, A.; Zdankiewicz, E. Supercritical CO2 Power Cycle Developments and Commercialization: Why sCO2 Can Displace Steam Ste; Power-Gen India & Central Asia: New Delhi, India, 2012. [Google Scholar]
- Dostal, V.; Driscoll, M.J.; Hejzlar, P. A SCO2 Cycle for Next Generation Nuclear Reactors. Ph.D. Thesis, Massachusetts Institute of Technology, Department of Nuclear Engineering, Cambridge, MA, USA, 2004. [Google Scholar]
- Kim, M.S.; Bae, S.J.; Son, S.; Oh, B.S.; Lee, J.I. Study of critical flow for supercritical CO2 seal. Int. J. Heat Mass Transf. 2019, 138, 85–95. [Google Scholar] [CrossRef]
- Yuan, H.; Pidaparti, S.; Wolf, M.; John, E. Numerical modeling of SCO2 flow in see-through labyrinth seals. Nucl. Eng. Des. 2015, 293, 436–446. [Google Scholar] [CrossRef]
- Wright, S.A.; Radel, R.F.; Vernon, M.E.; Rochau, G.E.; Pickard, P.S. Operation and Analysis of a Supercritical CO2 Brayton Cycle; Sandia Report No SAND2010-0171; Sandia National Laboratories: Livermore, CA, USA, 2010. [Google Scholar]
- Zhu, Y.; Jiang, Y.; Liang, S. Numerical study of super-critical carbon dioxide flow in stepped -staggered labyrinth seals. In Proceedings of the 6th International Symposium on Supercritical CO2 Power Cycles, Pittsburgh, PA, USA, 27–29 March 2018. [Google Scholar]
- Zhao, H.; Deng, Q.; Zhang, H.; Feng, Z. The Influence of Tip Clearance on Supercritical CO2 Centrifugal Compressor Performance. In ASME Turbo Expo 2015: Turbine Technical Conference and Exposition; American Society of Mechanical Engineers Digital Collection; American Society of Mechanical Engineers (ASME): New York, NY, USA, 2015. [Google Scholar]
- Parsons, C. Stanley Smith Cook. U.S. Patent 1,374,520, 12 April 1921. [Google Scholar]
- Parsons, C. The labyrinth packing. Engineering 1938, 165, 23–82. [Google Scholar]
- Becker, E. Stromungsvergange in Ringformigen Spalten. VDI 1907, 51, 1133–1141. [Google Scholar]
- Martin, H.M. Labyrinth Packings. Engineering 1908, 85, 35–36. [Google Scholar]
- Stodola, A. Steam and Gas Turbines; McGraw-Hill: New York, NY, USA, 1927; pp. 189–194. [Google Scholar]
- Egli, A. The leakage of Steam through Labyrinth Seals. Trans. ASME 1935, 57, 115–122. [Google Scholar]
- Vermes, G. A fluid mechanics approach to the labyrinth seal leakage problem. J. Eng. Power 1961, 83, 161–169. [Google Scholar] [CrossRef]
- Zhu, G. Analysis of calculational methods on leakage for labyrinth seals. Lubr. Eng. 2006, 31, 123–126. [Google Scholar]
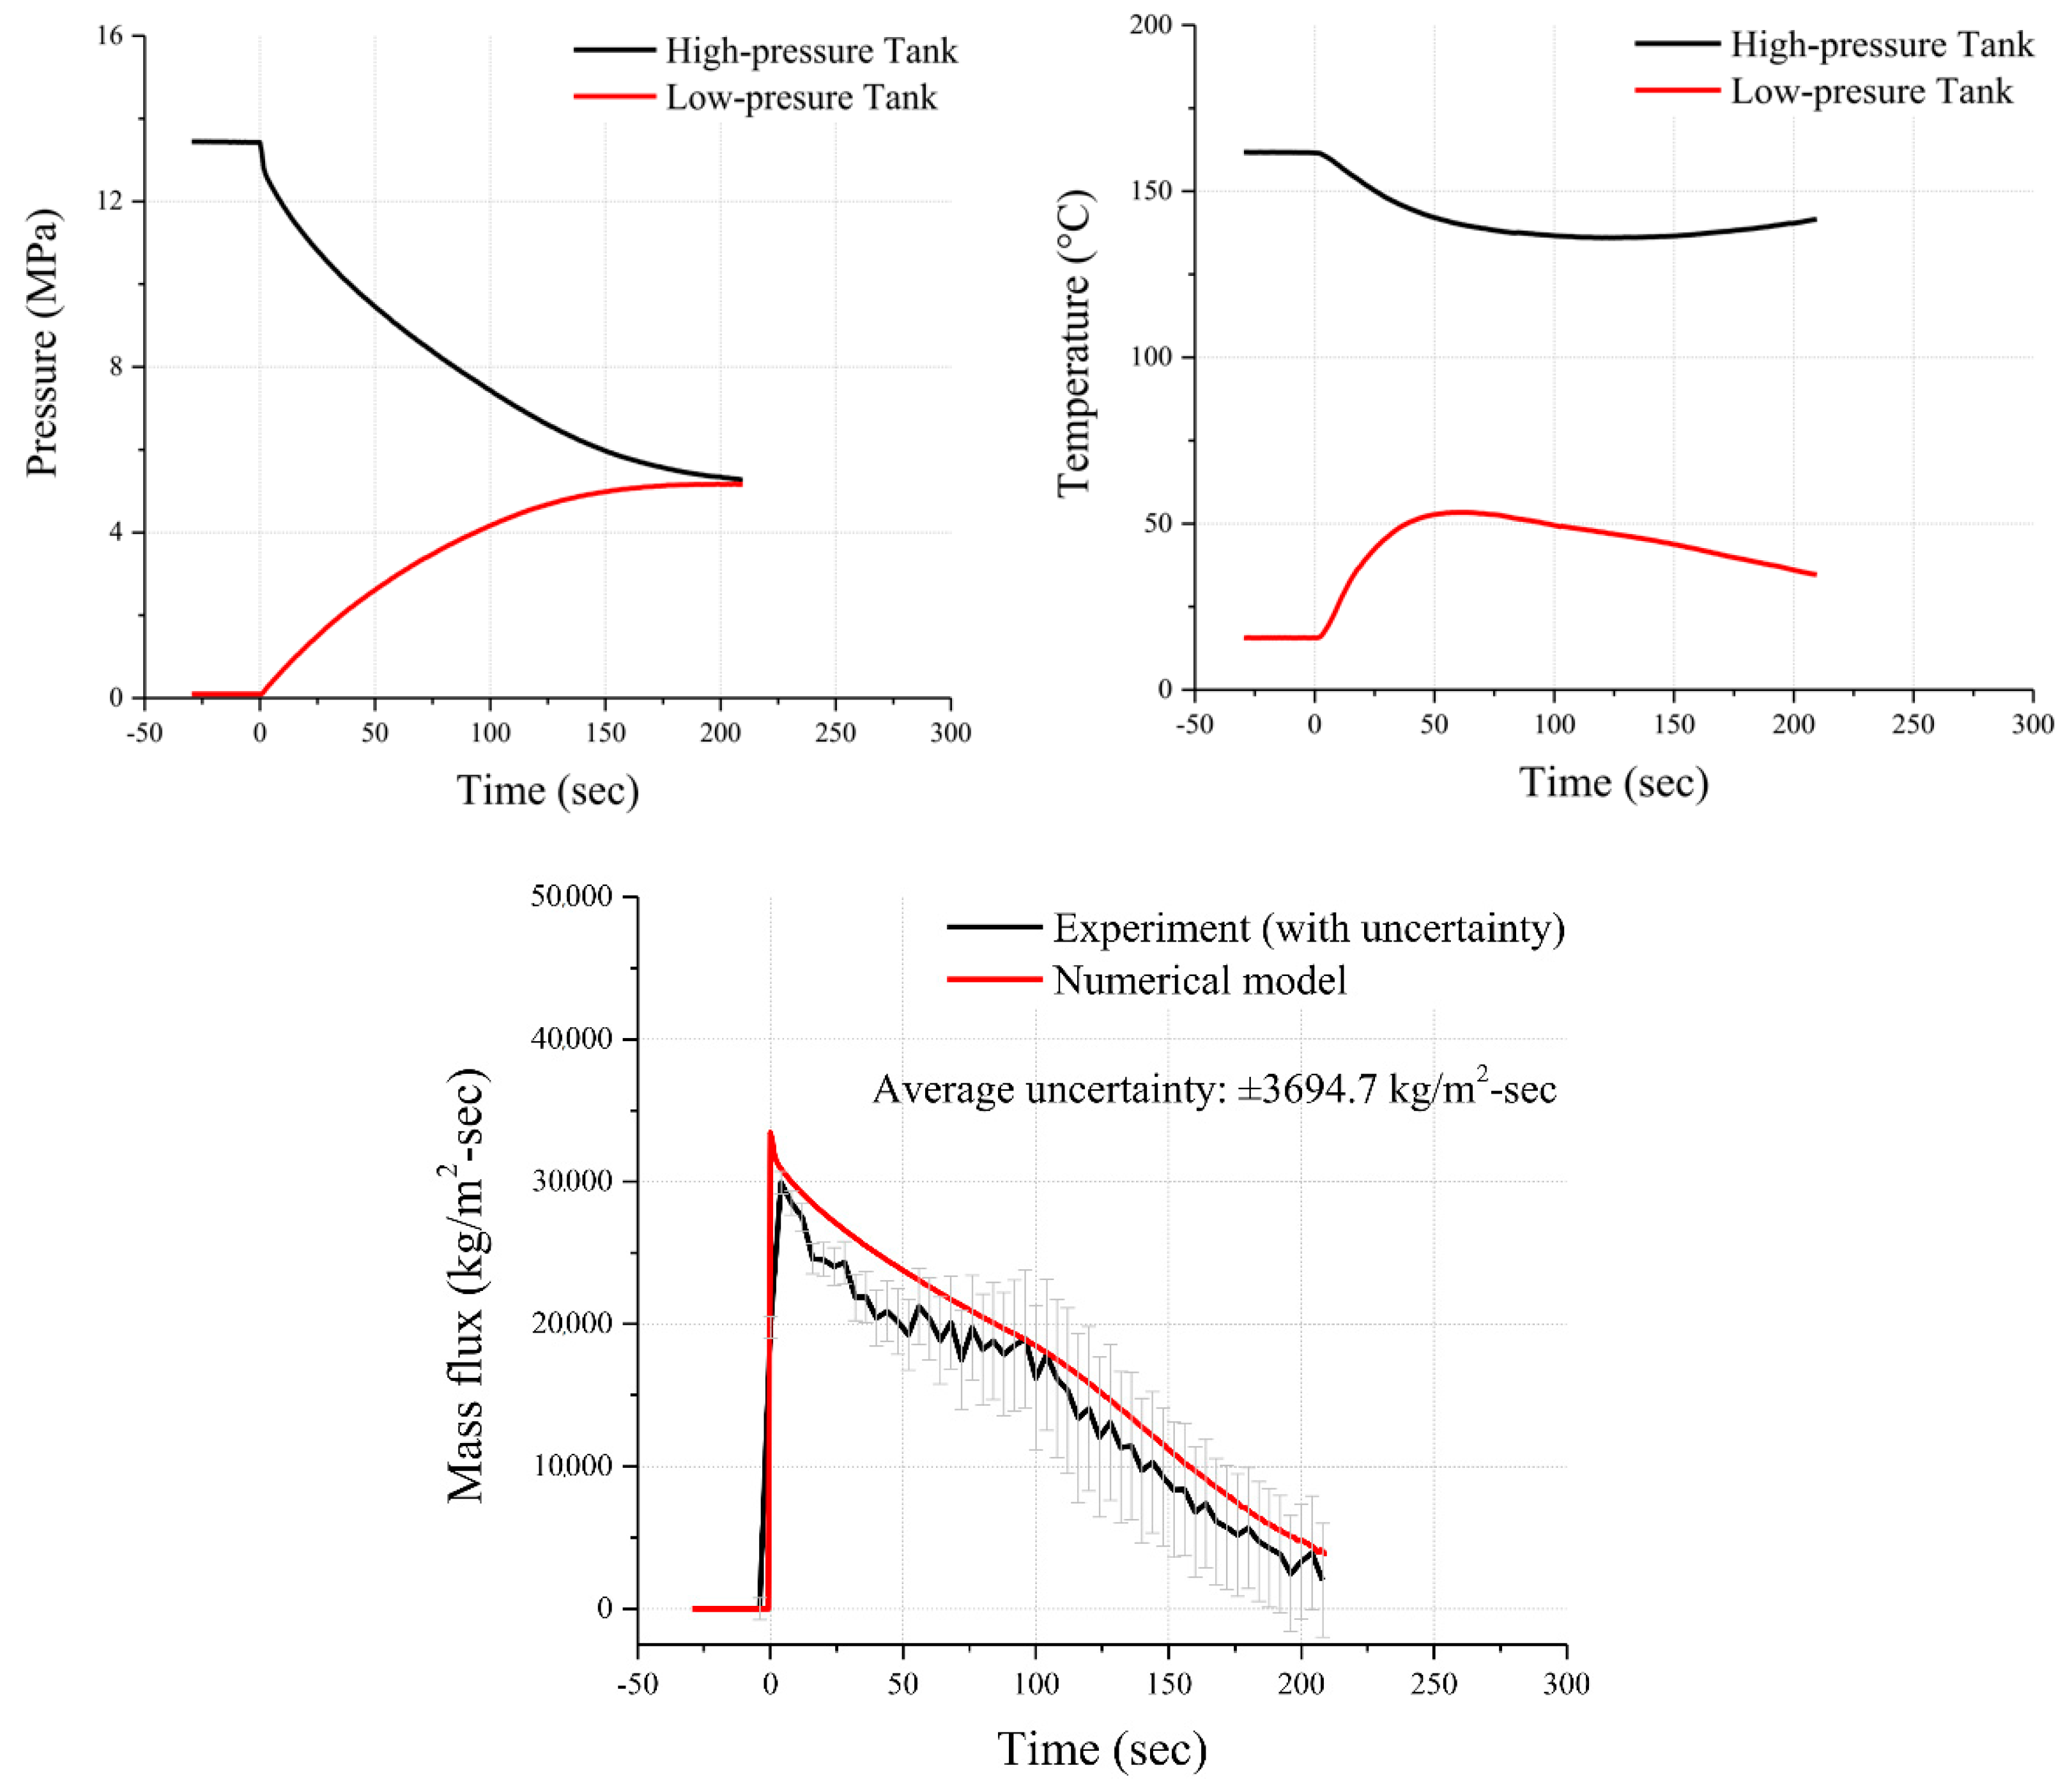
- Fan, X.; Wang, Y.; Zhou, Y.; Chen, J.; Huang, Y.; Wang, J. Experimental study of supercritical CO2 leakage behavior from pressurized vessels. Energy 2018, 150, 342–350. [Google Scholar] [CrossRef]
- Pidaparti, S.R. A Computational Study on the Leakage of Supercritical Carbon Dioxide through Labyrinth Seals. Master’s Thesis, Texas A & M University, College Station, TX, USA, 2013. [Google Scholar]
- Lemmon, E.W.; Huber, M.L.; McLinden, M.O. NIST Standard Reference Database 23: Reference Fluid Thermodynamic and Transport Properties-REFPROP; Version 9.1; Standard Reference Data Program; National Institute of Standards and Technology: Gaithersburg, MD, USA, 2013.
- Suryanarayanan, S.; Morrison, G.L. Labyrinth seal discharge coefficient for rectangular cavities. In ASME 2009 Fluids Engineering Division Summer Meeting; American Society of Mechanical Engineers Digital Collection; American Society of Mechanical Engineers (ASME): New York, NY, USA, 2009; pp. 99–114. [Google Scholar]
- Furuichi, N.; Terao, Y.; Nakao, S.; Fujita, K.; Shibuya, K. Further experiments and investigations for discharge coefficient of ptc 6 flow nozzle in a wide range of reynolds number. J. Eng. Gas Turbines Power 2016, 138, 041605. [Google Scholar] [CrossRef]
- Suryanarayanan, S.; Morrison, G.L. Effect of tooth height, tooth width and shaft diameter on carry-over coefficient of labyrinth seals. In ASME Turbo Expo 2009: Power for Land, Sea, and Air; American Society of Mechanical Engineers Digital Collection; American Society of Mechanical Engineers (ASME): New York, NY, USA, 2009; pp. 1147–1152. [Google Scholar]
- Scherer, T.; Waschka, W.; Wittig, S. Numerical Predictions of High-Speed Rotating Labyrinth Seal Performance: Influence of Rotation on Power Dissipation and Temperature Rise. In International Symposium on Heat Transfer in Turbomachinery; Begel House Inc.: Danbury, CT, USA, 1994. [Google Scholar]
- Paolillo, R.; Moore, S.; Cloud, D.; Glahn, J.A. Impact of Rotational Speed on the Discharge Characteristic of Stepped Labyrinth Seals. In ASME Turbo Expo 2007: Power for Land, Sea, and Air; American Society of Mechanical Engineers (ASME): New York, NY, USA, 2007. [Google Scholar]
- Li, Z.; Li, J.; Yan, X.; Feng, Z. Effects of Pressure Ratio and Rotational Speed on Leakage Flow and Cavity Pressure in the Staggered Labyrinth Seal. J. Eng. Gas Turbines Power Trans. ASME 2011, 133, 114503. [Google Scholar] [CrossRef]
- Waschka, W.; Wittig, S.; Kim, S. Influence of High Rotational Speeds on the Heat Transfer and Discharge Coefficients in Labyrinth Seals. J. Turbomach. 1990, 114, 462–468. [Google Scholar] [CrossRef]


| Inlet Pressure (MPa) | Inlet Temperature (K) | Outlet Pressure (MPa) | |
|---|---|---|---|
| SCO2 | 10 | 320 | 7 |
| Air | 0.143 | 273 | 0.1 |
| u | ρ | μ | c | Re | |
|---|---|---|---|---|---|
| m/s | kg/m3 | 10−5 Pa∙s | mm | - | |
| SCO2 | 90 | 448 | 3.2 | 0.105 | 132,000 |
| Air | 140 | 1.18 | 1.8 | 0.105 | 964 |
| Position I | Position II | Position III | |
|---|---|---|---|
| SCO2 | 0.718 | 0.786 | 0.862 |
| Air | 0.68 | 0.67 | 0.66 |
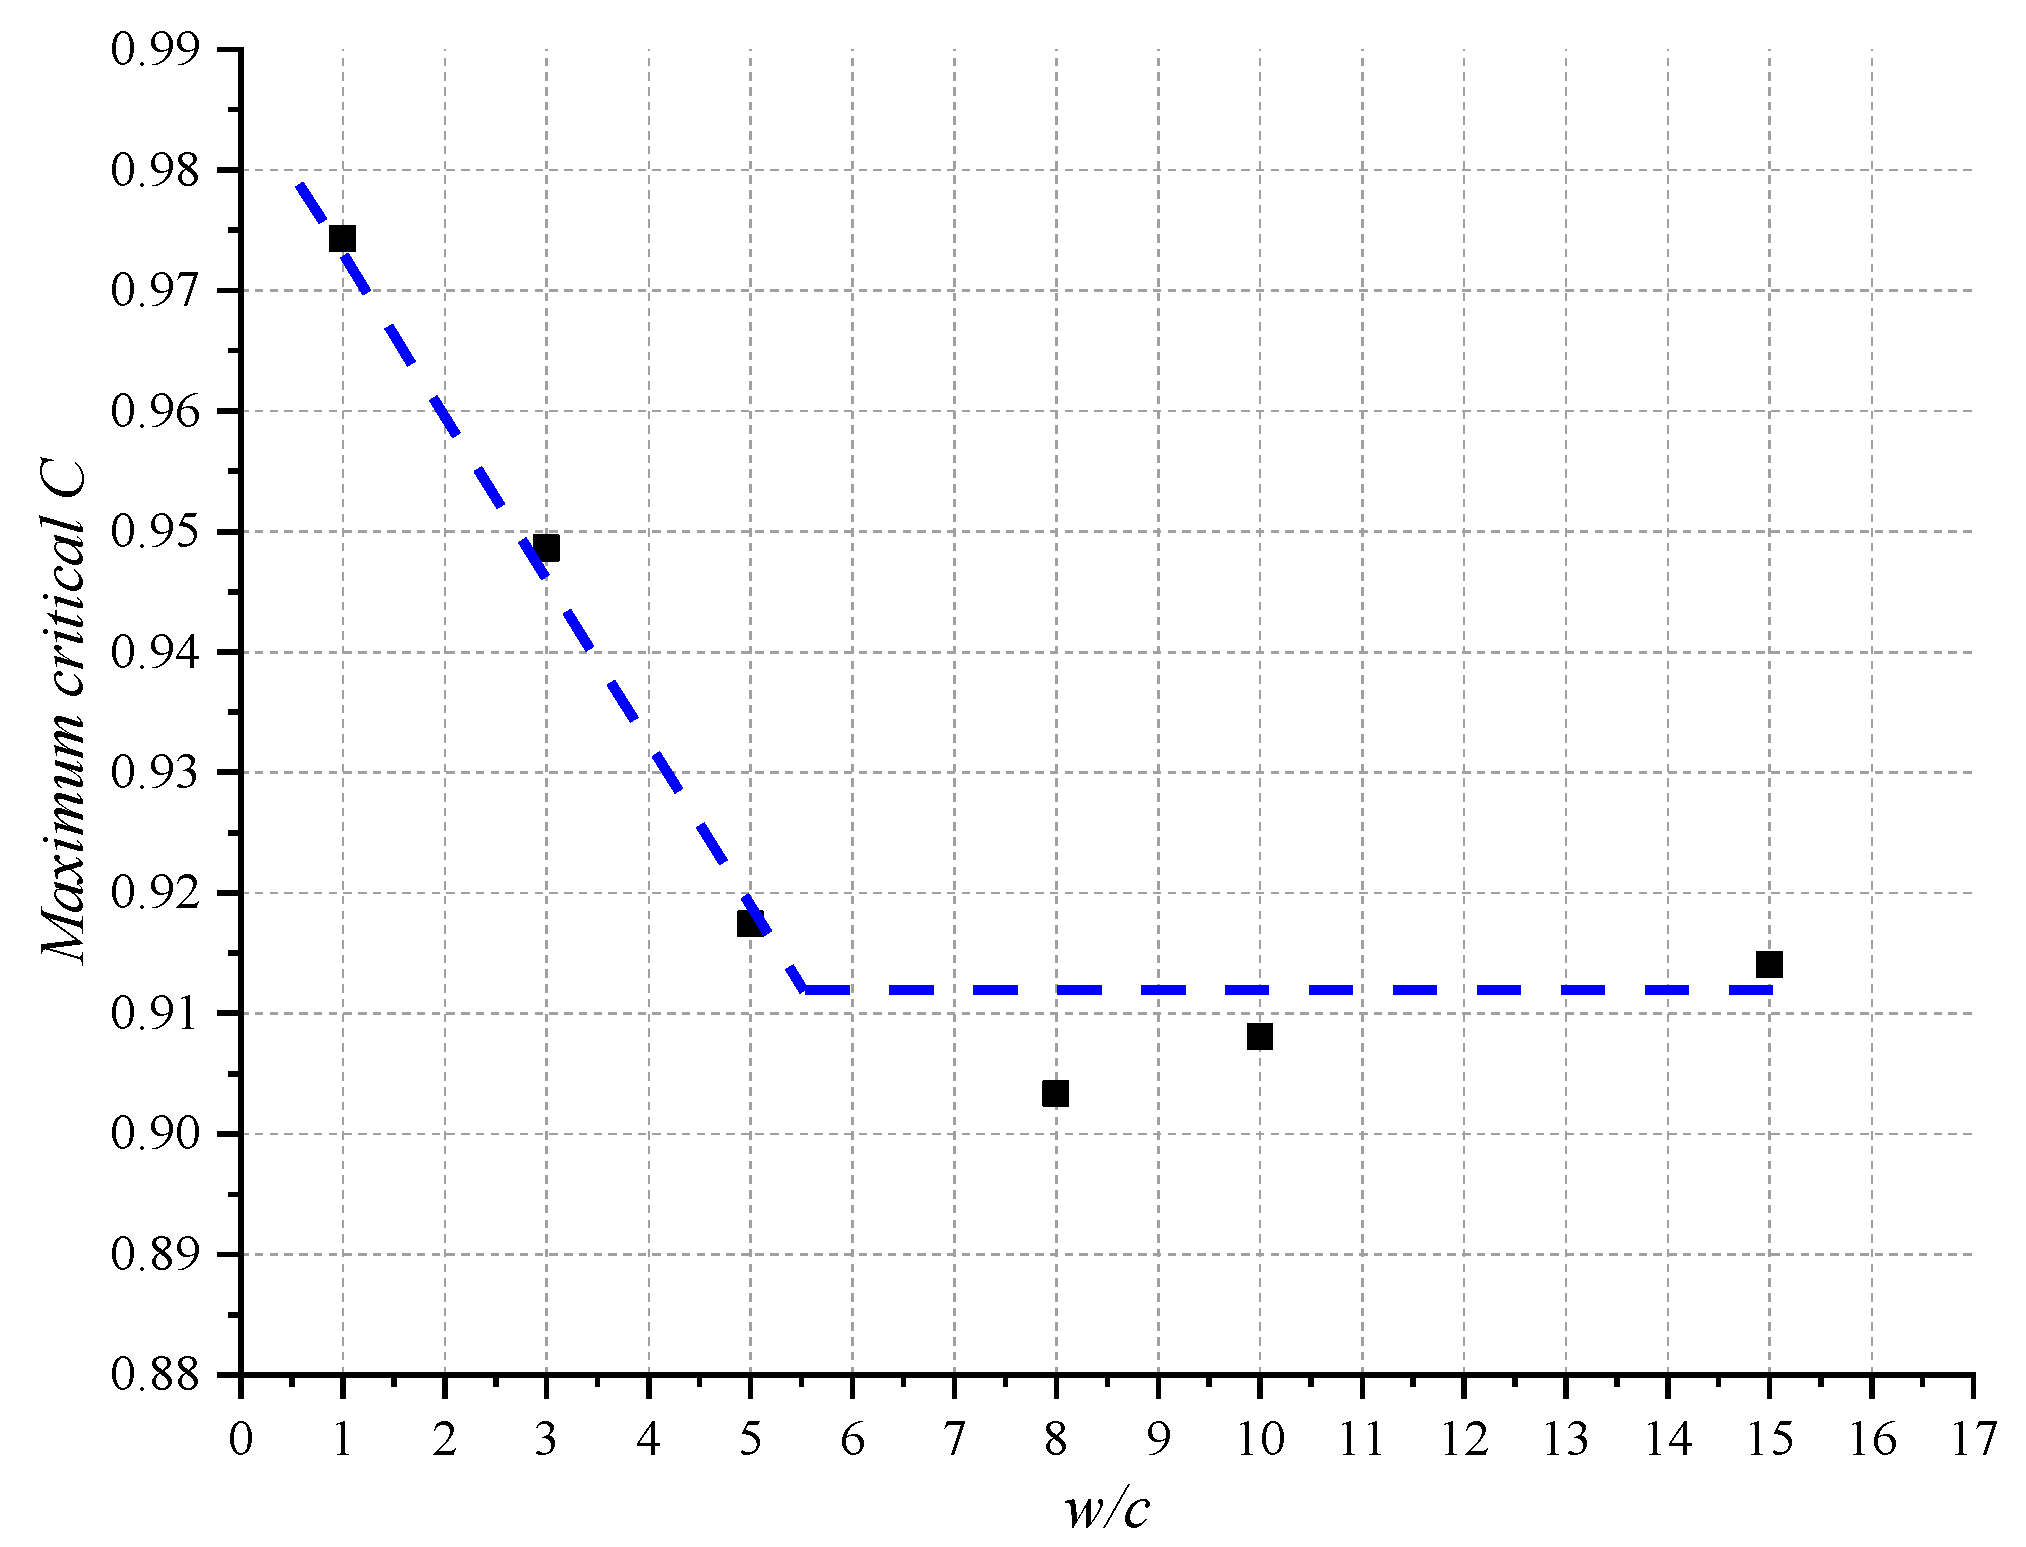
| w/c | Inlet Pressure (MPa) | Inlet Temperature (°C) | Mass Flow Rate (kg/h) | Maximum Critical C |
|---|---|---|---|---|
| 1 | 9.98 | 49.4 | 113.8 | 0.974 |
| 3 | 9.98 | 49.4 | 110.8 | 0.948 |
| 5 | 10.17 | 50.1 | 108.9 | 0.917 |
| 8 | 10.04 | 50.1 | 104.9 | 0.903 |
| 10 | 9.97 | 50.7 | 104.0 | 0.908 |
| 15 | 9.93 | 50.9 | 103.5 | 0.914 |
| θ (Middle Sealing Chamber) | |
|---|---|
| SCO2 | 0.76 |
| Air | 0.53 |
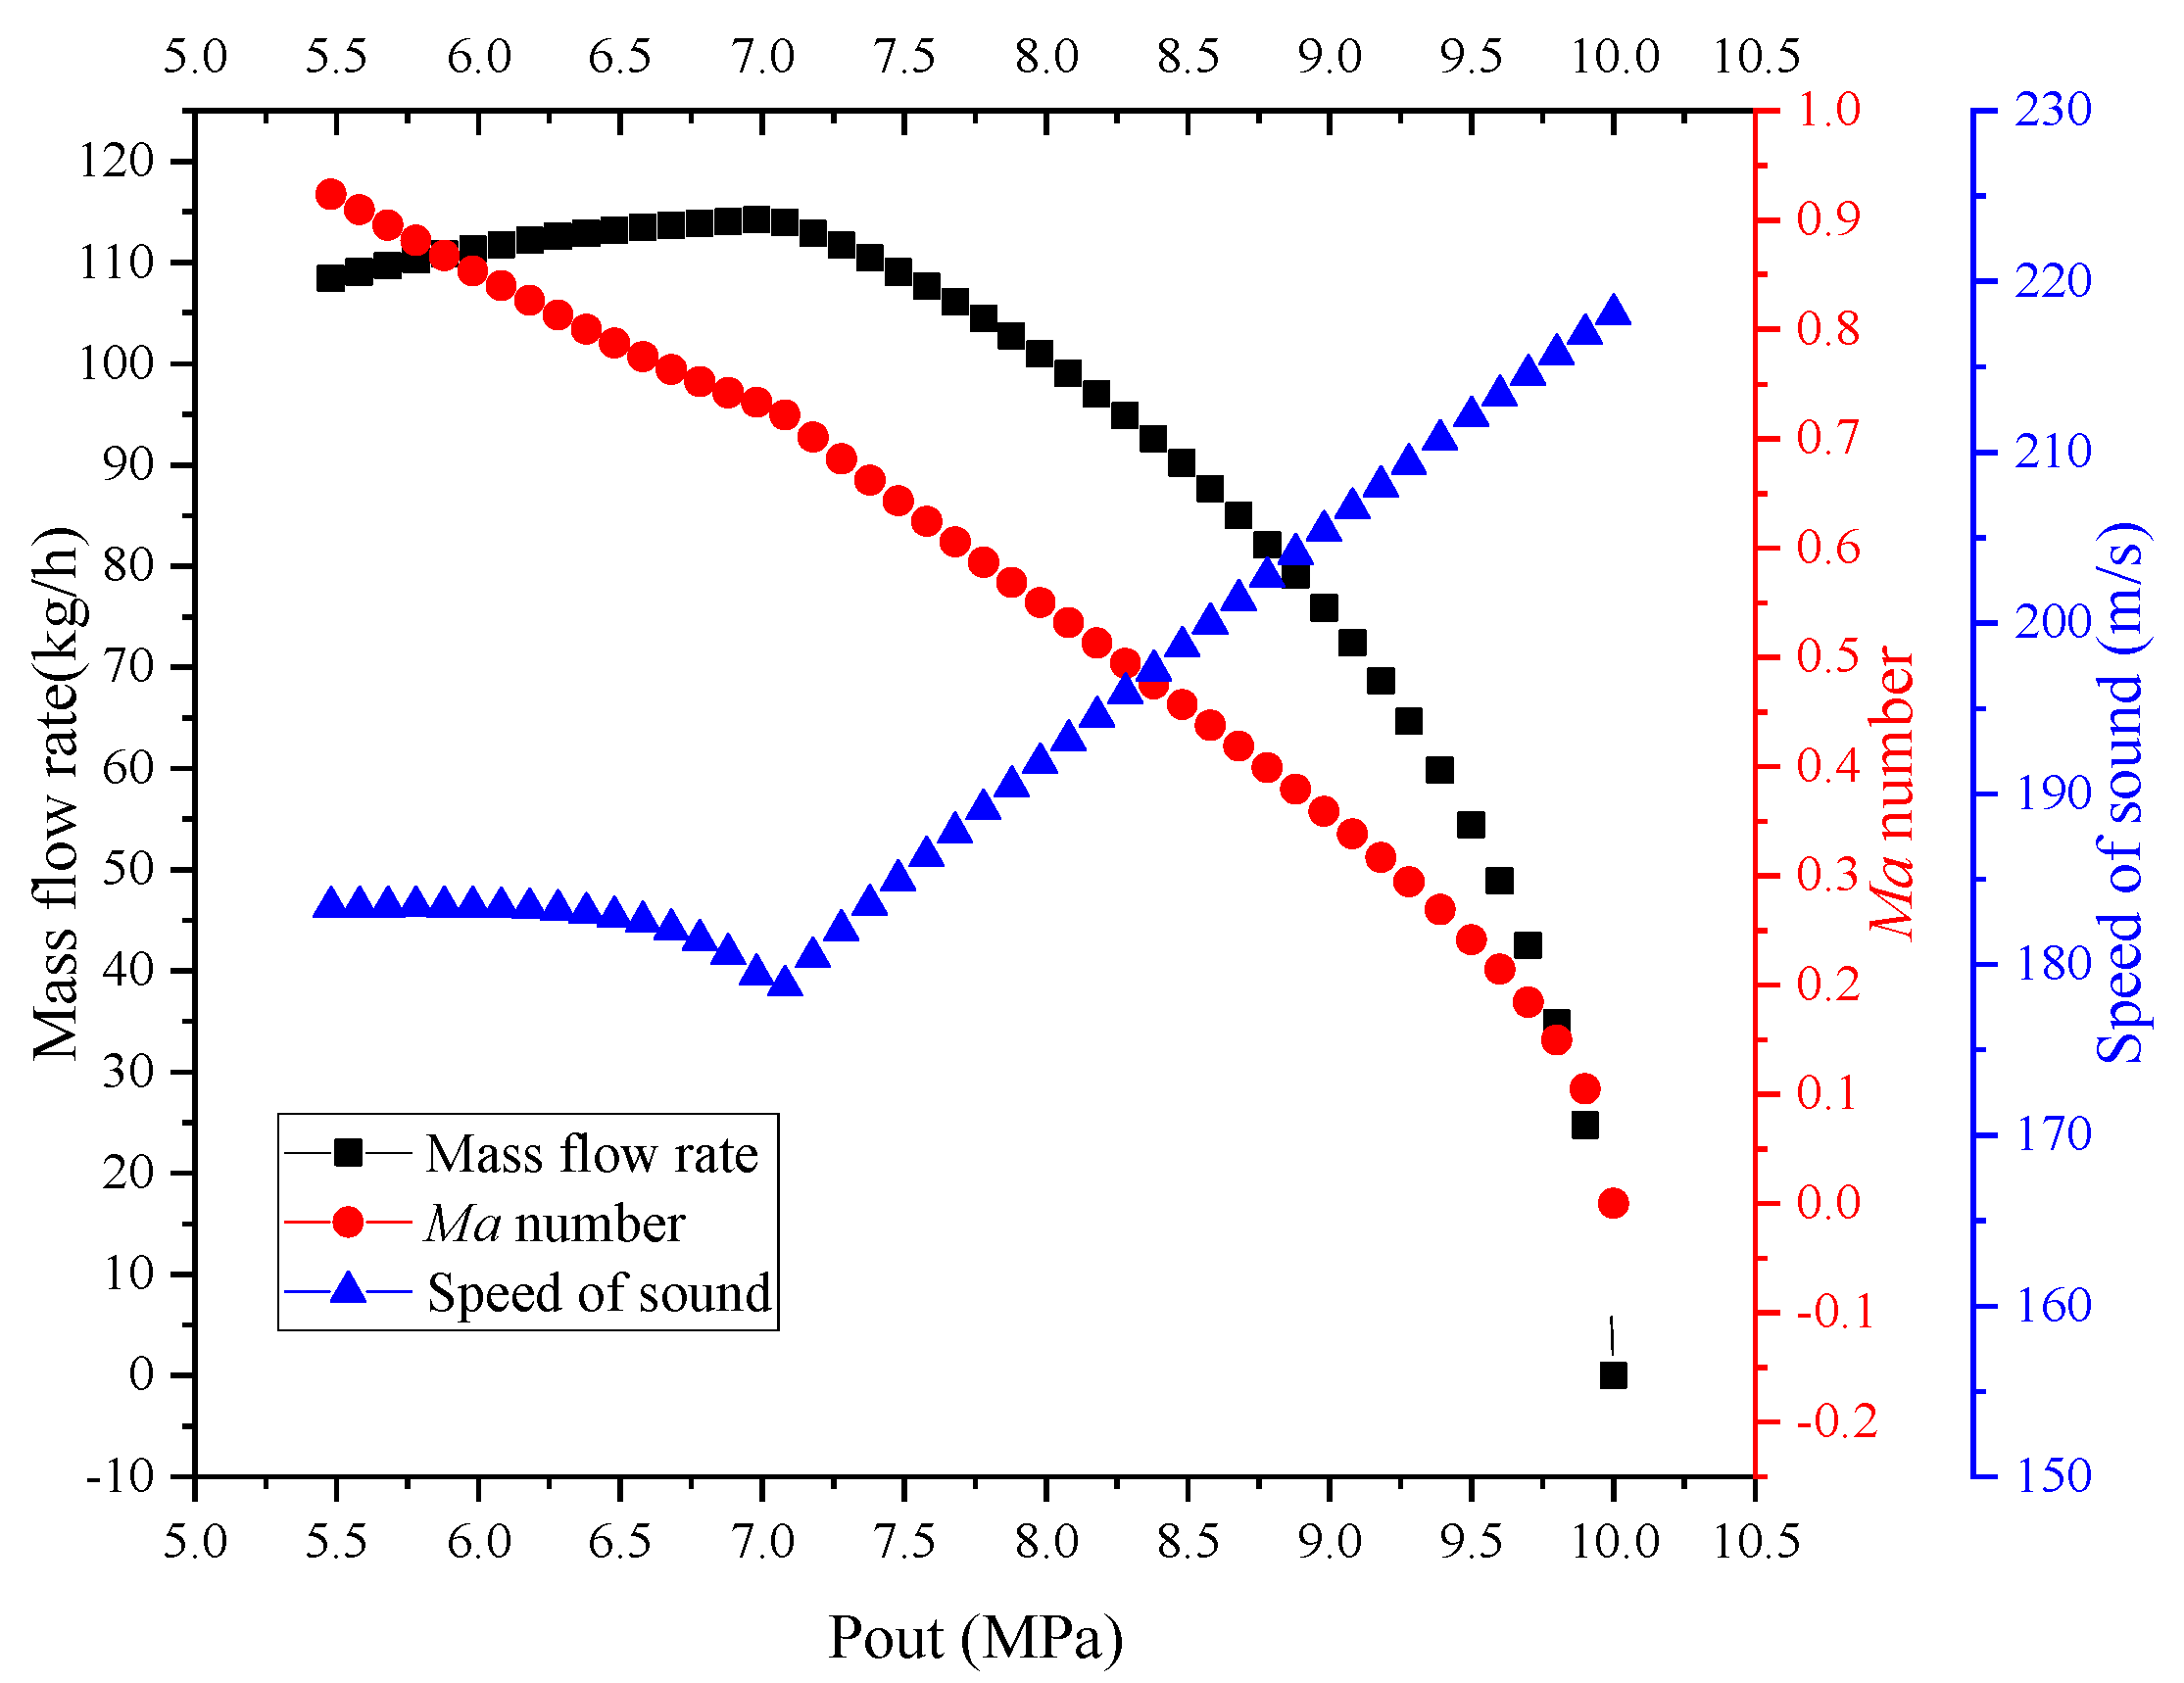
| Pout | Mass Flow Rate | Ma | Speed of Sound |
|---|---|---|---|
| MPa | kg/h | m/s | |
| 10.00 | 0.00 | 0.00 | 218.09 |
| 9.80 | 34.86 | 0.15 | 215.74 |
| 9.60 | 48.88 | 0.21 | 213.33 |
| 9.40 | 59.33 | 0.27 | 210.84 |
| 9.20 | 67.87 | 0.31 | 208.29 |
| 9.00 | 75.15 | 0.35 | 205.66 |
| 8.80 | 81.50 | 0.39 | 202.97 |
| 8.60 | 87.11 | 0.43 | 200.25 |
| 8.40 | 92.10 | 0.47 | 197.51 |
| 8.20 | 96.56 | 0.51 | 194.77 |
| 8.00 | 100.56 | 0.55 | 192.05 |
| 7.80 | 104.14 | 0.58 | 189.35 |
| 7.60 | 107.33 | 0.62 | 186.62 |
| 7.40 | 110.16 | 0.66 | 183.79 |
| 7.20 | 112.63 | 0.70 | 180.76 |
| 7.00 | 114.22(max) | 0.73 < 1 | 179.11 |
| 6.80 | 113.90 | 0.75 | 181.31 |
| 6.60 | 113.49 | 0.77 | 182.42 |
| 6.40 | 112.94 | 0.80 | 183.00 |
| 6.20 | 112.24 | 0.82 | 183.27 |
| 6.10 | 111.83 | 0.84 | 183.34 |
| 6.00 | 111.39 | 0.85 | 183.38 |
| Seal Type | Seal Structure | Outlet Condition | Outlet Phase | Re Number | |
|---|---|---|---|---|---|
| Fan et al. | Round hole | w = 5 mm, c = 1 mm, Z = 1 | Critical | Two-phase | >106 |
| Yuan et al. | See-through | w = 1.27 mm, c = 0.105 mm, s = 1.27 mm, h = 0.88 mm, r = 1.5 mm, Z = 2 | Critical & Non-critical | Gas & Two-phase | >105 |
| Zhu et al. | Stepped staggered | w = 0.3 mm, c = 0.14 mm, h = 2 mm, s = 2 mm, Z = 4 | Critical | Two-phase | >105 |
| Teeth 1 | Teeth 2 | Teeth 3 | Teeth 4 | |
|---|---|---|---|---|
| Sealing clearance (mm) | 0.132 | 0.131 | 0.129 | 0.128 |
| Sealing diameter (mm) | 53.95 | 49.97 | 47.98 | 44.04 |
© 2020 by the authors. Licensee MDPI, Basel, Switzerland. This article is an open access article distributed under the terms and conditions of the Creative Commons Attribution (CC BY) license (http://creativecommons.org/licenses/by/4.0/).
Share and Cite
Zhu, Y.; Jiang, Y.; Liang, S.; Guo, C.; Guo, Y.; Cai, H. One-Dimensional Computation Method of Supercritical CO2 Labyrinth Seal. Appl. Sci. 2020, 10, 5771. https://doi.org/10.3390/app10175771
Zhu Y, Jiang Y, Liang S, Guo C, Guo Y, Cai H. One-Dimensional Computation Method of Supercritical CO2 Labyrinth Seal. Applied Sciences. 2020; 10(17):5771. https://doi.org/10.3390/app10175771
Chicago/Turabian StyleZhu, Yuming, Yuyan Jiang, Shiqiang Liang, Chaohong Guo, Yongxian Guo, and Haofei Cai. 2020. "One-Dimensional Computation Method of Supercritical CO2 Labyrinth Seal" Applied Sciences 10, no. 17: 5771. https://doi.org/10.3390/app10175771
APA StyleZhu, Y., Jiang, Y., Liang, S., Guo, C., Guo, Y., & Cai, H. (2020). One-Dimensional Computation Method of Supercritical CO2 Labyrinth Seal. Applied Sciences, 10(17), 5771. https://doi.org/10.3390/app10175771