Article

Synthesis, Characterization and Mechanical Properties of Nanocomposites Based on Novel Carbon Nanowires and Polystyrene

1
Department of Materials Science and Engineering, University of Ioannina, 45110 Ioannina, Greece
2
ELKEME Hellenic Research Centre for Metals S.A., 61st km National Road Athens-Lamia, 32011 Oinofyta Voiotias, Greece
3
Department of Food Science and Technology, University of Patras, 30100 Agrinio, Greece
*
Author to whom correspondence should be addressed.
Appl. Sci. 2020, 10(17), 5737; https://doi.org/10.3390/app10175737
Submission received: 30 July 2020 / Revised: 14 August 2020 / Accepted: 15 August 2020 / Published: 19 August 2020
(This article belongs to the Special Issue Multifunctional Composite Materials)

Abstract

:
Carbon into polymer nanocomposite is so far a common additive for the enhancement of the polymer properties. The properties of the polymer, such as thermal, and especially its mechanical properties, are improved by the homogeneously dispersed carbon nanoparticles on the polymer matrix. In this study, carbon wires in nano dimensions are, for the very first time, synthesized via the hard templating method from the silicate matrix MCM-41, and used as nano additives of polystyrene. The carbon nanowires were chemically oxidized, and further modified by attaching octadecylamine molecules, for the development of organic functionalities onto carbon nanowires surface. The nanocomposite materials of polystyrene with the modified carbon nanowires were prepared by a solution-precipitation method at three nano additive to polymer loadings (1, 3 and 5 wt%). The as-derived nanocomposites were studied with a combination of characterization and analytical techniques. The results showed that the thermal and mechanical properties of the polystyrene nanocomposites gradually improved while increasing nano-additive loading until 3 wt%. More specifically, the 3 wt% loading sample showed the best mechanical properties, while the 5 wt% sample was difficult to achieve satisfactory dispersion of carbon nanowires and consequently has a wide range of values.

1. Introduction

Nanotechnology nowadays attracts a good amount of research and development efforts compared to other technological disciplines. A major area of research is based on the development of polymer-based nanocomposites. In the last few decades, the main efforts of polymer research have been concentrated on the development of novel nanocomposites, with the purpose of the enhancement of the basic properties of neat polymers. So, the polymer matrix is filled with several nano additives, with the goal of increasing properties, such as Young’s modulus, tensile strength and thermal properties. The key objectives are the optimal homogeneous dispersion of the nanofillers, so that we can achieve high surface area for the interaction with the polymer.
Many different natural or synthetic nanofillers have been added to polymer matrices. The incorporation involves inorganic nanofillers of different structures, including one-dimensional materials such as nanofibers and carbon nanotubes (CNTs), two dimensional materials (nanoclays, graphene, graphene oxide and layered double hydroxides-LDHs) and three-dimensional materials (nanoparticles). Several works have been reported regarding the mechanical properties of polystyrene (PS)/nanofillers nanocomposites [1,2,3,4,5,6]. Polystyrene is a common polymer that is used widely for numerous applications, thanks to its high glass transition temperature and its high resistance to shrinkage.
More specifically, the addition into the polystyrene matrix of a few nanofillers for the synthesis of nanocomposites has been reported. The most cited literature is for the carbon nanotubes polystyrene (CNTs/PS) nanocomposites [7,8]. Carbon nanotubes exhibit tremendous mechanical properties and especially Young modulus up to 1 TPa [9]. So, the addition of those nanofillers into polystyrene matrix offers good mechanical results, and provides the nanocomposites with synergetic electrical and electromagnetic interference shielding properties [2].
Another commonly used nanofiller is the silicate clays [10,11]. The presence of those platelike silicate layers into the polystyrene matrix, provides significant gains in terms of mechanical properties and thermal stability. Over the last few years, and since the discovery of graphene, efforts have been made for the synthesis of this kind of nanocomposites. So, through the oxidation of graphene (GO), it has been achieved better dispersion and thus better mechanical properties of the PS/GO nanocomposite [12,13]. Finally, carbon nanofibers have been tested as alternative one-dimensional nanofiller to CNTs [14,15]. Carbon nanofibers (CNFs), exhibits characteristics of 70–200 nm in diameter and 50–100 μm long. The idea of better mechanical properties, through the diminution of the nano dimension and therefore the incensement of the surface area and the interaction with the polymer, led to the synthesis of novel carbon nanowires.
In the present study, novel nanocomposites of polystyrene with carbon nanowires (CNWs) were developed. The CNWs were synthesized through the hard templating method using as a template the mesoporous silicate material developed by the Mobil Oil Corporation, MCM-41 (Mobil Composition of Matter No. 41) [16]. Polystyrene nanocomposites with CNWs as nano-additives have not been published in the literature before.
The nanocomposites were prepared by a solution-precipitation method at three nanofiller to polymer loadings (1, 3 and 5 wt%) and tested against the same prepared polystyrene without nano additives. For achieving a better dispersion of CNWs into PS, they have been oxidized with the Staudenmaier method. Through the development of surface functional groups, the attachment of octadecylamine (ODA) molecules to those functional groups has been done. The as-derived nanocomposites were studied with a combination of characterization and analytical techniques. Especially, Fourier-transform infrared (FT-IR) and Raman spectroscopies were used for the chemical and structural characterization of the pristine materials and the derived nanocomposites, while the morphology of nanocomposites and the dispersion of the carbon nanowires were analyzed by the atomic force microscopy technique. Tensile testing, dynamic mechanical analysis and thermogravimetric analysis (TGA) were also used to examine the mechanical properties and thermal stability-glass transition temperature of PS after the incorporation of CNWs-ODA nanowires.

2. Materials and Methods

2.1. Chemical Reagents

All chemical reagents were used as purchased without further purification. Polystyrene (Mw~350,000) (PS), tetraethyl orthosilicate 98% (TEOS), sucrose 99.5% and octadecylamine 99% (ODA), were purchased from Sigma-Aldrich (Schnelldorf, Germany). Nitric acid 65%, sulfuric acid 95–97%, sodium hydroxide 98%, ammonia solution 25%, Cetyltrimethylammonium bromide 97% (CTAB) and toluene for analysis were purchased from Merck, whereas ethanol 99.8% was purchased from Fisher Scientific. Finally, potassium chlorate 99% was purchased by Alfa Aesar.

2.2. Synthesis of Hard Template MCM-41

The MCM-41 sample was synthesized using CTAB as the surfactant and TEOS as the silica source [17]. In a typical synthesis, 50 g of TEOS was added to a 1 L polyethylene bottle containing 417.5 g of H2O, 268.5 g of NH3 (25 wt%) and 10.5 g of CTAB. Each of the previous additions was stirred for 30 min. The product was retrieved after heat treatment at 80 °C for 96 h, which can be slightly considered as a hydrothermal treatment. It was filtered, rinsed with cold ethanol (EtOH), and placed on a plate for air drying. Finally, is heat-treated to 550 °C for 5 h with a 2 °C/min heating rate.

2.3. Synthesis of Carbon Nanowires (CNWs)

The synthesis of CNWs was performed according to the hard templating method [18]. In particular 1 g MCM-41 was added to a solution obtained by dissolving 1.25 g of sucrose and 0.14 g H2SO4 in 5 g H2O. The mixture was dried for 6 h at 100 °C and subsequently, for 6 h to 160 °C. The material was treated again at 100 °C and 160 °C, using the same drying procedure after the addition of 0.8 g sucrose, 0.09 g H2SO4 in 5 g of H2O. The carbonization was completed by pyrolysis with heating to typically 900 °C under nitrogen flow. After the carbonization, the silica/carbon material was treated with 1 M NaOH in 1/1 (v/v) solution of EtOH/H2O at 100 °C to remove the silica template. The obtained product was filtered, washed with ethanol and dried at 120 °C.

2.4. Chemical Oxidation and Surface Modification of CNWs

For the chemical modification and the creation of organophilic surface onto carbon nanowires, two steps of modification were selected. The first step includes the chemical modification of the surface, according to Staudenmaier’s method [19]. The second step contains the attachment of octadecylamine molecules onto the oxidized surface [20].
More specifically, for the first step 10 g of CNWs were added into a solution of 400 mL concentrated sulfuric acid and 200 mL nitric acid, which is ice bathed. Afterwards, into the previous solution 200 g of potassium chlorate was added at small quantities each time under steering and cooling. After 18 h the reactions are terminated by adding the solution at distilled water and washing the product. The oxidized carbon nanowires (CNWs-ox) are placed on a plate for air drying.
The second step includes the dispersion of 200 mg CNWs-ox into 10 mL distilled H2O. Into this aqueous is added a solution containing 40 mL of warm ethanol with 600 mg octadecylamine. The solution is stirred under reflux for 90 h followed by centrifugation, washing with warm ethanol and air drying of the product on a plate.

2.5. Preparation of the Nanocomposites

Nanocomposites of polystyrene containing 1 wt%, 3 wt%, and 5 nano additives were prepared as follows: an appropriate amount of granular polystyrene was diluted in 10 mL toluene, and the solution was reacted with aliquots of the corresponding filler suspension in 5 mL toluene as well. The quantities were appropriate to achieve the final concentrations of nano-additives at final nanocomposites. The mixture was then stirred for 3 h, precipitated with methanol and air-dried on a glass plate. Finally, the solid samples were heated for 2 h under vacuum at 140 °C for the efficient removal of the solvent [21]. The final membrane products were shaped through the compression between two heated platens of Specac’s Atlas suitable for Specac’s Hydraulic Press.

2.6. Characterization

Infrared (FT-IR) spectra of samples in powder form, dispersed in KBr pellets, were measured with a Perkin-Elmer GX, Fourier transform spectrometer in the frequency range 400–4000 cm−1. Spectra were the average of 32 scans with a 2 cm−1 resolution.
Thermogravimetric (TGA) and differential thermal (DTA) analysis were performed using a Perkin-Elmer Pyris Diamond TG/DTA. Samples of approximately 5 mg were heated in nitrogen from 25 to 800 °C, at a rate of 5 °C/min.
Raman spectra were recorded with a RM 1000 Renishaw micro-Raman system using a laser excitation line at 532 nm (Nd:YAG) in the range of 400−3500 cm−1. A laser power of ~10 mW was used with a 2 μm focus spot.
Atomic force microscopy (AFM) images were obtained in tapping mode with a Multimode Nanoscope 3D using Tap-300G silicon cantilevers with a tip radius <10 nm and a force constant of ~20–75 N m−1.
Transmission electron microscopy (TEM) images of polystyrene nanocomposites deposited on carbon-coated copper grids (CF300-CU-UL, carbon square mesh, CU, 300 mesh from Electron Microscopy Science) were obtained using the instrument JEM HR-2100, JEOL Ltd., Tokyo, Japan operated at 200 kV in bright-field mode. The mechanical performance of all films was evaluated using a miniature material tester with a 50 N load cell. Three to five “dog bone” tensile specimens (ASTM 638/95 Type V) were clamped between the grips (30 mm initial distance) and tensioned at a crosshead speed of 1 mm/min according to ASTM D638. Force (N) and deformation (mm) were recorded during the test and converted into stress (MPa) and strain (%), based on the cross-sectional area and the initial length data, respectively. The results obtained from the mini-tester can only be used for comparison, because the strain values are based on the rotational movement of the drive shaft. Baseline samples (not containing CNW) were tested at the beginning of each set of samples for comparison.
A NETZSCH DMA 242C apparatus was used to evaluate the thermomechanical response of selected samples under tensile mode at a frequency of 1 Hz, and temperatures ranging from 20–120 °C (rate 2 °C/min). The amplitude of the deformation was 60 μm.

3. Results

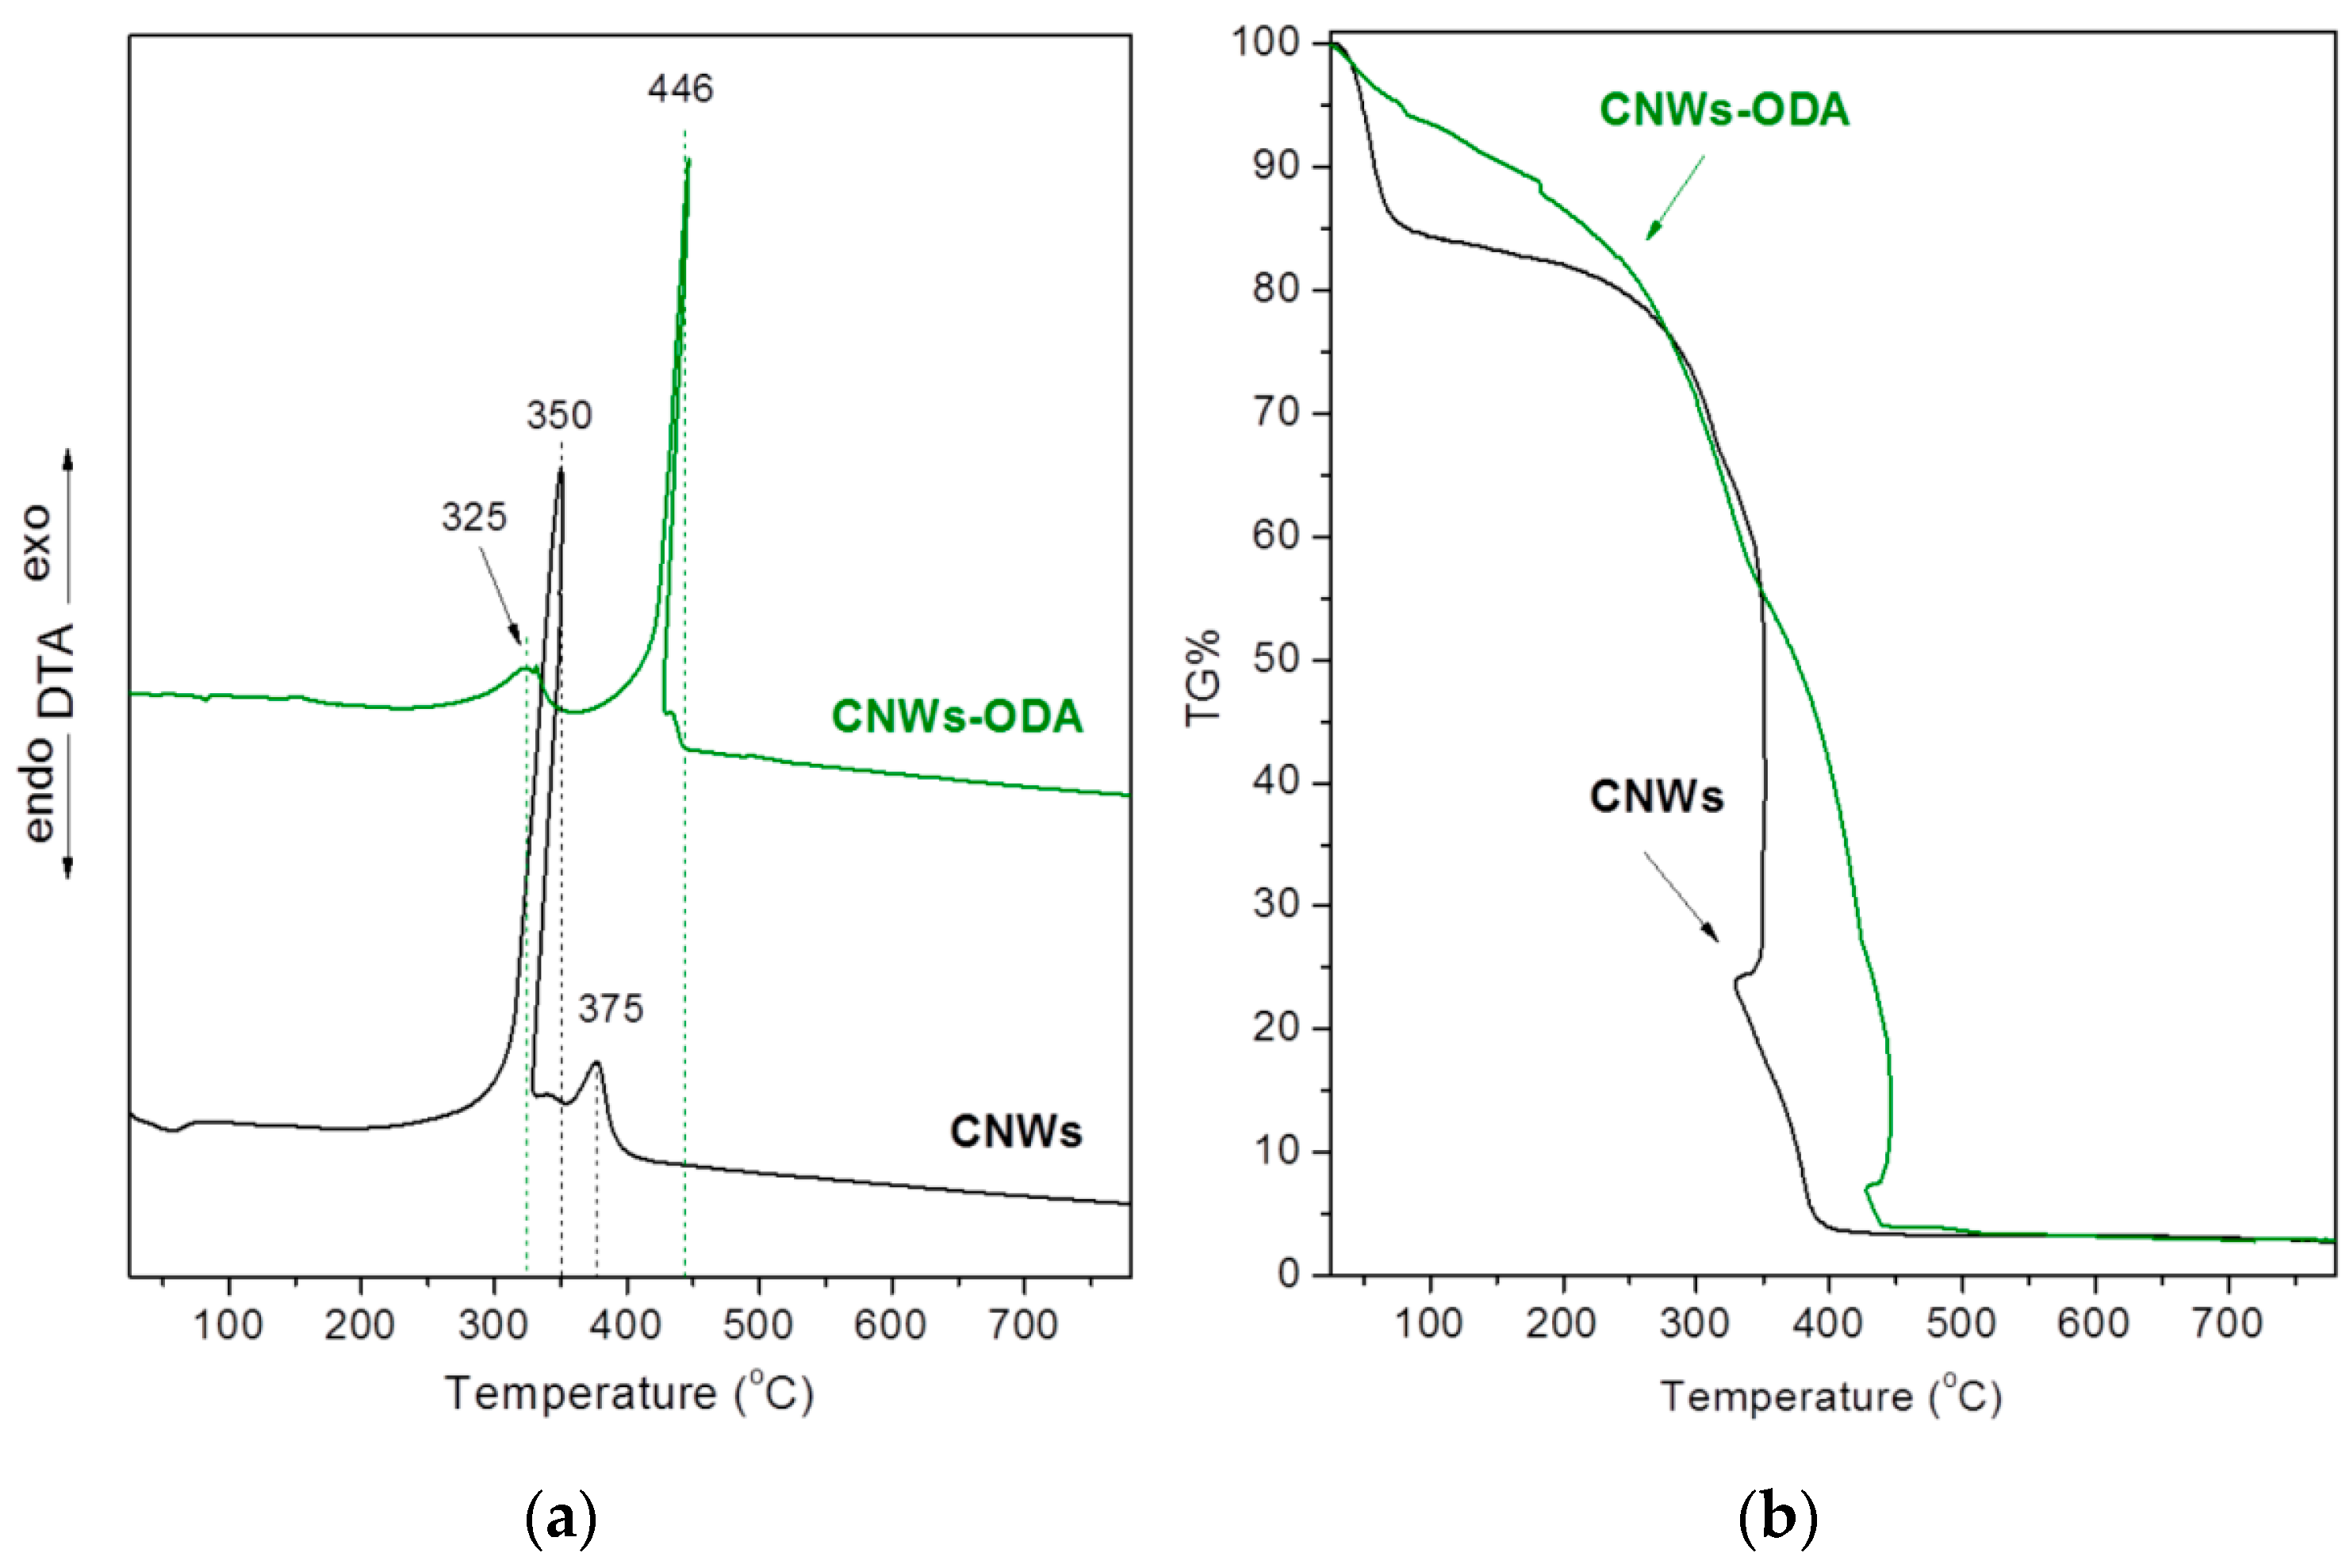
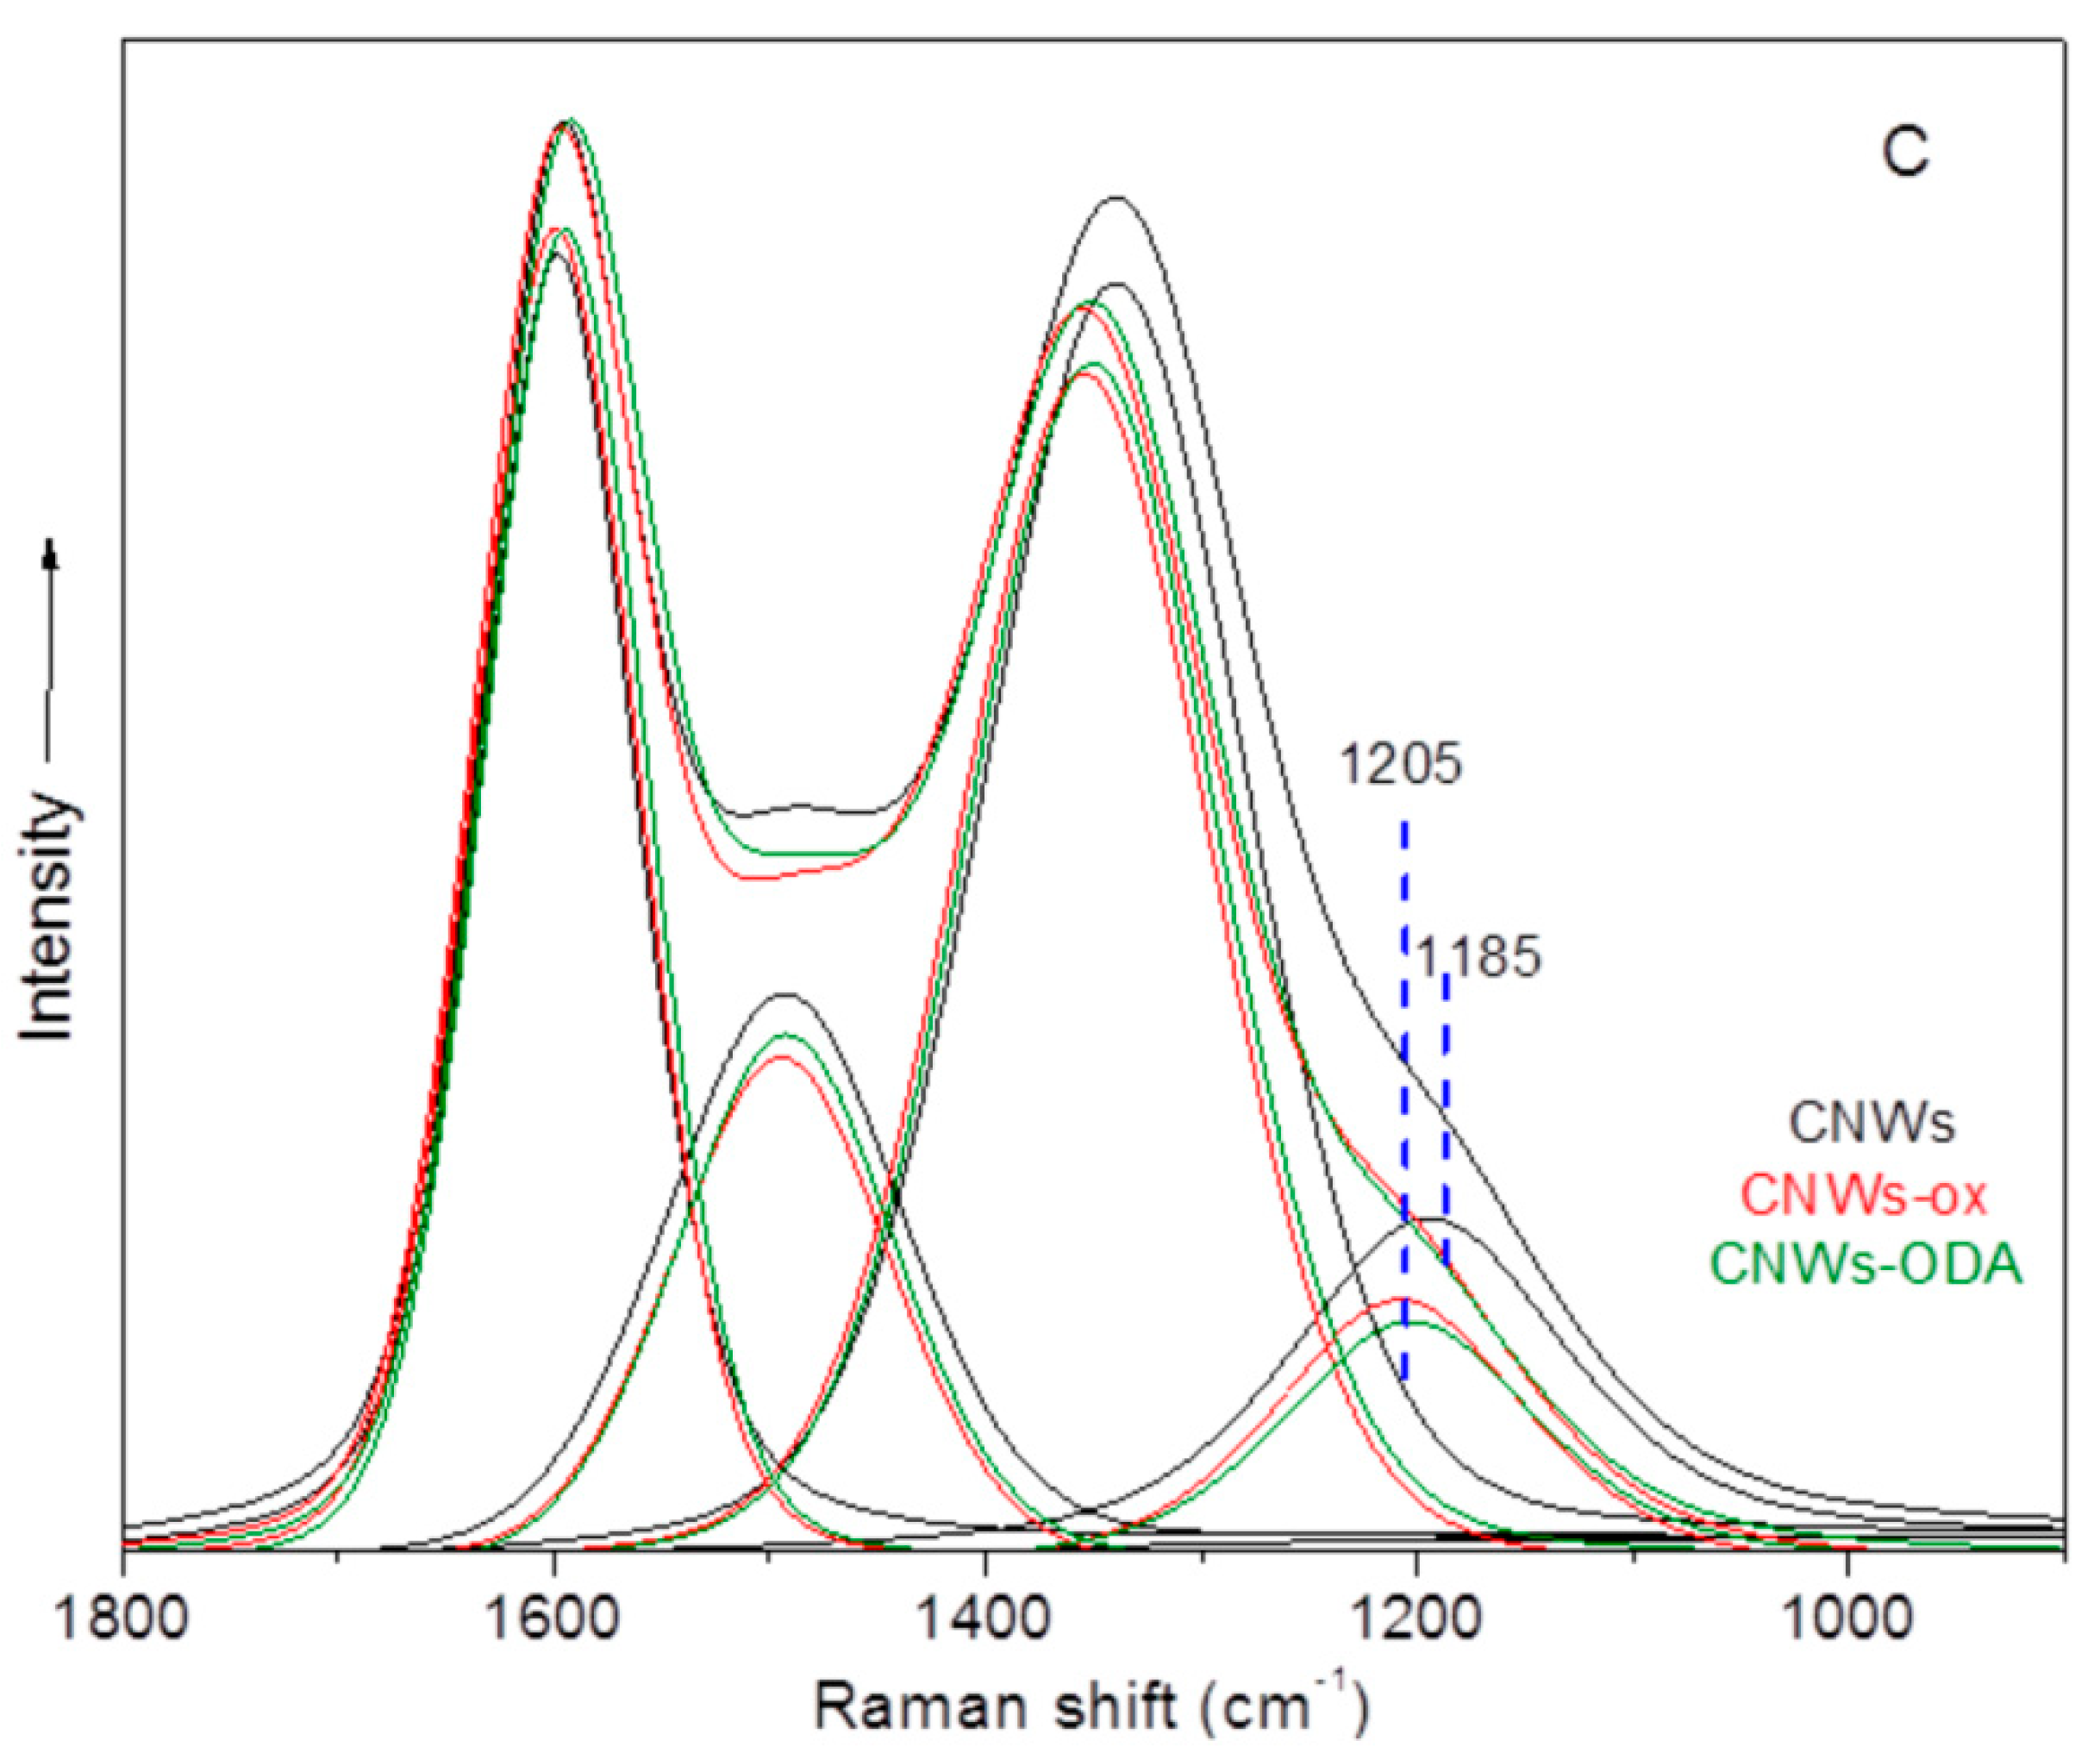
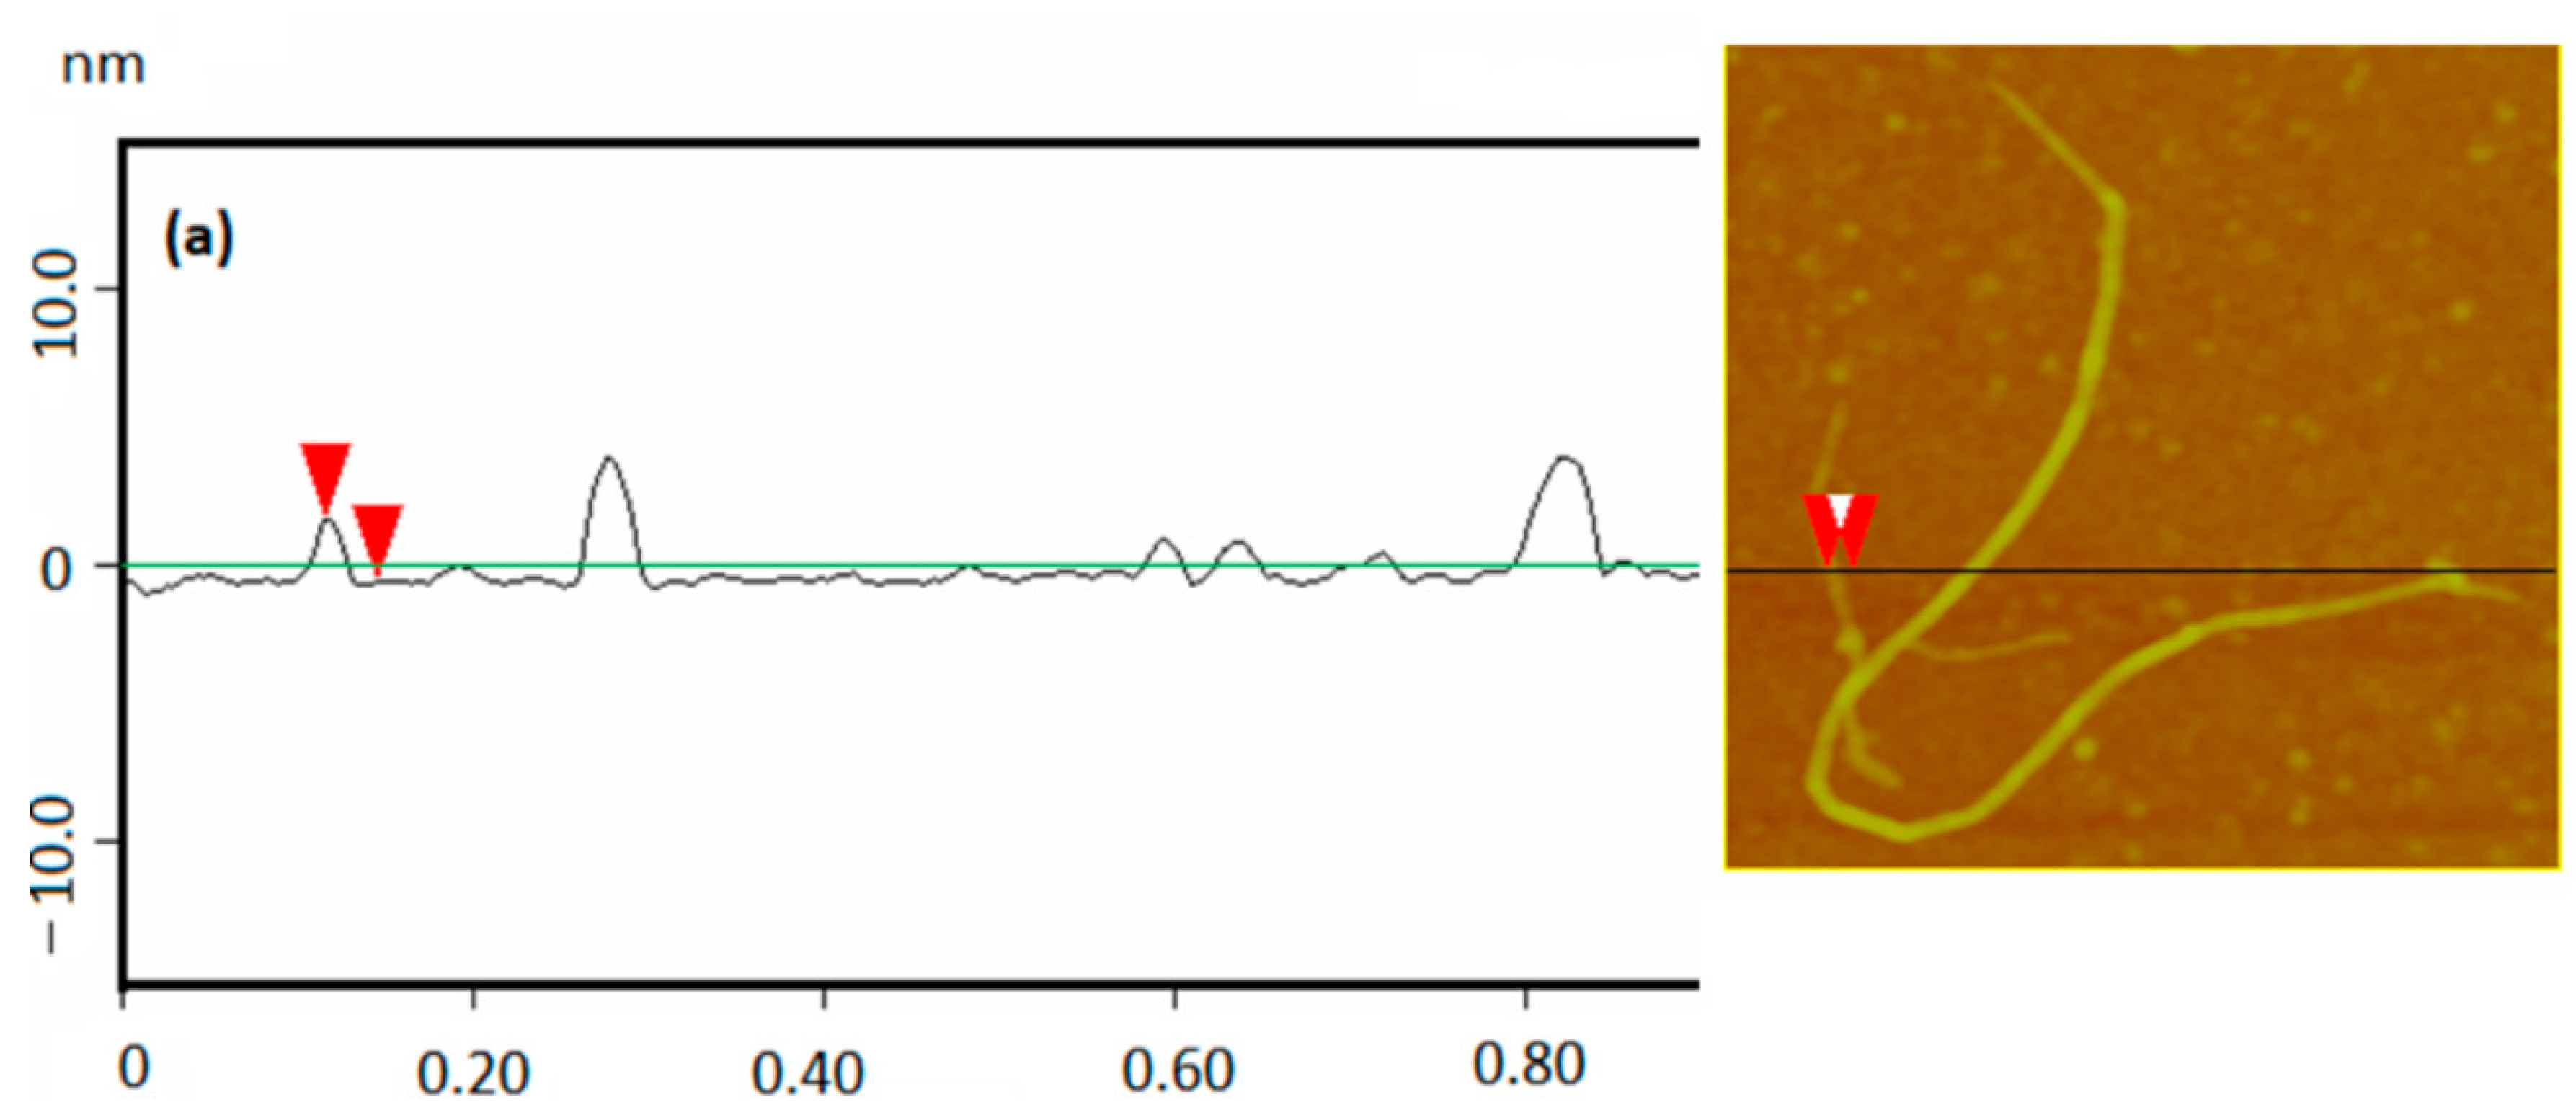
3.1. Structural Characterization and Material Properties of the Nanofillers

The infrared spectra of CNWs, CNWs-ox and CNWs-ODA are shown in Figure 1. The spectrum of CNWs (a) is typical for carbonaceous materials, and shows a broad absorption envelope in the frequency region of 1700−1000 cm−1, exhibiting three maxima at around 1561, 1360 and 1200 cm−1. According to previous studies on graphitized carbon, these peaks can be assigned to the asymmetric and symmetric stretching vibrations of the –COO units close to aromatic rings [22,23]. These peaks are representative of the presence of carbonyl groups on CNWs. The third band at 1200 cm−1 is attributed to stretching vibrations of the C-O groups, ether or hydroxyl groups. On the other hand, the spectrum of CNWs-ox sample (b) is indicative of oxidation of the carbon surface after its chemical treatment with acids. For instance, the development of a band at 1725 cm−1, the band shift from 1561 to 1580 cm−1, and the decrease of the absorption at 1360 cm−1. At the same time, a significant increase in the absorption with a maximum at 1200 cm−1 can be observed. These changes are assigned to the protonation of the carbonyl groups. Specifically, the band at 1725 cm−1 is attributed to the asymmetric stretching vibrations of the carboxyl groups (COOH), whereas the absorption band at 1580 cm−1 to the symmetric stretching vibrations of the same groups. The amplification of the absorption at 1200 cm−1 is assigned to the incensement of the number of carboxyl.
The successful addition of octadecylamine molecules decorated CNWs surface is apparent at CNWs-ODA spectrum (c) and specifically from the appearance of new bands. The band at 1571 cm−1 corresponds to the asymmetric bending vibrations of N-H bonds from the NH2 groups of ODA. At the asymmetric stretching vibrations of the same groups, NH2 is also attributed to the weak band at ~3300 cm−1. Furthermore, bands appearing at 2918 and 2851 cm−1 are attributed to stretching vibrations from C-H bonds of the alcylic chain of ODA (vibrations from CH2 and CH3 groups, respectively), as well as the absorptions at 1467 and 1385 cm−1. The strong absorption that is caused by the carbonate chains of ODA covers in a big degree the remaining features from the CNWs except for the previously observed bands at 1571 and 1610 cm−1 [24,25].
Figure 2 shows the DTA (a) and %TG (b) curves for the CNWs and CNWs-ODA. Both samples show very sharp exothermic peaks at 350 °C and 446 °C, respectively, which corresponds to the combustion of the carbon material. Additionally, each sample shows another exothermic peak at 375 °C (CNWs) and 325 °C (CNWs-ODA). In the case of CNWs, this peak can be attributed to the presence of various surface functional groups or more graphitic carbon species, whereas in the case of organo-modified CNWs, this peak corresponds to the combustion of the surface functional organic groups of octadecylamine.
From the TGA curve of CNWs, the sample has estimated that it possesses about 15% of its weight moisture that it has naturally adsorbed from the material. The modified sample, CNWs-ODA, shows only a minor mass change until 100 °C proving the alteration of the nature of the sample from hydrophilic to hydrophobic [26]. Additionally, once again, the incensement of the thermal stability is obvious.
The graphitic characteristics of CNWs, CNWs-ox and CNWs-ODA samples were studied by Raman spectroscopy and are shown in Figure 3a. The spectra of all samples exhibit the G and D-bands that generally characterize the graphitic structures with defects on its matrix. As can be seen from Figure 3b, the spectra have been normalized for their G-band intensity at 1600 cm−1. This fact implies that the modification by adding ODA on CNWs does not significantly change the graphitization of the material. On the other hand, the spectra are different in terms of the position of the frequency and width of the D-band. This band at CNWs-ox and CNWs-ODA spectra presents a maximum at 1355 cm−1 and is narrower at the lower frequencies, whereas at the CNWs spectra the D-band has a peak at 1337 cm−1 and appears to possess a shoulder at ~1170 cm−1.
In Figure 3c, the CNWs and CNWs-ODA spectra are decomposed to Gaussian profiles and confirm that the differenced mentioned previously are attributed to the presence, besides the D and G-bands, of another band at ~1195 cm−1 [27]. This band can be assigned to the existence of nanocrystalline phases [28] or to phases rich in sp3 hybridism [29,30]. It is quite possible that the oxidation performed at the pristine CNWs resulted at the removal of these phases, while they were weakly bounded with the remaining part of the material, i.e., carbon nanowires.
It is also possible to assess the graphitization degree of carbon nanowires from the intensity ratio (ID/IG) and the full width at half maximum (FWHM) of the G-band. These parameters for all samples have been estimated and have similar values. The value of the ratio (ID/IG) was calculated in the range 0.90–0.91. That proves that the graphitization of all samples remains unaffected through all stages of modification. These values are typical for that kind of structure, such as CMK-x [31], indicating a rather low ordering (bulk graphite has ID/IG = 0.1–0.3), due to the three-dimensional structure of the carbon nanowires.
As seen in the images atomic force microscopy (AFM) images in Figure 4, the formation of carbon nanowires with worm-like morphology is clear.
The images prove the successful synthesis of CNWs with diameters from ~2 nm (Figure 4a) up to 5 nm (Figure 4b) and ~2 μm length.

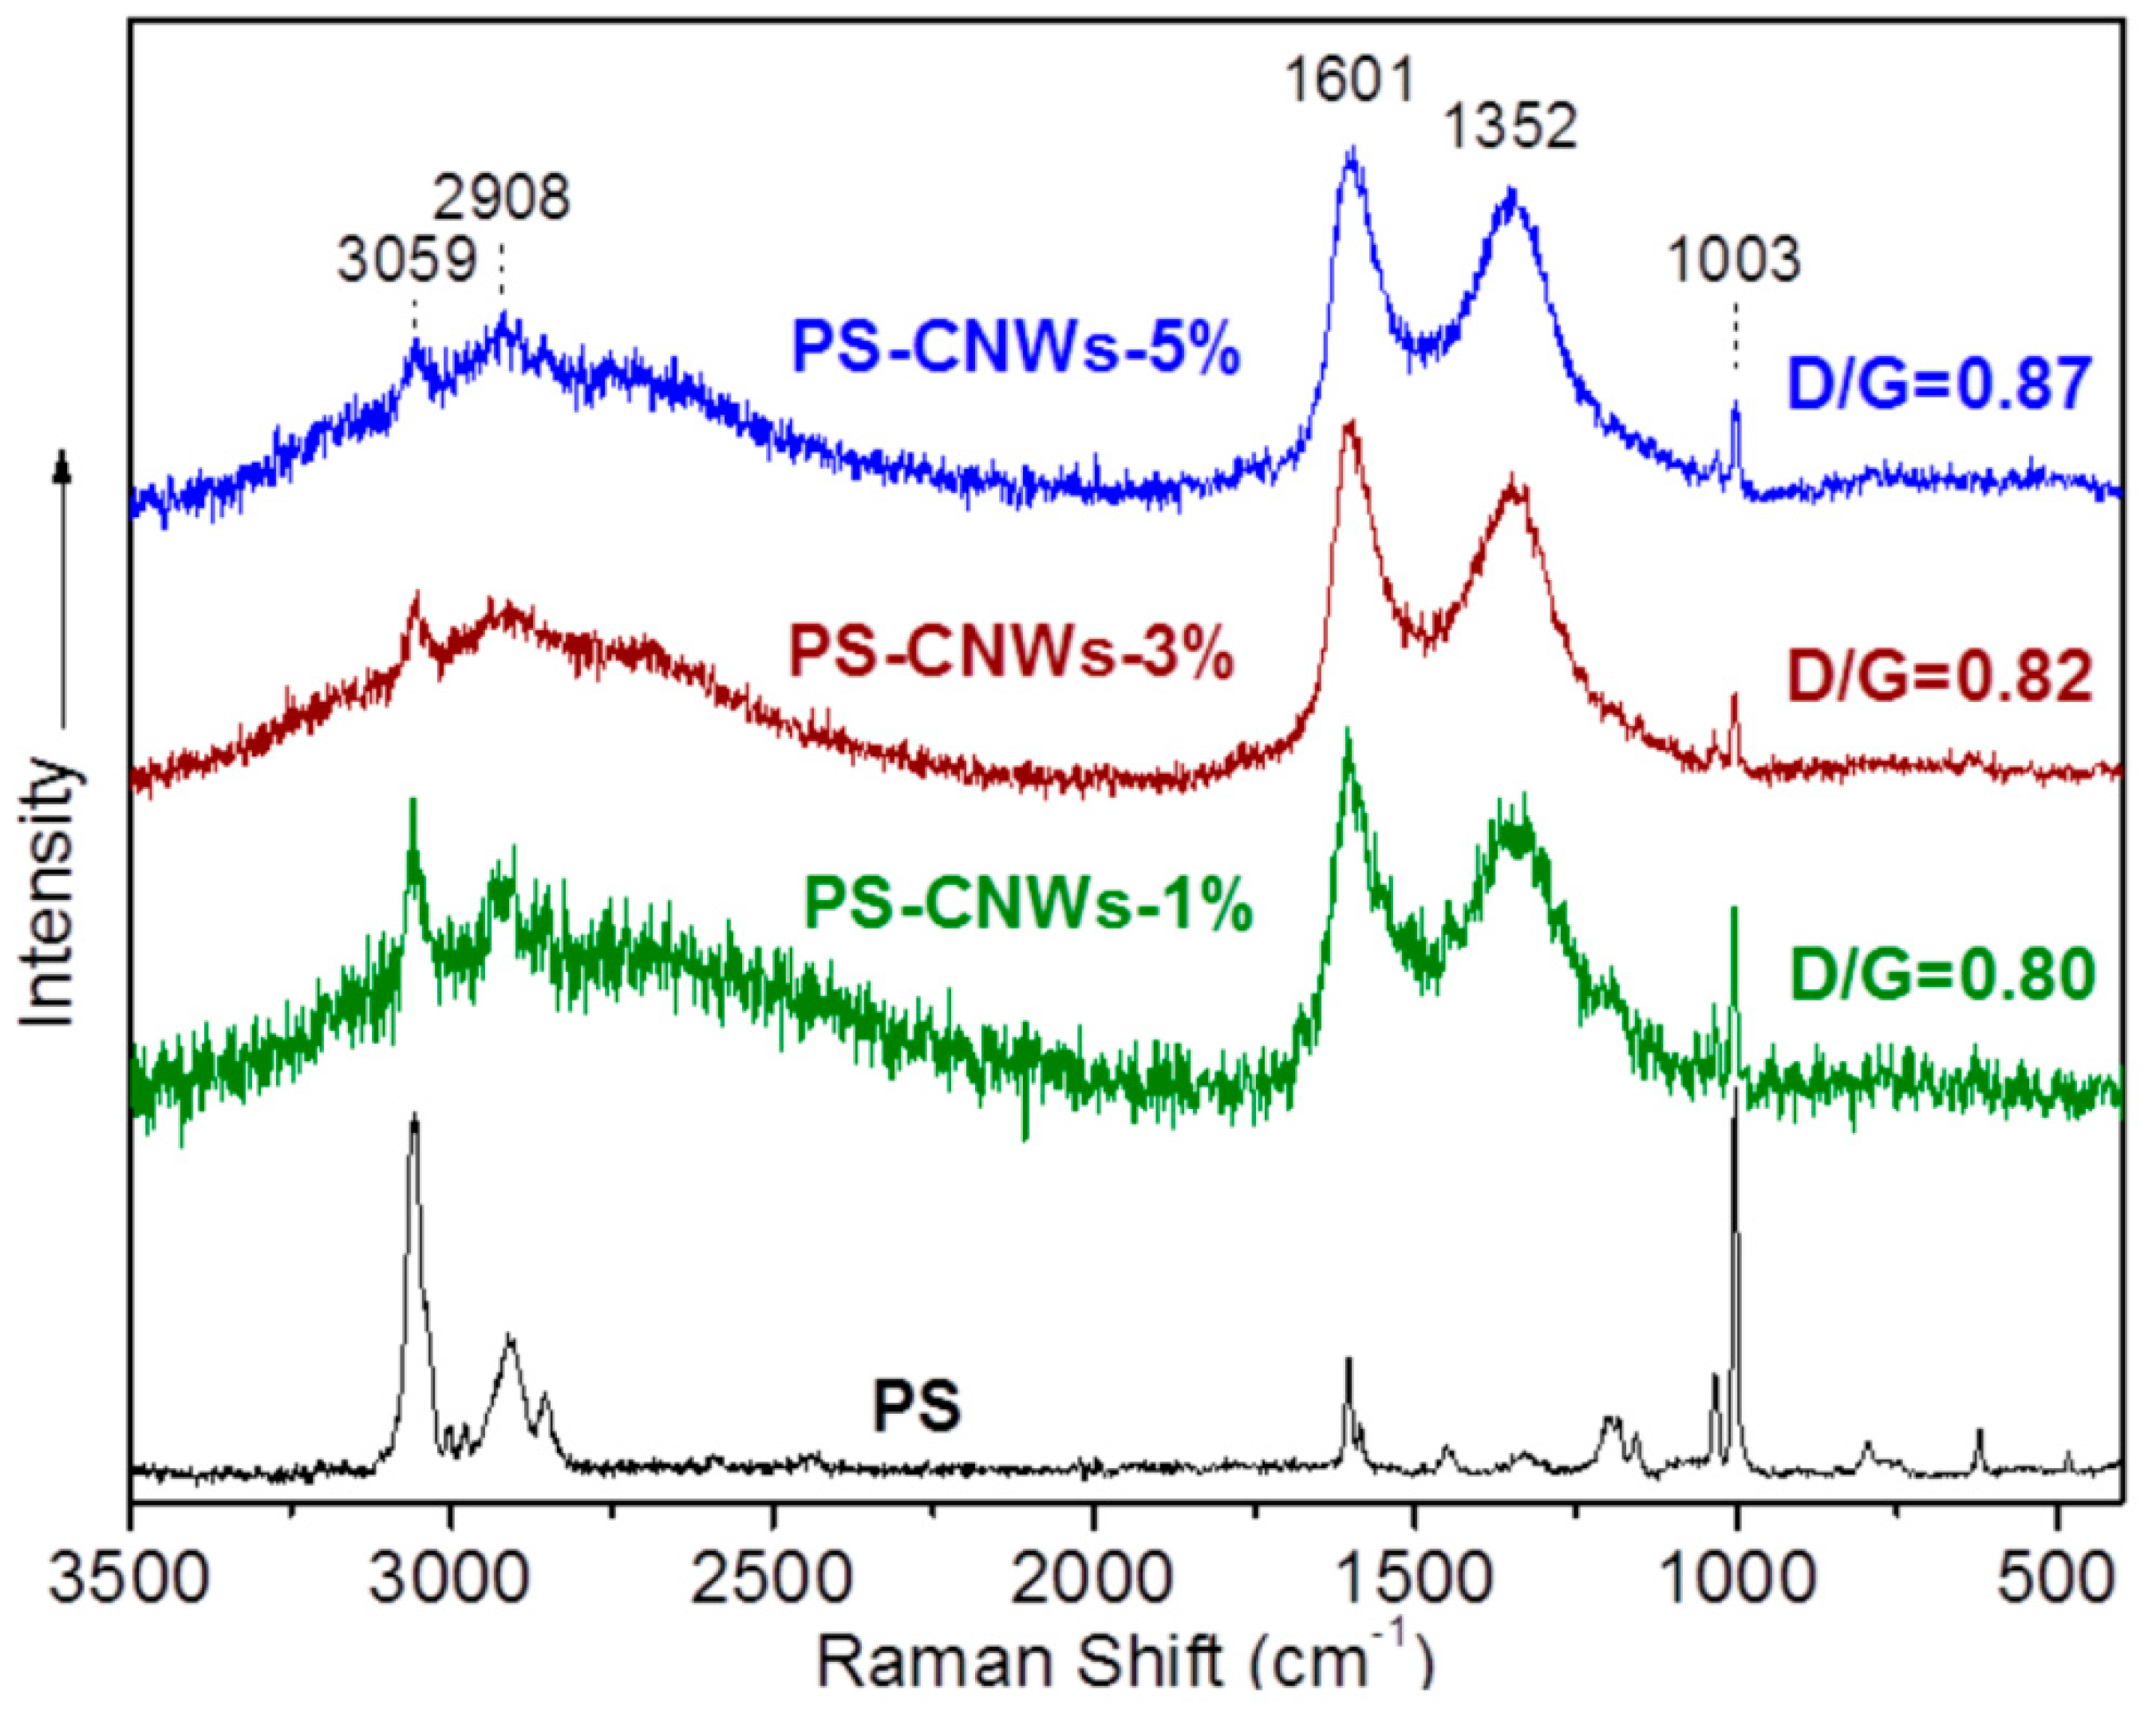
3.2. Structural Characterization and Material Properties of the Nanocomposites

The infrared spectra of the nanocomposites at three different concentrations of nanofillers (1 wt%, 3 wt%, and 5 wt%), as well as the neat PS, are shown in Figure 5. The spectra of nanocomposites have all those bands that exist at PS sample. The observation of peaks corresponding to the CNWs is difficult, due to the similar nature of the materials and the low addition rate of the nanofillers to the final nanocomposites.
The absorbance bands are in a wide area of the spectra. The first major band at 3025 cm−1 corresponds to the stretching vibrations of aromatic C-H bonds, while the second major band at 2921 cm−1 is from the same kind of vibrations of C-H on carbon chains. The next three major bands at 1600, 1492 and 1451 cm-1 are attributed to aromatic C-H bond stretching vibrations, as well as the major peaks that are located at 1260, 1017, 796, 749 and 695 cm-1, which indicate aromatic C-H deformation vibration [32].
Figure 6 shows the DTA (a) and TG (b) curves for the nanocomposites PS-CNWs at two different analogies with 1 wt% and 5 wt% CNWs. On both samples, endothermic peaks appear at 308 °C, 377 °C and 400 °C or 320 °C and 365 °C, respectively, as well as an exothermic peak at 515 °C. Contrarily, the DTA curve of PS inhibits a strong intensity exothermic peak at 408 °C. This peak is correlated to the decomposition of the polymeric structure through depolymerization of the form: Applsci 10 05737 i001
This decomposition is catalyzed by the Pt crucible and greatly affects the DTA signal [33,34,35]. The differentiation observed at the nanocomposites curves can be assigned to the existence of nanowires that are surfaced modified by ODA molecules. It is well known that the decomposition of amine groups occurs at temperatures below 400 °C and over more than one step. Therefore, given the fact that the graphitic structure of CNWs is not affected at temperatures below 350 °C, the endothermic peaks at 308 °C and 320 °C at the nanocomposite spectra are attributed to the amine groups decomposition, catalyzing the decomposition of PS to lower temperatures (365 °C and 377 °C). The exothermic peaks near 515 °C are indicative of the combustion of nanowires, as well as the remaining organic part of the nanocomposite matrix.
From the TGA curves, the nanocomposites are less thermally stable than the neat-PS. Specifically, the sample with 5 wt% CNWs is by 10 °C more thermal stable than the 1 wt% CNWs nanocomposite. Nevertheless, it is less thermally stable than the neat polymeric matrix by 10 °C. It is cited that for nanocomposite materials with carbon as nanofiller in PS matrix, the final product becomes more thermally stable than the pristine polymer with regard to the concentrations of nano-additive above 10 wt%.
Raman spectra of the pristine PS, as well as for the three different nanocomposites, are shown in Figure 7. The spectra of all samples exhibit the two intense peaks at 1601 and 1352 cm−1, which are the characteristic G and D-bands [36] mentioned before. Once again, the graphitization of the samples is unaffected while they are formed to nanocomposites. Specifically, the value of the ID/IG ratio is 0.80, 0.82, and 0.87 for the samples with 1 wt%, 3 wt% and 5 wt% CNWs, respectively. This value is considered almost equal.
In all nanocomposites, the characteristic bands of the PS are dominant. Those peaks are mainly at 3059 and 2908 cm−1. Both are attributed to the C-H bonds’ vibrations. Analytically, the first of these are due to the presence of C-H bonds in the carbon chain, while the second is due to the presence of the same groups presenting at aromatic rings. Additionally, the presence of the band at 1003 cm−1 is from the expanding/contracting “breathe mode” of aromatic C. Finally, the small intensity band at ~1600 cm−1 can be assigned to the double bond of C=C [36].
Figure 8 shows the TEM images of PS-CNWs-3% nanocomposite. Figure 8a,b demonstrate the existence of isolated carbon nanowires in the polymer matrix. The polymer matrix is also presented in the following Figure 8c where the isolated carbon nanowires enhance the folding of the polymer. The width of CNWs seems to be approximately ~5 nm or less (Figure 8a,b,d), and these results are in agreement with AFM microscopy measurements.

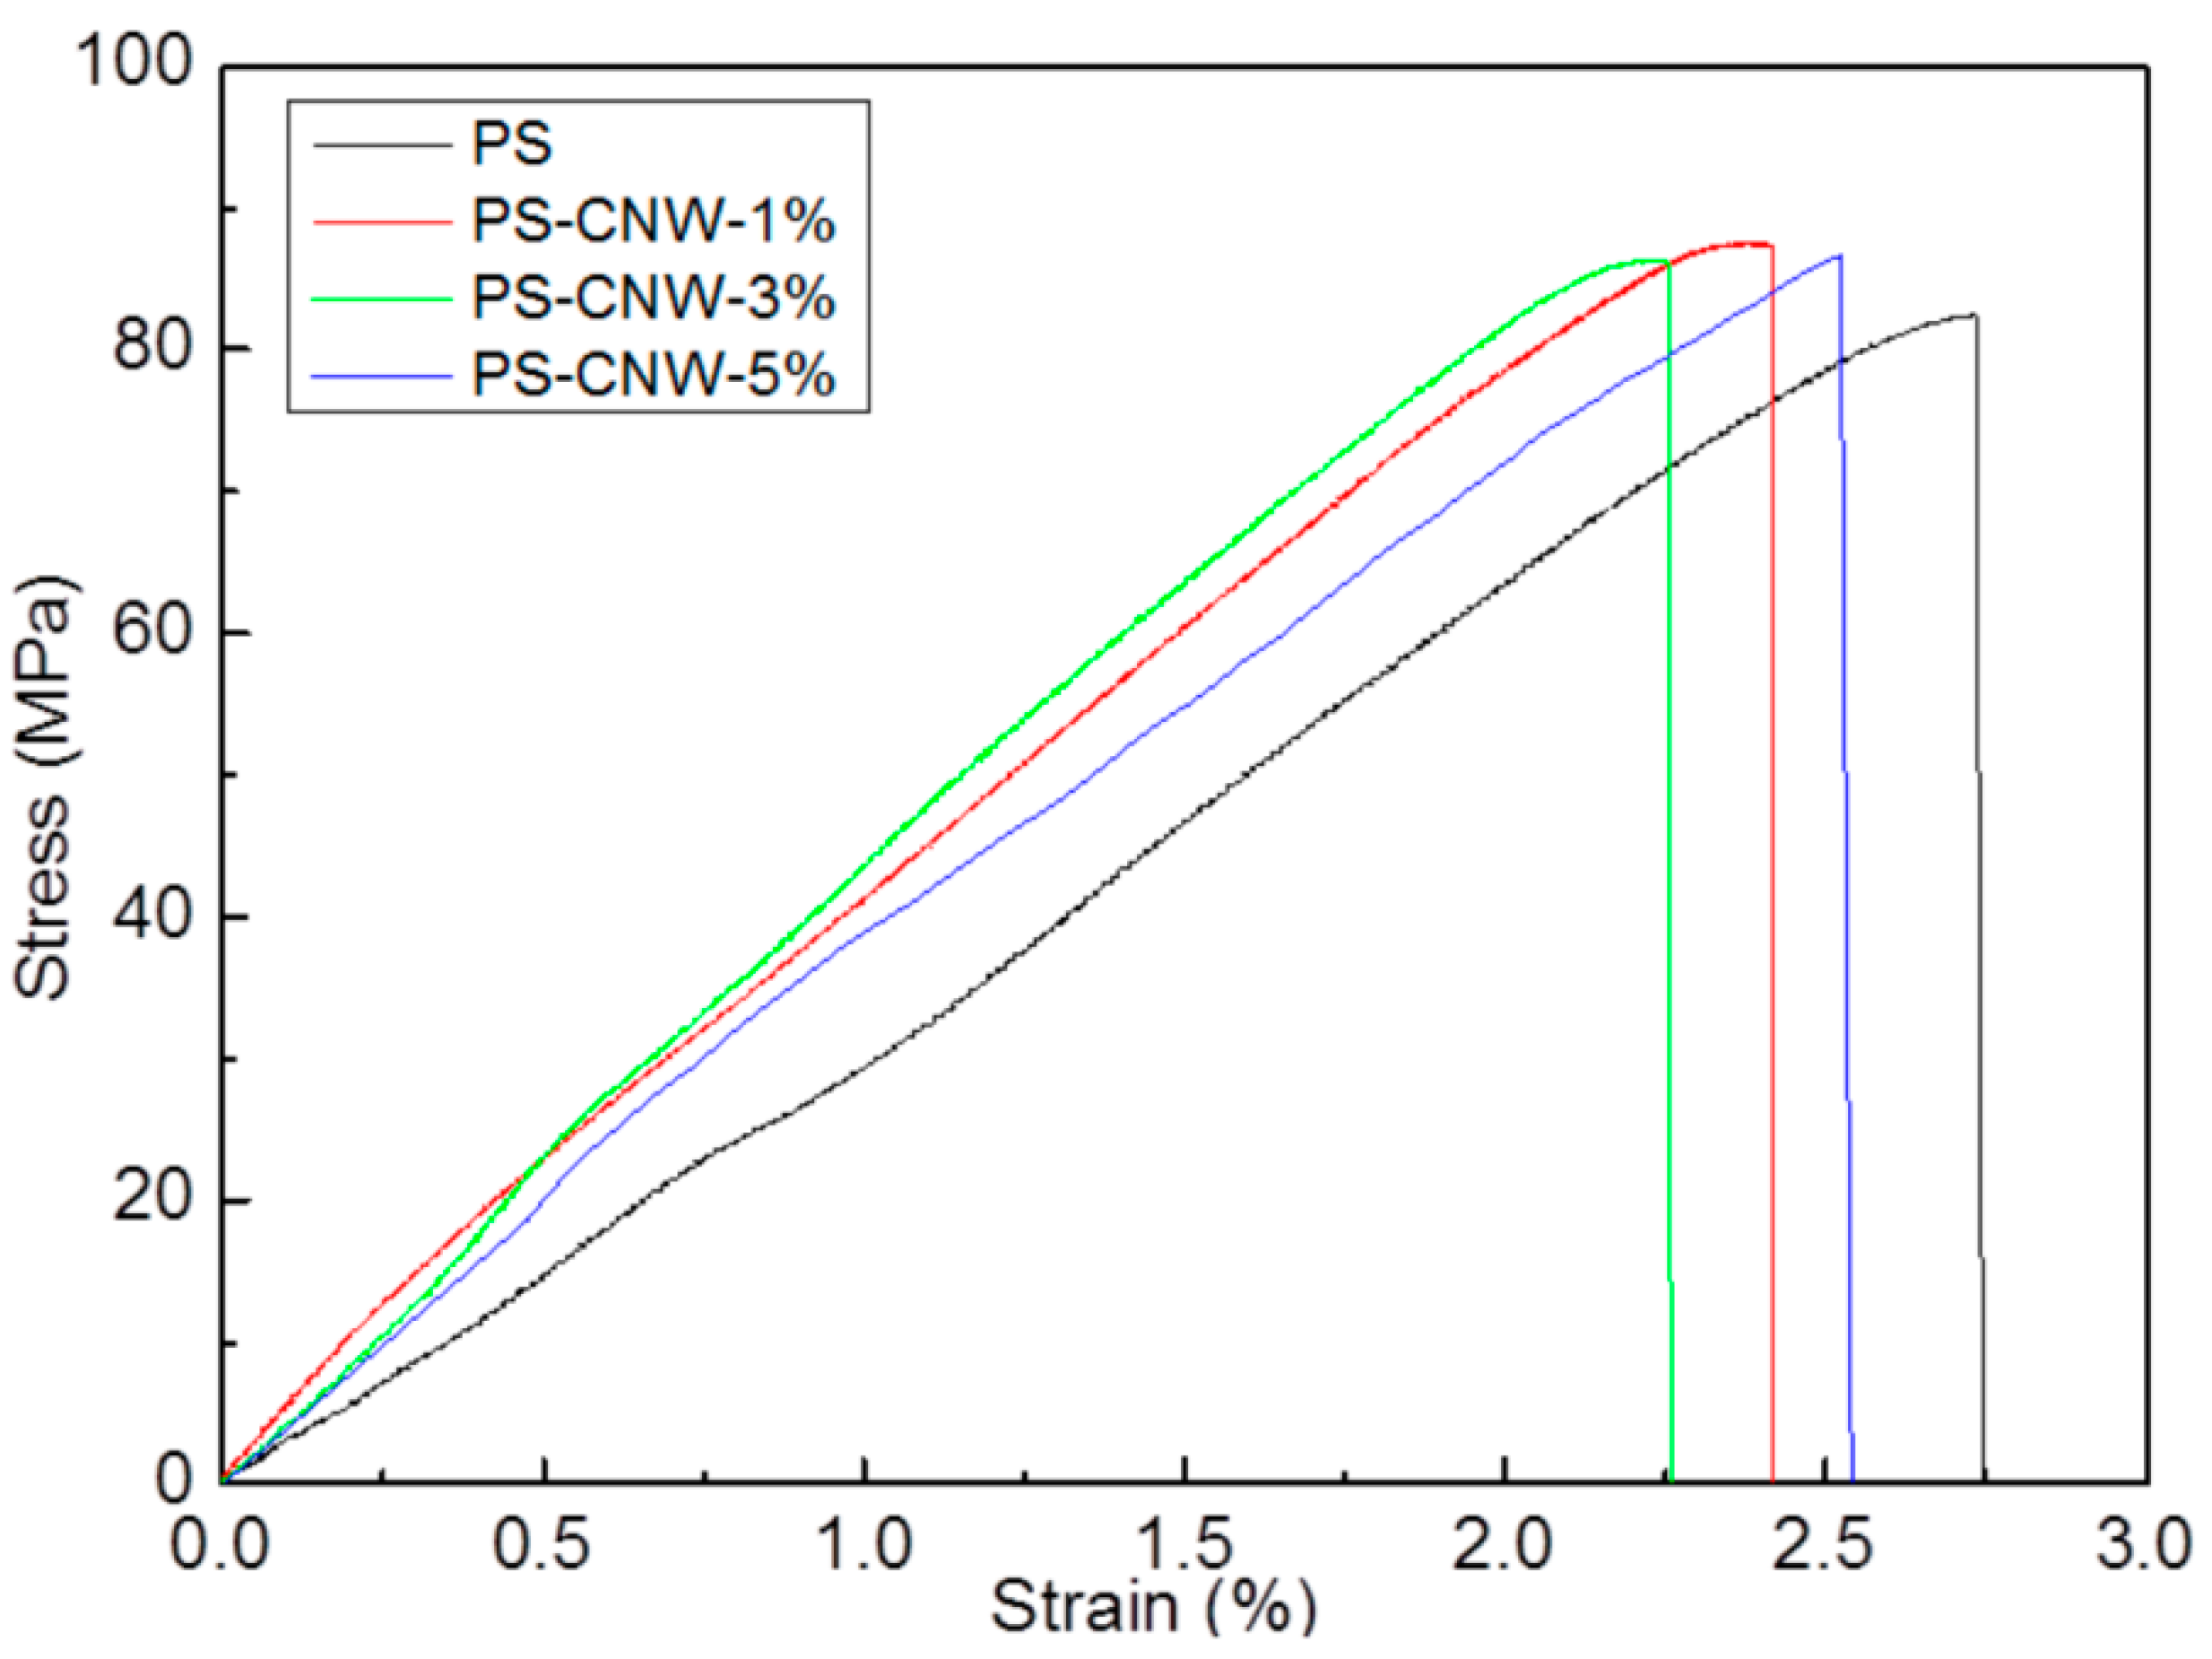
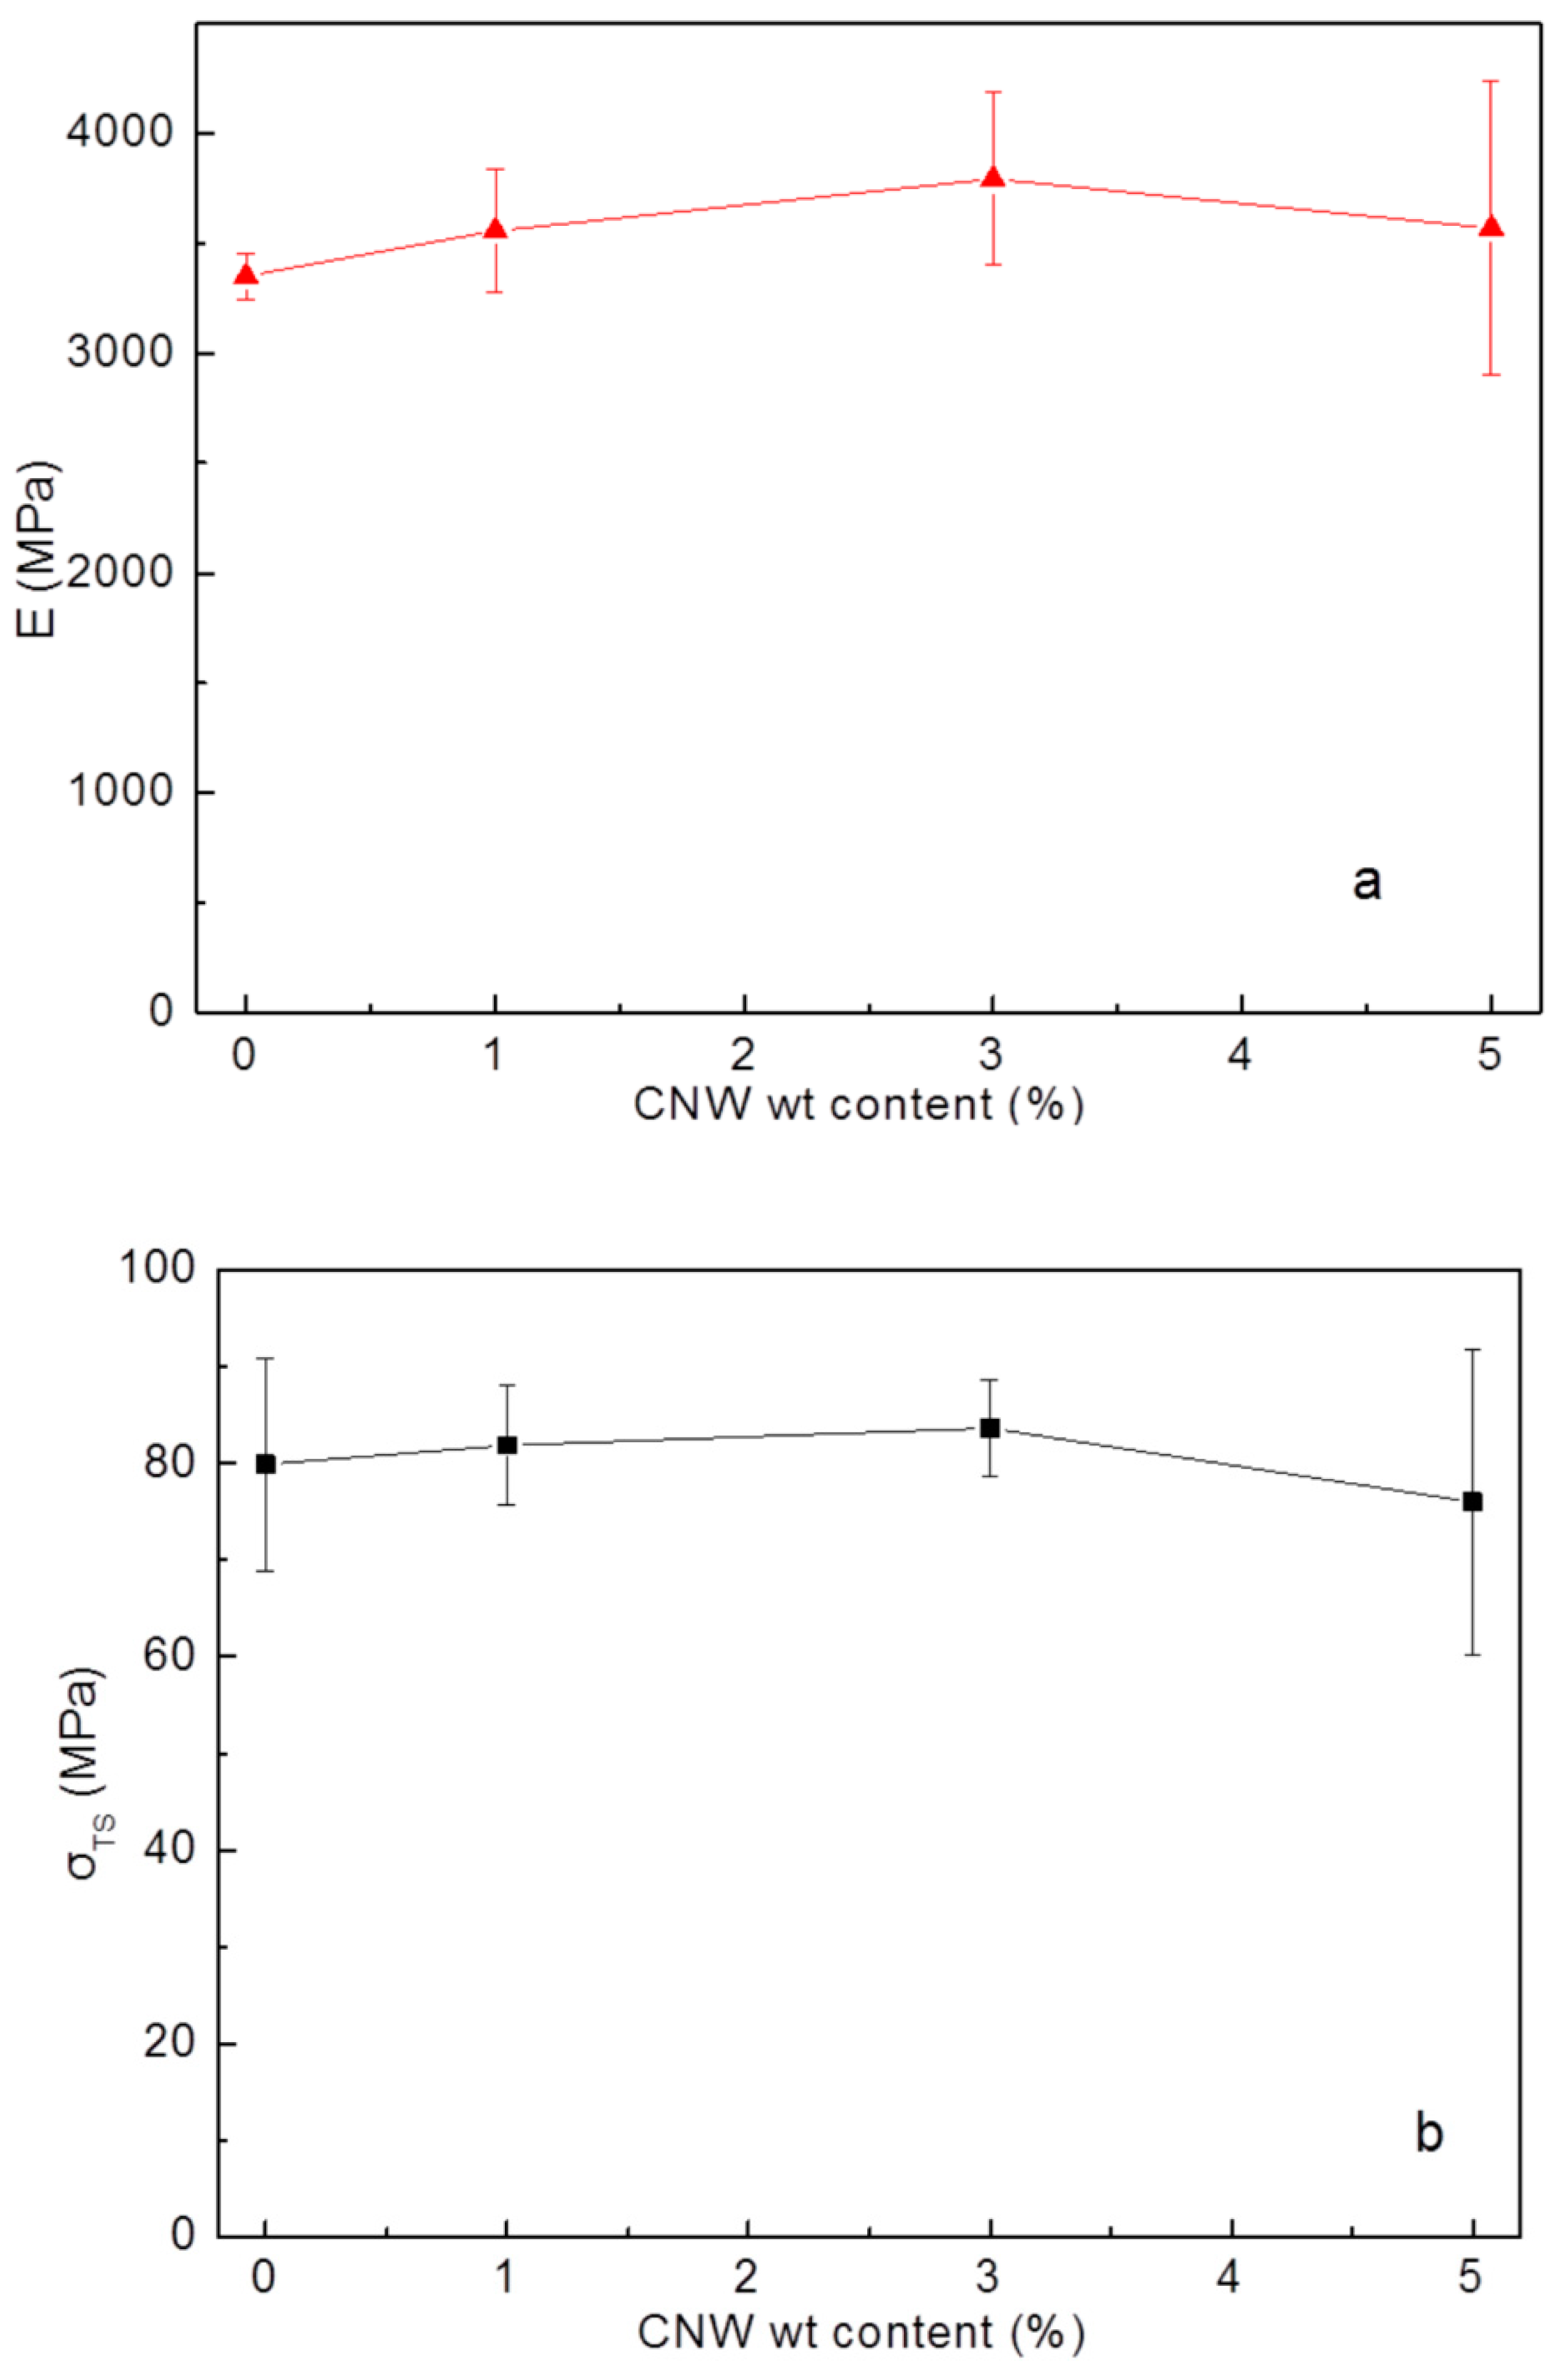
3.3. Mechanical Strength of PS-CNWs Nanocomposites

The mechanical properties of the pristine PS and the corresponding nanocomposites were evaluated with tensile measurements and representative stress-strain curves are presented schematically in Figure 9, while the average values of modulus of elasticity (E), tensile strength (σTS) and strain at break % (εb) are depicted in Table 1.
The representative curves (Figure 9) for the non-modified polymer, as well as for its nanocomposites, are typical of brittle materials, since almost no plastic deformation is observed in all cases. According to these curves, the general trend is an increase in the stiffness and strength and a respective reduction of the strain at the break with nano-reinforcement. As observed, specimens with 1 wt% and 3 wt% CNW behave similarly, while a further increase in CNW content results in lower mechanical enhancement. Based on the values that are presented in Table 1, an up to 13% increase is observed in the stiffness of the samples, the strain at break is reduced by up to approximately 17%, while the tensile strength is fluctuating by the CNWs addition into the polymer.
These trends are better illustrated in the graphs of Figure 10a–c that present the modulus of elasticity (Figure 10a), the tensile strength (Figure 10b), and the elongation at break (Figure 10c) as a function of the CNW weight content. Based on the three graphs, it can be deduced that the best results are obtained after the addition of 3 wt% nanowires.
As discussed in other polymer/nanoparticle systems, the addition of rigid nanoparticles seems to positively affect the modulus of elasticity (stiffness), whereas the values of strength and strain at break depend much more on the effect of nano-addition on the morphology of the sample (change in crystallinity, the orientation of the amorphous phase, etc.) and less on the mechanical properties of the nanoparticles. From the above, we can conclude that the addition of 3% CNWs to the nanocomposite material imparts the maximum increase in stiffness, which is associated with satisfactory dispersion and lack of large aggregates. For higher rates of nano-reinforcement, there is much more difficulty in achieving satisfactory dispersion, which is also confirmed by the large range of values displayed at a 5% addition (high standard deviation). The slight change in the strength of nanocomposite materials can be justified by two competing phenomena, the phenomenon of strength enhancement due to the addition of CNWs and the change in the morphology, where the nanowires lead to the loss of the crystalline structure of the polystyrene chains, degrading the strength.

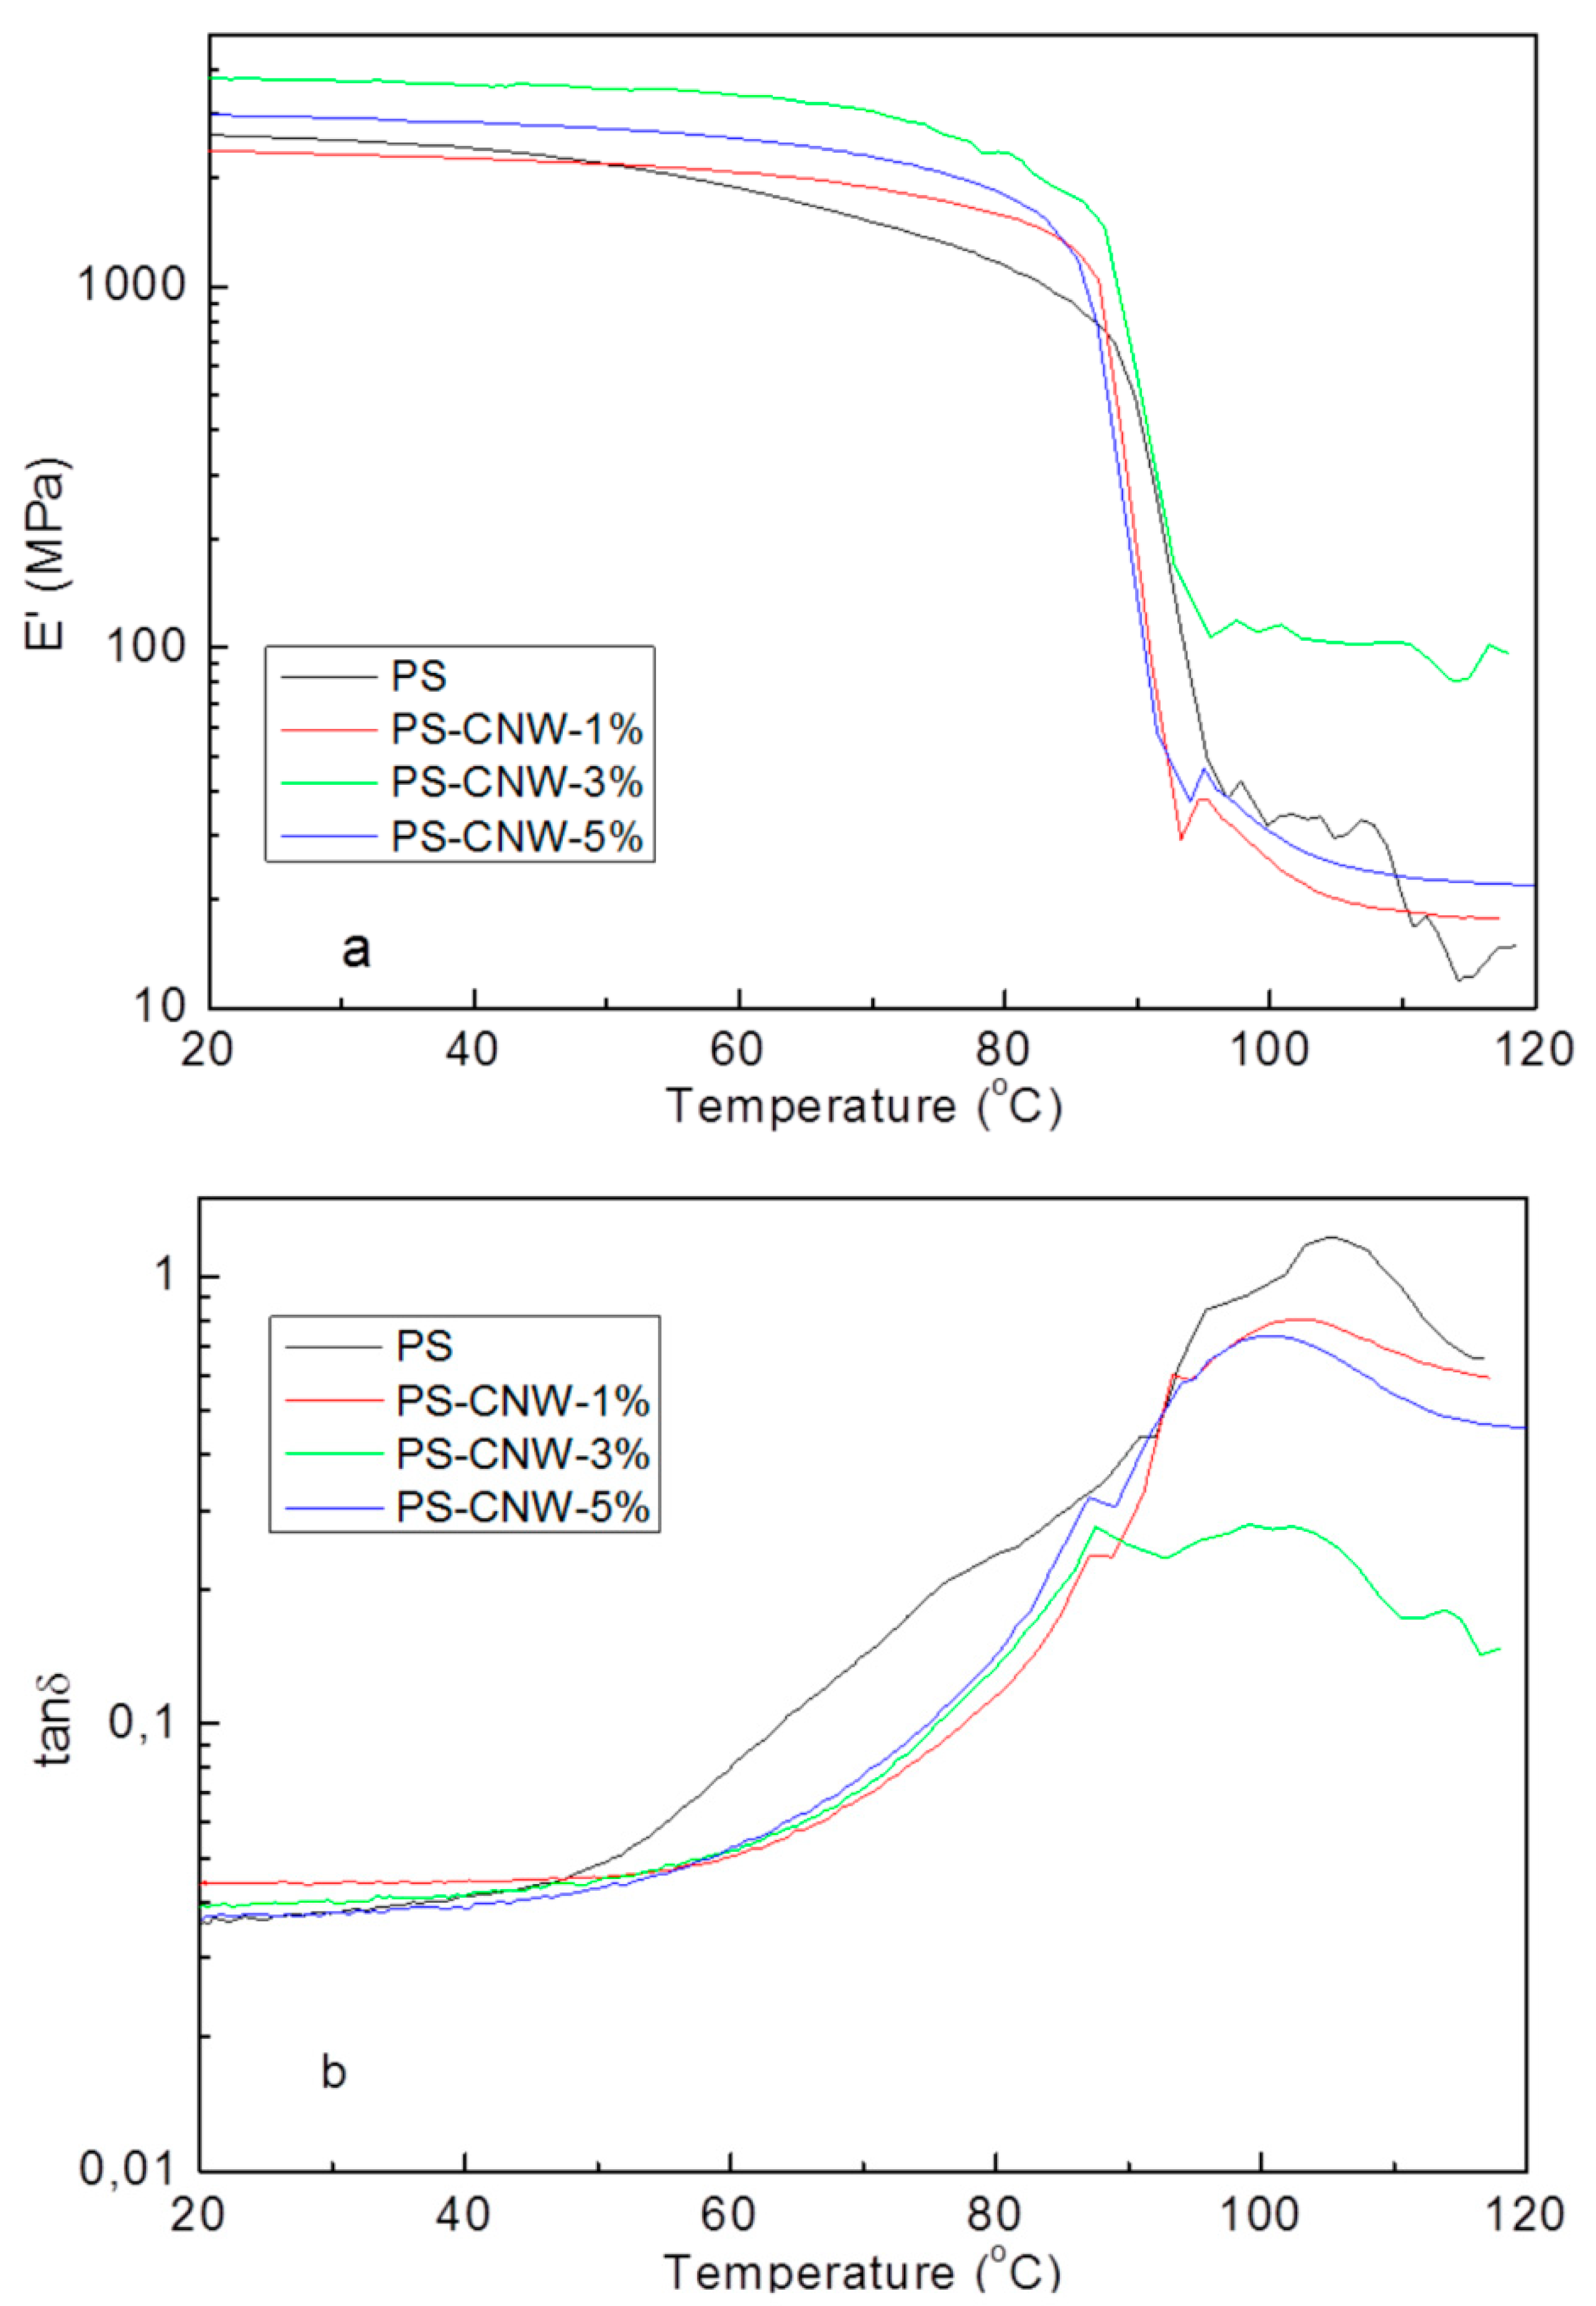
3.4. Thermomechanical Measurements on PS-CNWs Nanocomposites

Dynamic mechanical analysis (DMA) measurements provide information regarding the effect of nano-addition into the polymer chains mobility, the glass transition temperature (Tg), as well as the storage modulus (E’), loss modulus (E”) and loss factor (tanδ) of a polymer above and below the Tg [37]. The results of the DMA measurements are presented in Figure 11 and in Table 2.
As observed pristine PS exhibits a decrease in E’ starting at app. 50 °C. The lowering of the E’ of the un-reinforced PS is also observed as a shoulder in the tanδ curve (Figure 11b) located in the range of 60–80 °C, i.e., at temperatures well below the Tg of the PS, associated with some side groups movement, such as phenyl groups.
Based on Figure 11, it is obvious that the addition of nanowires results in alteration of the thermomechanical response of the PS matrix, both in terms of E’ and tanδ. As observed in Figure 11a, CNW-based PS nanocomposites retain a constant E’ up to app. 80 °C, where the transition from the glassy to the rubbery state begins. Contrary to plain PS, CNW reinforced specimens do not present any shoulder in their tanδ spectra in the respective area. It seems that CNW particles interact with the sidechains of PS restricting their mobility, and only one main transition (the one associated with the Tg) is being observed. The higher the CNW content, the higher is the value of E’ in the glassy state. This increase is more pronounced for CNW contents of 3% and 5 wt%. It is also important to note that PS-CNWs-3%, even after the glass transition (rubbery state) exhibits much higher values in E’ (~100 MPa) compared to other samples, having E’ ~20–30 MPa. The pronounced increase in E’ in both the glassy and the rubbery state for a 3% reinforcement, demonstrates the good interaction of the nanowires with the PS matrix, thus creating a strong interface that leads to a clear reduction of chain mobility both below and above the Tg. The increase in E’ for T < Tg, (i.e., the matrix is a pure solid from a mechanical point of view), is simply explained based on what generally happens when reinforcing solid matrices with fibers, CNTs, etc. The increased modulus of elasticity in the rubbery state means that there are also some quite strong matrix-nanowires connections, and these connections contribute to the modulus of elasticity of the material as equivalent to the cross-linking of the matrix. These results agree with the stiffness ones, confirming the vital role of dispersion in the thermo-mechanical performance of the nanocomposites.
As seen in Figure 11b, the Tg for the PS prior to the addition of carbon nanowires may be positioned at 105 °C (main transition), or perhaps slightly lower, to a relatively satisfactory agreement with the literature [38]. In parallel, the addition of CNWs seems to decrease the glass transition temperature by ~3 °C, at least if we accept that differences in temperatures of the maximum tanδ reflect differences in the Tg value (Table 2). In this case, one usually resorts to interpret the alleged lowering the Tg, in reference to the Tg dependence on the molecular weight of the chains (which herein may be reduced, for obscure reasons, by the presence of nanowires) and the possible presence of small molecule impurities [39]. However, in the present case, it is preferable to avoid referring to a hypothetical specific reason of “lowering of the Tg” because the temperature difference of 3 °C (Table 2), combined with the much higher peak tanδ range, allows for a variety of interpretations of chain relaxation and Tg.

4. Conclusions

Novel carbon nanowires were synthesized via hard template method and display unique prototype features with worm like structure and diameter smaller than 5 nm. New polystyrene nanocomposites based on the novel carbon nanowires were synthesized with three different nano-additive loadings (1%, 3%, and 5%). The nanocomposites have slightly lower thermal stability (~10 °C) than the neat-PS and gradually improved while increasing of CNWs loading until 3 wt%. The best mechanical properties were observed for the nanocomposite with 3 wt% loading CNWs, while for the 5 wt% nanocomposite was difficult to achieve satisfactory dispersion of carbon nanowires and consequently have a wide range of values.

Author Contributions

Investigation, V.K., M.B., A.K., A.A., A.G., D.G.; Conceptualization, M.A.K.; writing—original draft preparation, V.K., M.A.K.; writing—review and editing, M.B., N.-M.B.; supervision, M.A.K.; project administration, M.A.K.; formal analysis, N.-M.B. All authors have read and agreed to the published version of the manuscript.

Funding

We acknowledge support of this work by the project ‘‘National Infrastructure in Nanotechnology, Advanced Materials and Micro-/Nanoelectronics” (MIS 5002772) which is implemented under the Action ‘‘Reinforcement of the Research and Innovation Infrastructure”, funded by the Operational Programme ‘‘Competitiveness, Entrepreneurship and Innovation” (NSRF 2014-2020).

Conflicts of Interest

The authors declare no conflict of interest.

References

  1. Crosby, A.J.; Lee, J.Y. Polymer Nanocomposites: The “Nano” Effect on Mechanical Properties. Polym. Rev. 2007, 47, 217–229. [Google Scholar] [CrossRef]
  2. Yang, Y.; Gupta, M.C.; Dudley, K.L.; Lawrence, R.W. Novel Carbon Nanotube−Polystyrene Foam Composites for Electromagnetic Interference Shielding. Nano Lett. 2005, 5, 2131–2134. [Google Scholar] [CrossRef] [PubMed]
  3. Xu, B.; Fu, Y.Q.; Ahmad, M.; Luo, J.K.; Huang, W.M.; Kraft, A.; Reuben, R.; Pei, Y.T.; Chen, Z.G.; De Hosson, J.T.M. Thermo-mechanical properties of polystyrene-based shape memory nanocomposites. J. Mater. Chem. 2010, 20, 3442–3448. [Google Scholar] [CrossRef]
  4. Umek, P.; Huskić, M.; Škapin, A.S.; Florjančič, U.; Zupančič, B.; Emri, I.; Arčon, D. Structural and mechanical properties of polystyrene nanocomposites with 1D titanate nanostructures prepared by an extrusion process. Polym. Compos. 2009, 30, 1318–1325. [Google Scholar] [CrossRef]
  5. Suresh, K.; Kumar, M.; Pugazhenthi, G.; Uppaluri, R. Enhanced mechanical and thermal properties of polystyrene nanocomposites prepared using organo-functionalized NiAl layered double hydroxide via melt intercalation technique. J. Sci. Adv. Mater. Devices 2017, 2, 245–254. [Google Scholar] [CrossRef]
  6. Moskalyuk, O.A.; Belashov, A.V.; Beltukov, Y.M.; Ivan’kova, E.M.; Popova, E.N.; Semenova, I.V.; Yelokhovsky, V.Y.; Yudin, V.E. Polystyrene-based nanocomposites with different fillers: Fabrication and mechanical properties. arXiv 2020, arXiv:2005.03360, 1–2. [Google Scholar]
  7. Thostenson, E.T.; Chou, T.W. On the elastic properties of carbon nanotube-based composites: Modelling and characterization. J. Phys. D Appl. Phys. 2003, 36, 573–582. [Google Scholar] [CrossRef]
  8. Fragneaud, B.; Masenelli-Varlot, K.; Gonzalez-Montiel, A.; Terrones, M.; Cavaillé, J.Y. Mechanical behavior of polystyrene grafted carbon nanotubes/polystyrene nanocomposites. Compos. Sci. Technol. 2008, 68, 3265–3271. [Google Scholar] [CrossRef] [Green Version]
  9. Poncharal, P.; Wang, Z.L.; Ugarte, D.; De Heer, W.A. Electrostatic deflections and electromechanical resonances of carbon nanotubes. Science 1999, 283, 1513–1516. [Google Scholar] [CrossRef] [Green Version]
  10. Okamoto, M.; Morita, S.; Taguchi, H.; Kim, Y.H.; Kotaka, T.; Tateyama, H. Synthesis and structure of smectic clay/poly(methyl methacrylate) and clay/polystyrene nanocomposites via in situ intercalative polymerization. Polymer 2000, 41, 3887–3890. [Google Scholar] [CrossRef]
  11. Haider, S.; Kausar, A.; Muhammad, B. Overview of various sorts of polymer nanocomposite reinforced with layered silicate. Polym. Plast. Technol. Eng. 2016, 55, 723–743. [Google Scholar] [CrossRef]
  12. Stankovich, S.; Dikin, D.A.; Dommett, G.H.B.; Kohlhaas, K.M.; Zimney, E.J.; Stach, E.A.; Piner, R.D.; Nguyen, S.T.; Ruoff, R.S. Graphene-based composite materials. Nature 2006, 442, 282–286. [Google Scholar] [CrossRef] [PubMed]
  13. Ren, P.G.; Yan, D.X.; Chen, T.; Zeng, B.Q.; Li, Z.M. Improved properties of highly oriented graphene/polymer nanocomposites. J. Appl. Polym. Sci. 2011, 121, 3167–3174. [Google Scholar] [CrossRef]
  14. Morales-Teyssier, O.; Sánchez-Valdes, S.; Ramos-de Volle, L.F. Effect of carbon nanofiber functionalization on the dispersion and physical and mechanical properties of polystyrene nanocomposites. Macromol. Mater. Eng. 2006, 291, 1547–1555. [Google Scholar] [CrossRef]
  15. Shi, D.; Lian, J.; He, P.; Wang, L.M.; Xiao, F.; Yang, L.; Schulz, M.J.; Mast, D.B. Plasma coating of carbon nanofibers for enhanced dispersion and interfacial bonding in polymer composites. Appl. Phys. Lett. 2003, 83, 5301–5303. [Google Scholar] [CrossRef] [Green Version]
  16. Kresge, C.T.; Leonowicz, M.E.; Roth, W.J.; Vartuli, J.C.; Beck, J.S. Ordered mesoporous molecular sieves synthesized by a liquid-crystal template mechanism. Nature 1992, 359, 710–712. [Google Scholar] [CrossRef]
  17. Dimos, K.; Koutselas, I.B.; Karakassides, M.A. Synthesis and Characterization of ZnS Nanosized Semiconductor Particles within Mesoporous Solids. J. Phys. Chem. B 2006, 110, 22339–22345. [Google Scholar] [CrossRef]
  18. Baikousi, M.; Bourlinos, A.B.; Douvalis, A.; Bakas, T.; Anagnostopoulos, D.F.; Tuček, J.; Šafářová, K.; Zboril, R.; Karakassides, M.A. Synthesis and Characterization of γ-Fe2O3/Carbon Hybrids and Their Application in Removal of Hexavalent Chromium Ions from Aqueous Solutions. Langmuir 2012, 28, 3918–3930. [Google Scholar] [CrossRef]
  19. Staudenmaier, L. Verfahren zur Darstellung der Graphitsäure. Ber. Dtsch. Chem. Ges. 1898, 31, 1481–1487. [Google Scholar] [CrossRef] [Green Version]
  20. Bourlinos, A.B.; Gournis, D.; Petridis, D.; Szabó, T.; Szeri, A.; Dékány, I. Graphite Oxide:  Chemical Reduction to Graphite and Surface Modification with Primary Aliphatic Amines and Amino Acids. Langmuir 2003, 19, 6050–6055. [Google Scholar] [CrossRef]
  21. Enotiadis, A.; Litina, K.; Gournis, D.; Rangou, S.; Avgeropoulos, A.; Xidas, P.; Triantafyllidis, K. Nanocomposites of Polystyrene-b-Poly(isoprene)-b-Polystyrene Triblock Copolymer with Clay–Carbon Nanotube Hybrid Nanoadditives. J. Phys. Chem. B 2013, 117, 907–915. [Google Scholar] [CrossRef] [PubMed]
  22. Zhao, D.; Huo, Q.; Feng, J.; Chmelka, B.F.; Stucky, G.D. Nonionic triblock and star diblock copolymer and oligomeric sufactant syntheses of highly ordered, hydrothermally stable, mesoporous silica structures. J. Am. Chem. Soc. 1998, 120, 6024–6036. [Google Scholar] [CrossRef]
  23. Bourlinos, A.B.; Karakassides, M.A.; Stathi, P.; Deligiannakis, Y.; Zboril, R.; Dallas, P.; Steriotis, T.A.; Stubos, A.K.; Trapalis, C. Pyrolytic formation of a carbonaceous solid for heavy metal adsorption. J. Mater. Sci. 2011, 46, 975–982. [Google Scholar] [CrossRef]
  24. Sokoll, R.; Hobert, H. Infrared study of the adsorption of octadecylamine at the MgO/CCl4 interface. A comparison with investigations of the adsorption of octadecylamine on SiO2 and Al2O3. J. Chem. Soc. Faraday Trans. 1 Phys. Chem. Condens. Phases 1986, 82, 1527–1535. [Google Scholar] [CrossRef]
  25. Chen, Y.; Tao, J.; Ezzeddine, A.; Mahfouz, R.; Al-Shahrani, A.; Alabedi, G.; Khashab, N. Superior Performance Nanocomposites from Uniformly Dispersed Octadecylamine Functionalized Multi-Walled Carbon Nanotubes. C J. Carbon Res. 2015, 1, 58–76. [Google Scholar] [CrossRef] [Green Version]
  26. Wang, C.; Liu, Z.; Wang, S.; Zhang, Y. Preparation and properties of octadecylamine modified graphene oxide/styrene-butadiene rubber composites through an improved melt compounding method. J. Appl. Polym. Sci. 2016, 133. [Google Scholar] [CrossRef]
  27. McIntosh, G.J.; Metson, J.B. Surface area characteristics of furfuryl-alcohol-derived inverse opal carbons produced from silica inverse opal templates. J. Mater. Sci. 2016, 51, 2573–2584. [Google Scholar] [CrossRef]
  28. Tan, S.; Zou, W.; Jiang, F.; Tan, S.; Liu, Y.; Yuan, D. Facile fabrication of copper-supported ordered mesoporous carbon for antibacterial behavior. Mater. Lett. 2010, 64, 2163–2166. [Google Scholar] [CrossRef]
  29. Rinki, K.; Dutta, P.K.; Hunt, A.J.; MacQuarrie, D.J.; Clark, J.H. Chitosan aerogels exhibiting high surface area for biomedical application: Preparation, characterization, and antibacterial study. Int. J. Polym. Mater. Polym. Biomater. 2011, 60, 988–999. [Google Scholar] [CrossRef]
  30. P’Yanova, L.G.; Baklanova, O.N.; Likholobov, V.A.; Drozdov, V.A.; Salanov, A.N.; Talzi, V.P.; Sedanova, A.V.; Knyazheva, O.A. Studies of the effect of surface modification of carbon sorbents by poly-N-vinylpyrrolidone using a complex of physicochemical and microbiological methods. Prot. Met. Phys. Chem. Surf. 2013, 49, 430–439. [Google Scholar] [CrossRef]
  31. Kim, T.W.; Park, I.S.; Ryoo, R. A synthetic route to ordered mesoporous carbon materials with graphitic pore walls. Angew. Chem. Int. Ed. 2003, 42, 4375–4379. [Google Scholar] [CrossRef] [PubMed]
  32. Mendoza, J.D. ISU MatE453/MSE 553—Lab 3 FTIR. Available online: https://slideplayer.com/slide/4495580/ (accessed on 18 August 2020).
  33. Grassie, N. Chemistry of High Polymer Degradation Processes. L. Butterworths Publ. 1956, 335. [Google Scholar]
  34. Still, R.H. Some problems associated with the application of thermal methods to polymers. Br. Polym. J. 1979, 11, 101–114. [Google Scholar] [CrossRef]
  35. Dauengauer, S.A.; Utkina, O.G.; Popova, G.S.; Sazanov, Y.N. Investigation of thermal degradation of polystyrene with the aid of thermal analysis. J. Therm. Anal. 1987, 32, 311–314. [Google Scholar] [CrossRef]
  36. Vinu, A.; Srinivasu, P.; Takahashi, M.; Mori, T.; Balasubramanian, V.V.; Ariga, K. Controlling the textural parameters of mesoporous carbon materials. Microporous Mesoporous Mater. 2007, 100, 20–26. [Google Scholar] [CrossRef]
  37. Panagiotou, K. Science and Technology of Polymers; Pegasus: Thessaloniki, Greece, 2006. [Google Scholar]
  38. Rieger, J. The glass transition temperature of polystyrene. Results of a round robin test. J. Therm. Anal. 1996, 46, 965–972. [Google Scholar] [CrossRef]
  39. Amr, I.T.; Al-Amer, A.; Selvin, T.P.; Al-Harthi, M.; Girei, S.A.; Sougrat, R.; Atieh, M.A. Effect of acid treated carbon nanotubes on mechanical, rheological and thermal properties of polystyrene nanocomposites. Compos. Part B Eng. 2011, 42, 1554–1561. [Google Scholar] [CrossRef]
Figure 1. FT-infrared spectra of samples: carbon nanowires (CNWs), oxidized CNWs (CNWs-ox) and CNWs-ODA.
Applsci 10 05737 g001
Figure 2. Differential thermal (DTA) (a) and thermogravimetric analysis (TGA) (b) curves of CNWs and CNWs-ODA samples.
Applsci 10 05737 g002
Figure 3. (a) Raman spectra of CNWs, CNWs-ox and CNWs-ODA samples; (b) normalized spectra; and (c) spectra analyzed to Gaussian profiles.
Applsci 10 05737 g003aApplsci 10 05737 g003b
Figure 4. Images from atomic force microscopy (AFM) of the CNWs sample (right) and its topographical profile in (a,b).
Applsci 10 05737 g004aApplsci 10 05737 g004b
Figure 5. Fourier-transform infrared (FT-IR) spectra of samples: neat polystyrene (PS), PS-CNWs-1%, PS-CNWs-3% and PS-CNWs-5% samples.
Applsci 10 05737 g005
Figure 6. DTA (a) and TGA (b) curves of neat PS and two nanocomposites at 1 and 5% CNWs concentration.
Applsci 10 05737 g006
Figure 7. Raman spectra of neat PS, PS-CNWs-1%, PS-CNWs-3% and PS-CNWs-5% samples.
Applsci 10 05737 g007
Figure 8. Transmission electron microscopy (TEM) images of PS-CNWs-3% nanocomposite (ad).
Applsci 10 05737 g008
Figure 9. Stress–strain diagrams for the nanocomposite samples as well as for the pristine polymer.
Applsci 10 05737 g009
Figure 10. Diagrams of (a) modulus of elasticity (E), (b) tensile strength (σTS) and (c) strain at break (εb) as a function of the weight fraction of the nano-additive into the samples.
Applsci 10 05737 g010aApplsci 10 05737 g010b
Figure 11. Diagrams of (a) storage modulus (E’) and (b) loss factor (tanδ) of the nanocomposites and the pristine material.
Applsci 10 05737 g011
Table 1. Stiffness, strength and deformation in fracture of nanocomposites PS-CNWs with different rates of nano-additive, as well as the pristine PS, are presented the mean values and the standard deviations.
SampleConcentration of CNWs (%)Stiffness (MPa)Tensile Strength (MPa)Distortion to Breakage (%)
PS03349 ± 10779.87 ± 11.022.86 ± 0.19
PS-CNWs-1%13557 ± 27881.90 ± 6.232.56 ± 0.21
PS-CNWs-3%33792 ± 39483.63 ± 5.042.64 ± 0.31
PS-CNWs-5%53568 ± 66976.00 ± 15.772.38 ± 0.62
Table 2. Values of glass transition temperature (Tg) and storage modulus at 40 °C and 110 °C, of the nanocomposites PS-CNWs with different addition rate and the pristine.
SampleConcentration of CNWs (%)Tg (°C)Storage Modulus @ 40 °C (MPa)Storage Modulus @ 110 °C (MPa)
PS0105241820
PS-CNWs-1%1102226119
PS-CNWs-3%31013608102
PS-CNWs-5%5100284823

