Article

Mixing Performance Analysis of Orbitally Shaken Bioreactors

1
Department of Chemical Engineering and Biotechnology, National Taipei University of Technology, Taipei 10608, Taiwan
2
College of Mechatronics and Control Engineering, Shenzhen University, Shenzhen 518000, China
3
LI-COR Biosciences, Cambridge CB4 0WS, UK
*
Authors to whom correspondence should be addressed.
Appl. Sci. 2020, 10(16), 5597; https://doi.org/10.3390/app10165597
Submission received: 6 July 2020 / Revised: 6 August 2020 / Accepted: 8 August 2020 / Published: 12 August 2020
(This article belongs to the Section Applied Industrial Technologies)

Abstract

:

Featured Application

Orbitally shaken bioreactors (OSBs) are the most frequently used type of bioreactor in the synthesis of polyhydroxyalkanoates from bacteria or algae or the extraction of biomolecules from biomass for bioprocess development. Their success can be attributed to their simple and functional design, which make shaking systems suitable for a large number of cost-efficient parallel experiments. Recently reported findings for power-input, in-phase and out-of-phase operation and mixing in OSBs are summarized in this article. Novel mixing-time monitoring techniques for the control of mixing conditions in shake flasks, Erlenmeyer flasks and microwell plates are described. The methods for characterizing mixing conditions and the novel mixing time online measurement techniques that are summarized in this article can be utilized to tap the full potential of OSB systems. A new set of correlations for the Newton (power) number and mixing time when liquid motion was induced in the OSB that can be considered as being fully validated on scale-up.

Abstract

This study investigated the efficacy of a novel correlation of power input, energy dissipation rate and mixing time as a potential route to identify the orbitally shaken bioreactor (OSB) system. The Buckingham’s π-theorem was used to designate and transform dimensionless Newton numbers with five relevant power input variables. These variables were empirically varied to evaluate the correlation among the dimensionless numbers. The Newton number decreases with the increased shaking frequency and filling volume. Previous work has focused on optimizing the mixing process by evaluating different shaking and agitation mixing methods. We establish a new mixing process and assessable measurement of the mixing time in the OSB. An innovative explanation of mixing time for the thermal method is proposed. The optimal mixing time is independent of the temperature of filled liquid. The dimensionless mixing number remained constant in the turbulent regime and increasing with the increased liquid viscosity and filling volume. Our findings revealed that the observed correlation is a practical tool to figure the power consumption and mixing efficiency as cell cultivation in all OSB scales and is fully validated when scaling–up system.

Graphical Abstract

1. Introduction

Mammalian cell cultures play a crucial role in the biopharmacy industry and are an efficient way to obtain pharmaceutical protein, which is in increasing demand. Bioreactors are an important piece of equipment for mammalian cell cultivation, which indicates that the development of the bioengineering industry is largely determined by bioreactors capability. There are several types of bioreactors with different agitating principles. Stirred-tank bioreactors (STRs) are the most traditional bioreactor design, which has been fully developed and its largest scale can be up to 20,000 L. Air lift bioreactors employ moving gas bubbles with a high speed to agitate the fluid in the bioreactor, which can produce a high shear stress resulting in mammalian cell death. Wave bioreactors can mix the fluid efficiently, but this type of bioreactor is difficult to scale up due to the cumbersome mechanical system and its largest scale is only about 500 L. Recently, orbitally shaken bioreactors (OSRs) have become increasingly popular in processing cell cultures because of its simple agitating principle, low-cost, ease of operation and suitability for single use experiments. Nowadays, the CHO cells cultivation with 2000 L in OSRs was reported and this type of bioreactor is considered as the most promising candidate to take the place of STRs. Prior to their general adoption by industry, large-scale industrial mixing tanks were used in the early stages of bioprocess development, such as microbial fermentation, biotransformation and recycling technologies. A microscale method depends on the utilization of shaken microtiter plates. On a shaken microtiter plate, full mixing is accomplished by shaking, rather than stirring. Shake flask bioreactors are cost-effective and simple to operate. They are available in 25-mL to six-liter volume sizes, different geometries and materials of construction [1], but limited to batch system, mass transfer, scale-up and real-time monitoring [2]. Platas et al. [3] identified the specific growth rate to shake flask process parameters of specific power consumption, mixing time, maximum fluid velocity and Reynolds number. High-throughput shaking bioreactors are more flexible than conventional stirred-tank bioreactors, which are less automated and restricted to off-line sampling due to their small volume capacity [4]. Table 1 summarizes the relation between the experimental throughput and the level of monitoring and control required for an effective cell cultivation process. Mixing and oxygen-mass transfer are both enhanced by shaking. The rate of both processes is influenced by the geometry of the flask, the fill volume and the intensity of shaking (frequency and amplitude of shaking) [5]. Compared to conventional stirred-tank bioreactors [4], the advantages of shaking bioreactors are ease of operation, lower material requirement and capital investment, higher throughput and lower labor requirement. However, the disadvantages are lower oxygen-mass transfer efficiency, less accessible to monitoring and control, scale-up criteria not well established and lower information content per experiment.
Shaken bioreactors were comprehensively utilized in the early stages of bioprocess development and microscale plates (24-, 48-, 96- or 384-orifice discs) facilitated a significant number of experiments. The shaker (25 mL–6 L) was the most widely used orbitally shaken bioreactor (OSB) type, providing a cost-effective system that is effective for a broad range of applications [8,9,10,11,12,13,14]. Orbital-shake bioreactors are universally utilized for small-scale screening and process adjustment. Complicated mechanical and electronic components of the shaken table drive, the power supply and the control unit are integrated into the shaken plate and are therefore independent of the reactor. This makes the reactor design simple and cost-effective, not only for many small-scale parallel experiments, but also for general one-time applications. Klöckner et al. [15] proposed a simplified design, reducing complexity and improving the accessibility of serviceable parts such as rotating impellers and baffles. Klöckner and Büchs [6] demonstrate adequate performance with regards to measured oxygen transfer capacity values for larger than 500 rpm high shaking frequencies and three and six-millimeter-low shaking diameters, which were conducted in different microtiter plate materials in combination with polystyrene and deionized water.
The design of the bioreactor is divided into two aspects, namely, power consumption and mixing efficiency. Power consumption is the most essential significant parameter describing flow regime and mass transfer characteristics in designing and operating bioreactors. The local power consumption of the reactor refers to the external input energy required to keep the fluid motion, and the magnitude of the local power consumption represents the power output of the power system of the reactor in each case. In addition, local power consumption can also reflect the intensity of fluid motion inside the reactor to a certain extent. In general, the more intense the fluid movement, the stronger the material mixing uniformity, but the greater the fluid shear force, increasing the risk of cell death. Therefore, the analysis of the local power consumption of bioreactors can often make a comprehensive analysis of cell growth metabolism problems such as substance mixing and cell damage. The power is transmitted during the shaking process, and different measurement systems are described to determine the average unit volume power (P/VL) of the cylindrical bioreactor. The specific P/VL is one of the basic parameters for microbial process scale-up and scale-down. Parameters that directly affect biological culture, such as oxygen supply, mixing and dispersion of hydraulic stress or organic fluid phases are reliant on specific power inputs [1]. The consequences of changing flask size, shaking frequency and filling volume in relation to observed viscosity change over time during the fermentation process is well documented [15,16]. During the fermentation process viscosity of the ferment increases, necessitating an increase in power input to maintain consistent mixing [17]. The P/VL values in the cylindrical shaken disposable (single-use) reactor ranged from 0 to 2 kW/m3 which depend on liquid viscosity, the filling quantity and shaking frequency. Klöckner et al. [18] introduced current power input correlations as a possible way to describe for the hydrodynamics of the news systems described above. A set of related power-consumption variables is demonstrated with Buckingham’s π-theorem and converts them to dimensionless Newton numbers. The related numbers are experimentally altered to evaluate the relationship between Reynolds and Froude numbers. A simple correlation is developed for P/VL with seven variables to verify with the 200 L and 2000 L orbitally shaken bioreactors application. During cell culture fermentation at all scales, the power input and hydrodynamics for cylindrical orbitally shaken bioreactor systems can be predicted using this effective, established correlation tool.
Mixing efficiency is a key engineering aspect of the bioreactor because it ensures the homogeneity of the culture ferment [19]. An understanding of the characteristics of mixing are therefore necessary to determine any regions of heterogeneity within the bioreactor and gauge resulting concentration gradients that cells may encounter. For the direct method of mixing efficiency determination used the measurement of the mixing time in the bioreactor, which is designated as the time desired to accomplish a certain degree of homogeneity in the liquid [20]. Mixing time measurement methodologies can be distinguished into local and global technologies by the measured volume. The local methods relied on physical measurements (pH, temperature or conductivity) with intrusive probes at specific point. The global approach is not intrusive and depends either on chemically based reactions and/or optical measurement of different mixing regions in the reactor [21,22,23]. However, global approaches are usable only in transparent vessels and are less accurate than local methods.
Exact mixing time measurement is essential to minimize the concentration gradient that will be harmful to the cell culture in a shaken reactor [24]. Several different methods have been developed for the measurement of mixing time: conductivity or pH method, thermal method, color addition or decolorization methods [25,26]. Tan et al. [26] utilized the colorimetric method to measure the mixing time. The reported mixing time was the same for both 25- and 50-mm shaken-flask diameter. The dimensionless mixing number remains constant and is independent of the given geometry of the flasks under high Reynolds numbers region. Tan et al. [26] utilized a single indicator system to gauge the mixing time in the Erlenmeyer shaken flasks. Tissot et al. [27] used a two pH indicators technique to measure the mixing time in the shaken cylindrical vessels, concluding that the orbital diameter had no symbolic effect on the mixing time in the shaken flask. The fastest diffused mixing area was determined to be in the lower region of the flask. At a low shaking frequency, two different zones could be divided inside the reactor. The first zone is close to the free surface where mixing was increased by convection, and the second zone is in the lower region of the cylinder where mixing was driven by diffusion. Rodriguez et al. [28,29] compared the orbitally shaken bioreactor and the Erlenmeyer flask with a stirred tank, measuring mixing time and classifying two mixing mechanisms; in-phase and out-of-phase. Mixing time was accurately determined using a dual indicator system (DISMT) to optimize and minimize concentration gradients for harmful cell cultures prevention. For more efficient mixing, the feeding pipe was inserted near the reactor wall and the outside of the vertical structure close to the center of the reactor. Weheliye et al. [30] indicated the correspondence of the flow transition phenomena at 10-cm inner diameters and 13-cm fluid heights different cylindrical bioreactors. The results also show the feed-pipe position affected the mixing time in the cylindrical reactor. For both systems, it is suggested to insert the pipe near walls with higher shear stress close to the boundary layer of the wall. The highest/lowest sides of the torus are regularly coordinated with the centrifugal acceleration of the shaker table that shifts its direction as phase angle of table increases. The two vortices expand over the whole cylinder height and finally control the flow inside the bioreactor at 110 rpm shaking frequency.
Hoogendoorn and Hartog [25] studied the batch mixing of viscous liquids with rotary mixers in 0.24 and 1.8 m diameter vessels. Power input and mixing time were the measured parameters. Mixing time measurements were made using discoloration and thermal-response techniques, both of them generating reproducible, quantitative data. For some agitators in the real viscous flow region, the mixing time is inversely proportional to the agitator speed. The mixers could be compared in terms of power number and mixing number based on liquid viscosity and density, power consumption, mixing time and vessel diameter. Havas et al. [31] used the conductivity method, thermal method and color addition method to measure mixing time. Experiments were executed in a 396-mm-diameter tank with basket-curve bottom and a 529-mm-diameter tank with plain bottom. They found the most suitable method according to thermal pulse disturbance. The mixing number is the product of mixing time and the rotation speed of the agitator. Neither the temperature and the place of thermal pulse disturbance, nor the location of the measuring point has a significant effect on the mixing time which the dimensionless mixing number is independent of high Reynolds number (Re > 104) within the turbulence range [31,32]. The mixing number of the VEGYTERV propeller has been investigated as a function of tank to agitator diameter ratio; Shiue and Wong [32] also found the same phenomena of 6-flat-blade turbine agitator. The mixing number depends on the low Reynolds number (Re ˂ 100) of the reduced form [33] in the condition of gate type anchor impellers and multi-paddle agitators.
When the mixing time remains the same in the bioreactor at different scales, the P/VL increases with two-thirds of the volume of the bioreactor [28]. Because high-volume power inputs are harmful to cells and do not require a constant mixing time to use as a scale up standard for mammalian cell culture of slow biologic reactions [30,31], which usually introduces concentration gradients forming and longer mixing times in large-scale bioreactors [31,32]. To improve the transport phenomenon, the dimensionless group is usually utilized in the mixing from small scale to large bioreactors [33,34]. The dimensional analysis principally presents that the dimensionless mixing number relies on Reynolds number and Froude number. On the other hand, bioreactors installed with baffles to escape vortex formation, and it is reasoned to be a function of Re as the free surface is nearly flat in laminar or transition flow systems [35]. However, for an orbital shaken reactor system acting with a non-flat free surface or with a vortex, Fr must also be considered as it describes the role of fluctuations on the free surface [36].
In stirred-tank bioreactor (STBs) cells, the high maximum power input value occurs at the stirrer tip and the bubble aeration foaming of the medium may result in high shear force. In comparison, as a result of the power input distribution and the generalization of the bubble-free surface aeration, the shearing stress in OSBs is much lower. The mixing principle and the shear issue associated with STRs is well known to engineers [37,38,39,40], but results from studies with STBs cannot be applied to OSBs due to their agitating principle difference. Moreover, considering OSRs are relatively novel, the influence of crucial engineering parameters on bioreactor capability is yet to be well defined. This study aims to perform the mixing of Newtonian liquids in the turbulent regions of batched orbital shaken cylindrical bioreactors, describing the influences of various operating parameters on the power input and mixing time investigation at volumetric scales up to 20 L. Dimensionless Newton numbers and mixing number with regards to power consumption, mixing time, shaking frequency, bioreactor diameter, and fluid physical properties were utilized to determine power input and mixing time, and thereby mixing efficiency.

2. Materials and Methods
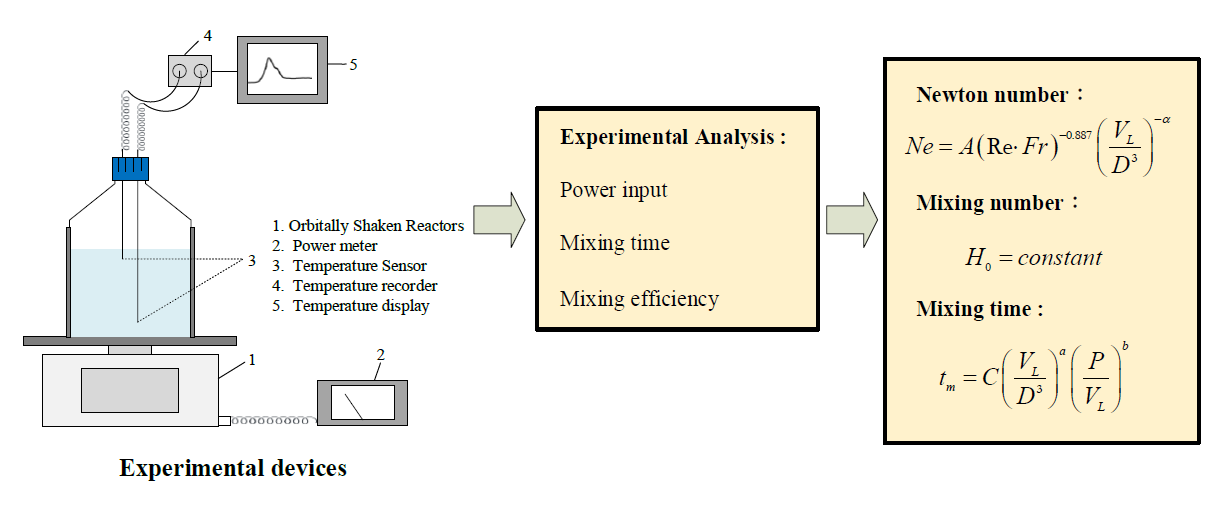
2.1. Equipment

The experiment was performed using in a 20-L (28-cm-diameter × 51-cm height) cylindrical orbitally shaken bioreactor (Collect International Company) as described in Figure 1. The solutions utilized in this study include tap water and 5, 10 vol% and 20 vol% glycerin in water. All chemicals are industrial grade; Table 2 lists the viscosity and density of these solutions nearly Newtonian flow behavior. All measurements were performed at shaking frequencies of 80 rpm to 120 rpm, with filling volumes from 4 L to 10 L; shaking diameters of 3.2 cm, specifically adapted to mammalian cell culture processing.

2.2. Power Method for Power Consumption Determination

Experimental research on the local power consumption of the shaken bioreactor is based on the power functional method, with the specific steps during the experiment as follows:
  • The rotary shaking machine (rotating oscillator model: RTO-34) is firmly fixed to a frame [14]. The shaking table power input is regulated using a power meter (Arepu AR78-2, maximum loading power: 2200 w). The sealed vessel filled with a predetermined solution volume (4 L, 6 L, 8 L, 10 L) is placed on the rotary shaken platform. Measurements of the required power and speed data for shaking are recorded and saved on a personal computer [18];
  • Operate the closed vessel where the liquid moving is not permitted and then the electric power Pc is determined by multiplying the voltage and current values;
  • Operate the open vessel where the liquid can move freely and then the electric power Po is calculated using the same method as step 2;
  • From the measured power consumption and the shaking frequency of the shaker drive (shaking diameter = 3.2 cm) local power consumption of P/VL under this condition is determined [14,38,39,40,41]:
P V L = P O P C V L

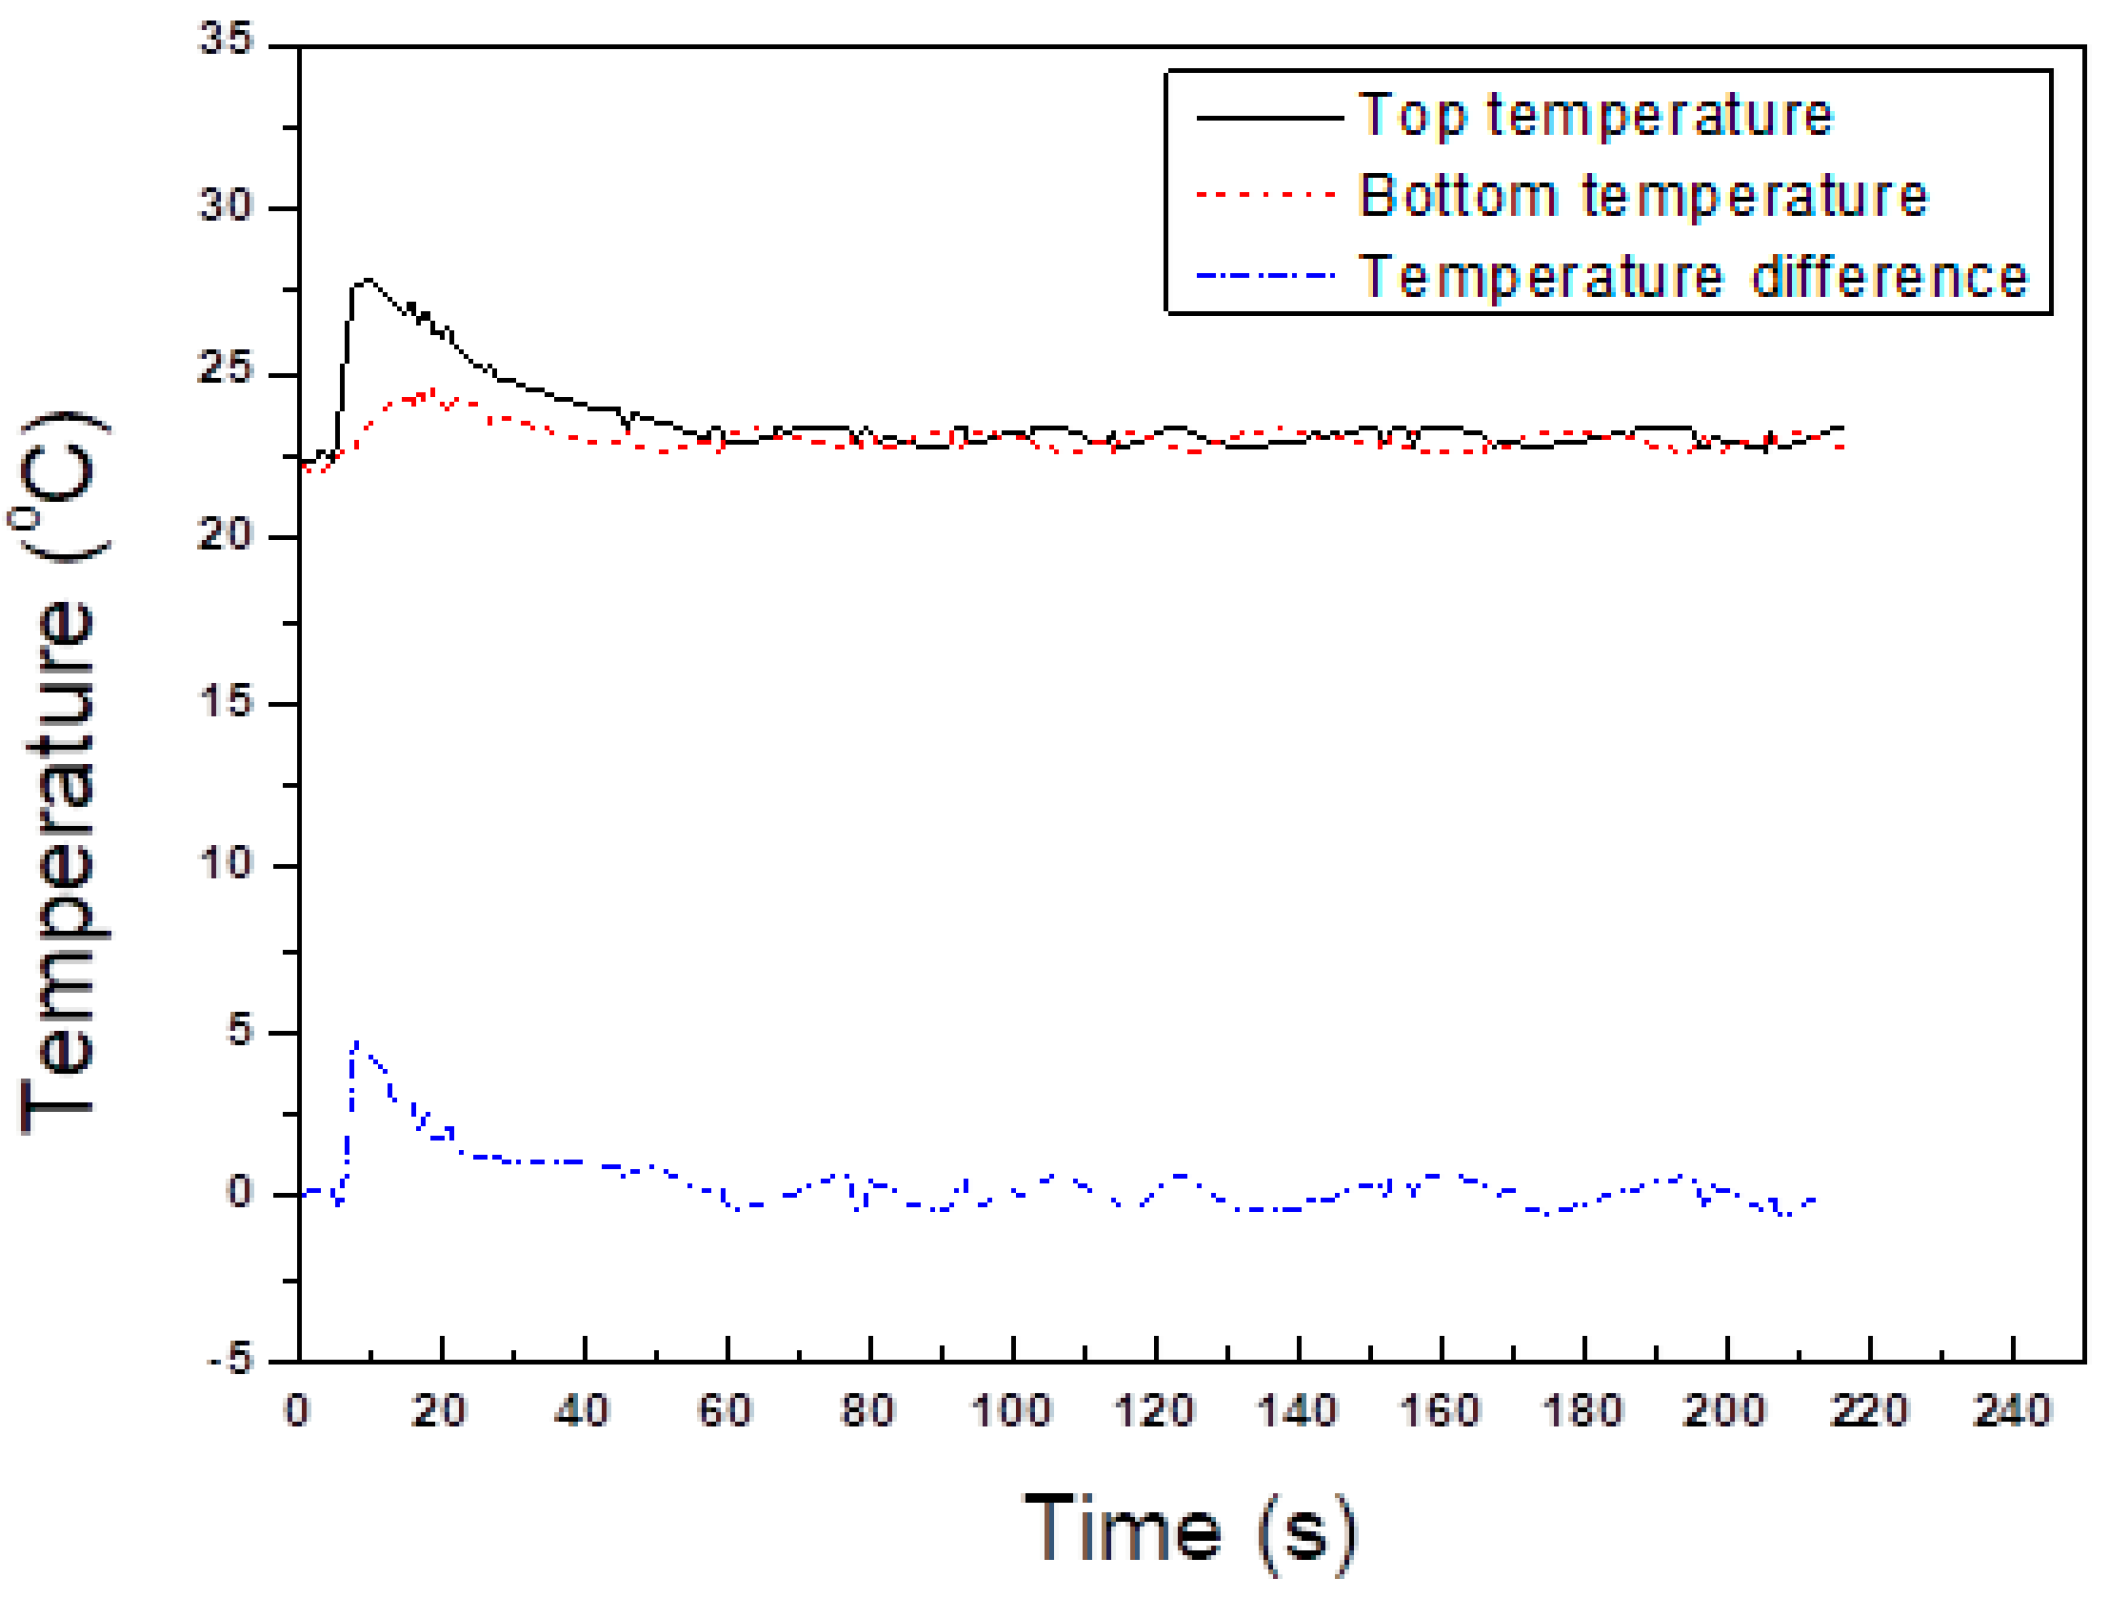
2.3. Temperature Method for Mixing Time Determination

A high temporal resolution, calibrated data logger with two external temperature probes (Commeter U0121) coupled with personal computer were used to measure the temperature difference and mixing time of two points within a bioreactor [25,31,32,33,42,43]. To test the accuracy of this measurement technique, elementary experiments were carried out by setting two temperature probes in different locations as shown in Figure 1. The lower probe was placed at a distance of 0.12 m from the wall and 10 mm from the bottom of the reactor, while the upper temperature probe was located 10 mm below the liquid level at a distance of 0.14 m from the wall of the reactor. The probes location permitted an understanding of mixing dynamics within the reactor volume during mixing operation. The bridge temperature probes were utilized for high sensitivity to measure temperature differences approximate to 0.1 °C, and the temperature difference was recorded and calculated by the computer as a function of time. The quantitative data show there is no significant effect on the homogenization time of the turbulence area at the measuring point. Thermal pulse disturbance was used to the system by pouring into 2% of the same heated solution (60–70 °C) mixed at the midpoint of the liquid surface in the reactor. The temperature was controlled at 25 °C.

2.4. Theory

A dimensionless Newton number (Ne) related to the ratio of power resistance to inertial forces. It is utilized to represent the power input in the reactor. The Newton number of the power input is as follows [15]:
N e = P ρ N 3 D 4 V L 1 / 3
where P is power consumption, ρ is liquid density, N is shaking frequency, D is vessel diameter, VL is filling volume.
The dimensionless Froude number (Fr) calculated using the ratio of inertial force to gravity. While the fluid is orbital moved in the shaken bioreactor, the number of free flow due to the centrifugal force of gravity acceleration must be modified to the radial direction ratio. The calculation of the axial Froude number is as follows [16]:
F r = 2 ( π N ) 2 D g
where g is gravitational acceleration.
The dimensionless Reynolds number (Re) in fluid mechanics is a measurement of the ratio of inertial force to viscous force. The calculation of Reynolds number is as follows [15]:
Re = ρ N D 2 η
where η is dynamic viscosity of fluid.
The mixing number (Ho) is also known as the homogenization number [44], which is designated as the product of the mixing time and the shaking frequency and represents the shaking frequency required to achieve a given uniformity.
H o = N t m
where tm is mixing time.
The correlation between volume power consumption and mixing time as follows [45]:
t m = C 1 ( P V L ) c
where C1 and c are the constant and exponent, respectively.
The mixed effective number is the computational mixing efficiency of the reactor [46]:
C e = P v t
where Pv is the power consumption of unit volume, t is shaking time.

3. Results

Based on the number of variables to set up the new power input correlation for the Newton number (power number), the new mixing time correlation with volumetric number and volumetric power consumption and compare the mixing efficiency of different liquids and filling liquid volumes in the following relevant subsections. The intended correlation is a practical tool to figure the power input and mixing efficiency as cell cultivation in all OSB scales.

3.1. Power Input Correlation

3.1.1. Local Power Consumption

Power is transmitted during the shaking owing to the friction between the rotating liquid volume and the OSB wall. Different measurement systems used to determine the average power consumption in a OSB are introduced. A simple and efficient measurement of power consumption can be achieved by integrating a power meter in the OSB [15,18]. The method also permits online monitoring of power consumption during biological culture. However, integrating power meter into OSB is complex and requires a redesign of the OSB. The power consumption values in the cylindrical shaken reactor range from 37.1 W to 29.85 W, relying on the shaking frequency, filling volume and liquid viscosity. At 80 to 120 rpm shaking frequency, the filling volume for 20 L vessel influences local power consumption. Figure 2 shows local power consumption increases with the increased shaking frequency [14,15,41,47,48,49,50], but decreases with the increased filling volume [14,15,47,49] to be well mixed in-phase bulk liquid motion [49,51] as the friction surface between the OSB wall and the liquid is not proportional to the filling volume and consistent with the research of Büchs and Zoels [38] at shaking frequencies 50 to 400 rpm in 250-mL Erlenmeyer flasks in a 1 kg L−1 density organic dispersed phase of a mixture of four volumetric parts toluene and one part carbon tetrachloride. That power consumption significantly increases with viscosity in the case of 4 L filling volume is confirmed by the research of Büchs et al. [16] and Peter et al. [50] at the shaking frequency of 80 rpm to 300 rpm in a 300-mL baffled shake flasks using different viscosities polyvinylpyrrolidone (PVP) and shaking diameters of 100 mm. This is consistent with the research of Klöckner and Büchs [52] at shaking frequencies 80 to 300 rpm in 250-mL shake flasks, 40 mL filling volume and 25-mm shaking diameter in a viscous range of PVP. In case of 6 L to 10 L filling volume that the power consumption is found to decreases with viscosity. Nevertheless, the shaking device is quickly accelerated, a low level of power consumption is reached away from a specific shaking frequency. Decreasing the shaking frequency below a critical value of 90 rpm suddenly produce increase in power consumption reaching the standard level again [48]. The order of magnitude of the power consumption was shown with respect to shaking frequency and filling volume [53,54]. Power consumption exponentially increased with increasing shaking frequency [55]. The functional correlation between power consumption and shaking frequency is verified [14,51,56]
P = A N a
where A is the coefficient, a is the exponent is determined by experiments.
a is approximately 0.34 with a coefficient of determination greater than 0.9992 in a 20 L vessel with different fill volumes as shown Figure 2.

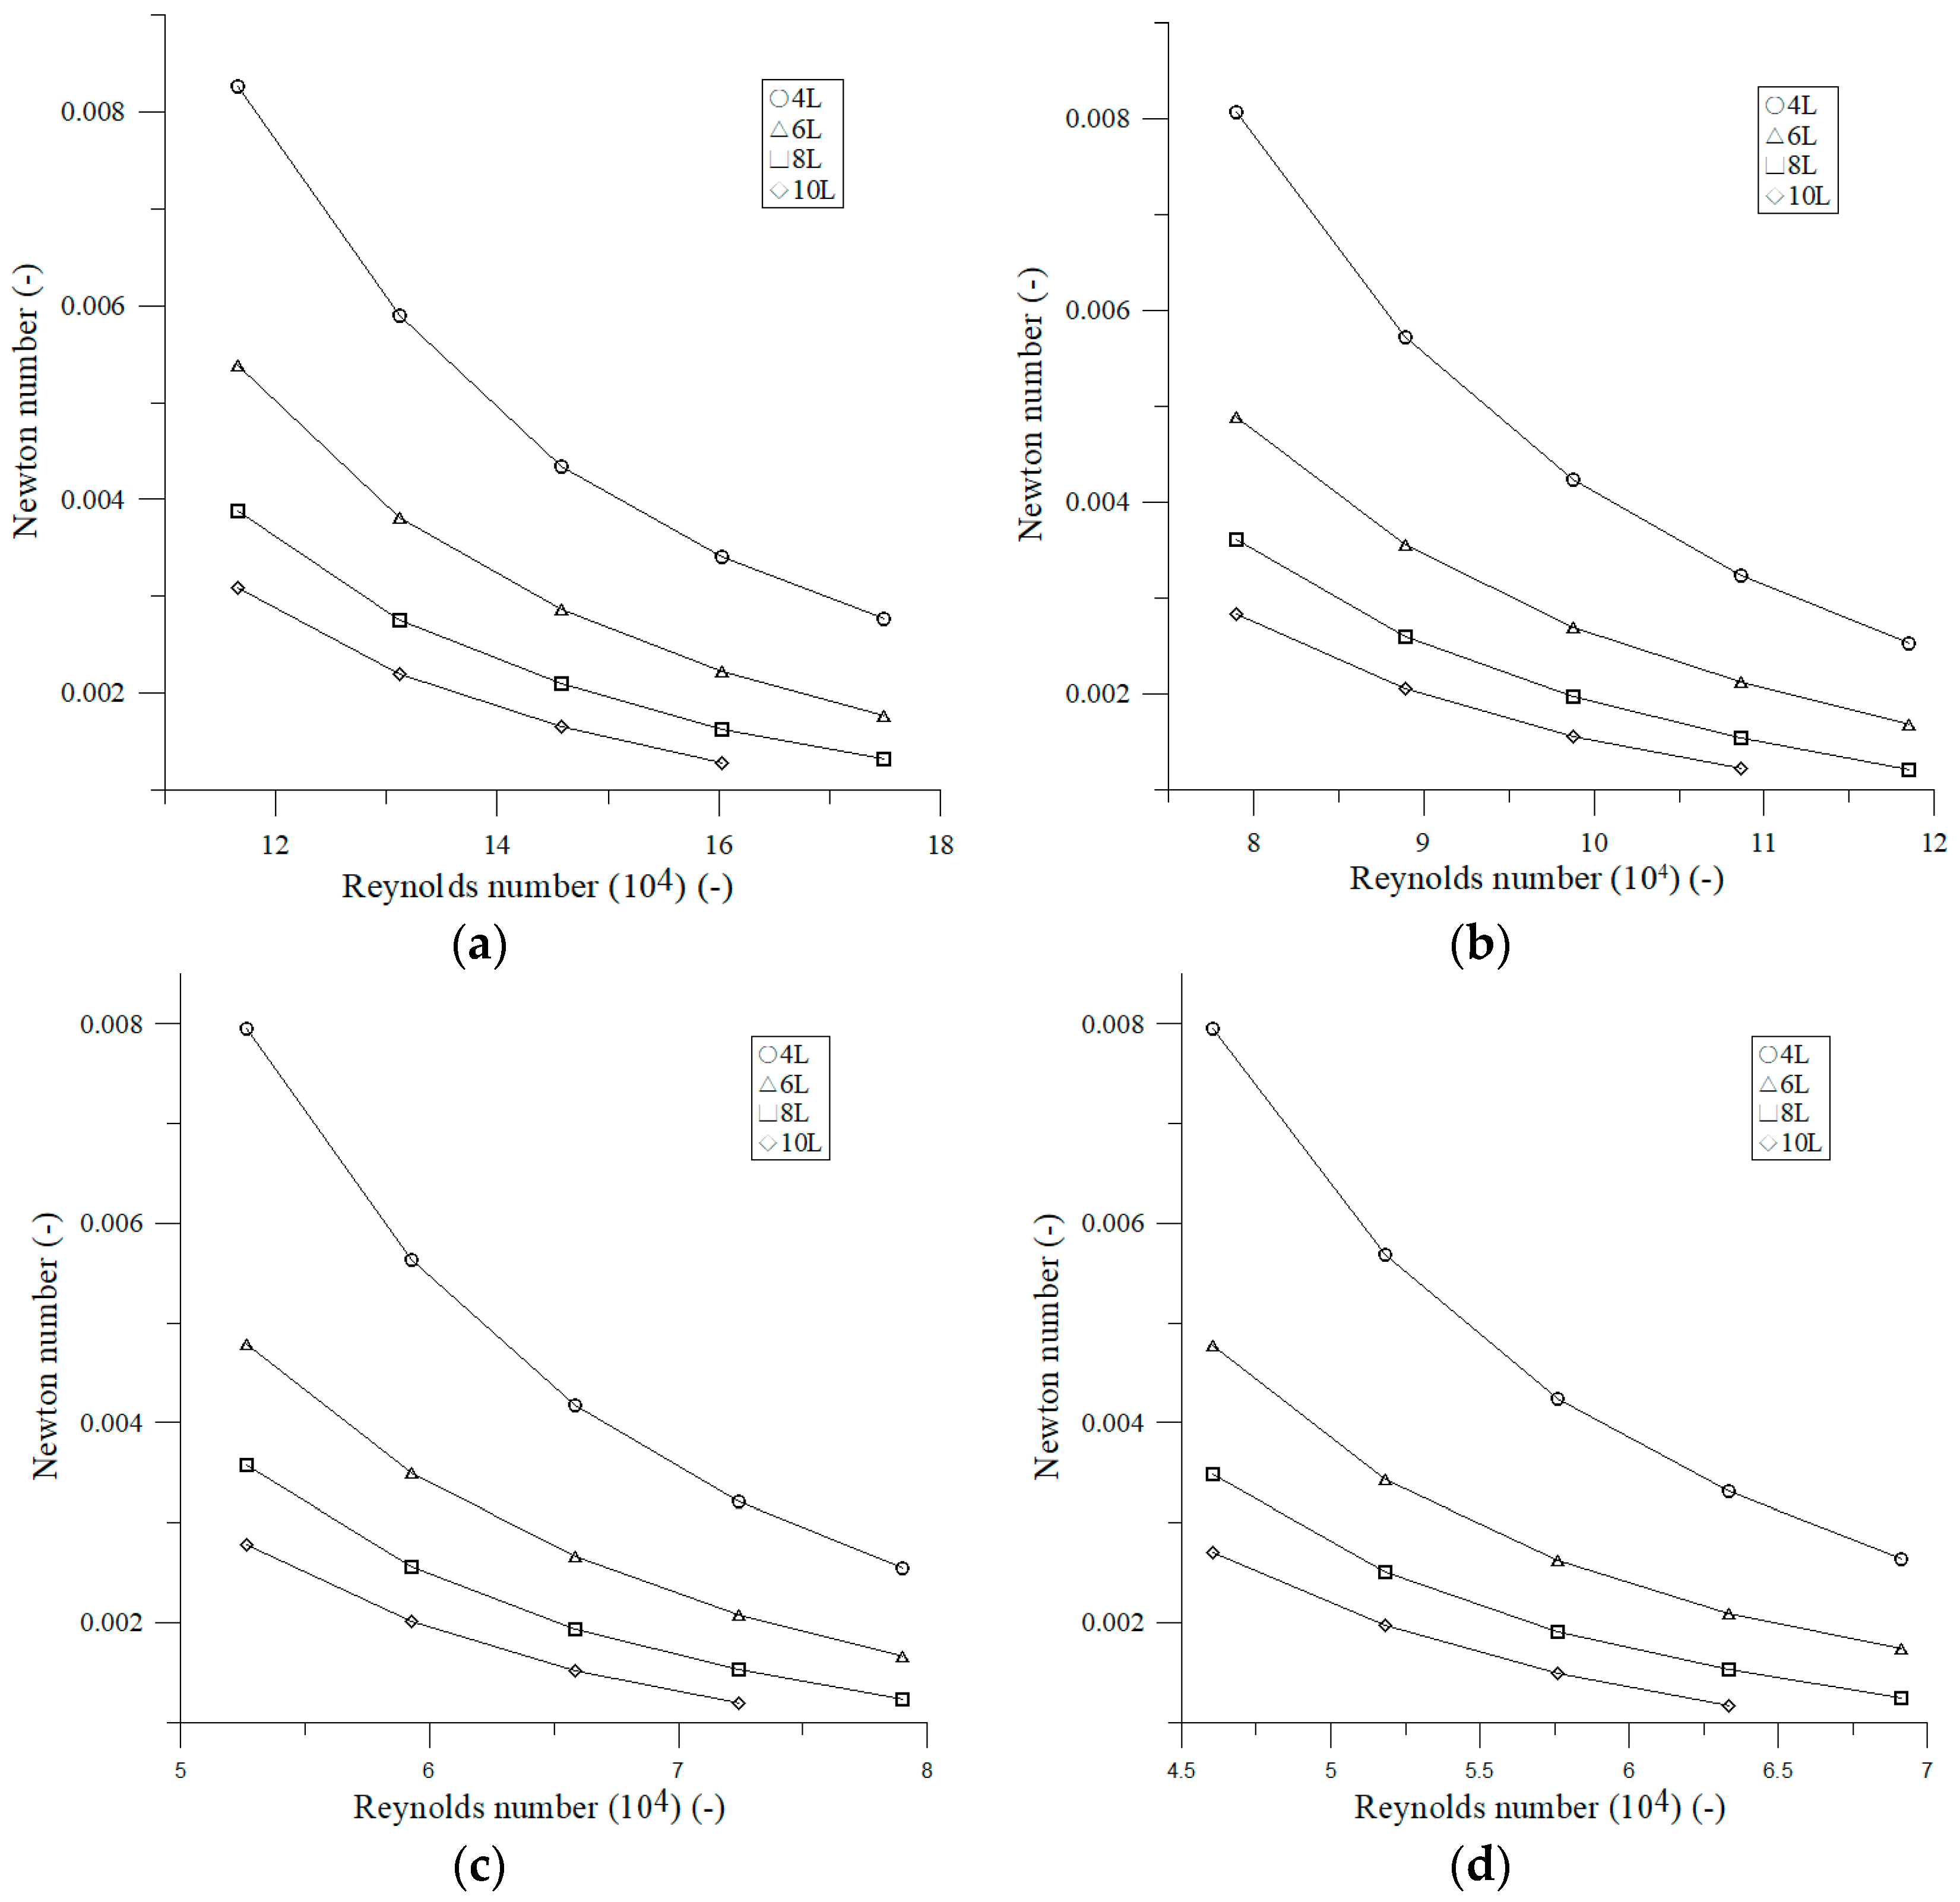
3.1.2. Effect Reynolds Number on Newton Number

In the P/VL correlation process, the number of variables is reduced by the theory of dimensionless analysis. We used the Buckingham π-theorem [57] to classify the variables as the following four dimensionless groups:
Newton number: N e = P ρ N 3 D 4 V L 1 / 3
Reynolds number: Re = ρ N D 2 η
Froude number: F r = 2 ( π N ) 2 D g
Volume number: V o l = V L D 3
The power law is utilized as a mathematical correlation between the dimensionless number:
N e = B Re α F r β ( V L D 3 ) γ
where α, β and γ exponents are determined by experiments. One dimensionless number is modified in each experiment and other number remain the same.
The exponent in the Equation (9) must be determined by experiment. Thus, each dimensionless number is individually changed to distinguish the effects of each number in Equation (9). The correlation between Newton number and Reynolds number is first, evaluated, and the α exponent of Equation (9) is determined. P/VL is measured in 20 L vessel applying the liquids of different viscosity. The changes of liquid viscosity result in changes of Reynolds number without altering any other dimensionless number in Equation (9). Under different conditions, the α value is verified using the shake frequency from 100 rpm to 120 rpm and the fill volume from 4 L to 10 L. The relationship between Newton number and Reynolds number of different filling volumes is presented in Figure 3. As a result, the increase in Reynolds number corresponded to a decrease in Newton number [18]. The Newton number decreased with the increase in Reynolds number and Newton number of all liquids was the highest in 4 L, such as reported for an unbaffled mixing reactor [58]. The functional correlation between Newton number and Reynolds number is
Ne = C2·Reα = C2·Re−2.66
where the ranges of Re is from 4.6 × 10⁴ to 1.75 × 10⁵ in the turbulent regime. This experiment results in a coefficient of determination greater than 0.9999.
Equation (9) is confirmed by the research of Klöckner et al. [18] at shaking frequencies of 100 rpm, 120 rpm and 160 rpm in a 20-L vessel using polypropylene liquid with different viscosities and shaking diameters of 2.5 cm and 5 cm and consistent with the research of Meissner et al. [17] at shaking frequencies 160 to 340 rpm in 250 and 500-mL flasks in a viscous range of shear rates of polyvinylpyrrolidone fermentation broths between 0.1 s−1 and 3000 s−1. A variation of the liquid viscosity results in a variation of the Reynolds number without changing any other dimensionless number of Equation (9).

3.1.3. Effect Reynolds Number and Froude Number on Newton Number

For example, the different dual variables (Re and Fr) power correlations are researched with the minimum square regression by Klöckner et al. [18] at shaking frequencies of 100 rpm, 120 rpm and 160 rpm in a 20-L vessel using polypropylene liquid with different viscosities and shaking diameters of 2.5 cm and 5 cm and Scargiali et al. [59,60] report for the uncovered unbaffled and vortexing mixing reactor researched data, resulting in Equations (11) and (12), respectively.
N e = 2.4 Re 0.17 F r 0.42
N p = 24.0 ( Re F r ) 1 / 3
Therefore, all experimental Newton numbers are obtained versus the product (Re × Fr) and in very good agreement with Scargiali et al. [59,60] in the uncovered unbaffled and vortexing mixing reactor using 10−3 to 15.2 × 10⁻³ Pa·s PVP and 41.7 × 10⁻³ to 1100 × 10−3 Pa·s glycerin solution at liquid height equal to tank diameter of 0.19 and 0.48 m. This experiment results in a coefficient of determination greater than 0.9999 as shown on Figure 4 and here can be represented Equation (13) (α is equal β to −0.886), and a very good agreement can be observed.
N e = C 3 ( Re ) α ( F r ) β

3.1.4. Effect of Volume Number on Newton Number

The exponential γ of the volume number is decided by changing the liquid volume VL [18]. Since merely the volume number is affected by the fill volume, exponential γ is decided by changing the volume number only. Klöckner et al. [18] found that Ne = 0.27·(VL/D3)0.44 was constant at shaking frequencies of 160 rpm, 20%–60% relative filling volume in a 20-L vessel using polypropylene liquid with different viscosities of 0.89–12 mPa·s and shaking diameters of 5 cm. The functional correlation between Newton number and volume number is obtained by
N e = C 4 ( V L D 3 ) γ
The exponent of liquid volume in this correlation of the Newton number in our experiment differs from −1.047, −1.1, −1.126, −1.205 values with a coefficient of determination greater than 0.9999 obtained for different liquids as shown on Figure 5. This result is consistent with the investigation of the liquid distribution between shaking frequencies. Due to the cylindrical orbitally shaken bioreactor design, the liquid and reactor walls have higher liquid viscosity during shaking, so the volume number is more affected. Therefore, the Newton number as stated in Equation (2) is not suitable for OSB cylindrical vessels.

3.1.5. Validation and Application of Newton Number Models

The correlation of the power input in Equation (9) is established by experiment as following:
N e = 0.01117 ( Re F r ) 0.887 ( V L D 3 ) 1.048   at   water   ( 8.94   ×   10 4   Pa · s )
N e = 0.0074 ( Re F r ) 0.887 ( V L D 3 ) 1.116   at   5 %   glycerin   ( 1.35   ×   10 3   Pa · s )
N e = 0.0048 ( Re F r ) 0.887 ( V L D 3 ) 1.14   at   10 %   glycerin   ( 2.05   ×   10 3   Pa · s )
N e = 0.004 ( Re F r ) 0.886 ( V L D 3 ) 1.186   at   20 %   glycerin   ( 2.4   ×   10 3   Pa · s )
These equations were demonstrated to be valid in the following range:
4.61 × 10⁴ ˂ Re ˂ 1.75 × 10⁵
1 ˂ Fr ˂ 2.3
0.18 ˂ V L D 3 ˂ 0.46
and when liquid motion was induced in the OSB that can be considered as being fully validated on scale-up.

3.2. Mixing Time

Mixing time was designated as the time beyond which at all measuring locations the thermal pulse disturbance differences between the temperatures measured and the final temperature was less than 3% of the total temperature difference step (i.e., the difference between the initial and final temperatures) of the fluid. A typical example is expressed in Figure 6.

3.2.1. Effect of Shaking Frequency on Mixing Time

Two factors affecting the mixing time of the orbital shaking cylindrical bioreactor were studied. Because glycerin has a watery viscosity, it is expected that the mixing experiment in water is a well-being approximation of the mixing in the cell medium. Mixing time drops in log–log linearly with further increase at shaken frequency from 80 to 120 rpm [26,27,60]. Li et al. [24] determined that mixing time for Vf = 6-mL microwell plates was closely to 3.5 times greater than that of 2 mL at the lowest shaking frequency. Figure 7 shows the change in mixing time at shaking frequencies between 80 and 120 rpm at four different filling volumes (from 4 to 10 L), and the mixing time of Vf = 10 L being approximately 1.1-times the lowest shake frequency of 4 L at 20% high volume glycerin ratio.

3.2.2. Effect of Reynolds Number on Mixing Number

As shown in Figure 8, at the high Reynolds number of turbulent regime, the mixing number remains the independence of the Reynolds number nor dependent on proximity to the reactor wall since flow is turbulent [26,52]. Tan et al. [26] found that mixing number of the deionized water and viscous PVP solution were kept at approximately 20 and 10 at shaking frequencies of 100 to 350 rpm in a 100-, 250- and 500-mL standard unbaffled narrow-neck Erlenmeyer flasks using water and shaking diameters of 25 mm and 50 mm using 10%-filling nominal flask volume. The Reynolds number ranged at 104–105(turbulent region) and 102–103(turbulent to transition region), respectively. This evidence also shows that the mixing (homogeneous) number increases according to the liquid filling volume and the volume ratio of glycerin. Homogeneous number increased from 100.26 to 308.33, from 216.2 to 344.67, from 272.07 to 355.21 and from 298.47 to 366.17 for water, 5 vol% glycerin, 10 vol% glycerin and 20 vol% glycerin at four different filling volumes (from 4 to 10 L), respectively.

3.2.3. Effect of Volume Number on Mixing Time

It can be seen the mixing time for the bioreactor volume gradually increased when the ratio of filling volume to bioreactor volume increased from 0.18 to 0.46 [26]. The functional correlation between mixing time and volume number is obtained by
t m = C 5 ( V L D 3 ) b
where VL/D3 is volume number, C5 is the coefficient, b is the exponent is determined by experiments.
The exponent of volume number in this correlation of the mixing time in our experiment differs from 1.362, 0.509, 0.335, 0.21 values with a coefficient of determination greater than 0.9428 obtained for different liquids as shown on Figure 9. This result is consistent with the investigation of the liquid distribution between shaking frequencies. Due to the cylindrical orbitally shaken bioreactor design, the liquid and reactor walls have higher liquid viscosity during shaking, so the volume number is more affected.

3.2.4. Effect of Volumetric Power Consumption on Mixing Time

The relationship between energy dissipation rate and mixing time was previously studied by Nienow [61]. To compare the mixing time of different liquids at the same power consumption, the relationship between mixing time and power consumption was plotted, results shown in Figure 10. With equal power consumption, the mixing time for water is the shortest. In addition, at lower power consumption, the mixing time increases according to liquid filling volume and the volume ratio of glycerin. This allows the prediction of the minimum mixing time for a given power consumption and demonstrates that more power consumption can improve the mixing process and reduce the mixing time in the reactor. A lower liquid viscosity was demonstrated to be more effective in liquid mixing given the shorter mixing time attained utilizing a lower power input at water, which is logical and desirable. In this experiment, the exponent of P/VL in the correlation of the mixing time is at −2.93 with a coefficient of determination greater than 0.9988 for water, 5 vol% glycerin, 10 vol% glycerin and 20 vol% glycerin on all shaking modes.
There is symbolic difference between shake flasks and orbitally shaken bioreactor. Tan et al. [26] worked at shaking frequencies of 100 to 350 rpm in a 100-, 250- and 500-mL standard unbaffled narrow neck Erlenmeyer flasks using water and shaking diameters of 25 mm and 50 mm, concluding that b = −0.58 was constant. Therefore, in addition to the independence of the physical properties of the liquid, Equation (6) was found to be independent of liquid filling volume scale.

3.2.5. Validation and Application of Mixing Time Models

The correlation of the mixing time by combining the form of Equations (6) and (19) is established by experiment as following:
t m = 5.8685 ( V L D 3 ) 1.293 ( P V L ) 0.3321   at   water   ( 8.94   ×   10 4   Pa · s )
t m = 3.1854 ( V L D 3 ) 0.482 ( P V L ) 0.3059   at   5 %   glycerin   ( 1.35   ×   10 3   Pa · s )
t m = 2.8893 ( V L D 3 ) 0.313 ( P V L ) 0.2987   at   10 %   glycerin   ( 2.05   ×   10 3   Pa · s )
t m = 2.766 ( V L D 3 ) 0.1805 ( P V L ) 0.2808   at   20 %   glycerin   ( 2.4   ×   10 3   Pa · s )
These equations were demonstrated to be valid in the following range and when liquid motion was induced in the orbitally shaken bioreactor:
4.61 × 10⁴ ˂ Re ˂ 1.75 × 10⁵
1 ˂ Fr ˂ 2.3
2.76   w   m 3   ˂   P V L   ˂   6.9   w   m 3
0.18   ˂   V L D 3   ˂   0.46
and when liquid motion was induced in the OSB that can be considered as being fully validated on scale-up.

3.3. Mixing Efficiency

In addition, mixing time can be measured and used to compare reactor efficiency at a given power consumption. The goal is to achieve the desired mixing strength with minimal power consumption. To compare the mixing efficient number of different filling liquid volumes, the relationship between the mixed effective number and the Reynolds number was plotted, as shown in Figure 11. It can be examined that the mixing effective number of water is the smallest in 4 L, while 5%, 10%, 20% vol. glycerin is the highest in 4 L, and the mixing effective number of all liquids is higher at the lower Reynolds number.

4. Discussion

4.1. Effect of Operating Parameters on Newton Number

Local power consumption increases with increased shaking frequency but decreases with increased filling volume. The power consumption increases with viscosity in the case of 4 L filling volume, but in case of 6 L to 10 L filling volume, power consumption decreases with viscosity. Table 3 shows an overview concerning the functional correlation between power consumption and shaking frequency that was assessed in shaking flasks and orbital shaken reactors in previous studies. All experimental results in this study are in very good agreement with results presented in preceding works.
These authors respectively found that the functional correlation between Newton number and Reynolds number as presented in Table 4. Equation (9) was found to be independent of liquid filling volume. Büchs et al. [16] introduced the “in-phase” operating conditions for 100 to 2000-mL sizes of the flask and “out-of-phase” operating conditions symbolized by a non-developed liquid flow and irreproducibly occurred for 100- to 5-L size flasks [52], the correlation of modified Newton number and Reynolds number is
N e = 70 Re 1 + 25 Re 0.6 + 1.5 Re 0.2
Equation (24) was utilized to consider in the laminar, intermediate and turbulent flow regime. Re−1, Re−0.6 and Re−0.2 terms in Equation (24) are related to the laminar, transitional and turbulent flow regimes, respectively.
Using Buckingham’s π theorem analysis, a new Reynolds number, the Froude number, and volume number are proposed for Newton number input in the cylinder orbitally shaken bioreactor. A new set of correlations have been proposed (Equation (15) to Equation (18)) for the Newton number in cylindrical orbitally shaken bioreactors. All experimental present Newton numbers are obtained versus the product (Re × Fr).

4.2. Effect of Operating Parameters on Mixing Time and Mixing Number

The mixing time is inversely proportional to the shaking frequency. At high Reynolds number, the homogenization number remains the constant. Tissot et al. [27] found that the mixing time remained to constant at higher shaking frequency in a 30-L vessel utilizing polypropylene liquid with different filling volume 8, 13 and 18 L. Mixing time of this experiment increases with the increased filling volume. Tan et al. [26] also found the mixing time for 100-, 250-, 500-mL nominal flask volumes increased gradually at 200 rpm shaking frequency. Consistently, the mixing in the viscous system, i.e., 20% high volume glycerin ratio solution at 10 L filling volume, was noticeably slower than in the non-viscous water system [26]. The mixing time increase phenomenon appears at a higher shaken frequency and with increasing fluid viscosity. For viscous fluids, the mixing time increase at high frequency range is also followed a decreased free surface vibration [24]. Under these conditions, the mixing number is independent of Reynolds number. This was also validated in traditional agitated tanks. The mixing (homogeneous) number increases according to increase the liquid filling volume and liquid viscosity. The mixing time for the bioreactor volume gradually increased as the ratio of filling volume to bioreactor volume is increased. The exponent of volume number and the mixing time correlation (Equation (19)) in the experiment obtained different values for different liquids. A new set of correlations were proposed (Equation (20) to Equation (23)) for the mixing time in cylindrical orbitally shaken bioreactors.

4.3. Effect of Operating Parameters on Mixing Efficiency

This study set out to compare the mixing efficiency of different liquids with the combination of power consumption and mixed time analysis. At lower power consumption, the mixing time increases according to liquid filling volume and liquid viscosity. This allows the prediction of the minimum mixing time for a given power consumption and demonstrates that more power consumption can improve the mixing process and reduce the mixing time in the bioreactor. Mixing efficient number shows that a constant power input of the reactor is fully consistent with the known trend of mixing time decrease.

5. Conclusions

Experimental studies of the power consumption and mixing time of the Newtonian fluid of water and glycerin in the cylindrical orbitally shaken bioreactor of the turbulent region were successfully completed. The power consumption and mixing time of continuous phase are determined by the power meter and the thermal method, respectively. The power consumption and mixing time are compared with the different volume of filled liquids. Using Buckingham’s π theorem analysis, a new Reynolds number and the Froude number are proposed for Newton number input in the cylinder orbitally shaken bioreactor. The mixing time is inversely proportional to the shaking frequency. At high Reynolds number, the homogenization number remains the constant. Under these conditions, the mixing time is independent of Reynolds number. The combination of power consumption and mixed time analysis of mixing efficient number shows that a constant power input, the mixer’s mixing time of the reactor is fully consistent with the known trend of the mixing time decreasing with the reactor size. Scale-up effects on the power consumption and mixing time in orbitally shaken bioreactor were investigated.

Author Contributions

J.-C.J. and L.Z. interpreted the results and prepared the manuscript and revision. S.-C.C. conducted experiments. A.S. and G.L. conducted experiments and prepared the revision. All authors have read and agreed to the published version of the manuscript.

Funding

This research received no external funding.

Acknowledgments

The authors would like to acknowledge the supports from National Taipei University of Technology with contract number NTUT-SZU-108-12 and Research cooperation project between Shenzhen University and National Taipei University of Technology-000003020312.

Conflicts of Interest

Graham Leggett received a salary from LI-COR Biosciences Com.

Nomenclature

Cecomputational mixing efficiencyw m−3 min
Dvessel diameterm
FrFroude number
ggravitational accelerationm s−2
Nshaking frequencyrpm
NeNewton number
Ppower consumptionw
Pvpower consumption of unit volumew m−3
ReReynolds number
tshaking timemin
VLfilling volumem3
Greek Symbols
ρliquid densitykg m−3
ηdynamic viscosity of fluidPa·s

References

  1. Büchs, J. Introduction to advantages and problems of shake cultures. Biochem. Eng. J. 2001, 7, 91–98. [Google Scholar] [CrossRef]
  2. Suresh, S.; Srivastava, V.C.; Mishra, I.M. Critical analysis of engineering aspects of shaken flask bioreactors. Critical Reviews in Biotechn. Crit. Rev. Biotechnol. 2009, 29, 255–278. [Google Scholar] [CrossRef] [PubMed]
  3. Platas, O.B.; Sandig, V.; Pörtner, R.; Zeng, A.P. Evaluation of process parameters in shake flasks for mammalian cell culture. BMC Proc. 2013, 7 (Suppl. 6), 17. [Google Scholar] [CrossRef] [Green Version]
  4. Betts, J.I.; Baganz, F. Miniature bioreactors: Current practices and future opportunities. Microb. Cell Factories 2006, 5, 21. [Google Scholar] [CrossRef] [PubMed] [Green Version]
  5. Doig, S.D.; Baganz, F.; Lye, G.J. Chapter 12—High-throughput screening and process optimization. In Basic Biotechnology, 3rd ed.; Ratledge, C., Kristiansen, B., Eds.; Cambridge University Press: Cambridge, UK, 2006; pp. 289–306. [Google Scholar]
  6. Klöckner, W.; Büchs, J. Advances in shaking technologies. Trends Biotechnol. 2012, 30, 307–314. [Google Scholar] [CrossRef] [PubMed]
  7. Lara, A.R.; Galindo, E.; Ramı´rez, O.T.; Palomares, L.A. Living with heterogeneities in bioreactors. Mol. Biotechnol. 2006, 34, 355–381. [Google Scholar] [CrossRef]
  8. Klöckner, W.; Riad Gacem, R.; Anderlei, T.; Raven, N.; Schillberg, S.; Lattermann, C.; Büchs, J. Correlation between mass transfer coefficient kLa and relevant operating parameters in cylindrical disposable shaken bioreactors on a bench-to-pilot scale. J. Biol. Eng. 2013, 7, 28. [Google Scholar] [CrossRef] [Green Version]
  9. Zhang, X.; Burki, C.; Stettler, M.; Sanctis, D.D.; Perrone, M.; Parolini, N.; Discacciati, M.; Jesus, M.D.; Hacker, D.; Quarteroni, A.; et al. Efficient oxygen transfer by surface aeration in shaken cylindrical containers for mammalian cell cultivation at volumetric scales up to 1000 L. Biochem. Eng. J. 2009, 45, 41–47. [Google Scholar] [CrossRef]
  10. Zhang, X.; Stettler, M.; Sanctis, D.D.; Perrone, M.; Parolini, N.; Discacciati, M.; Jesus, M.D.; Hacker, D.; Quarteroni, A.; Wurm, F. Use of orbital shaken disposable bioreactors for mammalian cell cultures from the milliliter-scale to the 1,000-liter scale. Adv. Biochem. Engin./Biotechnol. 2009, 115, 33–53. [Google Scholar]
  11. Dürauer, A.; Hobiger, S.; Walther, C.; Jungbauer, A. Mixing at the microscale: Power input in shaken microtiter plates. Biotechnol. J. 2016, 11, 1539–1549. [Google Scholar] [CrossRef] [Green Version]
  12. Gamboa-Suasnavart, R.A.; Marı´n-Palacio, L.D.; Martı´nez-Sotelo, J.A. Scale-up from shake flasks to bioreactor, based on power input and Streptomyces lividans morphology, for the production of recombinant APA (45/47 kDa protein) from Mycobacterium tuberculosis. World J. Microbiol. Biotechnol. 2013, 29, 1421–1429. [Google Scholar] [CrossRef] [PubMed]
  13. Ducci, A.; Weheliye, W.H. Orbitally shaken bioreactors—Viscosity effects on flow characteristics. AIChE J. 2014, 60, 3951–3968. [Google Scholar] [CrossRef]
  14. Büchs, J.; Maier, U.; Milbradt, C.; Zoels, B. Power consumption in shaking flasks on rotary shaking machines: I. Power consumption measurement in unbaffled flasks at low liquid viscosity. Biotechnol. Bioeng. 2000, 68, 589–593. [Google Scholar] [CrossRef]
  15. Klöckner, W.; Diederichs, S.; Büchs, J. Orbitally Shaken Single-Use Bioreactors. Adv. Biochem. Eng. Biotechnol. 2014, 138, 45–60. [Google Scholar] [CrossRef]
  16. Büchs, J.; Maier, U.; Milbradt, C.; Zoels, B. Power consumption in shaking flasks on rotary shaking machines: II. Nondimensional description of specific power consumption and flow regimes in unbaffled flasks at elevated liquid viscosity. Biotechnol. Bioeng. 2000, 68, 594–601. [Google Scholar] [CrossRef]
  17. Née Meissner, L.R.; Arndt, J.; Palmen, T.G.; Jestel, T.; Mitsunaga, H.; Fukusaki, E.C.; Büchs, J. Investigation of poly(γ-glutamic acid) production via online determination of viscosity and oxygen transfer rate in shake flasks. J. Biol. Eng. 2017, 11, 23. [Google Scholar] [CrossRef] [Green Version]
  18. Klöckner, W.; Tissot, S.; Wurmb, F.; Büchs, J. Power input correlation to characterize the hydrodynamics of cylindrical orbitally shaken bioreactors. Biochem. Eng. J. 2012, 65, 63–69. [Google Scholar] [CrossRef]
  19. Micheletti, M.; Barrett, T.; Doig, S.D.; Baganz, F.; Levy, M.S.; Woodley, J.M.; Lye, G.J. Fluid mixing in shaken bioreactors: Implications for scale-up predictions from microlitre-scale microbial and mammalian cell cultures. Chem. Eng. Sci. 2006, 61, 2939–2949. [Google Scholar] [CrossRef]
  20. Zlokarnik, M. Stirring, in: Ullmann’s Encyclopedia of Industrial Chemistry, Electronic Release, 7th ed.; Wiley-VCH: Weinheim, Germany, 2003. [Google Scholar]
  21. Weheliye, W.; Rodriguez, G.; Anderlei, T.; Micheletti, M.; Yianneskis, M.; Ducci, A. Appraisal of shaken bioreactor mixing efficiency for different operating conditions. In Proceedings of the 14th European Conference on Mixing Warszawa, Warsaw, Poland, 10–13 September 2012; pp. 503–509. [Google Scholar]
  22. Hiby, J.W. Definition and measurement of the degree of mixing in liquid mixtures. Int. Chem. Eng. 1981, 21, 197–204. [Google Scholar]
  23. Kasat, G.R.; Pandit, A.B. Mixing time studies in multiple impeller agitated reactors. Can. J. Chem. Eng. 2004, 82, 892–904. [Google Scholar] [CrossRef]
  24. Li, Y.; Ducci, A.; Micheletti, M. Study on mixing characteristics in shaken microwell systems. Biochem. Eng. J. 2020, 153, 107392. [Google Scholar] [CrossRef]
  25. Hoogendoorn, C.J.; Den Hartog, A.P. Model studies on mixers in the viscous flow region. Chem. Eng. Sci. 1967, 22, 1689–1699. [Google Scholar] [CrossRef]
  26. Tan, R.K.; Eberhard, W.; Büchs, J. Measurement and characterization of mixing time in shake flasks. Chem. Eng. Sci. 2011, 66, 440–447. [Google Scholar] [CrossRef]
  27. Tissot, S.; Farhat, M.; Hacker, D.L.; Anderlei, T.; Kühner, M.; Comninellis, C.; Wurm, F. Determination of a scale-up factor from mixing time studies in orbitally shaken bioreactors. Biochem. Eng. J. 2010, 52, 181–186. [Google Scholar] [CrossRef]
  28. Rodriguez, G.; Weheliye, W.; Anderlei, T.; Micheletti, M.; Yianneskis, M.; Ducci, A. Mixing time and kinetic energy measurements in a shaken cylindrical bioreactor. Chem. Eng. Res. Des. 2013, 91, 2084–2097. [Google Scholar] [CrossRef]
  29. Rodrigueza, G.; Anderleib, T.; Michelettia, M.; Yianneskisc, M.; Ducci, A. On the measurement and scaling of mixing time in orbitally shaken bioreactors. Biochem. Eng. J. 2016, 82, 10–21. [Google Scholar] [CrossRef] [Green Version]
  30. Weheliye, W.; Yianneskis, M.; Ducci, A. On the fluid dynamics of shaken bioreactors—Flow characterization and transition. AIChE J. 2013, 59, 334–344. [Google Scholar] [CrossRef]
  31. Havas, G.; Sawinsky, J.; Deak, A.; Fekete, A. Investigation of the homogenization efficiency of various propeller agitator type. Period. Polytech. Chem. Eng. 1978, 22, 331–344. [Google Scholar]
  32. Shiue, S.J.; Wong, C.W. Studies on Homogenization Efficiency of Various Agitators in Liquid Blending. Can. J. Chem. Eng. 1984, 62, 602–609. [Google Scholar] [CrossRef]
  33. Havas, G.; Sawinsky, J.; Deak, A.; Fekete, A. Investigation of the homogenization efficiency of the screw agitator, helical ribbon agitator, gate type anchor and the multiple-paddle agitator in the mixing of high-viscosity Newtonian liquids. Period. Polytech. Chem. Eng. 1978, 22, 317–330. [Google Scholar]
  34. Verma, M.; Brar, S.K.; Sreekrishnan, T.R.; Tyagi, R.D.; Surampalli, R.Y. Dimensionless groups as scale-up parameter for wastewater and wastewater sludge treatment in a stirred tank reactor. J. Residuals Sci. Technol. 2007, 4, 35–43. [Google Scholar]
  35. Yamaguchi, H. Engineering Fluid Mechanics; Springer: Dordrecht, The Netherlands, 2008. [Google Scholar]
  36. Rushton, J. Applications of fluid mechanics and similitude to scale-up problems. Part 1. Chem. Eng. Prog. 1952, 48, 33–38. [Google Scholar]
  37. Giese, H.; Klockner, W.; Pena, C.; Galindo, E.; Lotter, S.; Wetzel, K.; Meissner, L.; Peter, C.P.; Büchs, J. Effective shear rates in shake flasks. Chem. Eng. Sci. 2014, 118, 102–113. [Google Scholar] [CrossRef]
  38. Büchs, J.; Zoels, B. Evaluation of maximum to specific power consumption ratio in shaking bioreactors. J. Chem. Eng. Jpn. 2001, 34, 647–653. [Google Scholar] [CrossRef] [Green Version]
  39. Peter, C.P.; Suzuki, Y.; Buchs, J. Hydromechanical stress in shake flasks: Correlation for the maximum local energy dissipation rate. Biotechnol. Bioeng. 2006, 93, 1164–1176. [Google Scholar] [CrossRef]
  40. Khorshid, F.A. The Effect of the Medium Viscosity on the Cells Morphology in Reaction of Cells to Topography—I. In Proceedings of the 2nd Saudi Sci. Conl, Fac. Sci., King AbdulAziz University, Jeddah, Saudi Arabia, 15–17 March 2004; Part I. pp. 67–98. [Google Scholar]
  41. Monteila, D.T.; Tontodonatia, G.; Ghimirea, S.; Baldia, L.; Hackera, D.L.; Burkib, C.A.; Wurm, F.M. Disposable 600-mL orbitally shaken bioreactor for mammalian cell cultivation in suspension. Biochem. Eng. J. 2013, 76, 6–12. [Google Scholar] [CrossRef]
  42. Mayr, B.; Horvat, P.; Moser, A. Engineering approach to mixing quantification in bioreactors. Bioprocess Eng. 1992, 8, 137–143. [Google Scholar] [CrossRef]
  43. Espinosa-Solares, T.; Brito-De La Fuente, E.; Tecante, A.; Medina-Torres, L.; Tanguy, P.A. Mixing Time in Rheologically Evolving Model Fluids by Hybrid Dual Mixing Systems. Chem. Eng. Res. Des. 2002, 80, 817–823. [Google Scholar] [CrossRef]
  44. Harnby, N.; Edwards, M. Mixing in the Process Industries; Butterworth Publishers: Stoneham, MA, USA, 1992. [Google Scholar]
  45. Tan, R.K. Mixing Time in Shaking Bioreactors. Ph.D. Thesis, Aachen/Publikationsserver der RWTH Aachen University, Aachen, Germany, 2012. [Google Scholar]
  46. Zhang, P.; Chen, G.H.; Duan, J.H.; Wang, W.W. Mixing characteristics in a vessel equipped with cylindrical stirrer. Res. Phys. 2018, 10, 699–705. [Google Scholar] [CrossRef]
  47. Raval, K.; Büchs, J. Extended Method to Evaluate Power Consumption in Large Disposable Shaking Bioreactors. J. Chem. Eng. Jpn. 2008, 41, 1075–1082. [Google Scholar] [CrossRef]
  48. Lotter, S.; Büchs, J. Utilization of specific power input measurements for optimization of culture conditions in shaking flasks. Biochem. Eng. J. 2004, 17, 195–203. [Google Scholar] [CrossRef]
  49. Sundaramurthy, S. Mixing in Shake Flask Bioreactor. In Encyclopedia of Industrial Biotechnology: Bioprocess, Bioseparation, and Cell Technology; Flickinger, M.C., Ed.; John Wiley & Sons, Inc.: Hoboken, NJ, USA, 2016; pp. 1–17. [Google Scholar]
  50. Peter, C.P.; Suzuki, Y.; Rachinskiy, K.; Lotter, S.; Büchs, J. Volumetric power consumption in baffled shake flasks. Chem. Eng. Sci. 2006, 61, 3771–3779. [Google Scholar] [CrossRef]
  51. Kato, Y.; Peter, C.P.; Akgün, A.; Büchs, J. Power consumption and heat transfer resistance in large rotary shaking vessels. Biochem. Eng. J. 2004, 21, 83–91. [Google Scholar] [CrossRef]
  52. Klöckner, W.; Büchs, J. 2.24.2 Specific Power Input in Shake Flasks. In Comprehensive Biotechnology, 3rd ed.; 2019; pp. 307–309. [Google Scholar]
  53. Sumino, Y.; Akiyama, S.I.; Fukuda, H. Performance of the shaking flask (I) power consumption. J. Ferment. Technol. 1972, 50, 203–208. [Google Scholar]
  54. Raval, K.; Kato, Y.; Büchs, J. Comparison of torque method and temperature method for determination of power consumption in disposable shaken bioreactors. Biochem. Eng. J. 2007, 34, 224–227. [Google Scholar] [CrossRef]
  55. Pena, C.; Peter, P.C.; Buchs, J.; Galindo, E. Evolution of the specific power consumption and oxygen transfer rate in alginate-producing cultures of Azotobacter vinelandii conducted in shake flasks. Biochem. Eng. J. 2007, 36, 73–80. [Google Scholar] [CrossRef]
  56. Kato, Y.; Hiraoka, S.; Tada, Y.; Koh, S.T.; Lee, Y.S. Mixing time and power consumption for a liquid in a vertical cylindrical vessel, shaken in a horizontal circle. Chem. Eng. Res. Des. 1996, 74, 451–455. [Google Scholar]
  57. Buckingham, E. The principle of similitude. Nature 1915, 96, 396–397. [Google Scholar] [CrossRef] [Green Version]
  58. Büchs, J.; Lotter, S.; Milbradt, C. Out-of-phase operating conditions, a hitherto unknown phenomenon in shaking bioreactors. Biochem. Eng. J. 2001, 7, 135–141. [Google Scholar] [CrossRef]
  59. Scargiali, F.; Busciglio, A.; Grisafi, F.; Tamburini, A.; Micale, G.; Brucato, A. Power consumption in uncovered-unbaffled stirred tanks: Influence of viscosity and flow regime. Ind. Eng. Chem. Res. 2013, 52, 14998–15005. [Google Scholar] [CrossRef]
  60. Scargiali, F.; Tamburini, A.; Caputo, G.; Micale, G. On the assessment of power consumption and critical impeller speed in vortexing unbaffled stirred tanks. Chem. Eng. Res. Des. 2017, 123, 99–110. [Google Scholar] [CrossRef]
  61. Nienow, A. On impeller circulation and mixing effectiveness in the turbulent flow regime. Chem. Eng. Sci. 1997, 52, 2557–2565. [Google Scholar] [CrossRef]
Figure 1. Schematic diagram of the experimental devices.
Applsci 10 05597 g001
Figure 2. Effects of different filling volumes on local power consumption. (a) Water; (b) 5 vol% glycerin; (c) 10 vol% glycerin; (d) 20 vol% glycerin.
Applsci 10 05597 g002
Figure 3. Relationship between Newton number and Reynolds number of different filling volumes. (a) Water; (b) 5 vol% glycerin; (c) 10 vol% glycerin; (d) 20 vol% glycerin.
Applsci 10 05597 g003
Figure 4. Relationship between Newton number and the product (Re x Fr) of different filling volumes. (a) Water; (b) 5 vol% glycerin; (c) 10 vol% glycerin; (d) 20 vol% glycerin.
Applsci 10 05597 g004aApplsci 10 05597 g004b
Figure 5. Relationship between Newton number and volume number of different shaking frequencies. (a) Water; (b) 5 vol% glycerin; (c) 10 vol% glycerin; (d) 20 vol% glycerin.
Applsci 10 05597 g005aApplsci 10 05597 g005b
Figure 6. Typical example of the thermal pulse disturbance for the decision of mixing time. 20 vol% glycerin and 110 rpm shaking frequency.
Applsci 10 05597 g006
Figure 7. Effect of different shaking frequencies and filling volumes on mixing time. (a) Water; (b) 5 vol% glycerin; (c) 10 vol% glycerin; (d) 20 vol% glycerin.
Applsci 10 05597 g007aApplsci 10 05597 g007b
Figure 8. Effect of Reynolds number on mixing number. (a) Water; (b) 5 vol% glycerin; (c) 10 vol% glycerin; (d) 20 vol% glycerin.
Applsci 10 05597 g008aApplsci 10 05597 g008b
Figure 9. Relationship between mixing number and volume number of different shaking frequencies. (a) Water; (b) 5 vol% glycerin; (c) 10 vol% glycerin; (d) 20 vol% glycerin.
Applsci 10 05597 g009aApplsci 10 05597 g009b
Figure 10. Effect of volumetric power consumption on mixing time. (a) Water; (b) 5 vol% glycerin; (c) 10 vol% glycerin; (d) 20 vol% glycerin.
Applsci 10 05597 g010aApplsci 10 05597 g010b
Figure 11. Effect of Reynolds number on mixing efficient number. (a) Water; (b) 5 vol% glycerin; (c) 10 vol% glycerin; (d) 20 vol% glycerin.
Applsci 10 05597 g011
Table 1. Summarized conventional and high-throughput equipment [4,5,6,7].
TypeVolumeTypical ExperimentalLevel of MonitoringCost of Operation
throughputand control
Microtiter plates100 μL–3 mLVery high: thousandsLow: T, biomass,Medium: capital, increased
per technicianproductuse of disposables
Small-scale stirred vessels10 mL–100 mLLow/medium: 20 perLow: T, biomass,Low
technicianproduct
Miniaturized stirred25 mL–6 LMedium: 50 max. perHigh: pH, oxygen, T,Medium: capital,
bioreactor technicianbiomass and productlabor
Shaken vessels2 L–50 LLow: 1–5 techniciansHigh: pH, oxygen, T,High: capital, raw
biomass and productmaterials, labor
Conventional stirred-tank1 L–100 LLow: 1–5 techniciansHigh: pH, oxygen, T,High: capital, raw
bioreactor biomass and productmaterials, labor
Table 2. Characteristics of liquids.
LiquidMimicking Culture MediumDensity *Viscosity *
(kg/m3)(Pa·s)(10−4)
waterlow 4% dextran 9000 [37]9978.94
glycerin 5 volume%0.5% polyvinylpyrrolidone 360 k [37]1022.7513.53
glycerin 10 volume%1.7% dextran 2,000,000 [37]103620.56
glycerin 20 volume%2% dextran 2,000,000 [37]1051.9523.87
* Density is monitored using a Shimadzu TX223 L balance (the weight difference before and after divided by filling liquid volume), while viscosity is measured using a Physica MCR 301 rheometer.
Table 3. Correlation between power consumption and shaking frequency.
Bioreactor TypeShaking FrequencyShaking DiameterCorrelationLiquidLiterature
20-L orbitally shaken bioreactor100 rpm to 300 rpm50 mmP~N2.5Tap waterKato et al. [48]
100- to 2000-mL flask80 rpm to 380 rpm2.5 cm and 5 cmP~N2.8demineralized waterBüchs et al. [14]
20-L orbitally shaken bioreactor300 rpm2.5 cmP~N5.75Tap waterKato et al. [51]
20-L orbitally shaken bioreactor80 to 120 rpm3.2 cmP~N0.344.6 × 104 to 1.75 × 10⁵This study
Table 4. Correlation between Newton number and Reynolds number.
Bioreactor TypeShaking FrequencyShaking DiameterCorrelationReynolds NumberLiterature
100- to 2000-mL flask80 to 380 min−1 L/min2.5 and 5 cmNe’ = 70 Re−1 + 25 Re−0.6 + 1.5 Re−0.290 to 9 × 10⁴Büchs et al. [16]
250- and 500-mL flask160 to 340 rpm50 mmNe = 12.3 Re−0.38690 to 9 × 10⁴Meissner et al. [17]
20-L orbitally shaken bioreactor100 rpm2.5 cmNe = 0.65 Re−0.172.5 × 103 to 3.5 × 10⁴Klöckner et al. [18]
120 rpm2.5 cmNe = 0.75 Re−0.173 x 10³ to 5 × 10⁴Klöckner et al. [18]
160 rpm5 cmNe = 1.1 Re−0.171.8 × 104 to 3 × 10⁵Klöckner et al. [18]
20-L orbitally shaken bioreactor80 to 120 rpm3.2 cmNe = C1·Re−2.664.6 × 104 to 1.75 × 10⁵This study

