Abstract
Road infrastructure projects are essential for a country’s economic and social development. Due to the magnitude, the projects are associated with considerable economic investments that in the case of failure can seriously affect regions’ economies. Despite the importance, roads from different countries are affected by cost overruns, hence, it is essential to identify and analyze the causative factors to focus the search for mitigation solutions. There are several studies focused on the cost factors identification, however, studies are lacking that synthesize and analyze the frequency and importance with which the factors have been reported to obtain a phenomenon overview. Therefore, this paper focuses on analyzing the frequency and importance with which cost overrun factors are reported in road projects. The research method consisted of a systematic review compound of five principal stages: (1) question formulation; (2) searching of relevant documents; (3) document selection; (4) evidence collection, analysis and synthesis; and (5) results’ report. Thirty-eight cost overrun factors were identified and classified into 14 categories. According to the Influence Index, the five most important and frequent cost overrun factors were: (1) failures in design, (2) price variation of materials, (3) inadequate project planning, (4) project scope changes, and (5) design changes.
1. Introduction
In recent years the demand for road infrastructure projects has notably increased, this being due to road projects playing an important role in different aspects of a country’s economy, health, education, competitiveness, and quality life [1,2]. This is because designing, planning, building, and maintaining road projects are crucial activities for the well-being of a country. Undertaking a new road project involves a great economic effort [3,4], which, in the case of failure, can seriously affect the national and regional economies [5]. Despite the importance, road projects have been associated with unwanted phenomena such as cost overruns, delays, disputes, corruption, and others, which have caused serious consequences, compromising the successful development of the projects [6,7].
Due to the magnitude, road projects are related to different variables that together are difficult to predict [8,9,10]. Therefore, the estimation and development of costs in the project’s lifecycle are associated with a high level of complexity and uncertainty [11]. At the end of a project, a deviation of the final cost with respect to the estimated initial cost may occur; this deviation can be positive or negative [12,13]. A positive value indicates cost overrun, and a negative value cost underrun. Thus, the cost overrun is the phenomenon of greater affectation and financial risk for project owners, who are usually public entities that depend on public money that usually is associated with extensive controls, regulations, claims, and disputes [14]. In some projects, the phenomenon is caused by several reasons that are related to different project aspects, stakeholders, and even external variables [2]. In addition to this, each project in the construction industry is exposed to cost overruns for different reasons that may vary from one country to another and from one project to another [15,16,17].
In the worst cases, cost overruns can cause the construction activities interruption, and even the abandonment of projects, situations that occur when the owner does not have the financial capacity to meet the unexpected costs. Consequently, payments to the contractor must be suspended. The consequences of cost overrun in road projects have caused that researchers and professionals focus their work on the phenomenon, some on characterization and others in the search for solutions that allow mitigating the causative factors [11]. Despite efforts, the problem has remained, as evidenced in some studies [5]; Bordat et al. [17] analyzed 2668 road projects in the United States, finding 55% of projects with cost overruns. Creedy et al. [18] studied 231 road projects in Australia and determined an average cost deviation of 16.3%. Love et al. [19] examined 49 road projects in Australia, revealing a mean cost overrun of 13.5%. Cantarelli et al. [20] studied 37 Dutch road projects, where found cost overruns of 62.2% of the projects and a mean cost overrun of 18.6%. Lee [21] studied 138 road projects in South Korea, finding 95% of the projects have a maximum cost overrun of 50%. Roxas and Chalermpong [22] considered 85 road projects in the Philippines, finding mean cost overruns of 5.4%. Mahamid and Bruland [23] analyzed 169 road projects in Palestine; their results showed a cost average of 14.6%. Rwakarehe and Mfinanga [24] studied seven road projects in Tanzania and finding average cost overruns of 44%. Evidence that allows concluding that the cost overrun phenomenon affects both road projects in developed and developing countries.
To undertake the cost overruns mitigation in road projects, the initial actions should be focused on identifying the factors responsible for the phenomenon occurrence. Hence, some studies have found that the cost overruns are originated from factors related to: problems with designs, failures in planning and programming activities, contractor deficiencies in project management and execution, unnecessary and inadequate intervention by owners, problems related to equipment and materials, changes in scope, delay in activities, country’s political situation, among others [25,26]. This variety of identified causal factors suggests that current project development methods require profound changes at different stages and processes of the project lifecycle.
Explaining why the cost overrun phenomenon occurs has been a subject of continuous interest in scientific research. For this, several studies have been developed that identify the factors causing cost overruns in road projects from different countries around the world. Nevertheless, there is a lack of studies that compile, synthesize, and analyze the results to obtain a phenomenon overview that allows undertaking the search for global solutions with high impact. Considering this gap, the research purposes of this study are: (1) identify cost overruns factors in road infrastructure projects through a literature review, (2) determine the frequency and level of importance reported for the cost overrun factors identified, and (3) identify project stakeholders responsible for cost overruns occurrence.
2. Research Method
The research method applied in this study was a systematic literature review. This in view that the systematic reviews differ from traditional literature reviews by adopting an explicit method that is replicable, scientific, and transparent [27], with which it is possible to evaluate the findings through analysis of the review method used for evidence collection and analysis. Thus, systematic reviews allow obtaining conclusions with a high degree of reliability about a specific research topic [28]. Considering that, the methodology development is guided by a set of specific research questions, which base the development of the review stages through the conditions for the definition of different parameters such as study selection criteria, methods for evidence collection and analysis, conclusions report characteristics, among others.
This research is classified as a systematic review due to involve the four core principles exposed by Briner and Denyer [28]: (1) systematic method to address a research question, (2) explicit research method, (3) replicable and updatable, and (4) presents evidence summary and synthesis. Considering the systematic review methodologies exposed by Briner and Denyer [28], Saieg et al. [29] and Costin et al. [30], this study applied a systematic review methodology compound by five principal stages: (1) question formulation; (2) searching of relevant studies; (3) document selection; (4) evidence collection, analysis and synthesis; and (5) results’ report. Figure 1 shows the principal characteristics of each stage.
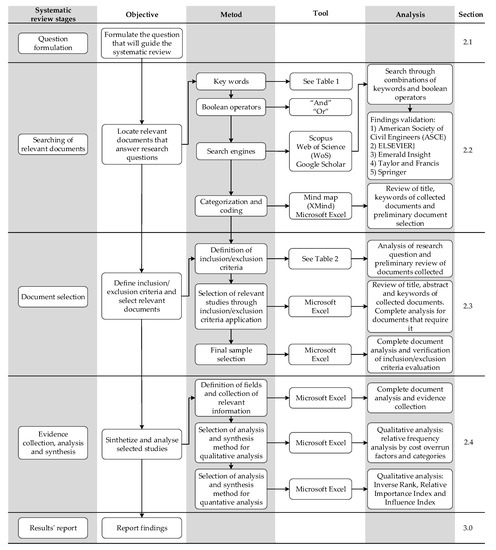
Figure 1.
Systematic review stages, an adaptation of the method exposed by Saieg et al. [29].
2.1. Question Formulation
The following research questions guided the systematic review process:
- Research question 1: what are the cost overrun factors in road infrastructure projects?
- Research question 2: what are the frequency and level of importance for each cost overrun factor?
- Research question 3: which are the project stakeholders responsible for cost overruns occurrence in road infrastructure projects?
2.2. Searching of Relevant Documents
From the three formulated research questions, the searching of relevant documents was carried out using the Boolean Operators “AND” and “OR”, and a set of keywords obtained from the preliminary literature review. Thus, search equations were obtained through combinations between Boolean Operators and keywords (Table 1).

Table 1.
Keywords and Boolean Operators used to locate relevant studies.
Using the equations, the searching process was carried out through the search engines: (1) Scopus, (2) Web of Science (WoS), and (3) Google Scholar; and the databases: (1) American Society of Civil Engineers (ASCE), (2) ELSEVIER, (3) Emerald Insight, (4) Taylor and Francis, and (5) Springer. A total of 450 documents were collected, encoded, and classified, the process in which the Microsoft Excel and Xmind software were used.
The search for documents was carried out by three researchers; who independently performed the search process using the defined search equations and databases. For the storage of documents, the OneDrive platform was used, in which each of the researchers had access to a shared folder in the cloud. The documents were downloaded in PDF format and named with the last name of the first author and the document publication year, in this way, each of the researchers was able to find out if the document analyzed had already been included by another of the researchers. During the document collection process, a collaborative table was developed in Microsoft Excel, in which information related to: file name, title, authors, journal, database, publication year, and project type was collected for each document.
2.3. Document Selection
From the research questions, the document selection was made by applying three inclusion/exclusion criteria: (1) the document focuses on cost overrun factors; (2) type of project analyzed: road, highway or motorway; and (3) the document reports the top-ten cost overrun factors or more. The selection started with the initial sample that was compound by 450 documents. The application of the first inclusion/exclusion criterion led to select 253 documents and discard 197. The information of the 253 documents is presented in Table S1 as Supplementary Materials. Then, the second criterion allowed selecting 45 documents and discarding 208. Finally, the third criterion led to the selection of a final sample of 18 documents with evidence to answer the proposed research questions (Figure 2).
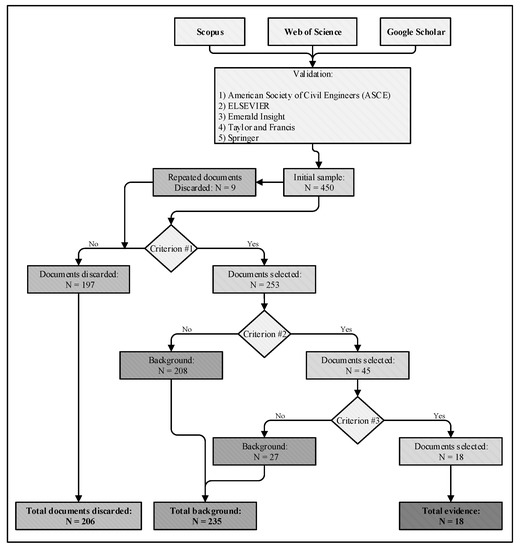
Figure 2.
Document flow in the document selection stage.
The document selection process was carried out by three researchers. Each of the researchers was given both a copy of the documents collected in PDF format and a Microsoft Excel file of the table described in Section 2.2, to which three columns were added: criterion #1, criterion #2, and criterion #3. Each of the researchers carried out individually the three inclusion/exclusion criteria evaluation through a detailed review of the 450 documents collected (Figure 2). If the document met the criterion, “Yes” was reported and “No” otherwise. Once the table was completed by each of the researchers, a results comparison of the criteria evaluation was made. As a result, 13 documents (2.89%) in which the evaluation did not coincide were detected, which were analyzed in a meeting between the three researchers to reach a consensus. Finally, the documents that obtained “Yes” in the evaluation of the three criteria were selected.
2.4. Evidence Collection, Analysis, and Synthesis
The evidence collection process consisted of a complete analysis for the selected studies, for which a set of required information fields were defined based on the research questions and a preliminary review. The evidence collection process began with a detailed reading of the 18 selected documents, a process that was carried out by two researchers; who used Adobe Reader software to highlight the relevant information to answer the proposed research questions. The underlined documents were reviewed by two additional researchers, who added comments to the digital files. Next, a meeting was held between the four researchers to define the fields of information to be collected, with which the table in Microsoft Excel developed in previous stages was adapted. Thus, the final evidence collection was carried out by two researchers and consolidated in the mentioned table. To avoid shortcomings in the information collection due to human error, the consolidated information in the table was reviewed by the four researchers who participated in the evidence collection process. Completed the evidence collection process, the evidence analysis was compound by qualitative analysis, quantitative analysis, and network analysis, which are described below.
2.4.1. Qualitative Analysis
From documents selected in the final sample, the top-ten factors reported with the greatest importance level were selected and renamed; this because it was observed that the same factor in different documents has different names but describes the same phenomenon. For instance, Mahamid and Bruland [31] report the cost overrun factor ‘frequent design changes’, Ahbab et al. [32] and Shemi and Asok [26] ‘design changes’, Al Hosani et al. [2] ‘change design’; thus, the name assigned was ‘design changes’. A total of 180 cost overrun factors were collected (10 per document). Next, a relative frequency analysis was carried out, identifying thirty-eight cost overrun factors that were classified into 14 categories. The categories were proposed based on the classification groups for cost overrun factors reported in the ‘evidence’ and ‘background’ studies (Figure 2). In this study, a category can be understood as a set that groups cost overrun factors that are related to each other, either by a specific issue or by a responsible stakeholder; thus, the 14 categories proposed for the factors classification were: (1) contract, (2) contractor, (3) contractual relationships, (4) design, (5) equipment, (6) external factors, (7) financial, (8) laws and regulations, (9) materials, (10) owner, (11) personal, (12) programming and control, (13) project, and (14) site.
2.4.2. Quantitative Analysis
The quantitative analysis started with the Inverse Rank (IR), calculated with Equation (1) [33], for which was considered the Rank Reported (RR) for the 180 cost overrun factors collected in the qualitative analysis. For instance, the top-three cost overrun factors reported by Rehman et al. [34] with their respective IR and RR are: (1) price variation of materials (RR = 1; IR = 10), (2) land acquisition (RR = 2; IR = 9), and (3) inadequate project planning (RR = 3; IR = 8).
With IR results, the Relative Important Index (RII) was calculated for each one of the 38 factors identified; this through the Equation (2), where N is the total number of documents analyzed (18 documents), IR is the Inverse Rank obtained from the Equation (1), and IRmax is the maximum value of Inverse Rank (IRmax = 10).
Then, the Influence Index (II) was obtained through Equation (3), where RII is the Relative Importance Index, and the Relative Frequency obtained in the qualitative analysis.
The Influence Index is an adaptation of the expression used by Akogbe et al. [35], Santoso and Soeng [36], Rachid et al. [37], and Al Hosani et al. [2]. The II was selected because it integrates the importance level and the frequency of cost overrun factors in an index.
2.4.3. Network Analysis
A lot of systems can be represented by networks or graphs. A network can be described as a set of nodes that are linked creating edges [38]. The edges represent relationships among nodes. In this research, the authors represented the 38 factors like nodes. On the other hand, the researchers defined an edge between two nodes, when some paper reports both factors within the top-10 of greatest importance. In addition, if a pair of factors was mentioned by more than a paper, then the edge’s weight will be the number of papers that mentions both factors (e.g., factors 1 and 4 are in the top-ten of 3 papers; therefore, the edge between these nodes will have a weight of 3). With all the pairs of links of the 38 factors, the authors created a graph that represents how they are linked together. Factors’ metrics can be obtained from the network, such as the degree or the betweenness centrality. The degree of a node is the number of nodes it connects to [39]; therefore, a factor with a higher degree, will be a more relevant cost overrun factor. On the other hand, the betweenness centrality of a node represents the importance of the node in connecting another pair of nodes [38]; therefore, a factor with high betweenness centrality may represent a factor that is not necessarily the most influential, but that is always present when the most important cost overruns are mentioned.
3. Results and Discussion
3.1. Studies on Cost Overrun Factors Related to Road Infrastructure Projects
Through the document collection and selection processes, 45 documents were collected that address the issue of factors causing the cost overrun phenomenon in road infrastructure projects (see Figure 2 and Table 2). The research methods identified in the studies were mainly three: (1) questionnaires, (2) projects, and (3) literature review. It was evidenced that most of the studies of cost overruns are carried out with questionnaire-based research methods (32 out the 45 studies). Regarding the regions in which the studies focus, five regions were identified: Asia (46.7%), Africa (28.9%), America (11.1%), Europe (11.1%), and Oceania (2.2%). In which it is evident a low number of studies focused on countries located in the America, Europe, and Oceania regions, compared to the number of studies of countries located in the Asia and Africa regions.
Table 2.
Studies on cost overrun factors related to road projects (n = 45).
Considering the 45 documents that address the issue of cost overrun factors in road projects (Table 2), 18 were selected in the evidence category for the qualitative, quantitative, and network analyzes; this because they meet the three defined inclusion/exclusion criteria (see Section 2.3). The other 27 studies were not included in the evidence category mainly because they did not report the factors importance rank that is a necessary requirement to apply the proposed quantitative and network analyzes. However, the factors reported by the 27 documents were taken into account in the analysis of the results reported in Section 3.3.
3.2. Sample Composition for the Qualitative, Quantitative, and Network Analysis
3.2.1. Publication Year and Geographical Area
Table 3 shows the studies’ characteristics that were classified in the evidence category. Related to the publication year: 16 out the 18 studies (88.9%) were published after 2010, and only two studies (11.1%) were published before; this fact evidences the emerging nature of the research topic of cost overrun factors in road infrastructure projects. On the other side, the geographical areas, in which the studies were carried out, are Asia (11), Africa (4), North America (1), Europe (1), and Oceania (1); lacking studies from Latin American countries and other regions.
Table 3.
Documents classified in the evidence category.
3.2.2. Data Source and Measurement Method
Related to the data source to assign the importance level of the cost overrun factors analyzed, 16 out of the 18 studies (88.9%) applied questionnaires based on Likert Scales ranging from 4 to 10 points. On the other side, Ahbab et al. [32] analyzed the frequency of occurrence of the cost overrun factors in a set of sixty-three projects from different Asian countries. Chang [68] analyzed the Cost Deviation Percentage produced by cost overrun factors in a set of four roadway construction projects from California, U.S. (Table 3).
3.2.3. Number of Factors and Categories
The number of costs overrun factors analyzed, ranging from 4 to 10, with an average number of 33 factors. Related to the categories used in the classification of cost overrun factors, 13 of the 18 studies (72.2%) do not use categories, and five of the 18 studies (27.8%) use a number of categories ranging from 3 to 9 (Table 3).
3.3. Qualitative Analysis
3.3.1. Qualitative Analysis by Factor
From the ten most important cost overrun factors reported in each of the 18 documents, 38 were identified and classified into 14 categories. In the same way, five stakeholders’ groups, responsible for the cost overrun phenomenon occurrence, were identified and assigned to the factors: (1) contractor, (2) designer and consultant, (3) external agent, (4) owner, and (5) supplier and subcontractor (Table 4).
Table 4.
Relative frequency by cost overrun factor.
The ‘failures in design’ factor is the one with the highest frequency (Table 4). During the construction phase, several inconveniences occur due to design failures such as errors, inconsistencies, and incomplete information [77]. When a design failure occurs, the contractor must consult the designer team and wait for an answer. Therefore, the design changes could affect the continuity of on-site activities and generate additional costs. This problem can be aggravated when a long time elapses from the design completion until the beginning of the construction phase since an updating of the design norms can occur and other unexpected events. Thus, design issues can affect the continuity and characteristics of construction processes, which can lead to the cost overruns occurrence.
The ‘price variation of materials’ factor is the second most frequently reported factor, which is usually caused by economic phenomena of external nature to the project. This factor is usually beyond the control of the internal stakeholders of the project because the phenomena are related to aspects such as the law of supply and demand, economic volatility, variations in exchange rates, inflation, and others, which can affect the price of materials, producing an increase with respect to the initially estimated costs.
The ‘inadequate project planning’ factor is the third most frequently reported. This factor is associated to planning processes deficiencies that are usually related to: poor work scheduling, planning deficiencies for materials supply, absence of plans for machinery acquisition, lack of goals and deliverables projections, planning of hiring personnel, lack of plans for traffic management, scarcities in environmental issues planning, among others. Deficiencies that cause improvisation at the construction stage, causing costs not considered in the initial estimations.
With the same frequency of the ‘inadequate project planning’ factor, the ‘project scope changes’ factor is the third most frequently reported, which is related to the works that are added to those established in the initial contract. Such additions usually occur during the construction development and can be caused by issues associated with unforeseen and complementary works, terrain conditions, relocation of underground utilities, environmental issues, owner’s requirements, and others. Unforeseen issues that turn into additional costs that cause the cost overruns phenomenon.
The ‘design changes’ factor is the fifth most frequently reported. Design changes can greatly affect the costs associated with the project, considering that design modifications can be made at different times of the project lifecycle, generating waiting unplanned times for the design resolution. Times that could lead to delays in activities, rework, labor occupation instability, additional payments by machinery and wages, additional works not quantified in the budget, contract extensions, charges by consultants, and designers, among others.
With the same frequency of the ‘design changes’ factor, the ‘unrealistic contract duration’ factor is the fifth most frequently reported. Excessive optimism in estimating the contract duration may lead to the contractor being unable to carry out the activities on the schedules planned for the construction stage. Thus, the schedule lags can propitiate the delay phenomenon occurrence, as a consequence, the contractor must make additional unforeseen payments related to wages, machinery, facilities, among others; scenarios where additional payments can become cost overruns.
The ‘political situation’ factor is the seventh most frequently reported. Due to the public nature of road projects, the political situation of a country or region can create favorable environments for the cost overrun occurrence. Situations of insecurity, terrorism, social movements, policy and government changes, bureaucracy, among others, they can compromise the successful project development. Thus, in the most critical situations, it could generate interruption or affectations to construction activities, which to be mitigated would imply unforeseen activities that may lead to the cost overrun phenomenon.
With the same frequency of the ‘political situation’ factor, the ‘legal issues’ factor is the seventh most frequently reported. Due to their characteristics, road projects are largely dependent on legal issues, which may affect the continuity of the different stages of the project lifecycle. Legal aspects related to environment, land acquisition, technical regulations, claims and disputes, technical controls, use of public resources, among others, they may involve significant economic investments to be addressed. Therefore, when not properly estimated, the investments can lead to the cost overrun phenomenon.
With the same frequency of the ‘political situation’ and ‘legal issues’ factors, the ‘inadequate bidding method’ factor is the seventh most frequently reported. In road projects, the bidding method and associated issues are crucial to ensure success in the construction process development. Some government entities, in the search to minimize costs, use bidding methods based on the selection of the contractor that offers the lowest cost. As a result, contractors participating in the selection process attempt to minimize cost estimates to obtain a greater chance of being selected; situation that leads to cost underestimations, which usually manifest themselves as cost overruns in the construction process development.
With the same frequency of ‘political situation’, ‘legal issues’, and ‘inadequate bidding method’ factors, the ‘poor site management and supervision’ factor is the seventh most frequently reported. It because the management and supervision activities carried out by the contractor during the construction process significantly affect the project cost development. Therefore, proper resource management on the site can minimize costs; on the contrary, management and supervision failures can cause unforeseen costs, which in the case of road projects could become significant cost overruns. An example is the management and supervision of machinery, which due to its characteristics are widely used in road projects, thus, adequate practices improve the construction activities efficiency, promoting the reduction of time, cost and resources associated, on the contrary, poor management and supervision could generate unforeseen costs that could lead to the cost overrun phenomenon.
Table 5 shows the cost overrun factors most frequently (top-10) reported in the 18 documents analyzed (Table 3). In addition, Table 5 shows the number of documents that report each factor according to the 45 documents shown in Table 2. The results show that the behavior of the frequency ranks (shown in Table 4) agrees with the number of documents trend that report each factor. Thus, the ‘failures in design’ factor with Rank = 1 is the most reported in the documents collected that address the issue of cost overruns factors in road projects (Table 2). Therefore, it is evident that the sample of the 18 documents selected is representative of the 45 documents shown in Table 2.
Table 5.
Top-10 cost overrun factors and number of documents that report the factor.
3.3.2. Qualitative Analysis by Category
The analysis of factor frequency by category shows that the five most frequent categories are: (1) design, (2) financial, (3) project, (4) contractor, and (5) owner (Table 6). Thus, the ‘design’ category ranks as the first most frequent category, which is influenced by the high frequency of the factors ‘failures in design’ and ‘design changes’, factors located in the top-5 of the most reported cost overrun factors. On the other side, the ‘financial’ category ranks as the second most frequent category, which is mainly due to the high frequency with which the factors ‘price variation of materials’ and ‘financial difficulties of owner’ are reported. These results denote the importance of design and financial aspects in the cost overruns occurrence in road projects. Another remarkable result is that approximately 80% of the factors reported are classified into eight categories: design, financial, project, contractor, owner, external factors, contract, and programming and control.
Table 6.
Relative frequency by category.
3.4. Quantitative Analysis
3.4.1. Quantitative Analysis by Factor
Taking into consideration the qualitative analysis (Table 4) and the Influence Index (II), calculated with Equation (3), the five highest cost overrun factors in road infrastructure projects are: (1) ‘failures in design’, (2) ‘price variation of materials’, (3) ‘inadequate project planning’, (4) ‘project scope changes’, and (5) ‘design changes’ (Table 7). It is observed that the eight factors with the highest Influence Index coincide with those of the highest relative frequency (obtained from the qualitative analysis). Thus, it is evident that these factors are repeatedly reported and are associated with high levels of importance. Therefore, it is recommended that the cost overrun mitigation in road projects be based on the factors with the highest Influence Indexes, where the mitigation measures would be more effective, which may even positively affect other identified factors that do not have high Influence Indexes.
Table 7.
Top cost overrun factors according to the Influence Index (II).
A notable result is the high influence index obtained for the factors ‘failures in design’ (II = 7.60%), ‘price variation of materials’ (II = 3.37%), and ‘inadequate project planning’ (II = 1.90%) compared to the other factors, this shows the strong influence of design, planning and material prices issues on the occurrence of cost overruns as was evidenced by the qualitative analysis. In addition to this, the shortcomings existing in the early stages of road projects are evident; therefore, modifications to current methodologies are required to mitigate the cost overrun phenomenon.
3.4.2. Quantitative Analysis by Category
The category quantitative analysis was carried out through the Average Influence Index (AII), which was calculated with Equation (4).
where m is the number of costs overrun factors classified in the category, and IIi are the influence indexes calculated for the different factors identified (Table 7). Table 8 shows the AII obtained for the different categories analyzed, where the five categories with more Average Influence Index are: (1) design, (2) programming and control, (3) financial, (4) project, and (5) contract.
Table 8.
Top cost overrun categories according to the Average Influence Index (AII).
3.4.3. Quantitative Analysis by Stakeholder’s Group
The quantitative analysis by stakeholder’s group was carried out with the Stakeholder’s Influence Index (SII) that was calculated through Equation (5).
where k is the number of cost overrun factors associated with the stakeholder, n is the total number of cost overrun factors analyzed (n = 38), and IIi are the influence indexes calculated for the different factors identified (Table 7).
Table 9 shows the results for the Stakeholder’s Influence Index (SII) according to the groups analyzed, it is observed that designer (SII = 40.51%) and the owner (SII = 28.45%) have a high responsibility in the occurrence of cost overruns in road projects. The fact that is mainly related to the factors ‘failures in design’ (II = 7.60%), ‘design changes’ (II = 1.15%), ‘inadequate project planning’ (II = 1.90%), ‘unrealistic contract duration’ (II = 0.76%), ‘financial difficulties of owner’ (II = 0.42%), ‘late decision making by owner’ (II = 0.52%), ‘project scope changes’ (II = 1.46%), and ‘inadequate bidding method’ (II = 0.65%).
Table 9.
Stakeholder Influence Index (SII).
The high owner’s responsibility could be associated with the fact that in the majority of cases, the owners of road projects are government agencies associated with extensive, tedious, and rigid procedures that influence stakeholder’s relationships, creating favorable environments for the emergence of cost overrun factors. Therefore, it is recommended the implementation of project delivery methods that promote the integration of project stakeholders with which joint actions could be undertaken to mitigate cost overrun causative factors.
The most influential factors in cost overruns on road projects are the ‘Designer and Consultant’ and ‘Owner’ stakeholder groups, both of which have significant influence over the whole project life cycle and a particular emphasis on early phases of planning and design. While in later phases, such as construction, there is just approximately 7% of influence on the project’s cost overruns. This reaffirms the proposal to strengthen efforts in the early phases of infrastructure projects since at this stage there is greater influence on project changes at lower costs [78]. This can be developed through an Integrated Project Delivery (IPD) approach. In the IPD delivery system, the owner, the designer, and the constructor sign one contract. The owner, the designer, and the constructor collectively manage and appropriately share risks, frequently through a shared contingency pool [79].
3.5. Network Analysis
The authors built the graph of connections between the cost overrun factors, according to the methodology of network analysis (Figure 3). Each cost overrun factor was represented with a node and each connection with an edge. The diameter of the nodes represents the degree of each factor, i.e., the nodes with the largest diameter represent the cost overrun factors with the highest degree. The width of the edge represents the number of papers that mention the pair of nodes in their top-ten of cost overrun factors of road projects, that is, a wider edge implies that there is a greater number of papers that present that pair of factors.
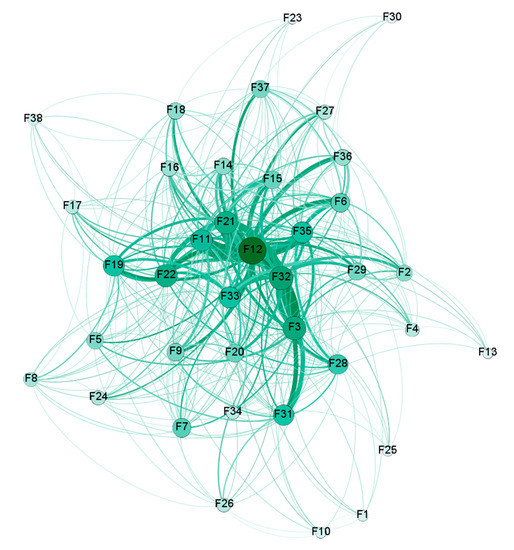
Figure 3.
Representations of cost overrun factors’ network.
Figure 3 represents the network of cost overrun factors for road projects. To build this network, the authors used the free software Gephi 0.9.2 and the Force Atlas rendering algorithm, which groups the nodes with the strongest relative interaction through attraction and repulsion forces. The top-ten cost overrun factors with the highest degree are: ‘failures in design’, ‘inadequate project planning’, ‘unrealistic contract duration’, ‘price variation of materials’, ‘legal issues’, ‘design changes’, ‘project scope changes’, ‘inadequate bidding method’, ‘financial difficulties of owners’, and ‘staffing problems’. In addition, the green color of the nodes in Figure 3 represents the betweenness centrality of each node, i.e., the nodes with a darker green are the factors with the highest betweenness centrality. Therefore, the top-ten cost overrun factors with the highest centrality are: ‘failures in design’, ‘unrealistic contract duration’, ‘inadequate project planning’, ‘legal issues’, ‘project scope changes’, ‘price variation of materials’, ‘design changes’, ‘staffing problem’, ‘late decision making by owner’, and ‘financial difficulties of owner’.
A comparison of the degree measures, centrality and the influence index obtained in Section 3.4.1 confirms the following cost overrun factors of road projects as the most influential: ‘failures in design’, ‘price variation of materials’, ‘inadequate project planning’, ‘project scope changes’, ‘design changes’, and ‘unrealistic contract duration’. Therefore, the need for management in the early stages of the project, i.e., during planning and design, is reinforced. ‘Failures in design’ and ‘design changes’ could be solved through the implementation of BIM and Lean construction approaches. ‘Price variation of materials’, ‘inadequate project planning’, ‘project scope changes’, and ‘unrealistic contract duration’ could be addressed through transparent collaboration and information practices; both are basic principles of approaches to integrated project delivery implementation or other relational contracts. These factors are difficult to resolve with traditional implementation systems, such as design-bid-built.
One factor that is highlighted in network analysis and that does not register as a high influence factor is ‘staff problems’. This means that if the factor alone does not generate a high influence, staffing problems are always present when other factors with high influence are generated, therefore, it is important that project managers manage the team better and reduce problems with the human resources available to the project. Project management should have a perspective on people, processes, and technology. The most influential factors described in the previous paragraph have a strong focus on processes and technology; however, the factor associated with “staff problems” is strongly related to people. This is fundamental to the management of road projects, and in recent years, it has been studied in-depth. Among the key elements of an effective team: trust between team members, commitment to the project, involvement in the goal setting process, better collaboration between all project leaders, cohesion, contract models, elite feeling, team building, and focus on team development.
3.6. Comparative Analysis between Studies: Top-10 Factors
In each paper analyzed, the authors selected the top-10 factors. The 18 papers analyzed have 38 non-repeating factors. The documents show a wide diversity of places of analysis (Asia, America, Europe, Africa, and Oceania) and most used questionnaires to professionals as a source of information. The researchers conducted a comparative analysis, among the 18 papers, identifying the factors they had in common in their results. Table 10 shows the number of common factors reported in the top-10 of the studies analyzed (Table 3).
Table 10.
Number of common factors within the top-10 between studies analyzed.
Table 10 shows the pairs of documents with the most common factors: D3-D5, D3-D14, D4-D14, D5-D6, D5-D10, D7-D11, D7-D13, D11- D12, D14-D16, and D15-D16. Most of the documents with common factors are countries of Southeast Asia and Africa, therefore, it is possible to observe common realities between these countries; however, it is necessary to consider that each country has its own context that is necessary to study and understand its local reality. Also, there are not a great number of common factors with countries in Europe, America, and Oceania. Therefore, it is recommended to carry out a local study in each country, based on the 38 factors identified in this paper. The following section deepens the analysis by region and is complemented by similar studies with non-ranked factors or other types of construction projects.
4. Cost Overrun Factors by Region: Limitations and Challenges
Considering that 83.3% of the documents analyzed in the frequency and importance analysis are studies of projects in the regions of Asia and Africa, it is necessary to extend the analysis in regions such as Europe, America, and Oceania. In these regions, there were no major documents that complied with the inclusion and exclusion criteria; however, there are studies that analyze the factors of cost overruns in construction projects, from a qualitative perspective. These studies will be analyzed below in a discussion of cost overrun factors by region.
To analyze the cost overrun factors by region, the authors have identified the factors reported in the documents by region, according to the top-15 cost overrun factors with the highest Influence Index presented in Table 7. Table 11 shows the relationships between these 15 factors and the regions in which they were reported.
Table 11.
Cost overrun factors reported by region.
According to the document selection process for the America region, a single study met the three inclusion/exclusion criteria (Chang [68]); this fact could be the reason why several top-15 factors that are not reported in the America region (Table 11); however, the information could be complemented with results from other studies. For instance, Bhargava et al. [70] presents a study that uses information from road infrastructure projects in Indiana, United States, which highlights the relationship of the factor ‘inadequate bidding method’ with the occurrence of cost overruns in road projects. On the other hand, Hastak and Baim [71] conducts a study of the factors that affect the cost of maintenance activities for road infrastructure projects in the United States, in which the influence of several of the top-15 factors is reported (Table 11): ‘failures in design’, ‘inadequate project planning’, and ‘poor site management and supervision’. By the other side, Semple et al. [80] present a study of the causes of claims related to cost overruns in construction projects in Canada, in which some factors coincide with those reported in Table 11: ‘project scope changes’, ‘unrealistic contract duration’, and ‘inadequate project planning’. Other studies focused on cost overruns on construction projects in the North American region are Jergeas and Ruwanpura [81], Knight and Fayek [82], Shalwani and Lines [83], related to the South America region: França and Haddad [84], Lozano et al. [85], and Ellis et al. [86]; however, these studies were classified in the background category for not meeting any of criteria 2 or 3. Despite the existing studies, it is evident that in the regions of both North America and South America, studies of cost overruns factors in road infrastructure projects are lacking, which allow a better characterization of the cost overrun phenomenon. However, from the existing information, it is possible to infer that the top-15 of cost overruns in road projects in America is similar to that reported in Table 11, but further studies are recommended.
Similar to the America region, a single document (Torp et al. [73]) was identified for the European region, which met the three inclusion/exclusion criteria. It was evident that in the literature, there are some studies that address the cost overruns in the European region; however, most were discarded due to the fact that the focus of the studies is for general construction or building projects. Therefore, in the document collection process, studies were found that address the issue of cost overruns in countries such as Croatia [87], Denmark [88,89], Germany [90], Lithuania [91], Netherlands [20], Norway [76,92], Portugal [13,93,94], Sweden [75], and United Kingdom [95,96,97]. Taking into account the factors presented in Table 11, it is evident that several of the factors coincide with the findings of other studies focused on European countries. For instance, Larsen et al. [89] carried out a study of the factors that affect delay, cost overruns and quality level of public construction projects in Denmark, where they showed that among the main factors that affect cost overruns are: ‘failures in design’, ‘project scope changes’, ‘poor site investigation’, ‘late decision making by owner’, ‘price variation of materials’, ‘legal issues’, ‘unrealistic contract duration’, ‘financial difficulties of owner’, and others. On the other hand, Moura et al. [93] studied the causes of delay and cost overruns in construction projects in Portugal, where they showed that the main causes of cost overruns are: ‘failures in design’, ‘poor site investigation’, ‘project scope changes’, and others. Thus, the findings of studies of cost overruns in European construction projects and the Torp et al. [73] study suggest that some of the main factors of cost overruns in European road projects are those reported in Table 11. However, due to the low number of studies of cost overruns in European road projects, it is suggested to carry out a greater number of studies; avoiding the general approach to construction projects and focusing the studies on specific types of projects. This because the characteristics of each type of construction project imply that the cost overrun factors vary from one type of project to another.
Considering the countries belonging to the Oceania region, the fact of including a single study that meets the three inclusion/exclusion criteria for the Oceania region (Creedy et al. [18]) is not as limiting as that observed for the America and Europe regions. Despite this, the top-15 factors shown in Table 11 could be compared with the findings of other existing studies related to cost overruns on construction projects in the Oceania region; which focus on projects in Australia [74,98] and New Zealand [99,100,101]. Doloi [98] examines the causes of cost overruns in Australian construction projects, where several of the most important reported causes show several coincidences with the top-15 of cost overruns in road projects with the highest Influence Index found in this study: ‘inadequate project planning’, ‘poor site management and supervision’, ‘inadequate contractor’s experience’, ‘failures in design’, ‘price variation of materials’, ‘project scope changes’, ‘financial difficulties of owner’, ‘design changes’, ‘economy issues’, and others. On the other hand, Adafin et al. [99] study the risk factors that affect the variability of the budget in construction projects in New Zealand, where several factors that coincide with those reported in Table 11 are evident: ‘project scope changes’, ‘failures in design’, ‘economy issues’, ‘inadequate bidding method’, ‘poor site investigation’, and ‘inadequate contractor’s experience’. Therefore, with the findings of the Creedy et al. [18] study and other studies related to the Oceania region, it is possible to infer that several of the cost overruns reported in Table 11 are the most influential in the cost overruns occurrence in road projects in the Oceania region.
Unlike the America, Europe and Oceania regions, the Asia and Africa regions present a large number of documents related to the study of cost overrun factors in construction projects from different countries. Which is evidenced by the number of selected documents with criterion #1 (see Figure 2); where of the 253 selected documents, 133 (52.6%) are related to the Asia region and 59 (23.3%) to the Africa region. Thus, of the 18 documents selected in the final sample of this study, 11 (61.1%) are related to Asia, and four (22.2%) to Africa. Therefore, most of the top-15 cost overrun factors are reported in both Africa and Asia (Table 11). In the case of the Asia region, all the top-15 factors are reported as evidenced in Table 11, however, the most frequently reported factors are: ‘failures in design’, ‘project scope changes’, ‘unrealistic contract duration’, ‘price variation of materials’, ‘inadequate project planning’, ‘design changes’. In the case of the African region, some of the top-15 factors are not reported: ‘project scope changes’, ‘late decision making by owner’, ‘inadequate contractor’s experience’, ‘poor site investigation’, which could be related to the moderate number of studies of cost overruns in road projects related to the Africa region. On the contrary, the most frequently reported factors are: ‘failures in design’, ‘price variation of materials’, ‘inadequate project planning’, and ‘economy issues’. With a general perspective, a notable result is the reporting of design issues in the different regions analyzed, as shown in Table 11 for the factors: ‘failures in design’ that is reported in all regions, and ‘design changes’ that is reported in four of the five regions analyzed.
5. Conclusions
This study presents a systematic review compound by five principal stages: (1) question formulation; (2) searching of relevant documents; (3) document selection; (4) evidence collection, analysis and synthesis; and 5) results’ report. Thirty-eight cost overrun factors were identified and classified into 14 categories. According to the Influence Index, the ten most important and frequent cost overrun factors were: (1) ‘failures in design’, (2) ‘price variation of materials’, (3) ‘inadequate project planning’, (4) ‘project scope changes’, (5) ‘design changes’, (6) ‘unrealistic contract duration’, (7) ‘inadequate bidding method’, (8) ‘legal issues’, (9) ‘late decision making by the owner’, and (10) ‘political situation’. On the one hand, these results show a strong influence of design and planning aspects on the occurrence of cost overruns in road projects, taking into account the high level of influence obtained for the factors ‘failures in design’, ‘design changes’ and ‘inadequate project planning’. Therefore, the cost overrun phenomenon could be widely mitigated through modifications and greater controls to traditional processes developed in the project’s early stages. On the other hand, the factors ‘price variation of materials’, ‘inadequate bidding method’, ‘legal issues’ and ‘political situation’ also have a strong influence; however, their mitigation is more complex due to the mitigation actions might require changes in legislation, in addition to economic and political events related to high volatility and uncertainty.
Based on the findings, it is recommended that the mitigation of cost overruns in road projects be undertaken from the early stages. This due to the fact that several causal factors with high influence values are observed among the top-20 factors with the greatest influence, which are related to different processes that belong to the initial stages of the projects, factors that are under the control of the project stakeholders and therefore have high viability to be addressed. It is worth noting that the aspects related to design require profound changes, which could imply modification of design development methodologies and even the implementation of new technologies that allow solving the current deficiencies that are causing the cost overrun occurrence.
The comparative analysis between studies (Table 10) shows that the factors and the importance level reported varies both from one region to another and from one country to another. In addition to this, it is observed that studies from the same country shows a low number of common factors within the top-10. Therefore, it follows that the factor importance level is affected by the project environment conditions and variables. However, the factors with the highest influence levels reported in Table 7 represent general deficiencies, on which it is feasible to base the shipment of high-impact solutions so that the cost overrun mitigation has a general perspective.
Future works could focus on the following: (1) identifying cost overruns factors for road projects from countries where there are no studies, (2) studying the relationship between cost overruns factors and magnitudes, and (3) analyzing the relationship between reported factors and geographic location. Limitations of this study are: (1) the low number of studies of cost overruns factors in road infrastructure projects located in European and American countries, (2) the selection of the top-10 factors reported with a higher level of importance, instead of a greater number.
Supplementary Materials
The following are available online at https://www.mdpi.com/2076-3417/10/16/5506/s1, Table S1: Database reviewer papers.
Author Contributions
All authors participated in the evidence collection, analysis and synthesis, in addition to document writing. R.H. performed the network analysis of relationships between the identified factors. All authors have read and agreed to the published version of the manuscript.
Funding
This research received no external funding and the APC was funded by Pontificia Universidad Católica de Valparaíso.
Acknowledgments
Omar Sánchez thanks to Colciencias for the sponsorship and support through “Convocatoria Doctorados Nacionales—2015” program. Colciencias is The Administrative Department of Science, Technology, and Innovation, a Colombian government agency that supports fundamental and applied research in Colombia.
Conflicts of Interest
The authors declare no conflict of interest.
References
- Amare, Y.; Quezon, E.T.; Busier, M. Causes of delays during construction phase of road projects due to the failures of contractor, consultant, and employer in Addis Ababa City Road Authority. Int. J. Sci. Eng. Res. 2017, 8, 15–25. [Google Scholar]
- Al Hosani, I.; Dweiri, F.; Ojiako, U. A study of cost overruns in complex multi-stakeholder road projects in the United Arab Emirates. Int. J. Syst. Assur. Eng. Manag. 2020. [Google Scholar] [CrossRef]
- Lee, E.B.; Thomas, D.K.; Alleman, D. Incorporating road user costs into integrated life-cycle cost analyses for infrastructure sustainability: A case study on Sr-91 corridor improvement project (Ca). Sustainability 2018, 10, 179. [Google Scholar] [CrossRef]
- Lee, E.B.; Alleman, D. Ensuring efficient incentive and disincentive values for highway construction projects: A systematic approach balancing road user, agency and contractor acceleration costs and savings. Sustainability 2018, 10, 701. [Google Scholar] [CrossRef]
- Love, P.E.D.; Ahiaga-dagbui, D.D.; Irani, Z. Cost overruns in transportation infrastructure projects: Sowing the seeds for a probabilistic theory of causation. Transp. Res. Part A 2016, 92, 184–194. [Google Scholar] [CrossRef]
- Aziz, R.; Abdel-hakam, A. Exploring delay causes of road construction projects in Egypt. Alex. Eng. J. 2016, 55, 1515–1539. [Google Scholar] [CrossRef]
- Parikh, D.; Joshi, G.J.; Patel, D.A. Development of prediction models for claim cause analyses in highway projects. J. Leg. Aff. Disput. Resolut. Eng. Constr. 2019, 11. [Google Scholar] [CrossRef]
- Rehak, D.; Senovsky, P.; Slivkova, S. Resilience of critical infrastructure elements and its main factors. Systems 2018, 6, 21. [Google Scholar] [CrossRef]
- Useche, S.; Montoro, L.; Alonso, F.; Oviedo-Trespalacios, O. Infrastructural and human factors affecting safety outcomes of cyclists. Sustainability 2018, 10, 299. [Google Scholar] [CrossRef]
- Song, Y.; Wright, G.L.; Wu, P.; Thatcher, D.; McHugh, T.; Li, Q.; Li, S.J.; Wang, X. Segment-based spatial analysis for assessing road infrastructure performance using monitoring observations and remote sensing data. Remote Sens. 2018, 10, 1696. [Google Scholar] [CrossRef]
- Cavalieri, M.; Cristaudo, R.; Guccio, C. On the magnitude of cost overruns throughout the project life-cycle: An assessment for the Italian transport infrastructure projects. Transp. Policy 2019, 79, 21–36. [Google Scholar] [CrossRef]
- Love, P.E.D.; Wang, X.; Sing, C.P.; Tiong, R.L.K. Determining the probability of project cost overruns. J. Constr. Eng. Manag. 2013, 139, 321–330. [Google Scholar] [CrossRef]
- Catalão, F.P.; Cruz, C.O.; Sarmento, J.M. The determinants of cost deviations and overruns in transport projects, an endogenous models approach. Transp. Policy 2019, 74, 224–238. [Google Scholar] [CrossRef]
- Bucciol, A.; Chillemi, O.; Palazzi, G. Cost overrun and auction format in small size public works. Eur. J. Polit. Econ. 2013, 30, 35–42. [Google Scholar] [CrossRef]
- Huo, T.; Ren, H.; Cai, W.; Shen, G.Q.; Liu, B.; Zhu, M.; Wu, H. Measurement and dependence analysis of cost overruns in megatransport infrastructure projects: Case study in Hong Kong. J. Constr. Eng. Manag. 2018, 144. [Google Scholar] [CrossRef]
- Bohórquez, J.J.; Oviedo, N.S.; Mejía, G. Cost overruns in transport infrastructure projects: A current review. In Proceedings of the InNGENIO 2018, Medellin, Colombia, 22–24 August 2018; pp. 1–9. [Google Scholar]
- Bordat, C.; McCullouch, B.G.; Labi, S.; Sinha, K. An Analysis of Cost Overruns and Time Delays of INDOT Projects; Joint Transportation Research Program; Indiana Department of Transportation and Purdue University: West Lafayette, Indiana, 2004. [Google Scholar] [CrossRef]
- Creedy, G.; Skitmore, M.; Wong, J. Evaluation of risk factors leading to cost overrun in delivery of highway construction projects. J. Constr. Eng. Manag. 2010, 136, 528–537. [Google Scholar] [CrossRef]
- Love, P.; Sing, C.; Carey, B.; Kim, J. Estimating construction contingency: Accommodating the potential for cost overruns in road construction projects. J. Infrastruct. Syst. 2014, 21. [Google Scholar] [CrossRef]
- Cantarelli, C.; Van Wee, B.; Molin, E.; Flyvbjerg, B. Different cost performance: Different determinants? The case of cost overruns in Dutch transport infrastructure projects. Transp. Policy 2012, 22, 88–95. [Google Scholar] [CrossRef]
- Lee, J. Cost overrun and cause in Korean social overhead capital projects: Roads, rails, airports, and ports. J. Urban Plan. Dev. 2008, 134, 59–62. [Google Scholar] [CrossRef]
- Roxas, N.; Chalermpong, S. Forecasting inaccuracies in transportation projects in selected South East Asian countries. In Proceedings of the 16th Annual Conference of the Transportation Science Society of the Philippines, Pasay City, Philippines, 19 September 2008; Volume 9, p. 11. [Google Scholar]
- Mahamid, I.; Bruland, A. Cost deviation in road construction projects: The case of Palestine. Australas. J. Constr. Econ. Build. 2012, 12, 58–71. [Google Scholar]
- Rwakarehe, E.E.; Mfinanga, D.A. Effect of inadequate design on cost and time overrun of road construction projects in Tanzania. J. Constr. Eng. Proj. Manag. 2014, 4, 15–28. [Google Scholar] [CrossRef]
- Pai, S.; Patnaik, B.; Mittal, A.; Anand, N. Identification of risks causing time and cost overrun in roads and highway projects in India. Int. J. Civ. Eng. Technol. 2018, 9, 683–697. [Google Scholar]
- Shemi, S.; Asok, K. Examination of cost overrun in highway projects using artificial neural networks in Kerala. Int. J. Innov. Sci. Res. Technol. 2020, 5, 1382–1392. [Google Scholar]
- Tranfield, D.; Denyer, D.; Smart, P. Towards a methodology for developing evidence-informed management knowledge by means of systematic review. Br. J. Manag. 2003, 14, 207–222. [Google Scholar] [CrossRef]
- Briner, R.; Denyer, D. Systematic review and evidence synthesis as a practice and scholarship tool. In The Oxford Handbook of Evidence-Based Management; Oxford University Press: Oxford, UK, 2012; pp. 112–129. [Google Scholar]
- Saieg, P.; Dominguez, E.; Nascimento, D.; Goyannes, R. Interactions of Building Information Modeling, Lean and Sustainability on the Architectural, Engineering and Construction industry: A systematic review. J. Clean. Prod. 2018, 174, 788–806. [Google Scholar] [CrossRef]
- Costin, A.; Adibfar, A.; Hu, H.; Chen, S.S. Building Information Modeling (BIM) for transportation infrastructure—Literature review, applications, challenges, and recommendations. Autom. Constr. 2018, 94, 257–281. [Google Scholar] [CrossRef]
- Mahamid, I.; Bruland, A. Cost overrun causes in road construction projects: Consultants’ perspective. In Proceedings of the 2nd International Conference on Construction and Project Management IPEDR, Singapore, 16–18 September 2011; Volume 15, pp. 6–10. [Google Scholar]
- Ahbab, C.; Daneshvar, S.; Çelik, T. Cost and time management efficiency assessment for large road projects using data envelopment analysis. Tek. Dergi Tech. J. Turkish Chamb. Civ. Eng. 2019, 30, 8937–8959. [Google Scholar] [CrossRef]
- Sánchez, O.; Castañeda, K.; Herrera, R.; Pellicer, E. Benefits of Last Planner® System in mitigation of delay causes in road infrastructure projects. In Proceedings of the XI Simpósio Brasileiro de Gestão e Economia da Construção, Londrina, Brazil, 23–25 October 2019; pp. 1–8. [Google Scholar]
- Rehman, A.; Farooq, H.; Muhammad, R. Cost and time overruns in highway projects of. In Proceedings of the Sixth International Conference on Construction in the 21st Century (CITC-VI) “Construction Challenges in the New Decade”, Kuala Lumpur, Malaysia, 5–7 July 2011; p. 9. [Google Scholar]
- Akogbe, R.K.T.M.; Feng, X.; Zhou, J. Importance and ranking evaluation of delay factors for development construction projects in Benin. KSCE J. Civ. Eng. 2013, 17, 1213–1222. [Google Scholar] [CrossRef]
- Santoso, D.S.; Soeng, S. Analyzing delays of road construction projects in Cambodia: Causes and effects. J. Manag. Eng. 2016, 32, 05016020. [Google Scholar] [CrossRef]
- Rachid, Z.; Toufik, B.; Mohammed, B. Causes of schedule delays in construction projects in Algeria. Int. J. Constr. Manag. 2018, 19, 371–381. [Google Scholar] [CrossRef]
- Adamic, L.; Adar, E. How to Search a Social Network. Soc. Networks 2005, 27, 187–203. [Google Scholar] [CrossRef]
- Pryke, S. Social Network Analysis in Construction; Wiley-Blackwell: Hoboken, NJ, USA, 2012; ISBN 1118343913. [Google Scholar]
- Meeampol, S.; Ogunlan, S. Factors affecting cost and time performance on highway construction projects: Evidence from Thailand. J. Financ. Manag. Prop. Constr. 2006, 11, 3–20. [Google Scholar] [CrossRef]
- Park, Y.I.; Papadopoulou, T. Causes of cost overruns in transport infrastructure projects in Asia: Their significance and relationship with project size. Built Environ. Proj. Asset Manag. 2012, 2, 195–216. [Google Scholar] [CrossRef]
- Zafar, I.; Yousaf, T.; Ahmed, D.S. Evaluation of risk factors causing cost overrun in road projects in terrorism affected areas Pakistan—A case study. KSCE J. Civ. Eng. 2015, 20, 1613–1620. [Google Scholar] [CrossRef]
- Al-Zwainy, F.; Mezher, R. Diagnose the causes of cost deviation in highway construction projects by using root cause analysis techniques. Arab. J. Sci. Eng. 2017, 43, 2001–2012. [Google Scholar] [CrossRef]
- Sohu, S.; Halid, A.; Nagapan, S.; Fattah, A.; Latif, I.; Ullah, K. Causative factors of cost overrun in highway projects of Sindh province of Pakistan. In Proceedings of the IOP Conference Series: Materials Science and Engineering, Johor Bahru, Malaysia, 28–29 August 2017; Volume 271, p. 7. [Google Scholar]
- Mahamid, I. Study of relationship between cost overrun and labour productivity in road construction projects. Int. J. Product. Qual. Manag. 2018, 24, 143–164. [Google Scholar] [CrossRef]
- Preliminary Findings of the Construction Risk Factors Affecting the Cost Overruns of Public Projects in Malaysia. Available online: http://www.academia.edu/download/49466188/PrelimFindingsConstRiskFactorsAffectingCost_OverrunsPublicProjectsMalaysia.PDF (accessed on 25 June 2020).
- Venkateswaran, C.B.; Murugasan, R. Time delay and cost overrun of road over bridge (ROB) construction projects in India. J. Constr. Dev. Ctries. 2017, 22, 79–96. [Google Scholar] [CrossRef]
- Lende, P.K.; Rathod, A.D. Study of factors affecting cost overrun in road construction project. Int. J. Res. Eng. Sci. Manag. 2018, 1, 115–119. [Google Scholar]
- Mahamid, I. Effects of project’s physical characteristics on cost deviation in road construction. J. King Saud Univ. Eng. Sci. 2013, 25, 81–88. [Google Scholar] [CrossRef]
- Sohu, S.; Abdullah, A.H.; Nagapan, S.; Fattah, A.; Ullah, K.; Kumar, K. Contractors perspective for critical factors of cost overrun in highway projects of Sindh, Pakistan. AIP Conf. Proc. 2017, 1892, 080002. [Google Scholar]
- Vu, H.A.; Wang, J.; Min, L.; Mai, S.H.; Nguyen, H.P. Research on cost overrun risk of construction phase of Vietnam highway international contracting project. Engineering 2016, 8, 86–98. [Google Scholar] [CrossRef][Green Version]
- Prasad, A.; Singh, V.; Srivastava, V. Causative factors of cost overrun in highway projects of East Uttar Pradesh State of India. Int. J. Eng. Res. Appl. 2018, 8, 64–71. [Google Scholar]
- Ramanathan, C.T.; Sambu Potty, N.; Bin Idrus, A. Risk factors influencing time and cost overrun in multiple D&B projects in Malaysia: A case study. In Proceedings of the 2011 IEEE International Conference on Industrial Engineering and Engineering Management, Singapore, 6–9 December 2011; pp. 854–859. [Google Scholar] [CrossRef]
- Alhomidan, A. Factors affecting cost overrun in road construction projects in Saudi Arabia. Int. J. Civ. Environ. Eng. IJCEE-IJENS 2013, 13, 1–4. [Google Scholar]
- Chileshe, N.; Berko, P. Causes of project cost overruns within the Ghanaian road construction sector. In Proceedings of the 5th Built Environment Conference, Durban, South Africa, 18–20 July 2010. [Google Scholar]
- Buertey, J.; Kumi, T.; Astrim, F.; Boateng, K. Managing the drivers of cost escalation in the Road Development Sector: An Overview. Int. J. Sci. Technol. Soc. 2015, 3, 295. [Google Scholar] [CrossRef][Green Version]
- Belachew, A.; Mengesha, W.; Mohammed, M. Cost overruns on Federal Capital Territory Authority road construction projects. Am. J. Civ. Eng. 2017, 5, 27. [Google Scholar] [CrossRef][Green Version]
- Anigbogu, N.; Ahmad, Z.; Molwus, J. Cost overruns on Federal Capital territory Authority road construction projects. FUTY J. Environ. 2019, 13, 1–14. [Google Scholar]
- Yousry Akal, A.; Abu El-Maaty, A.E.; El-Hamrawy, S. Mapping the causes of time, cost overruns and quality shortfall in Egyptian Public Highway Projects. Eur. Bus. Manag. 2017, 3, 120. [Google Scholar] [CrossRef]
- El-Kholy, A.M. Exploring the best ANN model based on four paradigms to predict delay and cost overrun percentages of highway projects. Int. J. Constr. Manag. 2019, 1–19. [Google Scholar] [CrossRef]
- Gituro, W.; Mwawasi, S. Time and cost overruns in road construction projects in Kenya under Kenya National Highways Authority. Oper. Res. Soc. East. Afr. J. 2016, 6, 117–156. [Google Scholar]
- Kaliba, C.; Muya, M.; Mumba, K. Cost escalation and schedule delays in road construction projects in Zambia. Int. J. Proj. Manag. 2009, 27, 522–531. [Google Scholar] [CrossRef]
- Mansfield, N.; Ugwu, O.; Doran, T. Causes of delay and cost overruns in Nigerian construction projects. Int. J. Proj. Manag. 1994, 12, 254–260. [Google Scholar] [CrossRef]
- Kogi, B.W.; Were, S. Factors affecting cost overruns in construction projects a case of Kenya National Highways Authority. Int. J. Proj. Manag. 2017, 1, 167–182. [Google Scholar]
- Amadi, A.I.; Higham, A. Latent geotechnical pathogens inducing cost overruns in highway projects. J. Financ. Manag. Prop. Constr. 2017, 22, 269–285. [Google Scholar] [CrossRef]
- Amadi, A.I.; Higham, A. The trickle-down effect of psycho-social constructs and knowledge deficiencies as organizational barriers to cost performance on highway projects. J. Financ. Manag. Prop. Constr. 2008, 23, 57–72. [Google Scholar] [CrossRef]
- Tadewos, S.G.; Patel, D. Factors influencing time and cost overruns in road construction projects: Addis Ababa, Ethiopian scenario. Int. Res. J. Eng. Technol. 2018, 5, 177–180. [Google Scholar]
- Chang, A. Reasons for cost and schedule increase for engineering design projects. J. Manag. Eng. 2002, 18, 29–36. [Google Scholar] [CrossRef]
- Anastasopoulos, P.C.; Haddock, J.E.; Peeta, S. Cost overrun in public-private partnerships: Toward sustainable highway maintenance and rehabilitation. J. Constr. Eng. Manag. 2014, 140. [Google Scholar] [CrossRef]
- Bhargava, A.; Anastasopoulos, P.C.; Labi, S.; Sinha, K.C.; Mannering, F.L. Three-stage least-squares analysis of time and cost overruns in construction contracts. J. Constr. Eng. Manag. 2010, 136, 1207–1218. [Google Scholar] [CrossRef]
- Hastak, M.; Baim, E. Risk factors affecting management and maintenance cost of urban infrastructure. J. Infrastruct. Syst. 2001, 7, 67–76. [Google Scholar] [CrossRef]
- Shane, J.S.; Molenaar, K.R.; Anderson, S.; Schexnayder, C. Construction project cost escalation factors. J. Manag. Eng. 2009, 4, 166–176. [Google Scholar]
- Torp, O.; Belay, A.; Thodesen, C.; Klakegg, O. Cost development over-time at construction planning phase: Empirical evidence from Norwegian construction projects. Procedia Eng. 2016, 145, 1177–1184. [Google Scholar] [CrossRef]
- Ahiaga-Dagbui, D.D.; Love, P.E.D.; Smith, S.D.; Ackermann, F. Toward a systemic view to cost overrun causation in infrastructure projects: A review and implications for research. Proj. Manag. J. 2017, 48, 88–98. [Google Scholar] [CrossRef]
- Lind, H.; Brunes, F. Explaining cost overruns in infrastructure projects: A new framework with applications to Sweden. Constr. Manag. Econ. 2015, 33, 554–568. [Google Scholar] [CrossRef]
- Odeck, J. Cost overruns in road construction—what are their sizesand determinants? Transp. Policy 2004, 11, 43–53. [Google Scholar] [CrossRef]
- Aforla, B.; Woode, A.; Amoah, D.K. Causes of delays in highway construction projects in Ghana. Civ. Environ. Res. 2016, 8, 69–76. [Google Scholar]
- AIA. California Council Integrated Project Delivery: A Guide; The American Institute of Architects: Washington, DC, USA, 2007; pp. 1–62. [Google Scholar]
- Mesa, H.A.; Molenaar, K.R.; Alarcón, L.F. Exploring performance of the integrated project delivery process on complex building projects. Int. J. Proj. Manag. 2016, 34, 1089–1101. [Google Scholar] [CrossRef]
- Semple, C.; Hartman, F.T.; Jergeas, G. Construction claims and disputes: Causes and cost/time overruns. J. Constr. Eng. Manag. 1994, 120, 785–795. [Google Scholar] [CrossRef]
- Jergeas, G.; Ruwanpura, J. Why cost and schedule overruns on mega oil sands projects? Pract. Period. Struct. Des. Constr. 2010, 15, 40–43. [Google Scholar] [CrossRef]
- Knight, K.; Fayek, A. A preliminary study of the factors affecting the cost escalation of construction projects. Can. J. Civ. Eng. 2000, 27, 73–83. [Google Scholar] [CrossRef]
- Shalwani, A.; Lines, B.C. An empirical analysis of the causes of cost and schedule growth for small healthcare and educational construction projects. Int. J. Constr. Educ. Res. 2020. [Google Scholar] [CrossRef]
- França, A.; Haddad, A. Causes of construction projects cost overrun in Brazil. Int. J. Sustain. Constr. Eng. Technol. 2018, 9, 69–83. [Google Scholar] [CrossRef]
- Lozano, S.; Patiño, I.; Gómez, A.; Torres, A. Identificación de factores que generan diferencias de tiempo y costos en proyectos de construcción en Colombia. Ing. Cienc. 2018, 14, 117–151. [Google Scholar] [CrossRef]
- Ellis, L.; Martin, H.; Ramcharitar, S. Factors influencing triple constraints in public sector projects in Trinidad and Tobago. Proc. Inst. Civ. Eng. Manag. Procure. Law 2019, 172, 157–169. [Google Scholar] [CrossRef]
- Radujkovic, M. The causes of time and cost overruns in construction projects. In Proceedings of the CIB W55 & W65 Joint Triennial Symposium, Cape Town, South Africa, 5–10 September 1999; pp. 5–10. [Google Scholar]
- Larsen, J.K.; Brunoe, T.D.; Lindhard, S.M. Analyzing factors affecting time, cost, and quality between diverse public construction agencies. In Proceedings of the ICCREM 2015, Lulea, Sweden, 11–12 August 2015; pp. 1–11. [Google Scholar]
- Larsen, J.K.; Shen, G.Q.; Lindhard, S.M.; Brunoe, T.D. Factors affecting schedule delay, cost overrun, and quality level in public construction projects. J. Manag. Eng. 2016, 32, 04015032. [Google Scholar] [CrossRef]
- Kostka, G.; Anzinger, N. Offshore wind power expansion in Germany: Scale patterns, and causes of time delays and cost overruns. In Large Infrastructure Projects in Germany: Between Ambition and Realities; Palgrave Macmillan: Cham, Switzerland, 2016; pp. 147–189. [Google Scholar]
- Gudiene, N.; Banaitis, A.; Banaitiene, N.; Lopes, J. Development of a conceptual critical success factors model for construction projects: A case of lithuania. In Proceedings of the 11th International Conference on Modern Building Materials, Structures and Techniques, Vilnius, Lithuania, 16–17 May 2013; Elsevier B.V.: Kidlington, UK, 2013; Volume 57, pp. 392–397. [Google Scholar]
- Kayrbekova, D.; Markeset, T.; Panesar, S.S. Identification of factors causing time and cost overruns in offshore petroleum modification projects. IFIP Adv. Inf. Commun. Technol. 2012, 384, 268–275. [Google Scholar]
- Moura, H.; Teixeira, J.; Pires, B. Dealing with cost and time in the Portuguese construction industry. In Proceedings of the CIB World Building Congress, Cape Town, South Africa, 14–17 May 2007; Volume 422, pp. 1252–1265. [Google Scholar]
- Catalão Pinheiro, F.; Cruz, C.O.; Miranda Sarmento, J. Exogenous determinants of cost deviations and overruns in local infrastructure projects. Constr. Manag. Econ. 2019, 37, 697–711. [Google Scholar] [CrossRef]
- Jackson, S. Project cost overruns and risk management. In Proceedings of the Association of Researchers in Construction Management 18th Annual ARCOM Conference, Newcastle, Northumber University, UK, 2–4 September 2002; pp. 1–10. [Google Scholar]
- Jennings, W. Why costs overrun: Risk, optimism and uncertainty in budgeting for the London 2012 Olympic Games. Constr. Manag. Econ. 2012, 30, 455–462. [Google Scholar] [CrossRef]
- Alzahrani, J.I.; Emsley, M.W. The impact of contractors’ attributes on construction project success: A post construction evaluation. Int. J. Proj. Manag. 2013, 31, 313–322. [Google Scholar] [CrossRef]
- Doloi, H. Cost overruns and failure in project management: Understanding the roles of key stakeholders in construction projects. J. Constr. Eng. Manag. 2013, 139. [Google Scholar] [CrossRef]
- Adafin, J.; Rotimi, J.O.B.; Wilkinson, S.; Mbachu, J. An assessment of risk factors impacting budget variability in New Zealand commercial construction projects. In Proceedings of the 35th Annual ARCOM Conference, Leeds, UK, 2–4 September 2019; pp. 44–53. [Google Scholar]
- Zhao, L.; Wang, B.; Mbachu, J.; Liu, Z. New Zealand building project cost and its influential factors: A structural equation modelling approach. Adv. Civ. Eng. 2019, 2019, 1362730. [Google Scholar] [CrossRef]
- Zhao, L.; Mbachu, J.; Liu, Z. Identifying significant cost-influencing factors for sustainable development in construction industry using structural equation modelling. Math. Probl. Eng. 2020, 2020, 4810136. [Google Scholar] [CrossRef]
© 2020 by the authors. Licensee MDPI, Basel, Switzerland. This article is an open access article distributed under the terms and conditions of the Creative Commons Attribution (CC BY) license (http://creativecommons.org/licenses/by/4.0/).