Abstract
Flexible printed electronic circuits have recently attracted attention as an alternative promising methodology due to the additive process being more environmentally friendly and using less raw material compared to conventional lithography and chemical vapor deposition. However, printed circuits produced by roll-to-roll (R2R) conveyance are often scratched, which can result in breaks in the conductive tracks, cracks, or pinholes. This study investigated a proposed optimal design for an air bar for use in an R2R printing system. The optimal distance between the roll surface and floating substrate for preventing scratching of the printed circuit was investigated. The optimal design—including the blower frequency, size of air holes, and density of air holes—was investigated using simulations of fluid–structure interactions for estimating substrate behavior during pneumatic flotation. The distribution of air pressure in the space between the substrate and the surface of the air bar was calculated, and the deformation of the substrate by the air pressure was analyzed. The optimal design of the air bar was verified in numerical simulations and experiments using various conditions.
1. Introduction
Flexible printed electronic circuits have recently attracted attention as an alternative promising methodology due the additive process being more environmentally friendly and using less raw material compared to conventional lithography and chemical vapor deposition [1,2,3,4,5,6]. As printed circuits become more complex and thinner, preventing circuit defects becomes a significant issue. Circuits are often scratched during the roll-to-roll (R2R) conveyance process, which can result in breaks in the conductive tracks, cracks, or pinholes [7,8,9,10,11]. This has prompted several suggestions of using flotation of the conveying substrate with a pneumatic cylinder [12,13,14,15,16]. An equivalent model of the flotation height, angle of air holes, and effective pressure has been proposed [12]. Also, the aerodynamic forces have been studied by considering the effect of flotation height and out-of-plane stability characteristics [13]. A governing partial differential equation was developed for the lateral deflection and stability of both straight and cambered substrates. Also, dimensionless parameters were proposed, including for the tension in and deflection of the substrate [14]. The flotation height has also been derived using an extensional resiliency model [15].
We have previously suggested a method for preventing scratching of the printed pattern during R2R conveyance [17]. In the R2R conveyance process for multilayered printing, individual printing roll was rotated in precisely the same phase for the register control. Thus, the tension fluctuation of substrate was not able to be controlled, which resulted in the correlation between tension in substrate and flotation height. The correlation between the tension in the substrate and the flotation height was derived using the mass conservation law. The strain variation according to the aerodynamic lifting force was determined based on the floating height. In this approach, the substrate was assumed to be a spring with an empirical coefficient, which varied with the design of the air bar.
One limitation of our previous study is that it investigated a fixed structure of the air bar and operating conditions. Even though the proposed mathematical model of the air bar system was validated in simulations and experiments, no previous study has investigated the design of the air bar in terms of the size, density, and distribution of air holes under various tension and velocity conditions. To prevent scratching the printed circuit due to roll contact, the distance between the roll surface and floating substrate needs to be investigated between the locations where it enters and exits the air bar.
In the present study, we analyzed the optimal design for an air bar by considering the height of the substrate throughout the area where the substrate faces the air bar. FSI (fluid–structure interaction) numerical simulations were carried out to estimate the substrate behavior caused by pneumatic flotation. The distribution of air pressure in the space between the substrate and the surface of the air bar was first determined, and then the deformation of the substrate induced by this air pressure was calculated. The optimal hole density was determined from among several design candidates based on numerical simulations and experiments.
2. Mathematical Models of Pneumatic Flotation
This section presents a mathematical model of pneumatic flotation for an R2R conveyance system based on a tension model and an empirical model of the tension variation due to air pressure. The dynamics of longitudinal behavior of a moving substrate is described as [17,18,19]
where L, , and are the span length (m), the tangential velocity of the roll (m/s), and the strain of the substrate, respectively.
To include the effect of pneumatic pressure, the total strain can be assumed as a superposition of strains owing to longitudinal dynamics () and air pressure () [17]
Substituting the derivatives of (2) into (1) and then applying linearization using the perturbation method and Hooke’s law yields the total strain of the floating substrate
where A, L, T, , and V are the cross-sectional area of the substrate, the length of the substrate, the variation in the tension, the tangential velocity of the roll in the initial state, and the variation in the tangential velocity of the roll, respectively. Equation (3) expresses the linearized dynamics for the tension in the substrate based on the pneumatic pressure. Then, the pneumatic pressure can be reflected as a tension variation due to the height of the floating substrate (4)
where , h, and are the equivalent aerodynamic spring constant, flotation height and wrap angle, respectively. Combining (3) and (4) gives [17]
where H is the variation in the flotation height from the steady state.
Equation (5) describes the dynamics of the tension induced by the pneumatic pressure as well as the velocity of the roll and the tension in the previous span. It is notable that empirical parameter can only be obtained by measuring the flotation height and flotation-induced tension variation in the designated air-bar setup. The next section investigates design parameters such as the hole size, density, and distribution for the optimal design of pneumatic flotation.
2.1. FSI Numerical Simulations
FSI analyses were performed to investigate four types of air bar with different hole densities. Based on the typical design of air bar, the design of Type 0 was determined as shown in Figure 1 [20]. Type 0 is a commonly applied design of the air holes in a square distribution without holes in the middle. It is known that this design of air holes generates a sufficient flotation height in the middle of the air bar, but the effect of flotation is reduced at the entry and exit positions due to a reduction in the pressure. We therefore suggested alternative designs with additional air holes on both sides of the Type-0 design, which are shown as Types A to C in Figure 1. The additional air holes were distributed in two rows, and only the density of the air holes varied among the alternative designs. The densities in the additional two rows were 0.094 and 0.052 for Types A and B, respectively, while in Type C the two rows had different densities of 0.052 and 0.013.
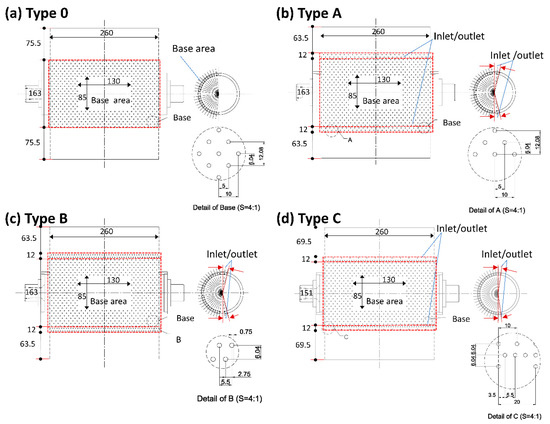
Figure 1.
Candidate air-bar designs for the FSI simulations. (a) Type 0 is the base design with a 180-degree hole distribution with a density of 0.026. (b) Type A is an alternative design based on Type 0, with additional holes at the inlet and outlet with a density of 0.026 in two rows. (c) Type B is an alternative based on Type 0, with additional holes at the inlet and outlet with a density of 0.094 in two rows. (d) Type C is an alternative based on Type 0, with additional holes at the inlet and outlet with densities of 0.052 and 0.013 in two rows, respectively.
The simulation procedure is summarized as follows: The air bar was modeled in three dimensions using CAD software. It had a symmetric shape in the longitudinal direction, and so only half of the real air bar was modeled in order to make the analysis more efficient and rapid (Figure 2a). The pressure at an air hole was determined, as shown in Figure 2b, while the detailed design of the hole is illustrated in Figure 3. The hole diameters at the inlet and outlet were 2 mm and 5 mm, respectively, and the spreading angle of each hole outlet was 90 degrees. A pressure regulator was employed to supply a constant pressure to the air bar, and so the inlet pressure was assumed to be constant, at 0.025 bar in these simulations. The pressure at the hole outlet was calculated as 8.753 Pa under the given geometric parameters (Figure 3). The flow in the nozzle was assumed to be a laminar flow, thus the pressure was uniform and changed at the top of the nozzle.
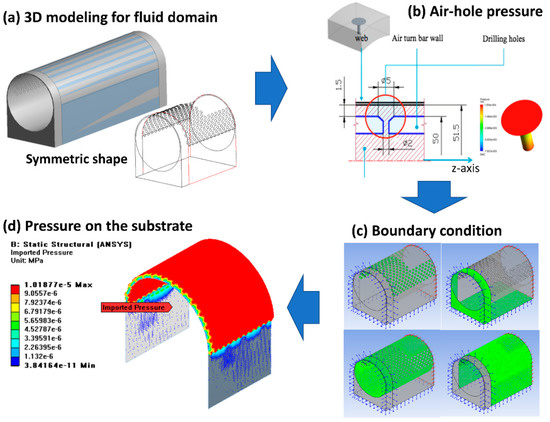
Figure 2.
Summary of the FSI analysis protocol: (a) three-dimensional (3D) modeling of the symmetrical air bar, (b) determining the pressure at the air hole, (c) boundary conditions for the fluid simulations, and (d) the pneumatic pressure acting on the substrate induced by the air flow.
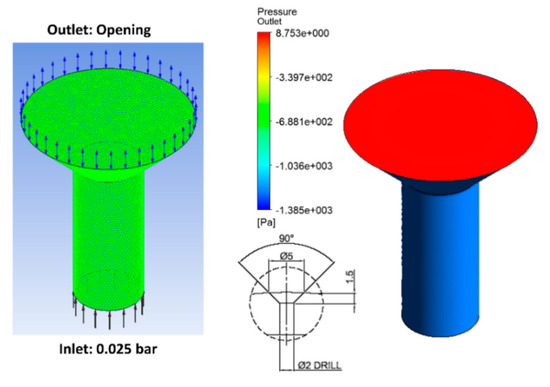
Figure 3.
Detail of an air hole, and the pressure distribution from the inlet to the outlet.
The boundary conditions for the fluid simulations were assigned as shown in Figure 2c. The input area was selected at the outlet of the air holes where the pneumatic pressure was supplied to produce substrate flotation. Similarly, the output area was selected at the side of the flotation space where the air can spill out. The pneumatic pressure acting on the substrate due to the air flow was analyzed (Figure 2d). Figure 4 summarizes the pressure distribution on the substrate for each design of air bar. It is notable that the direction of the pneumatic pressure reversed at the entry and exit positions (circles in Figure 4). This phenomenon could generate a vortex at both ends of the air bar, resulting in the height of the substrate being reduced compared to that in the middle area. The minimum pressures on each side were −3.899 Pa, −2.923 Pa, −1.957 Pa, and −2.912 Pa for Types 0, A, B, and C, respectively. Table 1 lists the minimum and maximum pressures at the inlet and outlet.
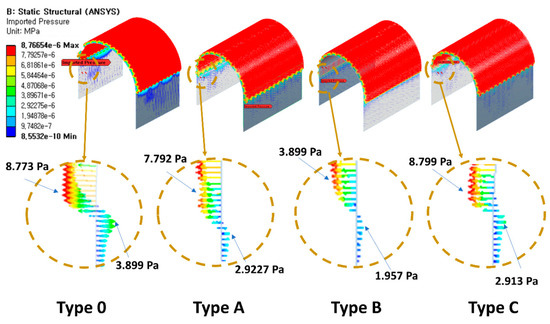
Figure 4.
Pressure distribution on the substrate for each air-bar design.

Table 1.
Results of the PSI simulations of the pneumatic pressure and deformation of the substrate in the side and middle areas as a function of the air-hole density.
A structural analysis of the floating substrate was used to investigate the deformation between the inlet and outlet and the middle area due to the induced pressure distribution. The two sorts of deformation were depicted along the x-axis for the inlet and outlet and along the y-axis for the middle area (Figure 5). Table 1 summarizes the deformation and pneumatic pressure of the substrate. Among Types 0, A, and B, the increased air-hole density of the additional rows decreased the negative pressure, while the variation in the deformation increased. Therefore, the alternative design of Type C was employed with air-hole densities of 0.052 and 0.013 for the two rows, which represented an intermediate design between those of Types A and B. The inlet and outlet pressures for Type C were similar to those for Type A, but the difference in the deformation was decreased by more than five-fold. The following cost function (J) was proposed (each design is illustrated in Figure 6) [21]
where x is the minimum pressure at inlet/outlet, xT is the transpose of x, u is the difference in the deformation between the inlet and outlet and the middle area, uT is the transpose of u, Q and R are weighting factors, and J is a cost function.
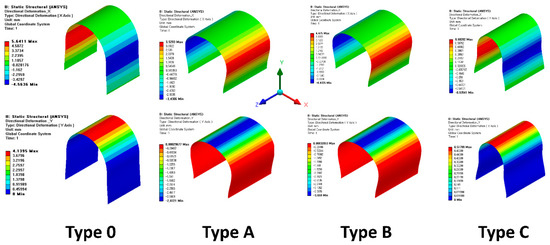
Figure 5.
Deformation of the floating substrate induced by the calculated pneumatic pressure. The upper and lower rows indicate the deformations along the x-axis and y-axis, respectively.
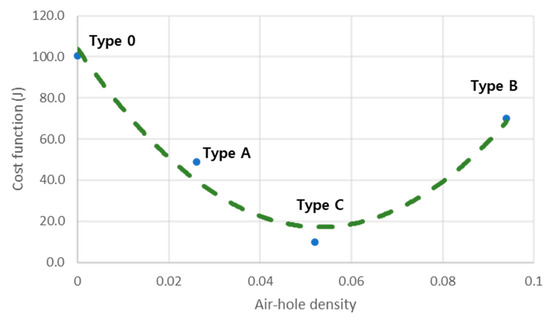
Figure 6.
Cost function (J) as a function of air-hole density.
2.2. Experimental Verification
In order to verify the optimal design of the air bar proposed in the previous section, we manufactured a prototype based on the design of Type C and equipped it in the drying and sintering section, as shown in Figure 7. The tension in the substrate cannot be controlled due to the registration in the drying section of the R2R process [22,23]. The testing platform for the R2R process comprising unwinding, printing, drying, cooling, and rewinding has been described in detail for our previous study [17].
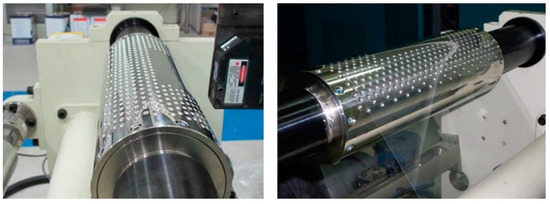
Figure 7.
Experimental setup for the air bar, with a laser-based sensor used for flotation detection.
An air bar was manufactured from stainless steel with a diameter of 100 mm, width of 300 mm, air-hole diameter of 2 mm, and air-hole density of 0.052 in the base area. The densities of the additional air holes at the entry and exit were 0.026 and 0.008, respectively. The operating velocities were 10 m/min and 15 m/min. The flotation height of the moving substrate was measured using a laser-based displacement sensor (KL-G 30, Keyence, Osaka, Japan).
The operating frequency of the blower for supplying air flow into flotation bar was determined in the stationary state of the R2R process to maintain a certain flotation height between the substrate and the surface of the air bar: both 25 Hz and 35 Hz were selected, corresponding to the output pneumatic pressures of 25 mbar and 35 mbar, respectively. We divided the flotation area into three sections of equal sizes: in the direction along with the substrate moved (inlet, middle, and outlet), and in lateral direction (left, center, and right), producing a total of nine combinations (Figure 8). Cubic linear interpolation was applied in this study. Table 2 lists the measured flotation height of the moving substrate in each section as a function of the operating velocity and blower frequency.
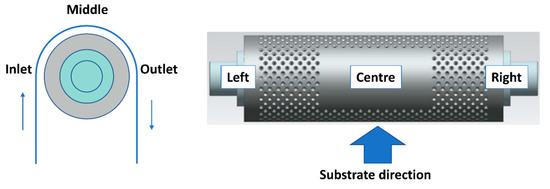
Figure 8.
Side and top views of the designated locations for flotation measurements.

Table 2.
Measured flotation height as a function of velocity, blower frequency, and location.
The overall flotation height was larger in the right area than in both the center and left sections, as shown in Figure 9. In the experimental setup, the blower was connected to the left side of the air bar. Because the internal diameter of the junction (24 mm) was much smaller than that of the air bar (88 mm), the fluid velocity increased inside the joint junction. This increased fluid velocity would result in a reduction of the pressure near the left side of the air bar due to the Venturi effect [24], and so the substrate floated higher on the right side.
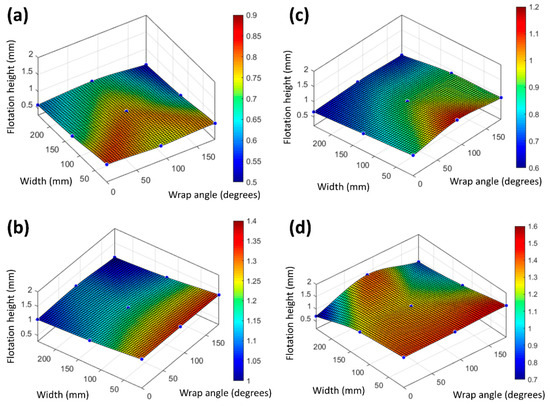
Figure 9.
Measured flotation heights as a function of operating velocity and blower frequency. A width of 0 mm refers to the right area and a wrap angle of 0 degrees refers to the inlet. The velocity and blower frequency were respectively (a) 10 m/min and 25 Hz, (b) 10 m/min and 35 Hz, (c) 15 m/min and 25 Hz, and (d) 15 m/min and 35 Hz.
Table 2 indicates that the standard deviations of the height were larger at the inlet and outlet than at the center, except for the condition of 15 m/min and 25 Hz. As indicated in Figure 4, the vortex caused by the reversal in the direction of pressure at each end of the air bar amplified the oscillation of the flotation, resulting in the large standard deviation.
In all cases the average flotation height exceeded 0.5 mm, and it increased with the blower frequency: from 0.7 mm to 1.17 mm and from 0.83 mm to 1.21 mm at velocities of 10 m/min and 15 m/min, respectively (Figure 9 and Table 2). The tension in the substrate is depicted in Figure 10. A higher blower frequency increased the tension in the substrate, and also increased the difference between the maximum and minimum flotation heights: from 0.237 mm to 0.32 mm and from 0.446 mm to 0.725 mm at velocities of 10 m/min and 15 m/min, respectively (Table 2). These observations indicate that the blower frequency must be carefully determined while considering the trade-off between the average height and the difference between the maximum and minimum heights.
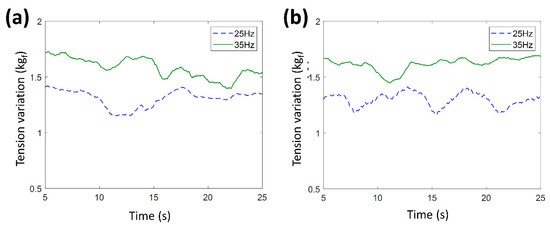
Figure 10.
Measured tension in the substrate for blower frequencies of 25 Hz and 35 Hz at operating velocities of 10 m/min (a) and 15 m/min (b).
3. Conclusions
This study investigated a proposed optimal design for an air bar in an R2R printing system. With the aim of preventing scratching of the printed circuit due to roll contact, the distance between the roll surface and the floating substrate was investigated between the locations where it enters and exits the air bar. The optimal design including the blower frequency, size of air holes, and density of air holes was investigated using FSI numerical simulations of the substrate behavior induced by pneumatic flotation. The distribution of air pressure in the space between the substrate and the surface of the air bar was calculated, and the deformation of the substrate induced by the air pressure was analyzed. The optimal design of the air bar was verified in numerical simulations and experiments under various conditions. By the optimal design of the presented air bar, the average flotation height was achieved over 0.5 mm and the S.D. of flotation height of a moving substrate was below 0.265 with the blower frequency of 25 Hz and 35 Hz at operating velocities of 10 m/min and 15 m/min, respectively.
Author Contributions
Conceptualization, H.K. and C.L.; Data Curation, C.L.; Formal Analysis, H.K.; Writing-Original Draft Preparation, H.K. and C.L.; Writing-Review & Editing, C.L.; Funding Acquisition, C.L. All authors have read and agreed to the published version of the manuscript.
Funding
This work was supported by a National Research Foundation of Korea (NRF) grant funded by the Korea government (MSIT) (no. 2020R1A2C1012428).
Conflicts of Interest
The authors declare that they have no known competing financial interests or personal relationships that could have appeared to influence the work reported in this paper.
References
- Lee, J.; Byeon, J.; Lee, C. Fabrication of Thickness-Controllable Double Layer Electrolyte Using Roll-to-Roll Additive Manufacturing System. Int. J. Precis. Eng. Manuf. Green Technol. 2020, 7, 635–642. [Google Scholar] [CrossRef]
- Lee, J.; Byeon, J.; Lee, C. Theories and Control Technologies for Web Handling in the Roll-to-Roll Manufacturing Process. Int. J. Precis. Eng. Manuf. Green Technol. 2020, 7, 525–544. [Google Scholar] [CrossRef]
- Lee, J.; Kim, S.; Lee, C. Taper Tension Profile in Roll-to-Roll Rewinder: Improving Adhesive Force of Pressure-Sensitive Adhesive Film. Int. J. Precis. Eng. Manuf. Green Technol. 2019, 6, 853–860. [Google Scholar] [CrossRef]
- Zhang, H.; Moon, S.K.; Ngo, T.H. 3D Printed Electronics of Non-contact Ink Writing Techniques: Status and Promise. Int. J. Precis. Eng. Manuf. Green Technol. 2019, 7, 511–524. [Google Scholar] [CrossRef]
- Ball, A.K.; Roy, S.S.; Kisku, D.R.; Murmu, N.C. A New Approach to Quantify the Uniformity Grade of the Electrohydrodynamic Inkjet Printed Features and Optimization of Process Parameters Using Nature-Inspired Algorithms. Int. J. Precis. Eng. Manuf. 2020, 21, 387–402. [Google Scholar] [CrossRef]
- Kim, C.; Jeon, S.W.; Kim, C.H. Reduction of Linearly Varying Term of Register Errors Using a Dancer System in Roll-to-Roll Printing Equipment for Printed Electronics. Int. J. Precis. Eng. Manuf. 2019, 20, 1485–1493. [Google Scholar] [CrossRef]
- Kang, H.; Lee, C. Effect of tension on conductivity of gravure printed Ag layer in roll-to-roll process. Int. J. Precis. Eng. Manuf. 2015, 16, 99–104. [Google Scholar] [CrossRef]
- Lee, D.J.; Oh, J.H.; Bae, H.S. Crack formation and substrate effects on electrical resistivity of inkjet-printed Ag lines. Mater. Lett. 2010, 64, 1069–1072. [Google Scholar] [CrossRef]
- Dikshit, V.; Nagalingam, A.P.; Yap, Y.L.; Sing, S.L.; Yeong, W.Y.; Wei, J. Crack monitoring and failure investigation on inkjet printed sandwich structures under quasi-static indentation test. Mater. Des. 2018, 137, 140–151. [Google Scholar] [CrossRef]
- Khachatryan, H.; Kim, D.; Kim, M.; Kim, H. Roll-to-Roll fabrication of ITO thin film for flexible optoelectronics applications: The role of post-annealing. Mater. Sci. Semicond. Process. 2018, 88, 51–56. [Google Scholar] [CrossRef]
- Lee, J.; Kim, S.; Lee, C. Surface Drying for Brittle Material Coating Without Crack Defects in Large-Area Roll-To-Roll Coating System. Int. J. Precis. Eng. Manuf. Green Technol. 2019, 6, 723–730. [Google Scholar] [CrossRef]
- Chang, Y.B.; Moretti, P.M. Aerodynamic Characteristics of Pressure-Pad Air Bars. ASME J. Appl. Mech. 2000, 67, 177–182. [Google Scholar] [CrossRef]
- Chang, Y.B.; Swanson, R.P.; Moretti, P.M. Longitudinal and Out-of-Plane Stiffness of a Web in an Air-Flotation Oven. In Proceedings of the ASME Noise Control and Acoustics Division International Mechanical Engineering Congress and Exposition (IMECE ’99), Nashville, TN, USA, 14–19 November 1999; pp. 435–443. [Google Scholar]
- Moretti, P.M. Lateral Deflection of webs in Air-Flotation Ovens. ASME J. Appl. Mech. 2004, 71, 314–320. [Google Scholar] [CrossRef]
- Chang, Y.B.; Swanson, R.P.; Moretti, P.M. Resiliency of an Air-Floated Web. In Proceedings of the 5th International Conference on Web Handling, Stillwater, OK, USA, 6–9 June 1999; pp. 543–558. [Google Scholar]
- Müftü, S. Mechanics of a thin, tensioned shell, wrapped helically around a turn-bar. J. Fluids Struct. 2007, 23, 767–785. [Google Scholar] [CrossRef]
- Lee, C.; Kang, H.; Kim, H.; Shin, K. Noble Logic for Preventing Scratch on Roll-to-Roll Printed Layers in Noncontacting Transportation. Jpn. J. Appl. Phys. 2010, 49, 5S1. [Google Scholar] [CrossRef]
- Shin, K. Tension Control; Tappi Press: Atlanta, GA, USA, 2000. [Google Scholar]
- Kang, H.; Shin, K. Precise tension control of a dancer with a reduced-order observer for roll-to-roll manufacturing systems. Mech. Mach. Theory 2018, 122, 75–85. [Google Scholar] [CrossRef]
- Müftü, S.; Lewis, T.S.; Cole, K.A.; Benson, R.C. A Two Dimensional Model of the Fluid Dynamics of an Air Reverser. J. Appl. Mech. 1998, 65, 171–177. [Google Scholar] [CrossRef]
- Skogestad, S. Postlethwaite, Multivariable Feedback Control; Wiley: Chichester, UK, 1996; pp. 344–349. [Google Scholar]
- Lee, J.; Shin, K.; Kang, H. Design of a register controller considering inherent characteristics of a roll-to-roll continuous manufacturing system. Int. J. Adv. Manuf. Technol. 2019, 102, 3725–3737. [Google Scholar] [CrossRef]
- Kang, H.; Lee, C.; Shin, K. Modeling and compensation of the machine directional register in roll-to-roll printing. Control Eng. Pract. 2013, 21, 645–654. [Google Scholar] [CrossRef]
- Scheaua, F.D. Theoretical approaches regarding the VENTURI effect. Hidraulica 2016, III, 69–72. [Google Scholar]
© 2020 by the authors. Licensee MDPI, Basel, Switzerland. This article is an open access article distributed under the terms and conditions of the Creative Commons Attribution (CC BY) license (http://creativecommons.org/licenses/by/4.0/).