Investigation of Size Effects Due to Different Cooling Rates of As-Quenched Martensite Microstructures in a Low-Alloy Steel


Abstract
Featured Application
Abstract
1. Introduction
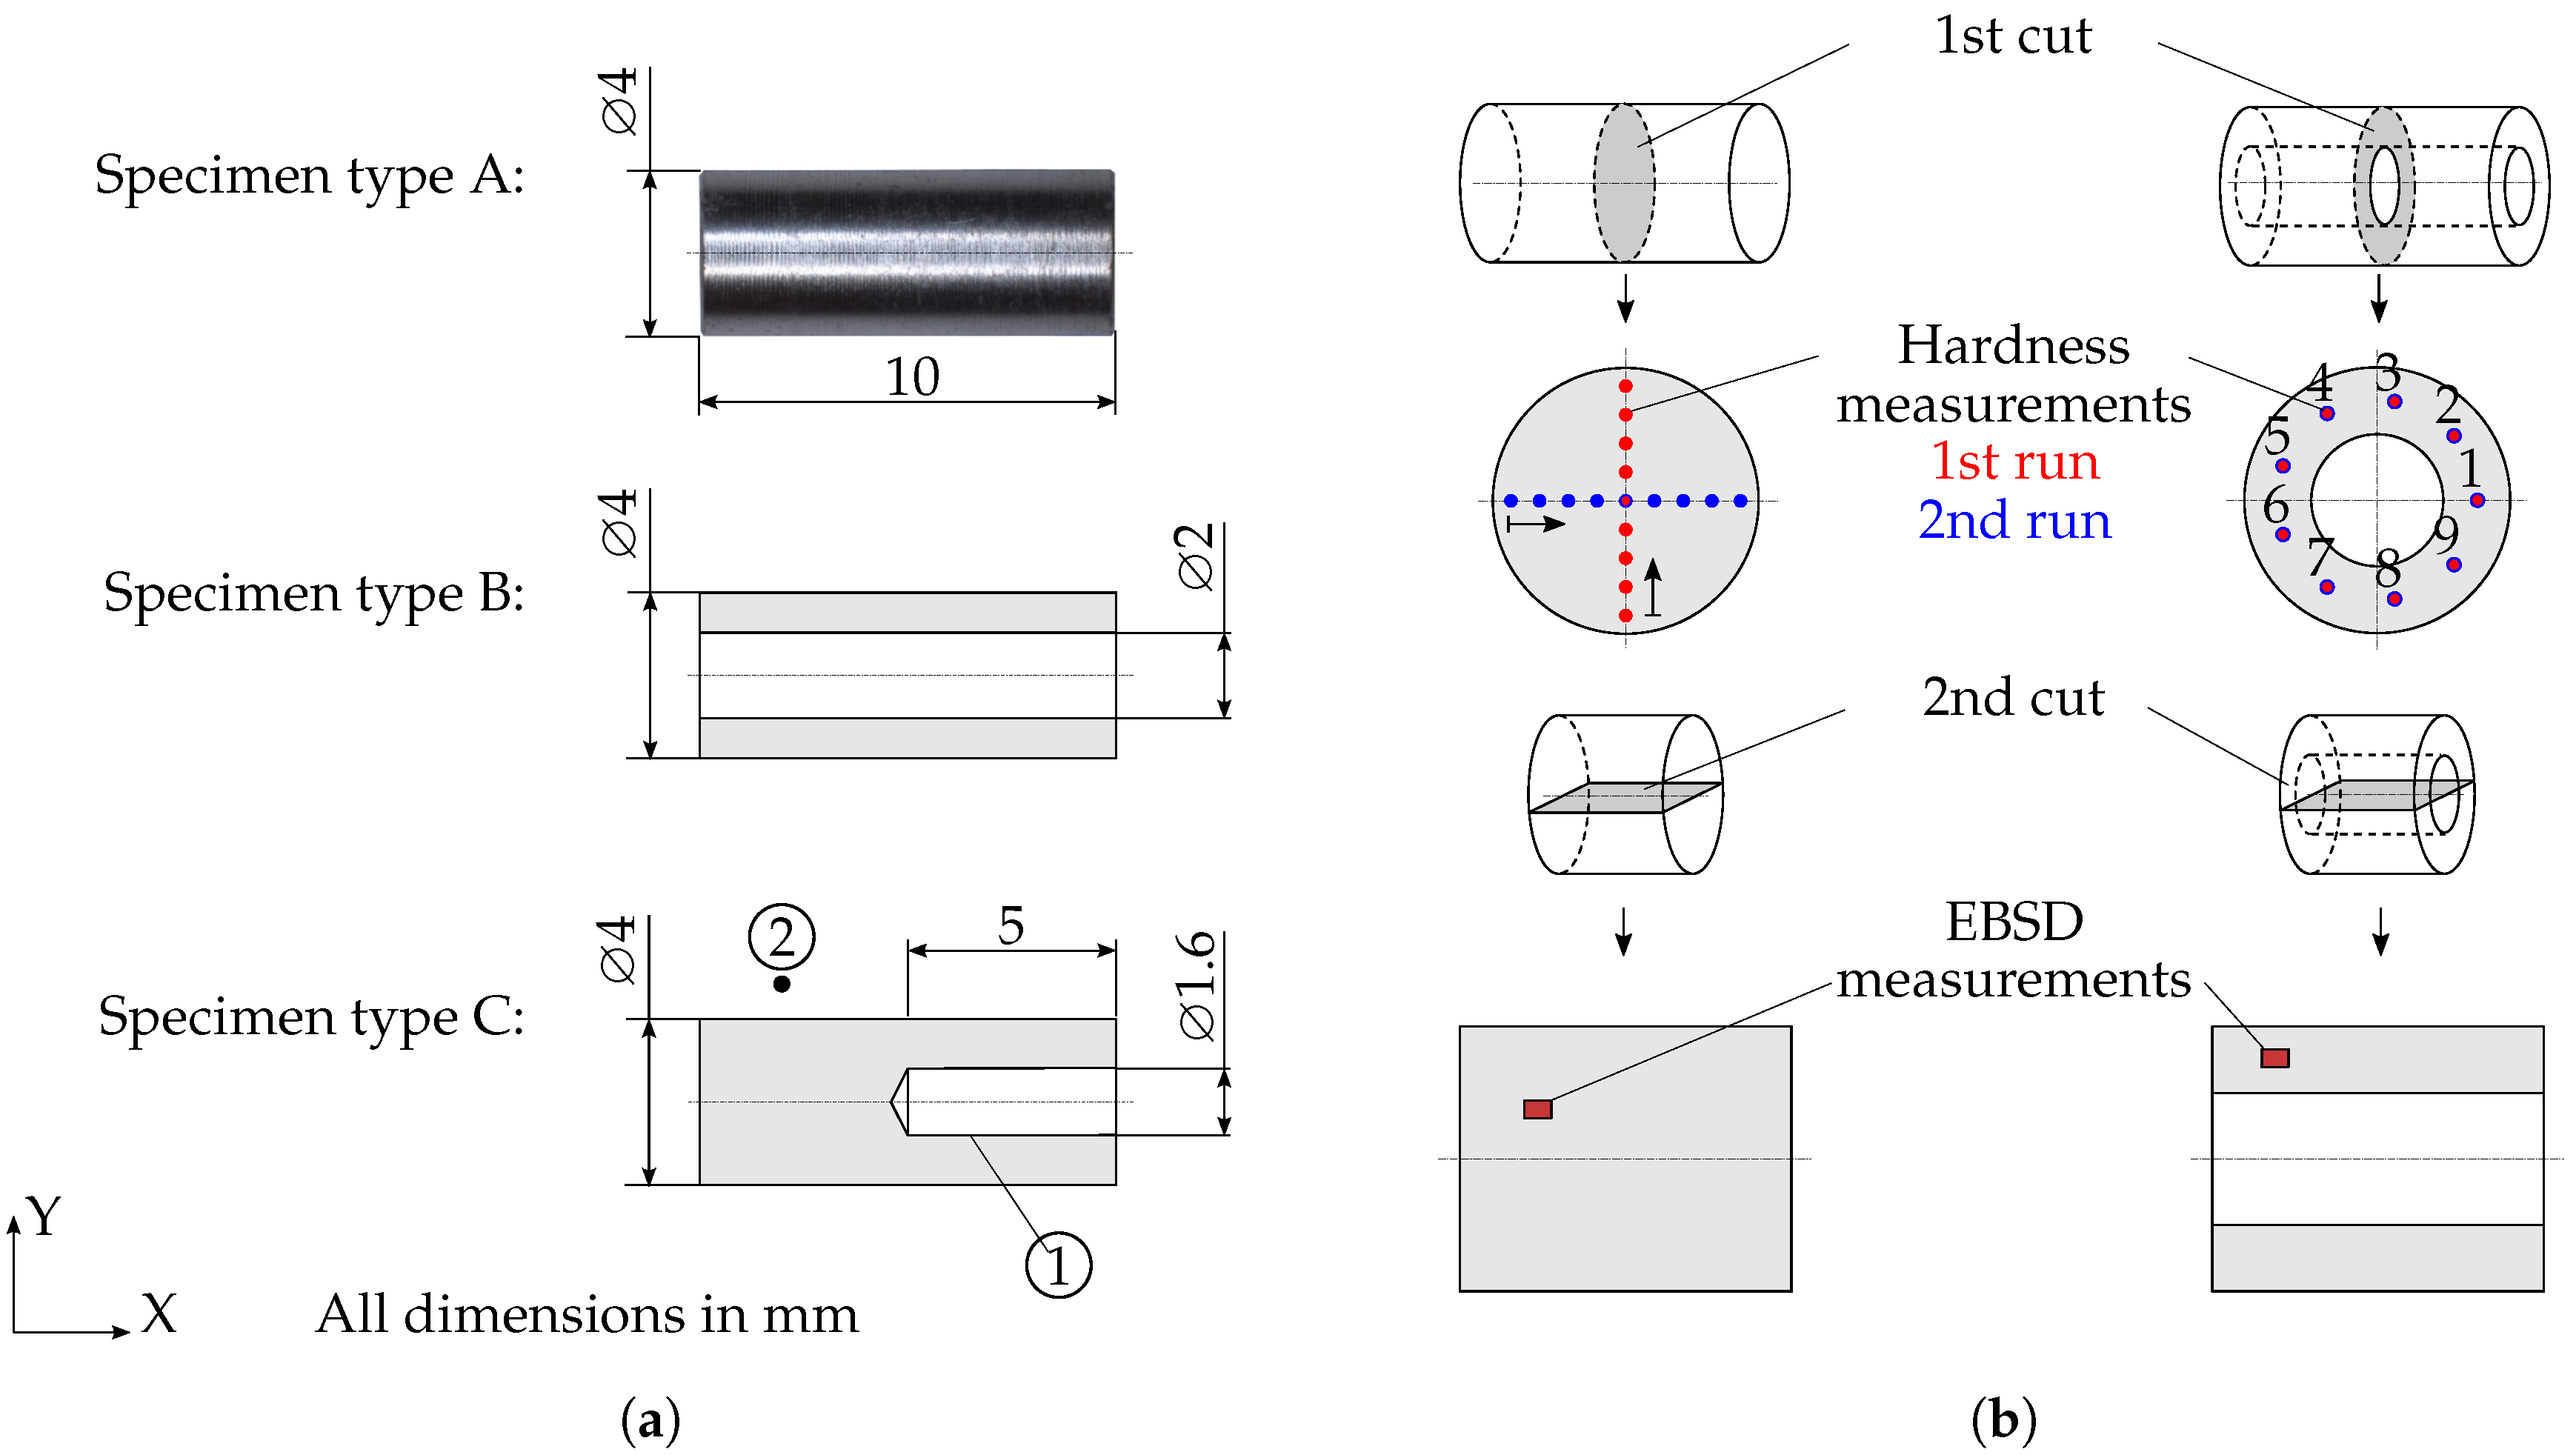
2. Experimental Setup and Methodology
3. Experimental Results
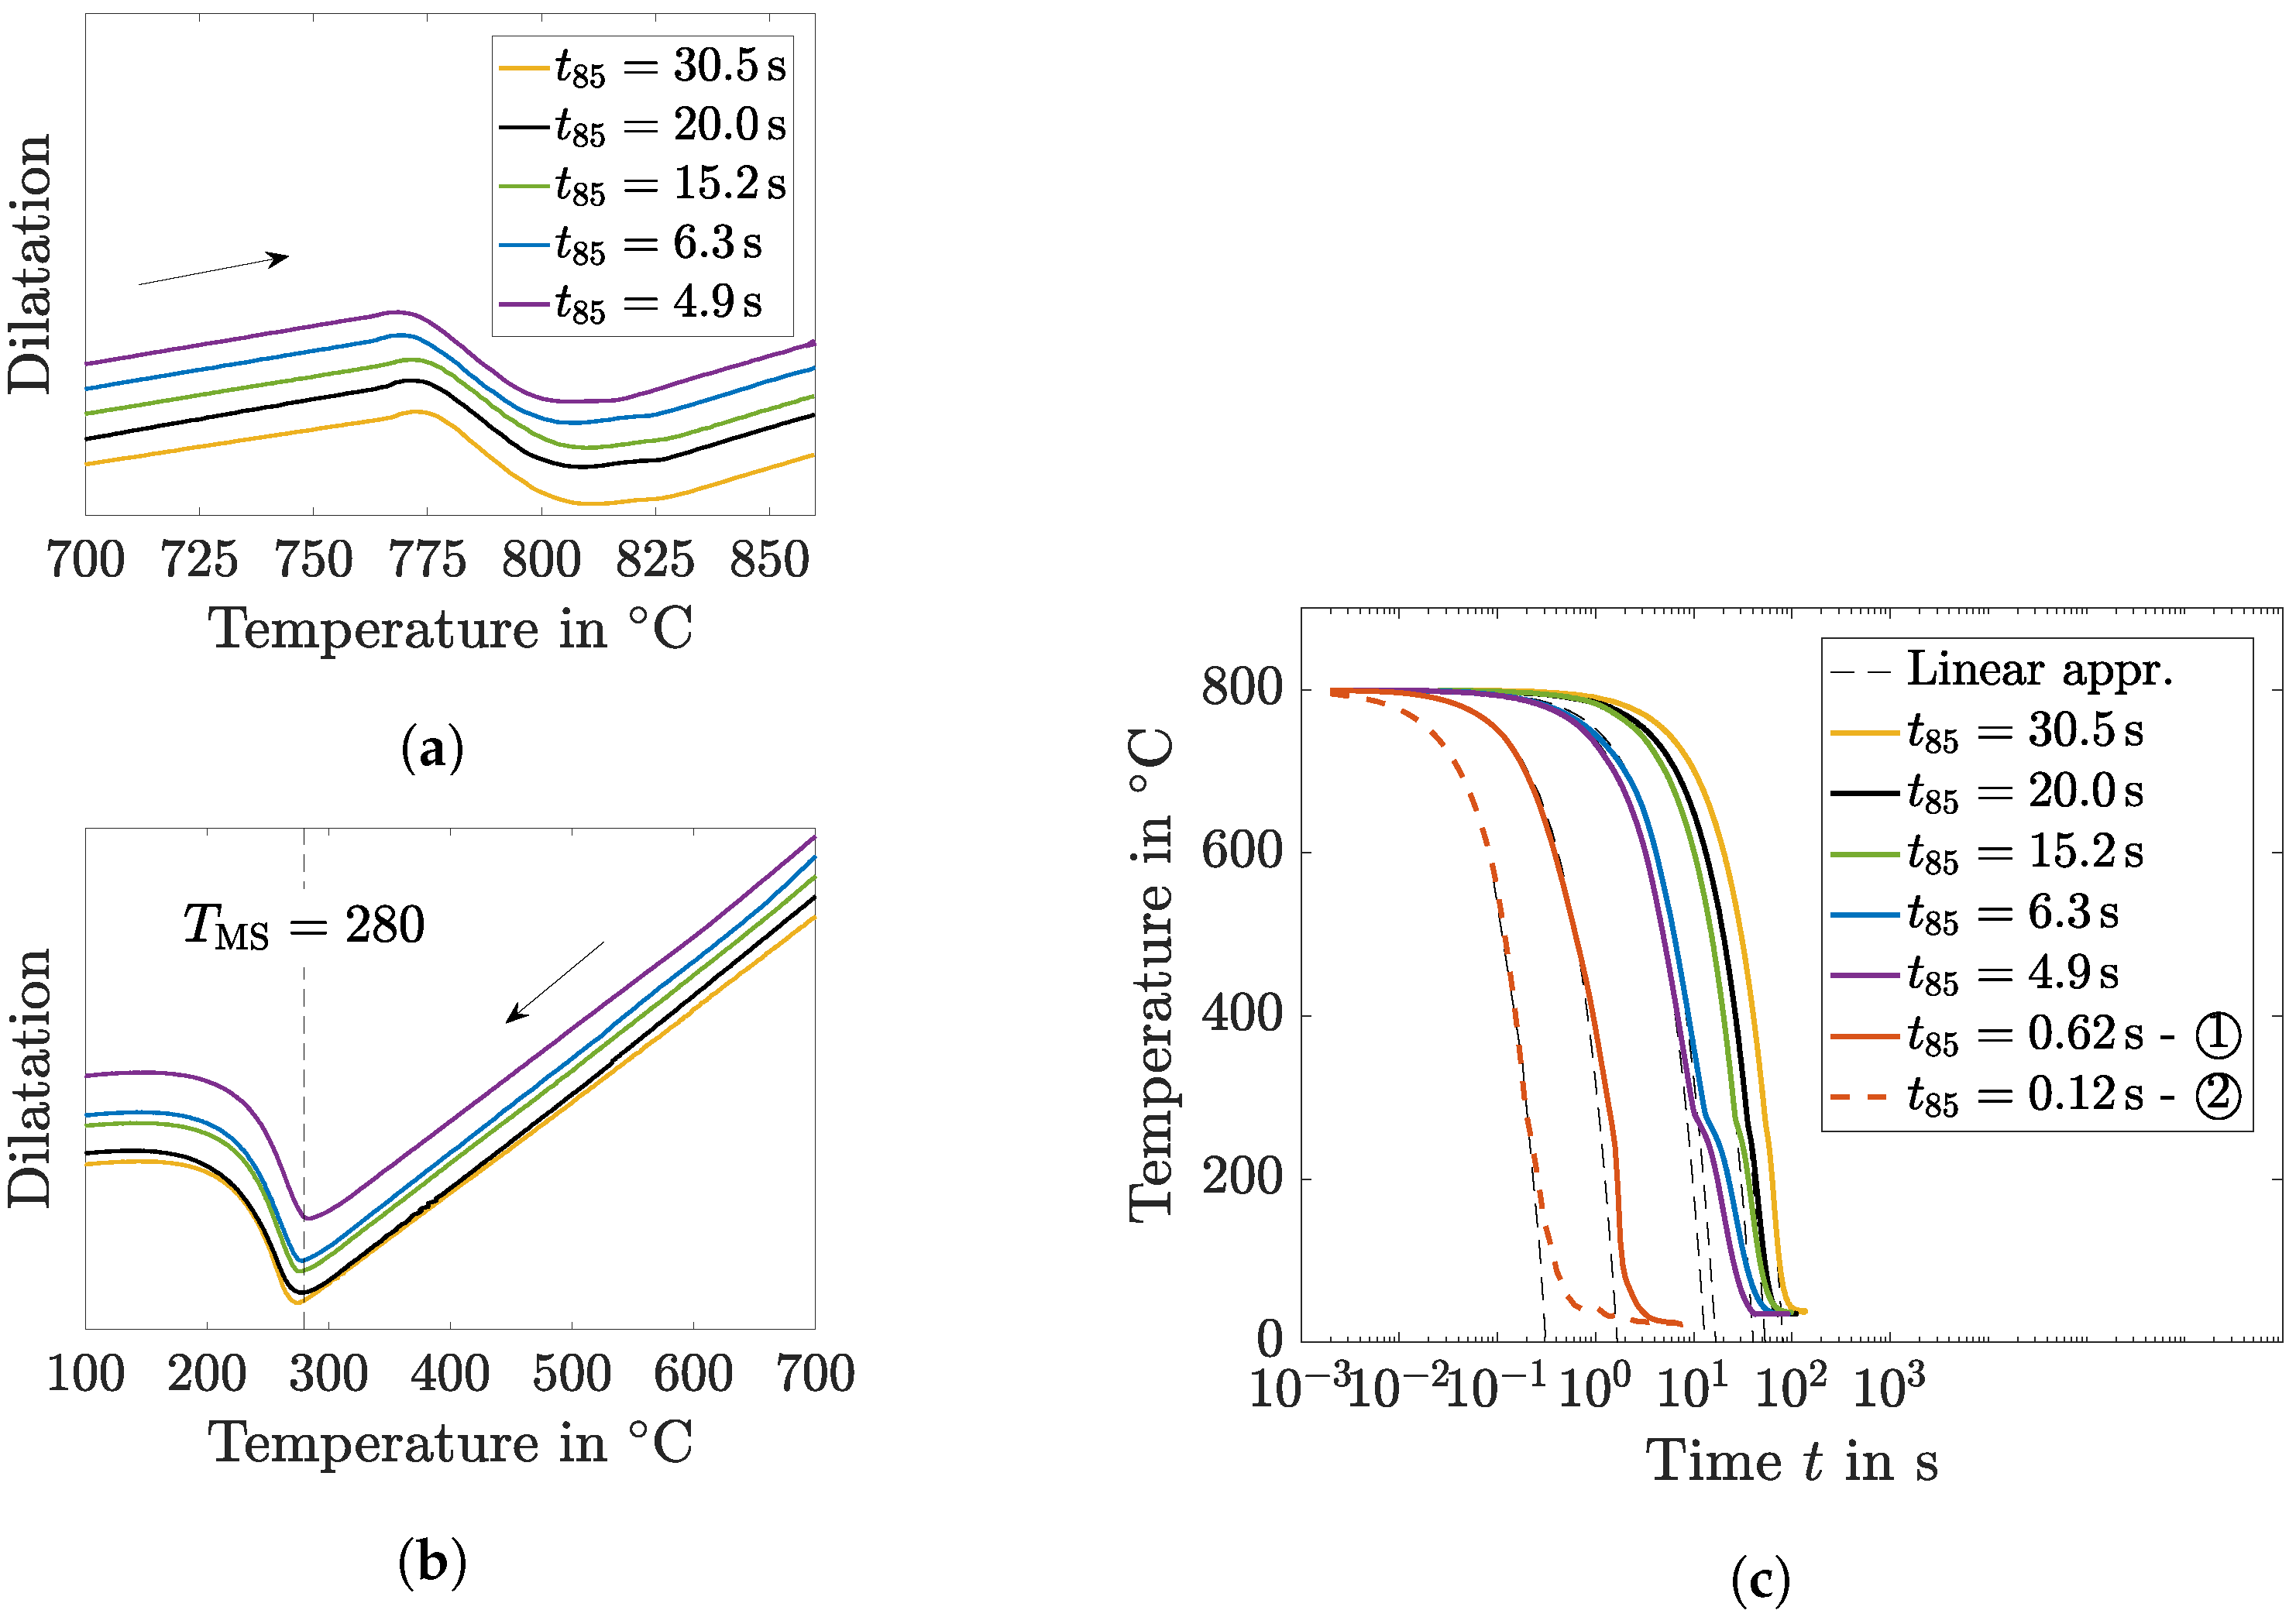
3.1. Heat Treatment
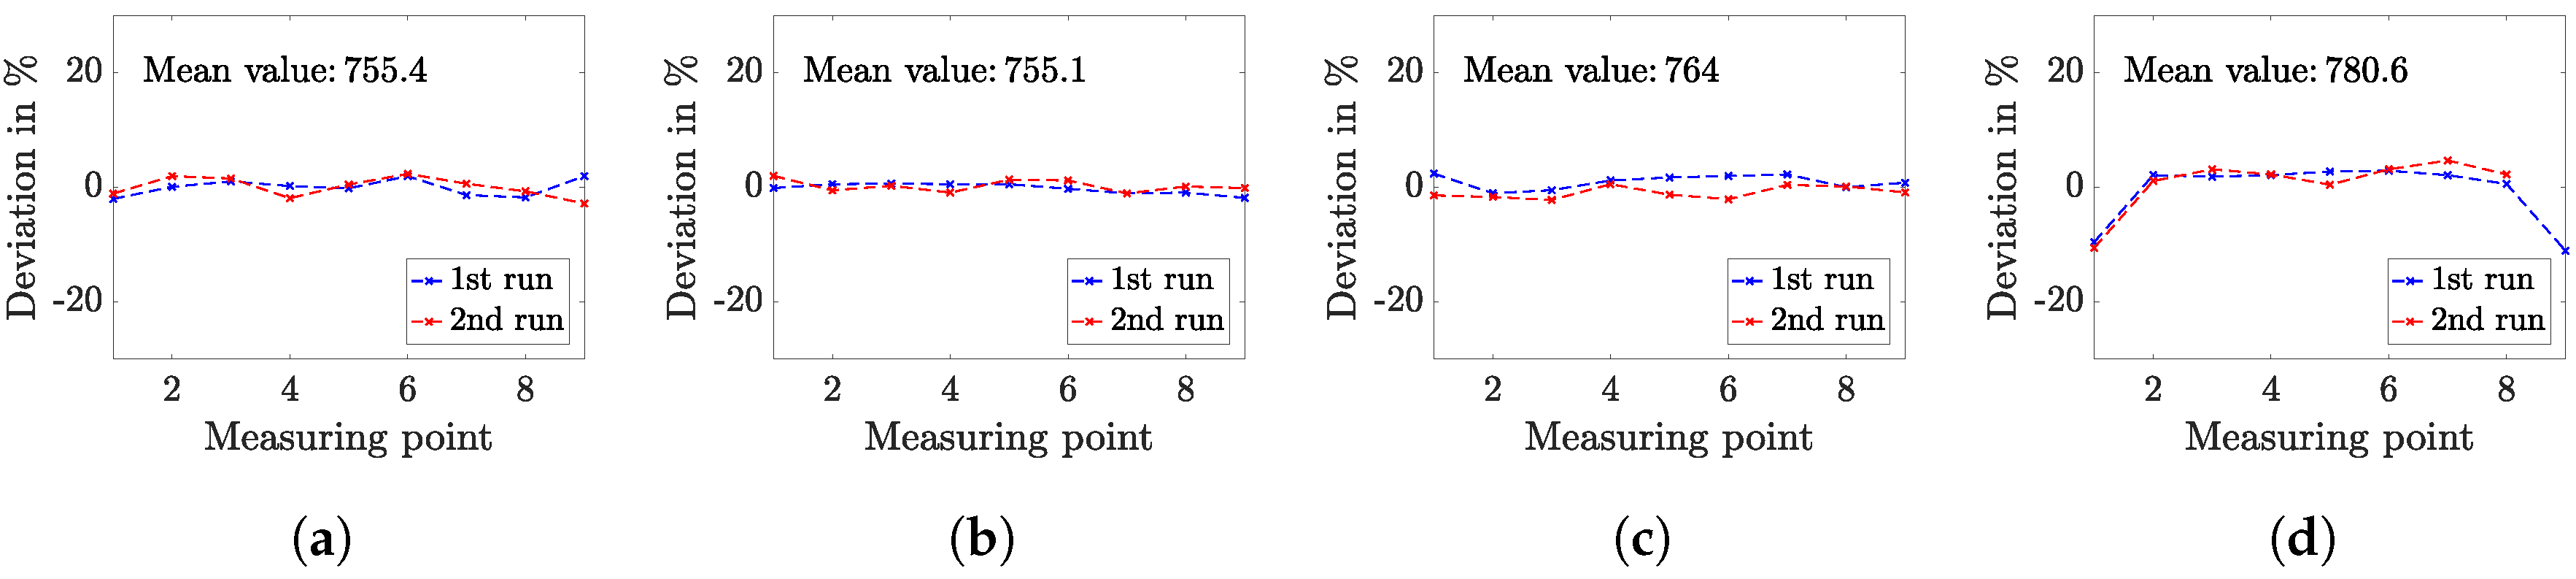
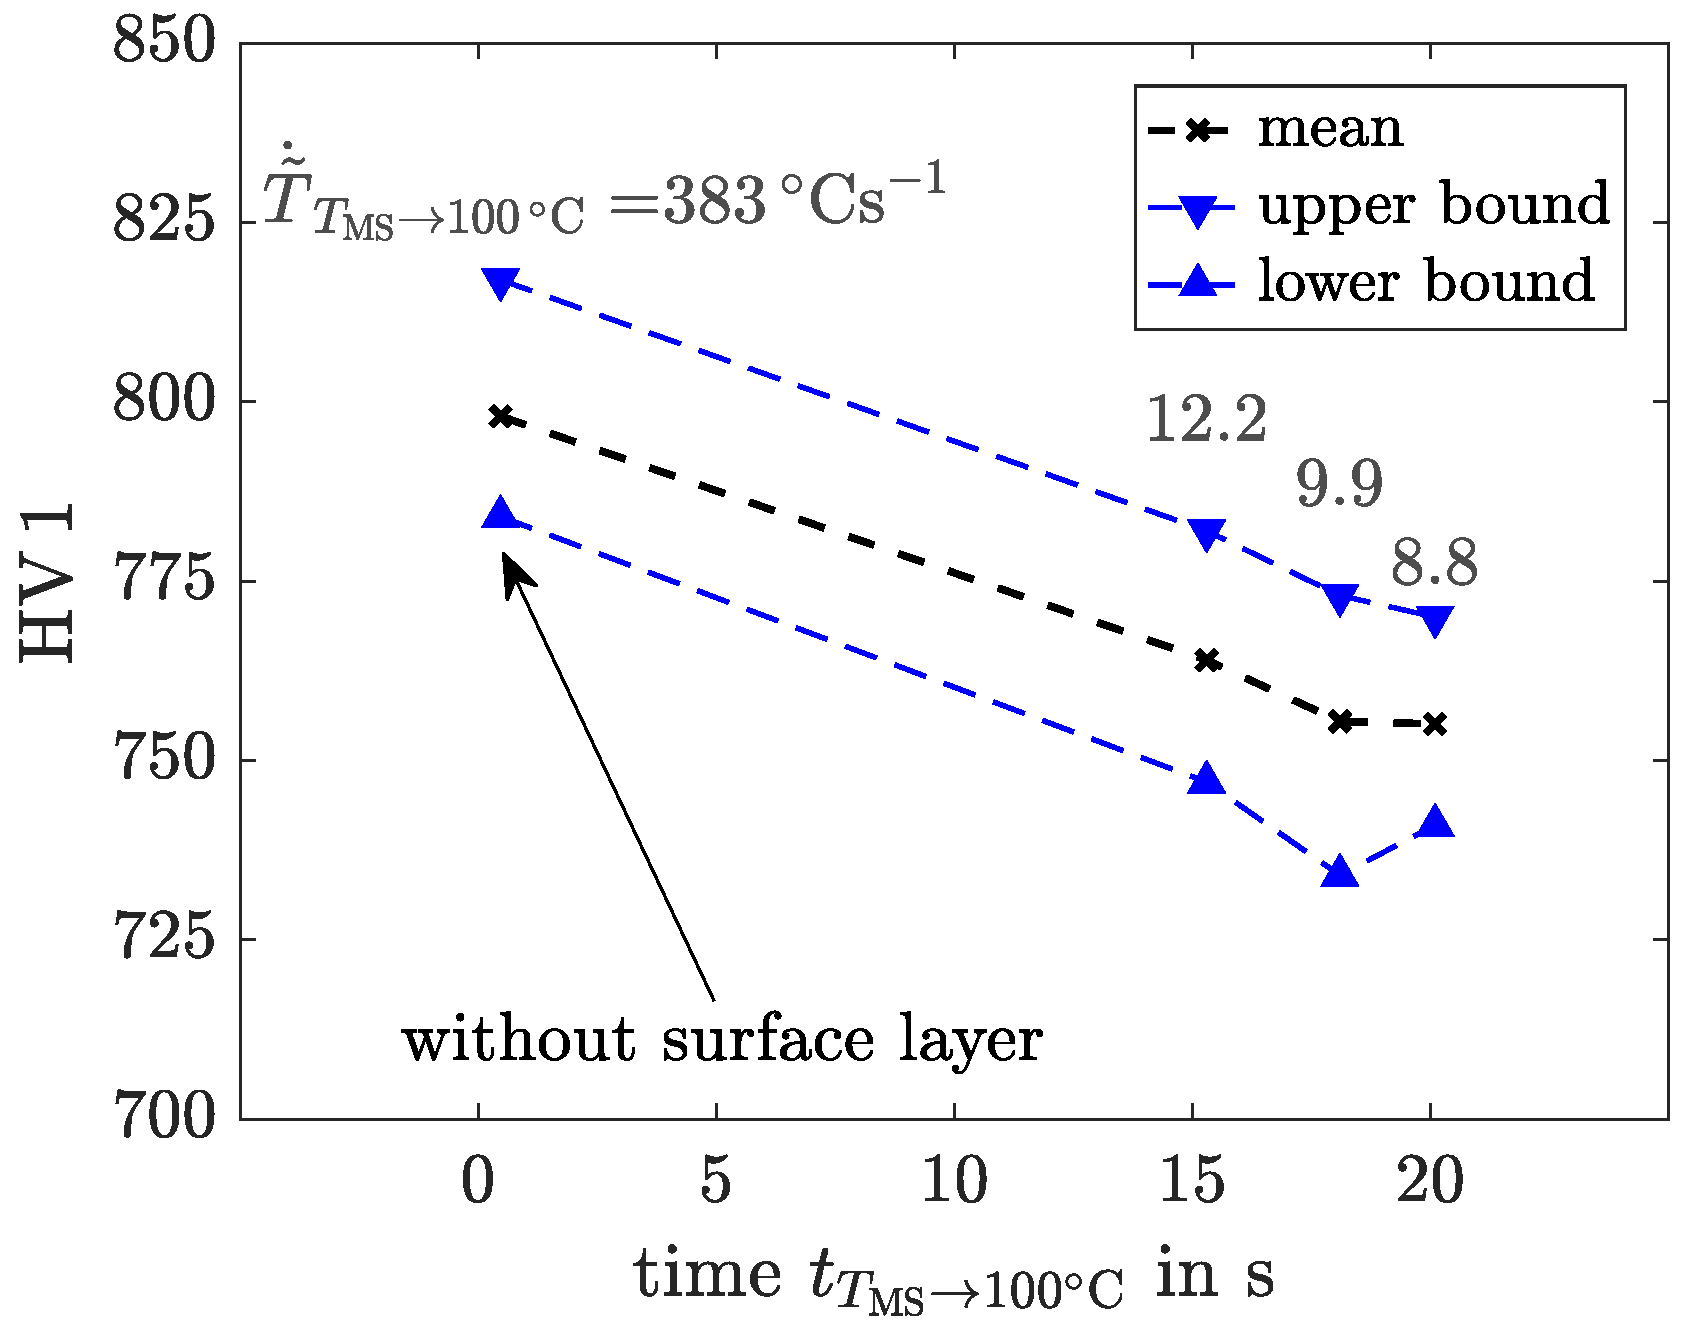
3.2. Hardness
3.3. Microstructure Analyses
4. Discussion
5. Conclusions
Author Contributions
Funding
Acknowledgments
Conflicts of Interest
Abbreviations
| CPP | Close packet plane |
| EBSD | Electron backscatter diffraction |
| ECDF | Empirical cumulative distribution function |
| PAG | Prior austenite grain |
Appendix A. Reconstructed Martensite Close Packet Plane Packets

Appendix B. Number of Close Packet Plane Packets and Blocks in Prior Austenite Grains

References
- Schäfer, B.J.; Song, X.; Sonnweber-Ribic, P.; Hartmaier, A.; ul Hassan, H. Micromechanical modelling of the cyclic deformation behavior of martensitic SAE 4150–A comparison of different kinematic hardening models. Metals 2019, 9, 368. [Google Scholar] [CrossRef]
- Welschinger, F.; Köbler, J.; Andrä, H.; Müller, R.; Schneider, M.; Staub, S. Efficient Multiscale Methods for Viscoelasticity and Fatigue of Short Fiber-Reinforced Polymers. In Key Engineering Materials; Trans Tech Publ.: Baech, Switzerland, 2019; Volume 809, pp. 473–479. [Google Scholar]
- Maki, T. Microstructure and mechanical behaviour of ferrous martensite. In Materials Science Forum; Trans Tech Publ.: Baech, Switzerland, 1990; Volume 56, pp. 157–168. [Google Scholar]
- Davies, R.G.; Magee, C.L. Influence of austenite and martensite strength on martensite morphology. Metall. Trans. 1971, 2, 1939–1947. [Google Scholar]
- Krauss, G.; Marder, A.R. The morphology of martensite in iron alloys. Metall. Trans. 1971, 2, 2343. [Google Scholar] [CrossRef]
- Maki, T.; Shimooka, S.; Umemoto, M.; Tamura, I. The morphology of strain-induced martensite and thermally transformed martensite in Fe-Ni-C alloys. Trans. Jpn. Inst. Met. 1972, 13, 400–407. [Google Scholar] [CrossRef]
- Mirzaev, D.A.; Shtejnberg, M.M.; Ponomareaa, T.N.; Schastlivtsev, V.M. Effect of cooling rate on martensite point position. Carbon steels. Fiz. Met. Metalloved. 1979, 47, 125–135. [Google Scholar]
- Ivanov, Y.F.; Kozlov, E.V. Bulk and surface quenching of structural steel: Morphological analysis of the structure. Russ. Phys. J. 2002, 45, 209–231. [Google Scholar] [CrossRef]
- Maki, T. Morphology and substructure of martensite in steels. In Phase Transformations in Steels; Elsevier: Amsterdam, The Netherlands, 2012; pp. 34–58. [Google Scholar]
- Morito, S.; Huang, X.; Furuhara, T.; Maki, T.; Hansen, N. The morphology and crystallography of lath martensite in alloy steels. Acta Mater. 2006, 54, 5323–5331. [Google Scholar] [CrossRef]
- Morito, S.; Tanaka, H.; Konishi, R.; Furuhara, T.; Maki, T. The morphology and crystallography of lath martensite in Fe-C alloys. Acta Mater. 2003, 51, 1789–1799. [Google Scholar] [CrossRef]
- Krauss, G. Steels: Heat Treatment and Processing Principles; ASM International: Cleveland, OH, USA, 1990; p. 497. [Google Scholar]
- Morito, S.; Yoshida, H.; Maki, T.; Huang, X. Effect of block size on the strength of lath martensite in low carbon steels. Mater. Sci. Eng. A 2006, 438, 237–240. [Google Scholar] [CrossRef]
- Swarr, T.; Krauss, G. The effect of structure on the deformation of as-quenched and tempered martensite in an Fe-0.2 pct C alloy. Metall. Trans. A 1976, 7, 41–48. [Google Scholar] [CrossRef]
- Hall, E.O. The deformation and ageing of mild steel: III discussion of results. Proc. Phys. Soc. Sect. B 1951, 64, 747. [Google Scholar] [CrossRef]
- Petch, N.J. The cleavage strength of polycrystals. J. Iron Steel Inst. 1953, 174, 25–28. [Google Scholar]
- Furuhara, T.; Kikumoto, K.; Saito, H.; Sekine, T.; Ogawa, T.; Morito, S.; Maki, T. Phase transformation from fine-grained austenite. ISIJ Int. 2008, 48, 1038–1045. [Google Scholar] [CrossRef]
- Morito, S.; Saito, H.; Ogawa, T.; Furuhara, T.; Maki, T. Effect of austenite grain size on the morphology and crystallography of lath martensite in low carbon steels. ISIJ Int. 2005, 45, 91–94. [Google Scholar] [CrossRef]
- Morito, S.; Igarashi, R.; Kamiya, K.; Ohba, T.; Maki, T. Effect of cooling rate on morphology and crystallography of lath martensite in Fe-Ni alloys. In Materials Science Forum; Trans Tech Publ.: Baech, Switzerland, 2010; Volume 638, pp. 1459–1463. [Google Scholar]
- Bardelcik, A.; Salisbury, C.P.; Winkler, S.; Wells, M.A.; Worswick, M.J. Effect of cooling rate on the high strain rate properties of boron steel. Int. J. Impact Eng. 2010, 37, 694–702. [Google Scholar] [CrossRef]
- Tsuzaki, K.; Maki, T. Effect of cooling rate on the morphology of lath martensite in Fe-Ni alloys. J. Jpn. Inst. Met. 1981, 45, 126–134. [Google Scholar] [CrossRef]
- Eggbauer, A.; Ressel, G.; Gruber, M.; Prevedel, P.; Marsoner, S.; Stark, A.; Ebner, R. Different cooling rates and their effect on morphology and transformation kinetics of martensite. In Proceedings of the International Conference on Martensitic Transformations, Chicago, IL, USA, 11 April 2018; Springer: Berlin, Germany, 2018; pp. 35–40. [Google Scholar]
- Loewy, S.; Rheingans, B.; Meka, S.R.; Mittemeijer, E.J. Modulated martensite formation behavior in Fe–Ni-based alloys; athermal and thermally activated mechanisms. J. Mater. Res. 2015, 30, 2101–2107. [Google Scholar] [CrossRef]
- Shtejnberg, M.M.; Mirzaev, D.A.; Ponomareva, T.N. Gamma → alpha transformation during cooling of Fe-Mn alloys. Fiz. Met. Metalloved. 1977, 43, 166–172. [Google Scholar]
- Villa, M.; Pantleon, K.; Reich, M.; Kessler, O.; Somers, M.A.J. Kinetics of anomalous multi-step formation of lath martensite in steel. Acta Mater. 2014, 80, 468–477. [Google Scholar] [CrossRef]
- Liu, H.; Li, H.; Li, Z.; He, L. Effects of heating and quenching processing parameters on phase transformation of 55CrMo steel. J. Mater. Eng. Perform. 2018, 27, 5254–5270. [Google Scholar] [CrossRef]
- Hu, K.; Zhou, G.; Liu, J. Effects of Austenitizing and Quenching Parameters on Microstructures and Mechanical Properties of Press Hardened WHT1500HF Steel. Mater. Perform. Charact. 2018, 7, 316–326. [Google Scholar] [CrossRef]
- Javaheri, V.; Kolli, S.; Grande, B.; Porter, D. Insight into the induction hardening behavior of a new 0.40% C microalloyed steel: Effects of initial microstructure and thermal cycles. Mater. Charact. 2019, 149, 165–183. [Google Scholar] [CrossRef]
- Eggbauer, A.; Lukas, M.; Ressel, G.; Prevedel, P.; Mendez-Martin, F.; Keckes, J.; Stark, A.; Ebner, R. In situ analysis of the effect of high heating rates and initial microstructure on the formation and homogeneity of austenite. J. Mater. Sci. 2019, 54, 9197–9212. [Google Scholar] [CrossRef]
- Vieweg, A.; Ressel, G.; Prevedel, P.; Marsoner, S.; Ebner, R. Effects of the inductive hardening process on the martensitic structure of a 50CrMo4 steel. HTM J. Heat Treat. Mater. 2017, 72, 3–9. [Google Scholar] [CrossRef]
- Vieweg, A.; Ressel, G.; Prevedel, P.; Raninger, P.; Panzenböck, M.; Marsoner, S.; Ebner, R. Induction hardening: Differences to a conventional heat treatment process and optimization of its parameters. In Proceedings of the IOP Conference Series: Materials Science and Engineering, Bali, Indonesia, 19–20 March 2016; Volume 119, p. 012019. [Google Scholar]
- Vieweg, A.; Povoden-Karadeniz, E.; Ressel, G.; Prevedel, P.; Wojcik, T.; Mendez-Martin, F.; Stark, A.; Keckes, J.; Kozeschnik, E. Phase evolution and carbon redistribution during continuous tempering of martensite studied with high resolution techniques. Mater. Des. 2017, 136, 214–222. [Google Scholar] [CrossRef]
- Vieweg, A.E.; Ressel, G.; Raninger, P.; Prevedel, P.; Marsoner, S.; Ebner, R. Comparing fast inductive tempering and conventional tempering: Effects on microstructure and mechanical properties. Metall. Res. Technol. 2018, 115, 407. [Google Scholar] [CrossRef]
- Vieweg, A.; Raninger, P.; Prevedel, P.; Ressel, G.; Ecker, W.; Marsoner, S.; Ebner, R. Experimentelle und numerische Untersuchung des induktiven Anlassens eines Vergütungsstahles. HTM J. Heat Treat. Mater. 2017, 72, 199–204. [Google Scholar] [CrossRef]
- Schastlivtsev, V.M.; Mirzaev, D.A.; Yakovleva, I.L. Structure of Heat Treated Steel; Metallurgiya Publ.: Moscow, Russia, 1994. [Google Scholar]
- Mirzaev, D.A.; Korzunov, S.E.; Schastlivtsev, V.M.; Yakovleva, I.L. The influence of cooling rate in hardening on the quantity of residual austenite and the hardness of carbon steels. Fiz. Met. Metalloved. 1983, 56, 1033–1035. [Google Scholar]
- Mirzaev, D. Martensite Points in Fe–C Alloys. Fiz. Met. Metalloved. 1987, 63, 764–767. [Google Scholar]
- Van Bohemen, S.M.C.; Sietsma, J. Kinetics of martensite formation in plain carbon steels: critical assessment of possible influence of austenite grain boundaries and autocatalysis. Mater. Sci. Technol. 2014, 30, 1024–1033. [Google Scholar] [CrossRef]
- Loewy, S.; Rheingans, B.; Meka, S.R.; Mittemeijer, E.J. Unusual martensite-formation kinetics in steels: Observation of discontinuous transformation rates. Acta Mater. 2014, 64, 93–99. [Google Scholar] [CrossRef]
- Schäfer, B.J.; Sonnweber-Ribic, P.; Hartmaier, A.; ul Hassan, H. Micromechanical Modelling of the Influence of Strain Ratio on Fatigue Crack Initiation in a Martensitic Steel-A Comparison of Different Fatigue Indicator Parameters. Materials 2019, 12, 2852. [Google Scholar] [CrossRef] [PubMed]
- Schäfer, B.J.; Sonnweber-Ribic, P.; Hartmaier, A.; ul Hassan, H. Micromechanical Modeling of Fatigue Crack Nucleation around Non-Metallic Inclusions in Martensitic High-Strength Steels. Metals 2019, 9, 1258. [Google Scholar] [CrossRef]
- Cayron, C. ARPGE: A computer program to automatically reconstruct the parent grains from electron backscatter diffraction data. J. Appl. Crystallogr. 2007, 40, 1183–1188. [Google Scholar] [CrossRef] [PubMed]
- Bachmann, F.; Hielscher, R.; Schaeben, H. Texture analysis with MTEX – free and open source software toolbox. In Solid State Phenomena; Trans Tech Publ.: Baech, Switzerland, 2010; Volume 160, pp. 63–68. [Google Scholar]
- Bergmann, R.; Chan, R.H.; Hielscher, R.; Persch, J.; Steidl, G. Restoration of manifold-valued images by half-quadratic minimization. arXiv 2015, arXiv:1505.07029. [Google Scholar]
- Kurdjumov, G.; Sachs, G. Over the mechanisms of steel hardening. Z. Phys 1930, 64, 325–343. [Google Scholar]
- Nyyssönen, T.; Peura, P.; Kuokkala, V.T. Crystallography, morphology, and martensite transformation of prior austenite in intercritically annealed high-aluminum steel. Metall. Mater. Trans. A 2018, 49, 6426–6441. [Google Scholar] [CrossRef]
- Olson, G.; Cohen, M. A perspective on martensitic nucleation. Annu. Rev. Mater. Sci. 1981, 11, 1–32. [Google Scholar] [CrossRef]
- Yeddu, H.K. Phase-field modeling of austenite grain size effect on martensitic transformation in stainless steels. Comput. Mater. Sci. 2018, 154, 75–83. [Google Scholar] [CrossRef]
- Nishiyama, Z. Martensitic Transformation; Elsevier: Amsterdam, The Netherlands, 2012. [Google Scholar]
- Van Bohemen, S.M.C.; Morsdorf, L. Predicting the Ms temperature of steels with a thermodynamic based model including the effect of the prior austenite grain size. Acta Mater. 2017, 125, 401–415. [Google Scholar] [CrossRef]


| Material | C | Si | Mn | P | S | Cr | Mo |
|---|---|---|---|---|---|---|---|
| 50CrMo4 [1] | 0.52 | 0.26 | 0.74 | 0.014 | 0.008 | 1.31 | 0.18 |
| Analysis | A1 | A2 | A3 | A4 |
|---|---|---|---|---|
| Specimen Type | A | A | B | A |
| in | 279.3 | 277.1 | 286.8 | - |
| in s | 20.0 | 6.3 | 4.9 | 0.62 |
| in s | 18.1 | 20.1 | 15.3 | 0.47 * |
| in s | 52.8 | 33.5 | 25.0 | 1.9 |
| in | 15.0 | 47.6 | 61.2 | 484 |
| in | 9.9 | 8.8 | 12.2 | 383 * |
| in | 13.3 | 20.9 | 28.0 | 368 |
| Material (Name) | in | Obvious Size Effect | Reference | in | |
|---|---|---|---|---|---|
| (Thermo-Calc TCFE 8) | |||||
| Fe-22 wt.% Ni | 240 | Yes | [23] | 0.22 | * |
| Fe-24 wt.% Ni | 187 | Yes | [21] | 0.29 | * |
| Fe-18 wt.% Ni | 297 | Yes | [21] | 0.25 | * |
| 18% Ni maraging steel | 217 | Yes | [21] | 0.44 | |
| WHT1500HF | 382 | Yes | [27] | 0.45 | |
| 50CrMo4 | 280 | No | 0.52 | ||
| AISI 630 | 140 | No | [25] | 0.76 | |
© 2020 by the authors. Licensee MDPI, Basel, Switzerland. This article is an open access article distributed under the terms and conditions of the Creative Commons Attribution (CC BY) license (http://creativecommons.org/licenses/by/4.0/).
Share and Cite
Graf, M.; Kuntz, M.; Autenrieth, H.; Müller, R. Investigation of Size Effects Due to Different Cooling Rates of As-Quenched Martensite Microstructures in a Low-Alloy Steel. Appl. Sci. 2020, 10, 5395. https://doi.org/10.3390/app10155395
Graf M, Kuntz M, Autenrieth H, Müller R. Investigation of Size Effects Due to Different Cooling Rates of As-Quenched Martensite Microstructures in a Low-Alloy Steel. Applied Sciences. 2020; 10(15):5395. https://doi.org/10.3390/app10155395
Chicago/Turabian StyleGraf, Marius, Matthias Kuntz, Hermann Autenrieth, and Ralf Müller. 2020. "Investigation of Size Effects Due to Different Cooling Rates of As-Quenched Martensite Microstructures in a Low-Alloy Steel" Applied Sciences 10, no. 15: 5395. https://doi.org/10.3390/app10155395
APA StyleGraf, M., Kuntz, M., Autenrieth, H., & Müller, R. (2020). Investigation of Size Effects Due to Different Cooling Rates of As-Quenched Martensite Microstructures in a Low-Alloy Steel. Applied Sciences, 10(15), 5395. https://doi.org/10.3390/app10155395