Article

Temporal Variability in the Response of a Linear Time-Invariant Catchment System to a Non-Stationary Inflow Concentration Field

1
Institute of Environmental Engineering, National Chiao Tung University, Hsinchu 300, Taiwan
2
Department of Urban Planning and Disaster Management, Ming Chuan University, Taoyuan 333, Taiwan
*
Author to whom correspondence should be addressed.
Appl. Sci. 2020, 10(15), 5356; https://doi.org/10.3390/app10155356
Submission received: 9 July 2020 / Revised: 28 July 2020 / Accepted: 31 July 2020 / Published: 3 August 2020
(This article belongs to the Special Issue Leading Edge Technology on Groundwater Flow)

Abstract

:
Predicting the effects of changes in dissolved input concentration on the variability of discharge concentration at the outlet of the catchment is essential to improve our ability to address the problem of surface water quality. The goal of this study is therefore dedicated to the stochastic quantification of temporal variability of concentration fields in outflow from a catchment system that exhibits linearity and time invariance. A convolution integral is used to determine the output of a linear time-invariant system from knowledge of the input and the transfer function. This work considers that the nonstationary input concentration time series of an inert solute to the catchment system can be characterized completely by the Langevin equation. The closed-form expressions for the variances of inflow and outflow concentrations at the catchment scale are derived using the Fourier–Stieltjes representation approach. The variance is viewed as an index of temporal variability. The closed-form expressions therefore allow to evaluate the impacts of the controlling parameters on the temporal variability of outflow concentration.

1. Introduction

Agricultural chemicals are frequently mixed into shallow soil layers. Runoff through agricultural land may pick up soil chemicals and introduce them into surface waters. During the periods of heavy rainfall, the soil chemicals in runoff water can pose a potential threat to the quality of the environment and water supplies [1,2,3]. Modeling of the transfer of agricultural chemicals into surface runoff is therefore needed in order to predict the development of the contaminant plume.
The field evidence indicates very irregular patterns of rainfall in time and, in turn, very complex runoff production in a catchment during a hydrologic event [4]. It therefore requires a large quantity of measurements for accurate predictions of the hydrological response of the catchment. This situation is, however, far from that encountered in practice. The amount of information on all coefficients and parameters appearing in the model for accurate predictions is never enough, so one has to accept a level of uncertainty. As such, the runoff and associated solute transport are often formulated as stochastic processes in order to reflect the uncertainty of our knowledge [5,6,7,8,9,10,11]. Since the hydrological variables are regarded as random, predictions are therefore made in terms of probabilities (or moments) rather than in the traditional deterministic framework [12,13,14,15].
Many contamination incidents are geographically isolated and their sources can be considered as point sources of pollution. Although locally important, contamination from these sources may not be significant throughout the catchment area. In contrast, nitrates and pesticides from agricultural areas, for example, which come from distributed, or non-point sources of pollution can have a significant impact on the water quality of the catchment area. The main interest is therefore in long-term basin-wide changes in water quality due to distributed contaminant sources, ignoring the special variations and focusing on the temporal variation of the mean contaminant concentration in the catchment area. This type of model, which does not require specification of heterogeneity on a small spatial scale, is called a lumped-parameter model [16,17]. In many regional groundwater studies, a lumped model approach is often used for long-term basin-wide predictions due to the uniformly distributed recharge sources [18,19,20].
Since the temporal variations of the runoff are usually observed at the outflows of the catchment, the lumped models require to specify the nature of the input to the model and the model itself, which relates inputs, outputs, and system states. They use simpler representation of physical phenomena to convert input (recharge) into output (discharge), reflecting the overall hydrogeological configuration of the catchment. Consequently, a lumped model provides basic information on the hydraulic behavior of the output response to the input into the catchment system. A clear understanding of the relation between the output and input of the catchment is essential to predict the impact of changes in the concentration of the input solutes on the variability of the discharge concentration at the outlet of the catchment, which can improve our ability to deal with the problem of surface water quality. The goal of this work is, therefore, to use a lumped model approach for quantification of temporal variability in the catchment response to a non-stationary random input concentration of an inert solute, which so far has attracted only limited attention in the hydrology literature.
This work treats a catchment with a random variable input and an output as a linear time-invariant system [21,22]. This means that the transfer from rainfall to recharge is assumed to be linear. It is considered a black box process at any point in space and the classical theory of linear systems [23], also known as the theory of unit hydrograph in surface water hydrology, can be used. Note that in linear systems, the outputs of the system are represented as a linear combination of the response to each of the basic inputs. The time-invariance means that no matter what time, s, the system is fed, the output at time t depends only on the time delay t-s. As such, the response of the system to inputs is delayed and spread out over time.
The goal of the present study will be accomplished by using the stochastic methodology. The closed-form expressions for the variances of inflow and outflow concentrations are developed using the Fourier–Stieltjes representation approach. The Fourier–Stieltjes representation of the random process deals with the decomposition of the random processes into the individual spectral components. The Fourier–Stieltjes representation is a well-known generalization of the classical Fourier transform, and is frequently applied in certain areas of theoretical and applied probability and stochastic processes contexts. The reader is referred to Lumley and Panofsky [24] and Priestley [25] for detailed information on the Fourier–Stieltjes representation. The variance is viewed as an index of temporal variability, rather than uncertainty, which therefore provides a basis for assessing the influence of input controlling parameters on the temporal variability of the outflow concentration. The results of this study should be of value for improved understanding of the behavior of transport of contaminants in surface runoff at the catchment outlet.

2. Materials and Methods

2.1. Formulation of the Model

This work takes the entire catchment as a single unit where the spatial variability is disregarded. In such a modeling approach, one tries to relate the system output to the forcing without going into the details of what is actually happening inside the system. That is, the present study assesses the catchment response simply at the outlet without counting for individual sub-basin responses.
Furthermore, this work considers a catchment with a variable input, Ci(t), and an output, C(t), as a linear time-invariant system. If the system represents a convolution, C(t) and Ci(t) may then be connected by the integral form of [26,27,28]
C ( t ) = 0 t g ( t s ) C i ( s ) d s
where g(t) is the transfer function (travel time), t-s is interpreted as the time lag between the input and the output time and s is used as a dummy variable of integration, which disappears after the integral is evaluated. The convolution integral operation may be thought of as a filtering operation on the input, where the transfer function is acting as the filter. Equation (1) treats the input flow as uniform over the catchment and ignores the internal spatial variation of catchment flow.
The variables Ci(t) and C(t), as considered here, are represented as temporal fluctuations in inflow and outflow concentrations of an inert solute, respectively, and regarded as stochastic (random) processes in time to account for their irregular temporal variation and the uncertainty of their distribution. This study uses the variance as an index of variability of a random variable C(t) in time.
The transfer function g(t) in Equation (1) is a physical measure that integrates flow path heterogeneity and is directly related to internal catchment processes [29]. For simplicity, its temporal distribution is treated as deterministic. That is, it represents an ensemble mean (an average). Following the parameterization proposed by Kirchner et al. [7,8] and Godsey et al. [30], the present study uses the gamma distribution to represent the temporal behavior of g(t).
g ( t ) = ( α τ m ) α t α 1 Γ ( α ) exp [ α t / τ m ]
where α is a shape parameter, τm is the catchment mean travel time constant, and Γ(α) denotes the incomplete gamma function of argument α.
Note that the time required for water to travel through a catchment is a physical measure that integrates flow path heterogeneity. It has become apparent from previous studies [5,31,32] that the convolution integral model based on travel time distributions of solute migration may provide an alternative way of representing the large-scale transport process. As mentioned by Kirchner et al. [7], the gamma travel time distribution with two parameters is both conceptually and mathematically a more suitable representation of the resulting solute mixing processes as its higher degree of freedom offers greater flexibility in accounting for different flow path distributions.
The α in Equation (2) reflects the heterogeneity in the flow path lengths and velocities of catchments [30]. The smaller the value of α, the greater the variability in the catchment flow path length and velocity compared to the mean. For α > 1, the gamma distribution rises to a peak and then falls off, similar to a typical storm hydrograph, which is often used to model rainfall–runoff relationships. For α = 1, the gamma distribution is a close approximation of the exponential distribution, implying that the mixing of a solute plume only occurs at the sampling point; thus, there is no exchange between flow lines. For α < 1, however, the gamma distribution has a completely different shape, having maximum weight at lags near zero and a relatively long tail. These characteristics represent problematic contaminant behavior, with rapid release of an intense contaminant spike followed by persistent lower-level contamination far into the future.
It is furthermore assumed that the temporal distribution of Ci(t) in Equation (1) satisfies the lumped solute transport model [33,34,35,36] as
d C i d t + C i τ C = ξ ( t )
where τC represents the solute response time for the inflow solute-transport system and ξ(t) is a zero-mean stationary stochastic forcing (input concentration perturbation) in time. The initial inflow concentration for the lumped solute transport model considered here is a deterministic constant so that the initial condition for the mean-removed solute transport in Equation (3) is
C i ( 0 ) = 0
As such, the fluctuations in inflow concentration are contributed solely by the random forcing ξ(t). In addition, the temporal variability of the process can be described by an exponential form of covariance function with the associated spectrum Sξξ(ω) defined as [13,33]
S ξ ξ ( ω ) = σ ξ 2 λ π ( λ 2 + ω 2 )
Here, ω is the frequency, σ ξ 2 is the variance of the input ξ field and λ is the correlation scale. The correlation scale measures the temporal persistence of ξ field, which is in the units of time. A larger correlation scale indicates longer temporal persistence. The reader may be referred to Mann and Lees [37] and Schulz and Mudelsee [38] for details on identification of the correlation scale of a time series.
Note that the solute transport equation such as Equation (3) is simply a lumped equation of solute mass balance. It describes the time variation of concentration at a catchment scale. The use of a lumped transport model is justified when the whole catchment is treated as a single hydrological unit so that the spatial variability of input, output and parameters are ignored. As such, the solute transport process is treated as a continuous time series rather than a time–spatial process. In fact, in statistical physics Equation (3) is referred to as the Langevin equation [39] which is widely used to describe the time evolution of a particle behavior undergoing a brown motion.
Equation (1) is the starting point for development of the variance of output concentration, along with Equations (2)–(4). Toward this, the stochastic methodology is applied.

2.2. Variance of Inflow and Outflow Concentrations

Starting with the use of Fourier–Stieltjes representations [40] for the perturbed fluctuations in Ci(t) and C(t), namely
C i ( t ) = Λ C i ( t ; ω ) e i ω t d Z ( ω )
C ( t ) = Λ C ( t ; ω ) e i ω t d Z ( ω )
into Equation (1) leads to
Λ C ( t ; ω ) e i ω t d Z ( ω ) = 0 t g ( t s ) [ Λ C i ( s ; ω ) e i ω s d Z ( ω ) ] d s
In Equations (5) and (6)–(8), ΛCi and ΛC are termed as the modulating functions [40] of Ci(t) and C(t) processes, respectively, ω denotes the frequency, and Z(ω) represents an orthogonal random process, in the sense that the increments dZ(ω) and dZ(ω′) (at any two distinct points ω and ω′) are uncorrelated random variables,
E [ d Z ( ω ) d Z * ( ω ) ] = 0
where * denotes the complex conjugate. By comparison, Equation (8) admits a ΛCΛCi relation of the form
Λ C ( t ; ω ) = 0 t g ( t s ) Λ C i ( s ; ω ) e i ω ( t s ) d s
Furthermore, by virtue of the orthogonality of Z(ω) and the representation theorem for C(t) (namely, Equation (7)), the variance of outflow concentration takes the form
σ C 2 ( t ) = E [ C ( t ) C * ( t ) ] = | Λ C ( t ; ω ) | 2 E [ | d Z ( ω ) | 2 ]
where E [ | d Z ( ω ) | 2 ] represents the spectral content of fluctuations of the random ξ field in the frequency range (ω,ω + ). It can be shown that [40]
E [ | d Z ( ω ) | 2 ] = S ξ ξ ( ω ) d ω
Inferring from the representation theorem for σ ξ 2 ,
σ C 2 ( t ) = S C C ( t ; ω ) d ω
and Equations (11) and (12), it follows that the evolutionary power spectrum for the outflow concentration process SCC(t; ω) can be expressed as
S C C ( t ; ω ) d ω = | Λ C ( t ; ω ) | 2 E [ | d Z ( ω | ) 2 = | Λ C ( t ; ω ) | 2 S ξ ξ ( ω ) d ω
That is, upon the solution of Equations (11) and (14) we can evaluate Equation (10) and, therefore, Equation (8).
The solution of Equations (3) and (4) in the Fourier frequency domain can be found by substituting Equation (6) and the Fourier–Stieltjes representation for the stationary ξ process [24,40],
ξ ( t ) = e i ω t d Z ξ ( ω )
into Equations (3) and (4):
Λ C i ( t ; ω ) = τ C ς ( 1 η 1 e i ω t )
where ς = 1 + iωτC and η1 = exp(−t/τC). Within a similar framework for evaluating SCC(t; ω), the evolutionary power spectrum for the inflow concentration process SCiCi(t; ω) and the corresponding variance of inflow concentration σ C i 2 can be computed as follows:
σ C i 2 ( t ) = E [ C i C i ] = E [ | Λ C i ( t ; ω ) | 2 E [ | d Z ( ω ) | 2 ] = S C i C i ( t ; ω ) d ω
Combining Equations (12) and (16), the integrand in Equation (17) can be represented as
S C i C i ( t ; ω ) = | Λ C i ( t ; ω ) | 2 S ξ ξ ( ω ) = σ ξ 2 λ τ C 2 π μ 1 μ 2 [ 1 2 η 1 cos ( ω t ) + η 1 2 ]
The variance of inflow concentration is then found, from substituting Equation (18) into Equation (17) and integrating it over the ω domain, to be
σ C i 2 ( t ) = S C i C i ( t ; ω ) d ω = σ ξ 2 λ τ C 1 + γ 1 ( 1 η 1 η 1 γ 1 η 2 1 γ 1 + η 1 2 )
where μ1 = 1 + τ C 2 ω2, μ2 = 1 + λ2ω2, γ1 = λ/τC, η1 = exp(−ε1), ε1 = t/τC and η2 = exp(−t/λ). In the limit of t → ∞, η1 approaches 0 and, therefore, Equations (18) and (19) approach finite values as
S C i C i ( t , ω ) = σ ξ 2 λ τ C 2 π μ 1 μ 2
σ C i 2 ( t ) = σ ξ 2 λ τ C 1 + γ 1
i.e., the corresponding Ci process becomes stationary. It can be inferred from Equations (18) or (19) that the variance of inflow concentration induced by a random ξ persists longer for a larger value of λ or τC.

3. Results and Discussion

With Equations (2), (5), (8)–(10), and (16), we are in the position of evaluating the variance of outflow concentration by combining Equations (13) and (14). The evaluation of the integral in Equation (11) cannot be performed analytically for the case of α in Equation (2) being a fractional number. However, to take the advantage of closed-form solutions for Equations (13) and (14), two cases are considered: (1) α = 1 and (2) α = 2. These expressions will be used to investigate the influence of various parameters on outflow concentration variability. It is expected that the concentration variability behavior for the case of α being a fractional number will be qualitatively similar to that of being an integer, although not quantitatively.
For the case of α = 1, Equation (2) becomes
g ( t ) = η 3 τ m
where η3 = exp(−t/τm). Based on Equations (8)–(10), (16), and (22), the evolutionary power spectrum for the outflow concentration process in Equation (14) is given by
S C C ( t ; ω ) = σ ξ 2 λ τ C 2 π ( 1 γ 2 ) μ 1 μ 2 μ 3 { ϕ 1 + 2 [ ϕ 2 + ϕ 3 cos ( ω t ) + ϕ 4 ρ sin ( ω t ) ] }
which leads to the following expression for the variance of outflow concentration:
σ C 2 ( t ) = σ ξ 2 τ C 2 γ 1 ( 1 γ 2 ) 2 { T 1 1 + γ 1 + T 2 1 + γ 2 [ 1 1 + γ 1 γ 2 2 γ 1 + γ 2 ] + 2 T 3 ( 1 γ 1 2 ) ( 1 + γ 2 ) + 2 γ 2 2 T 4 ( 1 + γ 2 ) ( γ 1 2 γ 2 2 ) }
In Equations (23) and (24), γ2 = τm/τC, μ3 = 1 + τ m 2 ω2, and expressions for ϕ1ϕ4 and T1T4 are given, respectively, in the Appendix A.
For a quantitative evaluation of the analytical developments presented in this section, it is convenient to present the analytical results as the following dimensionless variables: t/λ (dimensionless time), τm/λ (dimensionless catchment mean travel time), τC/λ (dimensionless solute response time), τm/τC (a ratio of the catchment mean travel time to the solute response time), t/τC (= (t/λ)/(τC/λ), a ratio of the dimensionless time to the dimensionless solute response time), and τCω (a dimensionless frequency). Note that dimensionless graphs provide much more information than when dimensions are included because it is possible to cover a wider range of the parameters.
Figure 1 illustrates the effect of the inflow response time scale τC on the variance of outflow concentration (Equation (24)) at various time scales. It is seen that the inflow with a larger τC will lead to higher outflow concentration variability. An increase in τC enhances the inflow concentration variability and, in turn, the outflow concentration variability. i.e., the temporal variability of outflow concentration persists longer for larger values of τC.
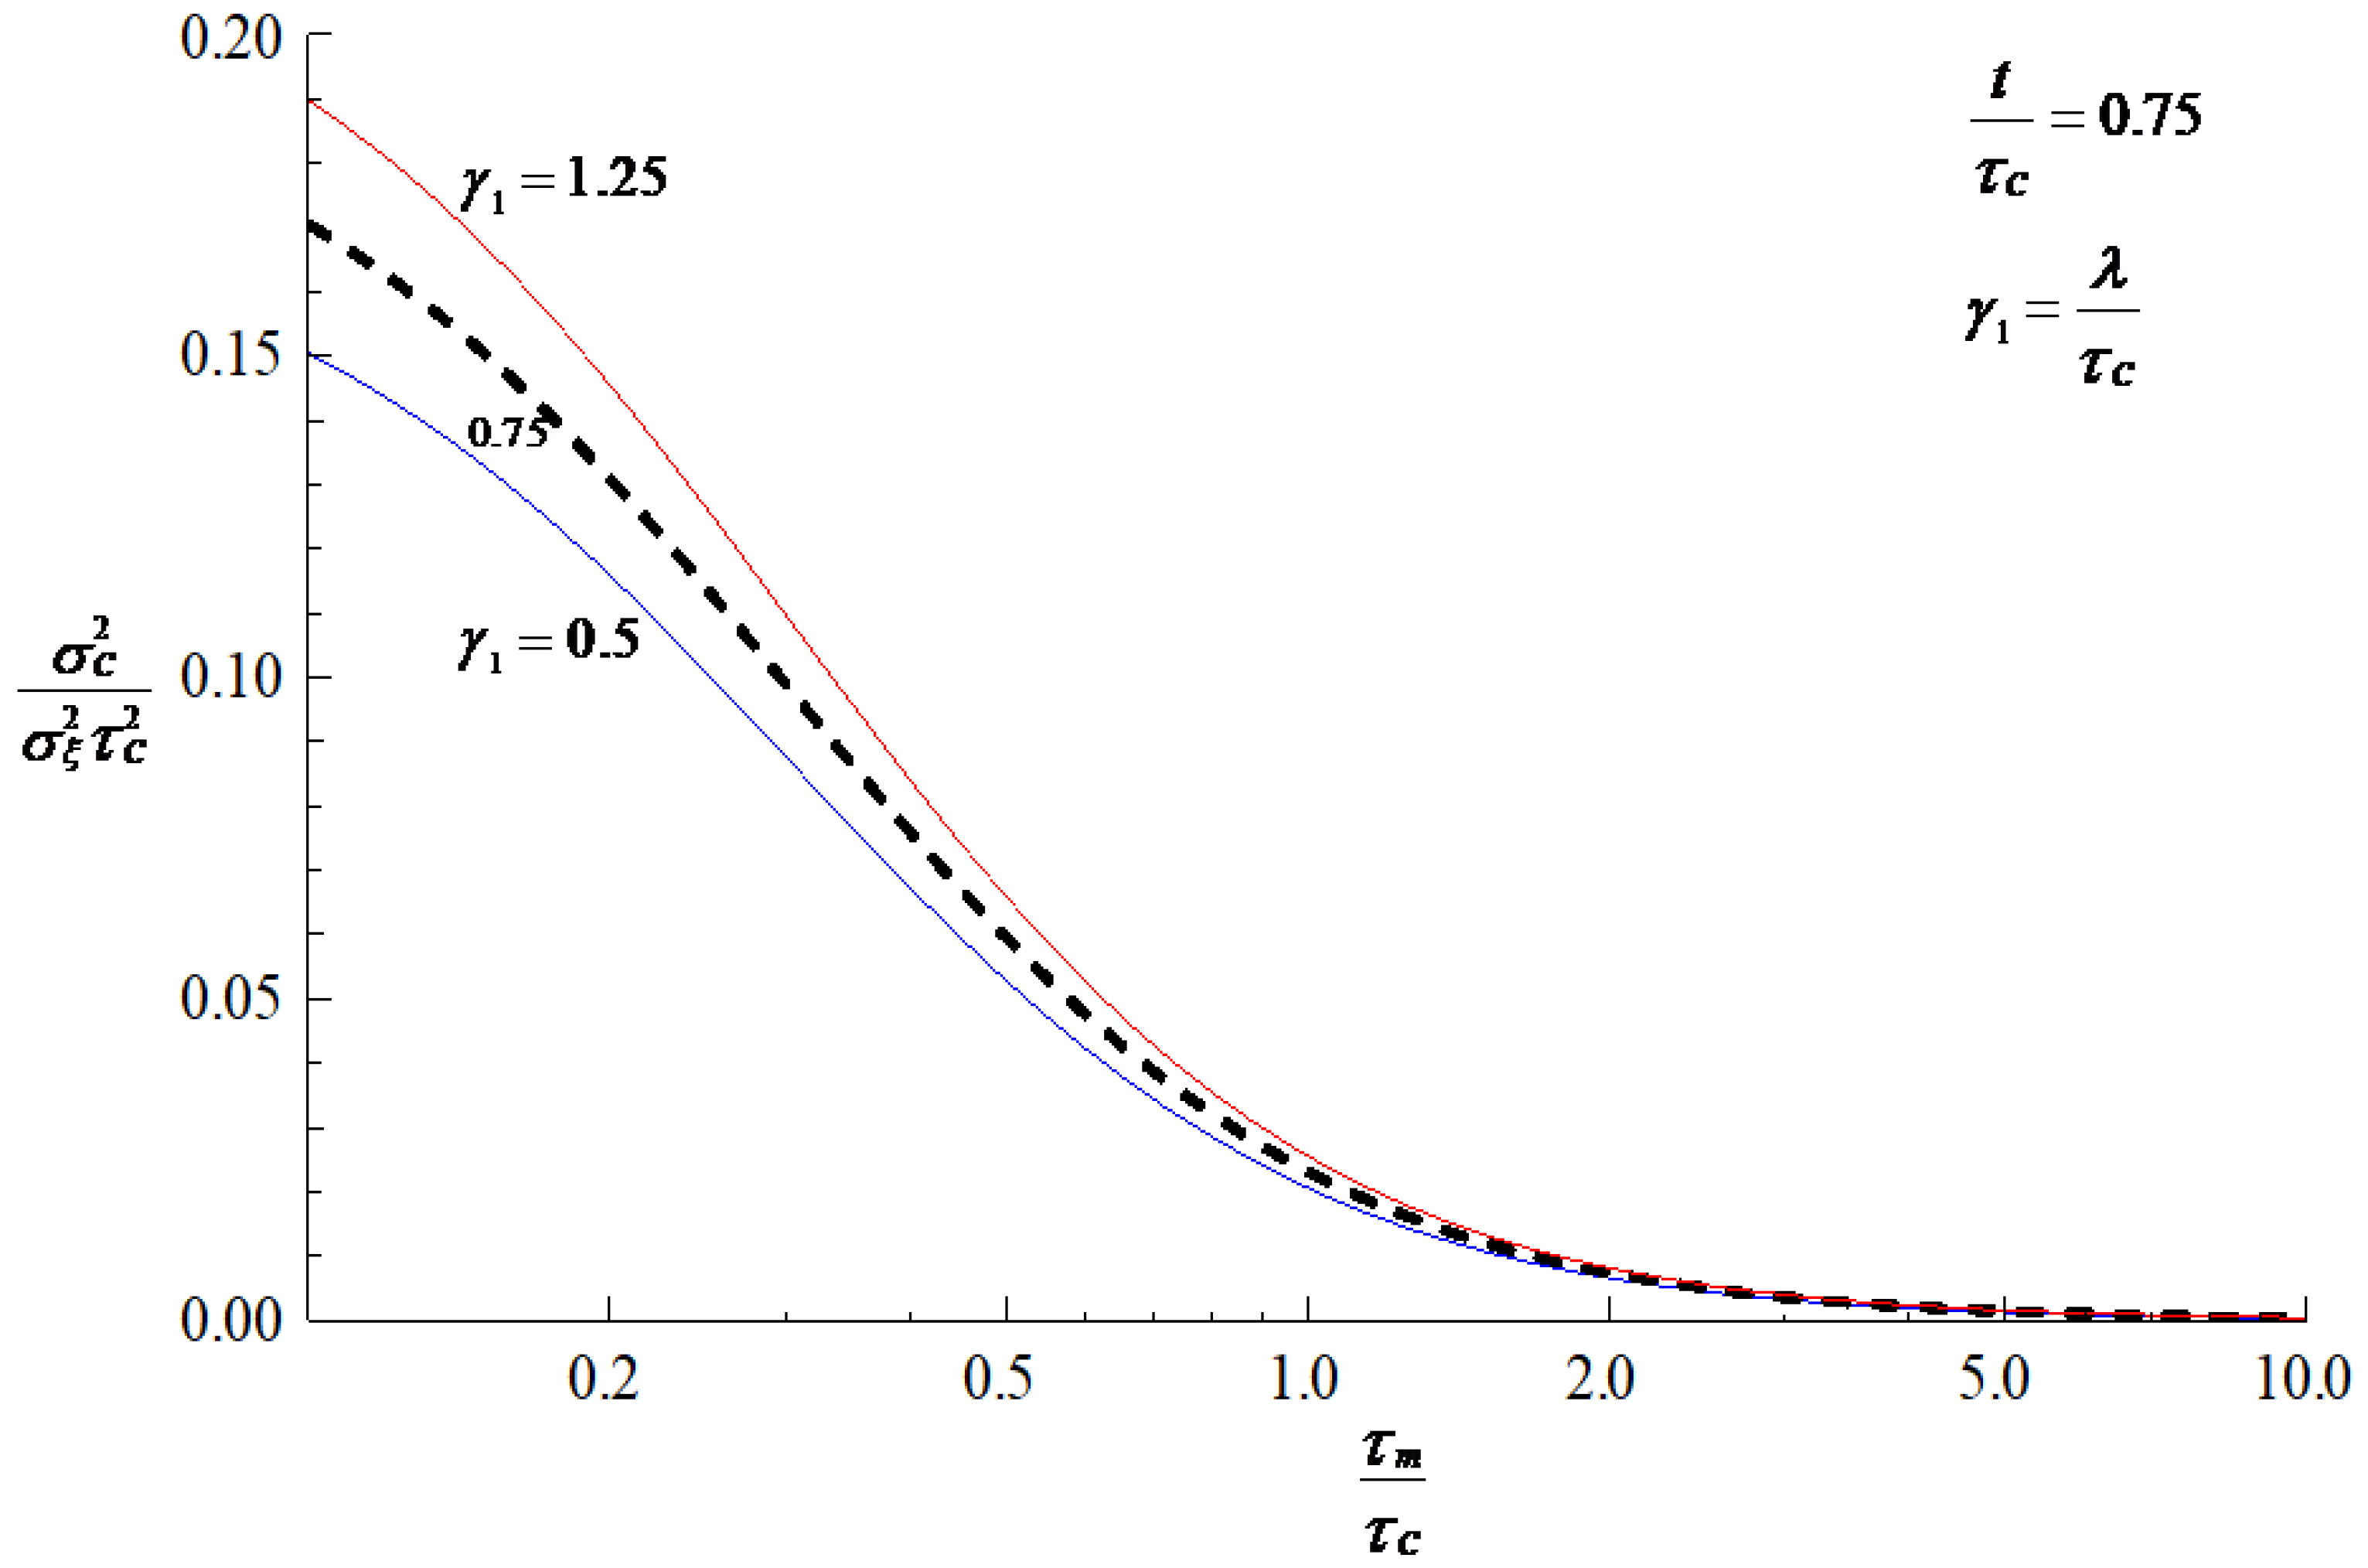
The variance of outflow concentration represented as function of τm is depicted in Figure 2 using Equation (24) for various values of λ/τC. The parameter τm apparently plays the role in smoothing out the concentration variability. This can be attributed to the reduction in the persistence of outflow concentration perturbation with τm which reduces the concentration variability. Here, the persistence is referred to the tendency for low values to be followed by low values and high values by high values. Additionally, from Figure 2, we see that for a fixed τm, an increase in λ results in higher variability of outflow concentration. A larger value of λ increases the persistence of inflow concentration and, in turn, the outflow concentration, leading to higher concentration variability.
For α = 2, the transfer function g(t) in Equation (2) has the form
g ( t ) = 4 t τ m 2 η 3 2
which leads Equation (14) eventually to
S C C ( t ; ω ) = 16 π σ ξ 2 λ τ C 2 η 3 4 μ 1 μ 2 { Γ 1 2 + 1 μ 4 2 [ Γ 2 + Γ 3 ρ 2 + ( Γ 4 + Γ 5 ρ 2 ) cos ( ρ ) + Γ 6 ρ sin ( ρ ) ] }
where μ4 = 4 + τ m 2 ω2 and expressions for Γ1Γ6 are given in the Appendix B. It follows from Equation (25) that the associated variance of outflow concentration is obtained as
σ C 2 ( t ) = 16 σ ξ 2 λ τ C η 3 4 { Γ 1 2 1 + γ 1 + 1 1 γ 1 2 [ 1 16 Φ 1 Γ 2 + 1 4 ε 2 2 γ 2 Φ 2 Γ 3 + Γ 4 ( Φ 3 Φ 4 ) 2 γ 2 η 3 2 ( Φ 5 Φ 6 ) Γ 1 + 2 γ 2 η 3 2 ( Φ 7 Φ 8 ) ( 4 Γ 1 ε 2 ) ] }
where expressions for Φ1Φ8 are given in the Appendix C.
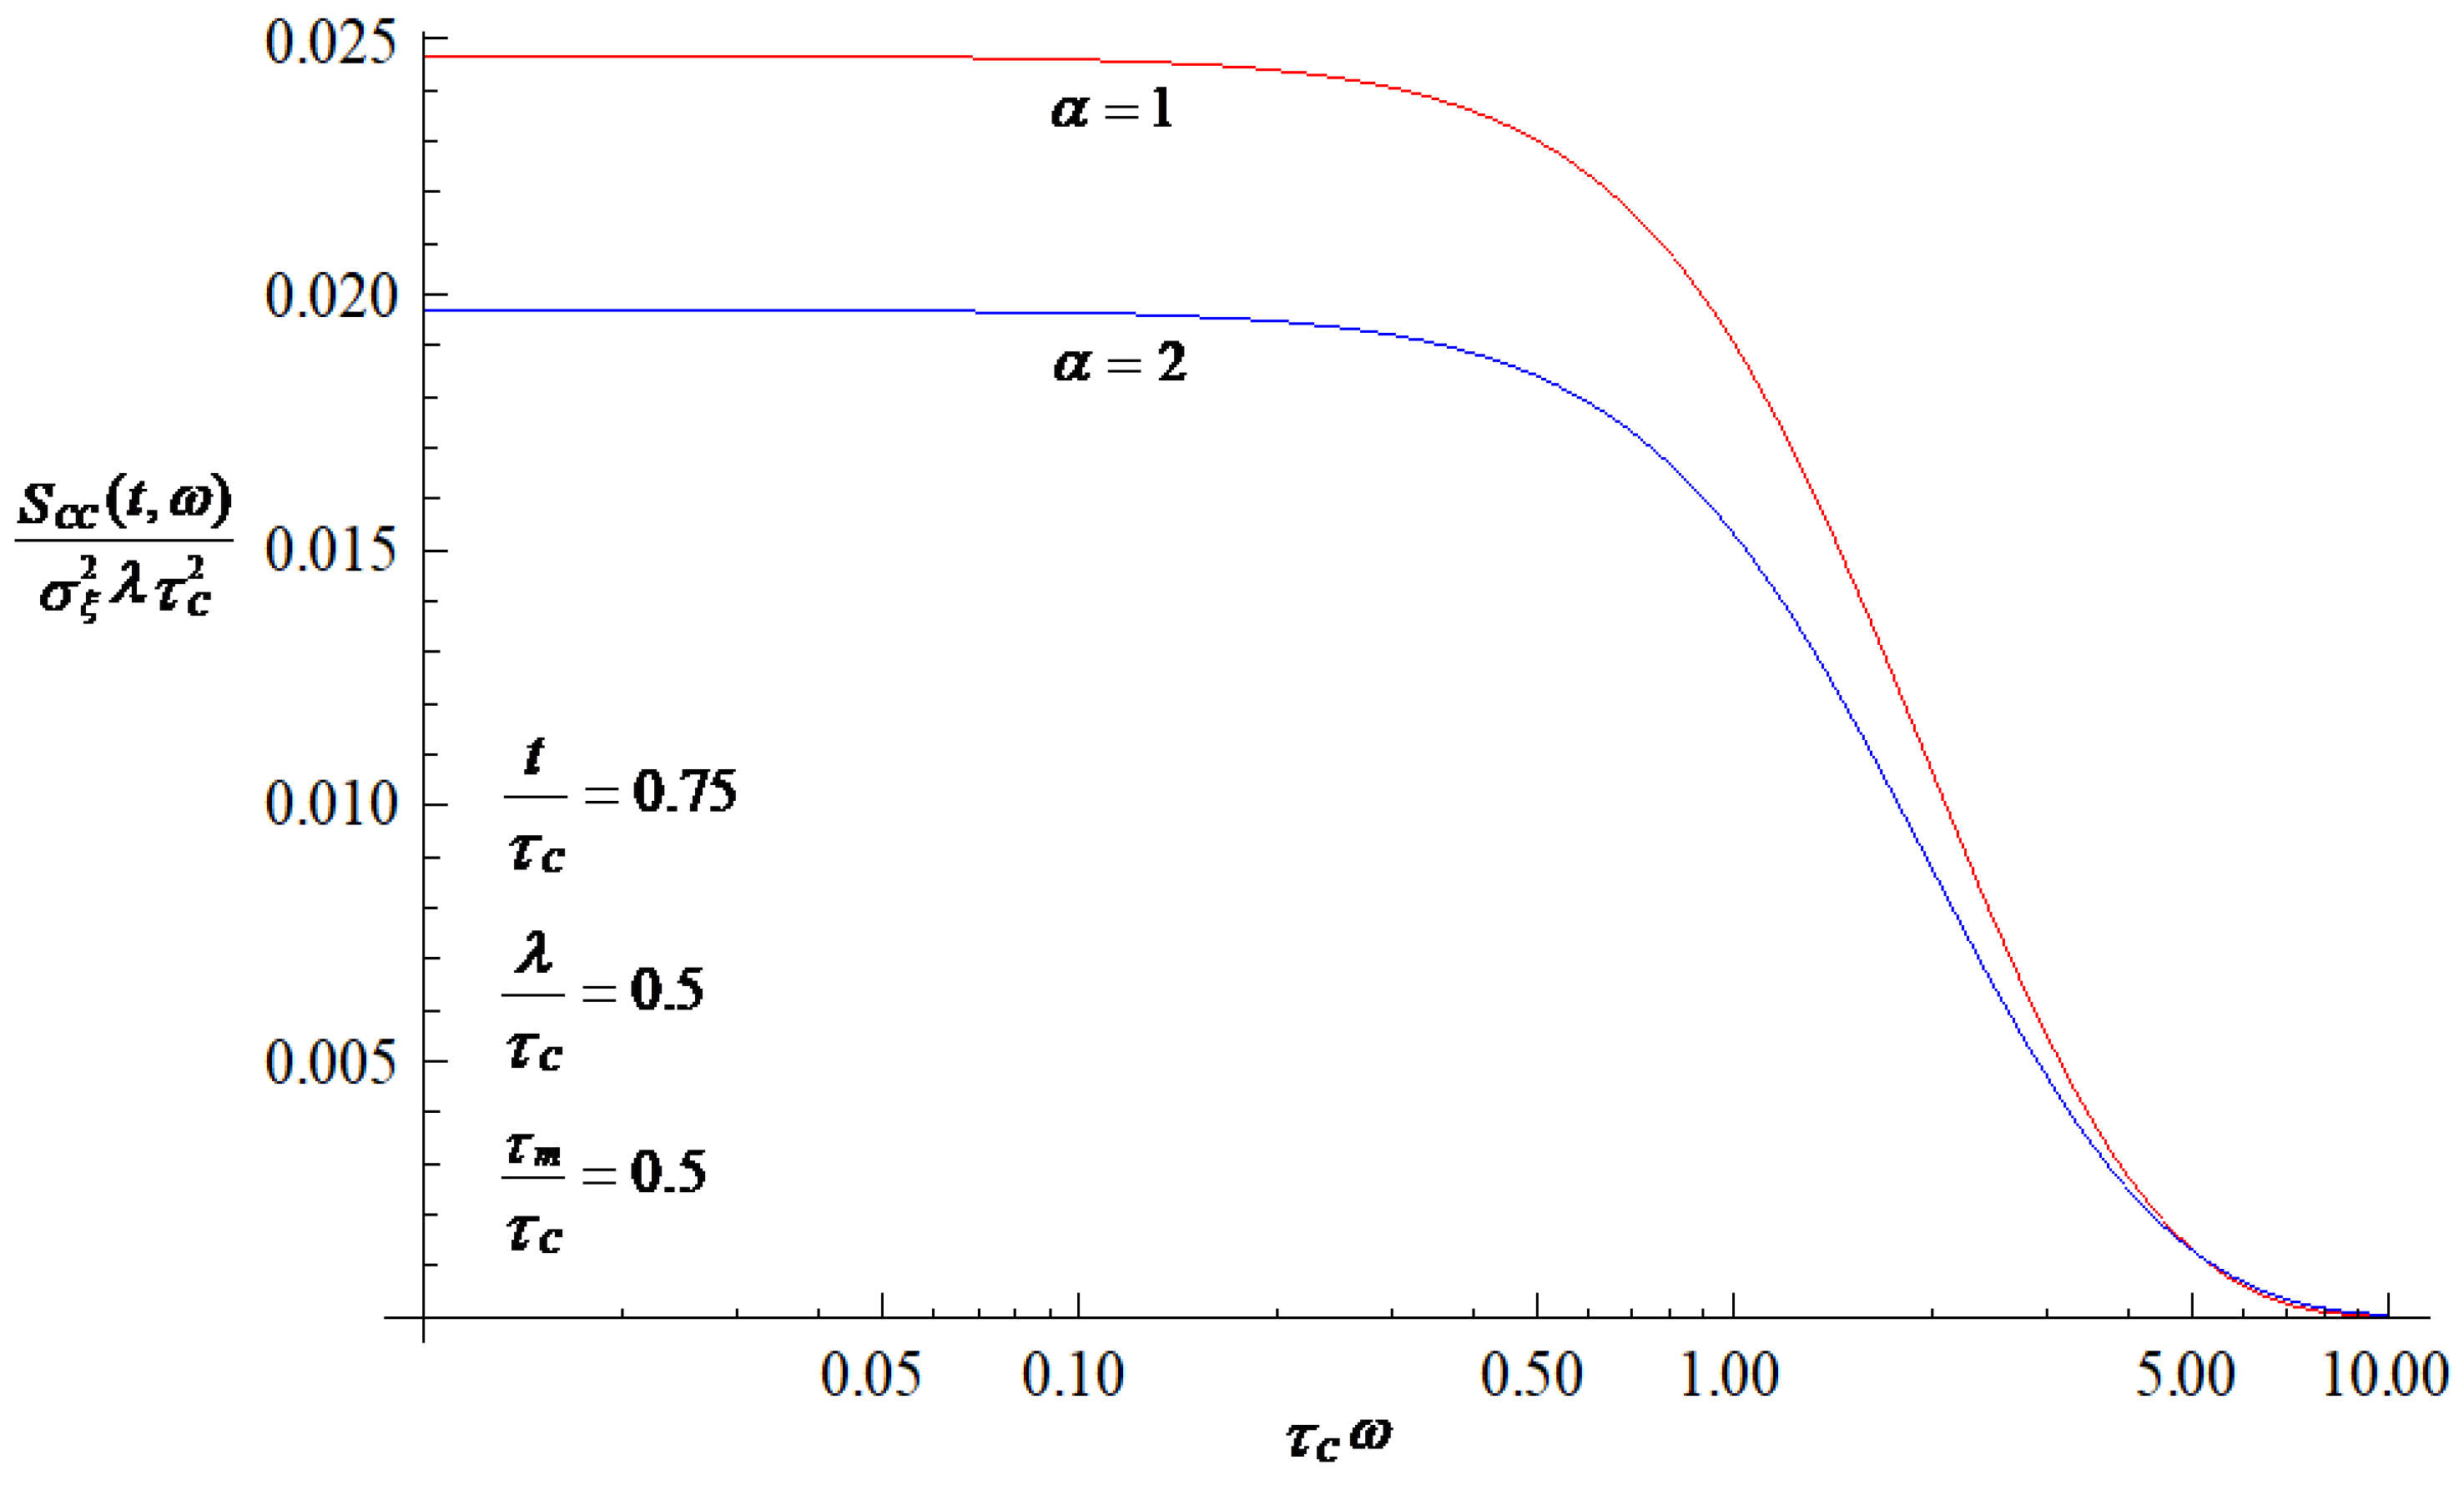
Figure 3 shows a comparison between the outflow concentration evolutionary power spectra given by Equations (23) and (26) at a given time. Evolutionary power spectra have the interpretation of decomposition of total energy (or the strength of the variations) over frequency at time t [40]. It is apparent from Figure 3 that high-frequency variations in the temporal input series are attenuated. A similar behavior is shown in Kirchner et al. [7,8] for the case of stationary outflow concentration time series. The figure also implies that the persistence of the concentration field is enhanced by a smaller value ofα. A smaller α will introduce greater variability in outflow concentration.
The parameter α in Equation (2) could be a fractional number. In this case, the integral in Equations (11) and (13) may not be evaluated analytically. Since the transfer function is acting as a filter, it is expected that the outflow concentration variability behavior for the case of α being an integer will be qualitatively similar to that for the case of α being a fractional number, but not quantitatively.
The determination of the transfer function in Equation (1) is of great importance in an application of the convolution integral model for modelling of hydrological processes. A brief introduction of using the cross-correlation technique in determining the transfer function is given as follows. Using Equations (6) and (7), it follows that
R C C i ( t ) = E [ C i ( t ) C * ( t ) ] = Λ C i ( t ; ω ) Λ C ( t ; ω ) S ξ ξ ( ω ) d ω
where RCCi the cross-correlation between Ci(t) and C(t) processes. Following Priestley [40], RCCi has a Fourier–Stieltjes representation of the form
R C C i ( t ) = S C C i ( t , ω ) d ω
where SCCi is the cross-spectrum between Ci(t) and C(t) processes. A comparison of Equation (28) with Equation (29) yields
S C C i ( t , ω ) = Λ C i ( t ; ω ) Λ C ( t ; ω ) S ξ ξ ( ω )
or
Λ C ( t ; ω ) = S C C i ( t , ω ) Λ C i ( t ; ω ) S ξ ξ ( ω )
At large times, Equation (31) reduces to
Ω ( t , ω ) = S C C i ( t , ω ) S C i C i ( ω )
where
Ω ( t , ω ) = 0 g ( t s ) e x p [ i ( s t ) ω ] d s
Given finite observations on the input (inflow concentration) and output (outflow concentration) processes, Equation (32) enables us to estimate the form of the transfer function by replacing the terms in the numerator and denominator by their respective sample estimates.
Most of the stochastic literature on the analysis of output time series from a linear time-invariant catchment system treats the input to the system as a stationary process, while this work is concerned with a temporal nonstationary input process, which leads to a nonstationary output process from the catchment system. In addition, the analyses presented in the above-mentioned references are carried out using the field observations (or experimental data) as an input time series to the system. In this work, the input nonstationary process is generated from solving a lumped solute transport model (the Langevin equation). That is, the present analysis is carried out using a combination of the convolution integral and Langevin models. To our knowledge, the closed-form expression for the variance of outflow concentration from the catchment system, such as Equation (24) or Equation (27), has not been presented in the literature so far using a nonstationary process as an input to Equation (1). The expression provides a useful way to evaluate the influence of parameters appearing in the models on the variability in outflow concentration. It is also interesting to note that the closed-form expression for the variance of nonstationary process with respect to a lumped solute transport model given by Equation (19) has never been presented in the literature before.
The proposed approach has the advantage of operating at the catchment scale and therefore, if an appropriate input–output transfer function can be specified at that scale, predicting the response of the catchment to any inflow concentration does not require specification of the small-scale spatial heterogeneity of precipitation and soil properties.

4. Concluding Remarks

The stochastic modeling approach recognizes that hydrological variables are affected by heterogeneity and regards them as random. This randomness leads to defining models of flow and transport in a stochastic context. An important feature of the stochastic approach presented here is its providing a rational framework for quantifying the variability in outflow concentration from a catchment.
The existing stochastic models for the analysis of solute transport in catchments generally assume stationarity in the concentration fields of inflow and outflow. The stochastic nature of non-stationary rainfall–runoff processes, and thus the solute transport processes through the runoff are ignored. The results of the present research, which deals with the analysis of the non-stationary catchment solute transport process, should be valuable for a better understanding of the behavior of the transport of pollutants in surface runoff at the outlet of natural catchments.
Import assumptions of this study are distributed contaminant sources and a linear rainfall-runoff process. These assumptions allow to neglect the spatial variability of the hydrological properties of the catchment and to express the output concentration of the catchment as a convolution of the input concentration and the transfer function.
In this study, the closed-form expressions for the variances of inflow and outflow concentrations of inert solutes at catchment scale are developed using the Fourier–Stieltjes representation approach. Based on the closed-form solutions, the impacts of the controlling parameters on the temporal variability of concentration are investigated. The results of the analysis indicate that the solute response time for the inflow solute-transport system and correlation scale of input concentration field play the role in increasing the persistence of outflow concentration perturbation, while the catchment mean travel time scale reduces it. A higher persistence means a less fluctuation in the outflow concentration around the mean, which leads to a larger concentration variability. In addition, the shape parameter reduces the persistence of outflow concentration perturbation and, in turn, the outflow concentration variability.

Author Contributions

Conceptualization, methodology, investigation, writing-original draft preparation, and editing and visualization, C.-M.C., K.-C.M. and M.-H.C. All authors have read and agreed to the published version of the manuscript.

Funding

This research is founded by the Taiwan Ministry of Science and Technology under grant no. MOST 109-2625-M-130 -004 and the APC was fund by MOST 109-2625-M-130-004.

Acknowledgments

We are grateful to the anonymous reviewers for constructive comments that improved the quality of the work.

Conflicts of Interest

The authors declare no conflict of interest.

Appendix A

ϕ 1 = μ 3 1 γ 2 ( η 3 η 1 ) 2
ϕ 2 = 1 2 ( 1 γ 2 ) + η 1 η 3 1 2 ( 1 + γ 2 ) η 3 2
ϕ 3 = γ 2 η 3 η 1
ϕ 4 = η 3 η 1 ε 2
T 1 = ( η 1 η 3 ) 2
T 2 = 1 γ 2 ( 1 + γ 2 ) η 3 2 + 2 η 1 η 3
T 3 = ( 1 + γ 2 ) η 1 2 + ( γ 1 + γ 2 ) η 1 η 2 + 2 γ 2 η 1 η 3 ( 1 + γ 1 ) γ 2 η 2 η 3
T 4 = ( γ 1 + γ 2 ) η 1 η 2 + 2 γ 2 η 1 η 3 + ( 1 + γ 1 ) γ 2 η 2 η 3 γ 2 ( 1 + γ 2 ) η 3 2
where η3 = exp(−ε2), and ε2 = t/τm.

Appendix B

Γ 1 = 1 ( 2 γ 2 ) 2 [ 1 + ( 2 γ 2 ) ε 1 γ 2 η 1 η 3 2 ]
Γ 2 = ν 1 2 + 1 η 3 4 8 ν 1 Γ 1
Γ 3 = 1 + 2 Γ 1 ε 2 ( ν 1 ε 2 4 )
Γ 4 = 2 η 3 2 ( 4 Γ 1 ν 1 )
Γ 5 = 2 Γ 1 ε 2 2 η 3 2
Γ 6 = 2 η 3 2 ( 4 Γ 1 ε 2 1 )
where ν1 = 2ε2 + 1.

Appendix C

Φ 1 = 4 + γ 2 ( 2 + γ 2 ) 2 4 γ 1 + γ 2 ( 2 γ 1 + γ 2 ) 2 γ 1 2
Φ 2 = 1 ( 2 + γ 2 ) 2 γ 1 ( 2 γ 1 + γ 2 ) 2
Φ 3 = 1 2 2 η 1 γ 2 η 3 2 ϑ 1 2 γ 2 16 ν 1 η 3 2 ϑ 1
Φ 4 = γ 1 4 2 2 γ 1 η 2 γ 2 η 3 2 ϑ 2 2 γ 2 γ 1 2 16 ν 1 η 3 2 ϑ 2
Φ 5 = 2 η 3 2 γ 2 η 1 ϑ 1 2 + 1 4 ν 2 η 3 2 ϑ 1
Φ 6 = γ 1 3 2 γ 1 η 3 2 γ 2 η 2 ϑ 2 2 + γ 1 2 4 ν 2 η 3 2 ϑ 2
Φ 7 = η 1 η 3 2 ϑ 1 2 1 4 ε 2 η 3 2 ϑ 1
Φ 8 = γ 1 4 η 1 η 3 2 ϑ 2 2 γ 1 2 4 ε 2 η 3 2 ϑ 2
where ϑ1 = 4 − γ 2 2 , ϑ2 = 4 γ 2 1 γ 2 2 , and ν2 = 2γ2 − 1.

References

  1. McGrath, G.; Hinz, C.; Sivapalan, M. Assessing the impact of regional rainfall variability on rapid pesticide leaching potential. J. Contam. Hydrol. 2010, 113, 56–65. [Google Scholar] [CrossRef] [PubMed]
  2. Kaufmann, V.; Pinheiro, A.; Castro, N.M. Simulating transport of nitrogen and phosphorus in a Cambisol after natural and simulated intense rainfall. J. Contam. Hydrol. 2014, 160, 53–64. [Google Scholar] [CrossRef] [PubMed]
  3. Dufilho, A.C.; Falco, S. Preferential flow modelling of chlorpyrifos leaching in two arid soils of irrigated agricultural production areas in Argentine Patagonia. J. Contam. Hydrol. 2019, 229, 103584. [Google Scholar] [CrossRef] [PubMed]
  4. Sivakumar, B. Chaos in Hydrology: Bridging Determinism and Stochasticity; Springer: Berlin, Germany, 2016. [Google Scholar]
  5. Rinaldo, A.; Marani, A. Basin scale model of solute transport. Water Resour. Res. 1987, 23, 2107–2118. [Google Scholar] [CrossRef]
  6. Loague, K.; Green, R.E.; Giambelluca, T.W.; Liang, T.C.; Yost, R.S. Impact of uncertainty in soil, climatic, and chemical information in a pesticide leaching assessment. J. Contam. Hydrol. 1990, 5, 171–194. [Google Scholar] [CrossRef]
  7. Kirchner, J.W.; Feng, X.; Neal, C. Fractal stream chemistry and its implications for contaminant transport in catchments. Nature 2000, 403, 524–527. [Google Scholar] [CrossRef]
  8. Kirchner, J.W.; Feng, X.; Neal, C. Catchment-scale advection and dispersion as a mechanism for fractal scaling in stream tracer concentrations. J. Hydrol. 2001, 254, 82–101. [Google Scholar] [CrossRef]
  9. Botter, G.; Bertuzzo, E.; Rinaldo, A. Transport in the hydrologic response: Travel time distributions, soil moisture dynamics, and the old water paradox. Water Resour. Res. 2010, 46, W03514. [Google Scholar] [CrossRef] [Green Version]
  10. Sousa, M.R.; Frind, E.O.; Rudolph, D.L. An integrated approach for addressing uncertainty in the delineation of groundwater management areas. J. Contam. Hydrol. 2013, 148, 12–24. [Google Scholar] [CrossRef]
  11. Baroni, G.; Zink, M.; Kumar, R.; Samaniego, L.; Attinger, S. Effects of uncertainty in soil properties on simulated hydrological states and fluxes at different spatio-temporal scales. Hydrol. Earth Syst. Sc. 2017, 21, 2301–2320. [Google Scholar] [CrossRef] [Green Version]
  12. Dagan, G. Flow and Transport in Porous Formations; Springer: New York, NY, USA, 1989. [Google Scholar]
  13. Gelhar, L.W. Stochastic Subsurface Hydrology; Prentice Hall: Englewood Cliffs, NJ, USA, 1993. [Google Scholar]
  14. Zhang, D. Stochastic Methods for Flow in Porous Media: Coping with Uncertainties; Academic Press: San Diego, CA, USA, 2002. [Google Scholar]
  15. Rubin, Y. Applied Stochastic Hydrogeology; Oxford University Press: New York, NY, USA, 2003. [Google Scholar]
  16. Domenico, P.A. Concepts and Models in Groundwater Hydrology; McGraw-Hill: New York, NY, USA, 1972. [Google Scholar]
  17. Małoszewski, P.; Zuber, A. Determining the turnover time of groundwater systems with the aid of environmental tracers. J. Hydrol. 1982, 57, 207–231. [Google Scholar] [CrossRef]
  18. Molénat, J.; Davy, P.; Gascuel-Odoux, C.; Durand, P. Study of three subsurface hydrological systems based on spectral and cross-spectral analysis of time series. J. Hydrol. 1999, 222, 152–164. [Google Scholar] [CrossRef]
  19. Jiménez-Martínez, J.; Longuevergne, L.; Le Borgne, T.; Davy, P.; Russian, A.; Bour, O. Temporal and spatial scaling of hydraulic response to recharge in fractured aquifers: Insights from a frequency domain analysis. Water Resour. Res. 2013, 49, 3007–3023. [Google Scholar] [CrossRef] [Green Version]
  20. Pedretti, D.; Russian, A.; Sanchez-Vila, X.; Dentz, M. Scale dependence of the hydraulic properties of a fractured aquifer estimated using transfer functions. Water Resour. Res. 2016, 52, 5008–5024. [Google Scholar] [CrossRef] [Green Version]
  21. Olsthoorn, T.N. Do a bit more with convolution. Groundwater 2007, 46, 13–22. [Google Scholar] [CrossRef] [PubMed]
  22. Palanisamy, B.; Workman, S.R. Observed hydrographs: On their ability to infer a time-invariant hydrological transfer function for flow prediction in ungauged basins. Hydrol. Process. 2012, 28, 401–413. [Google Scholar] [CrossRef]
  23. Dooge, J.C.I. A general theory of the unit hydrograph. J. Geophys. Res. 1959, 64, 241–256. [Google Scholar] [CrossRef]
  24. Lumley, J.L.; Panofsky, H.A. The Structure of Atmospheric Turbulence; John Wiley: New York, NY, USA, 1964. [Google Scholar]
  25. Priestley, M.B. Spectral Analysis and Time Series; Academic Press: Cambridge, MA, USA, 1981. [Google Scholar]
  26. Luo, J.; Cirpka, O.A.; Fienen, M.N.; Wu, W.; Mehlhorn, T.L.; Carley, J.; Jardine, P.M.; Criddle, C.S.; Kitanidis, P.K. A parametric transfer function methodology for analyzing reactive transport in nonuniform flow. J. Contam. Hydrol. 2006, 83, 27–41. [Google Scholar] [CrossRef]
  27. Butera, I.; Tanda, M.G.; Zanini, A. Simultaneous identification of the pollutant release history and the source location in groundwater by means of a geostatistical approach. Stoch. Environ. Res. Risk Assess. 2012, 27, 1269–1280. [Google Scholar] [CrossRef]
  28. Zhao, Y.; Rathore, S.S.; Liu, M.; Luo, J. Joint Bayesian inversion for analyzing conservative and reactive breakthrough curves. J. Hydrol. 2018, 567, 446–456. [Google Scholar] [CrossRef]
  29. McGuire, K.J.; McDonnell, J.J. A review and evaluation of catchment transit time modeling. J. Hydrol. 2006, 330, 543–563. [Google Scholar] [CrossRef]
  30. Godsey, S.E.; Aas, W.; Clair, T.A.; de Wit, H.A.; Fernandez, I.J.; Kahl, J.S.; Malcolm, I.A.; Neal, C.; Neal, M.; Nelson, S.J.; et al. Generality of fractal 1/f scaling in catchment tracer time series, and its implications for catchment travel time distributions. Hydrol. Process. 2010, 24, 1660–1671. [Google Scholar] [CrossRef]
  31. Jury, W.A.; Sposito, G.; White, R.E. A transfer function model of solute transport through soil: 1. Fundamental concepts. Water Resour. Res. 1986, 22, 243–247. [Google Scholar] [CrossRef]
  32. Dagan, G.; Nguyen, V. A comparison of travel time and concentration approaches to modeling transport by groundwater. J. Contam. Hydrol. 1989, 4, 79–91. [Google Scholar] [CrossRef]
  33. Duffy, C.J.; Gelhar, L.W. A frequency domain approach to water quality modeling in groundwater: Theory. Water Resour. Res. 1985, 21, 1175–1184. [Google Scholar] [CrossRef]
  34. Reeks, M.W. On a kinetic equation for the transport of particles in turbulent flows. Phys. Fluids A Fluid Dyn. 1991, 3, 446–456. [Google Scholar] [CrossRef]
  35. Gillespie, D.T. Fluctuation and dissipation in Brownian motion. J. Phys. 1993, 61, 1077–1083. [Google Scholar] [CrossRef] [Green Version]
  36. Korošak, D.; Cvikl, B.; Kramer, J.; Jecl, R.; Prapotnik, A. Fractional calculus applied to the analysis of spectral electrical conductivity of clay-water system. J. Contam. Hydrol. 2007, 92, 1–9. [Google Scholar] [CrossRef]
  37. Mann, M.E.; Lees, J.M. Robust estimation of background noise and signal detection in climatic time series. Clim. Change 1996, 33, 409–445. [Google Scholar] [CrossRef]
  38. Schulz, M.; Mudelsee, M. REDFIT: Estimating red-noise spectra directly from unevenly spaced paleoclimatic time series. Comput. Geosci. 2002, 28, 421–426. [Google Scholar] [CrossRef]
  39. Langevin, P. Sur la théorie du mouvement brownien. C. R. Acad. Sci. (Paris) 1908, 146, 530–533. [Google Scholar]
  40. Priestley, M.B. Evolutionary spectra and non-stationary processes. J. R. Stat. Soc. B 1965, 27, 204–237. [Google Scholar] [CrossRef]
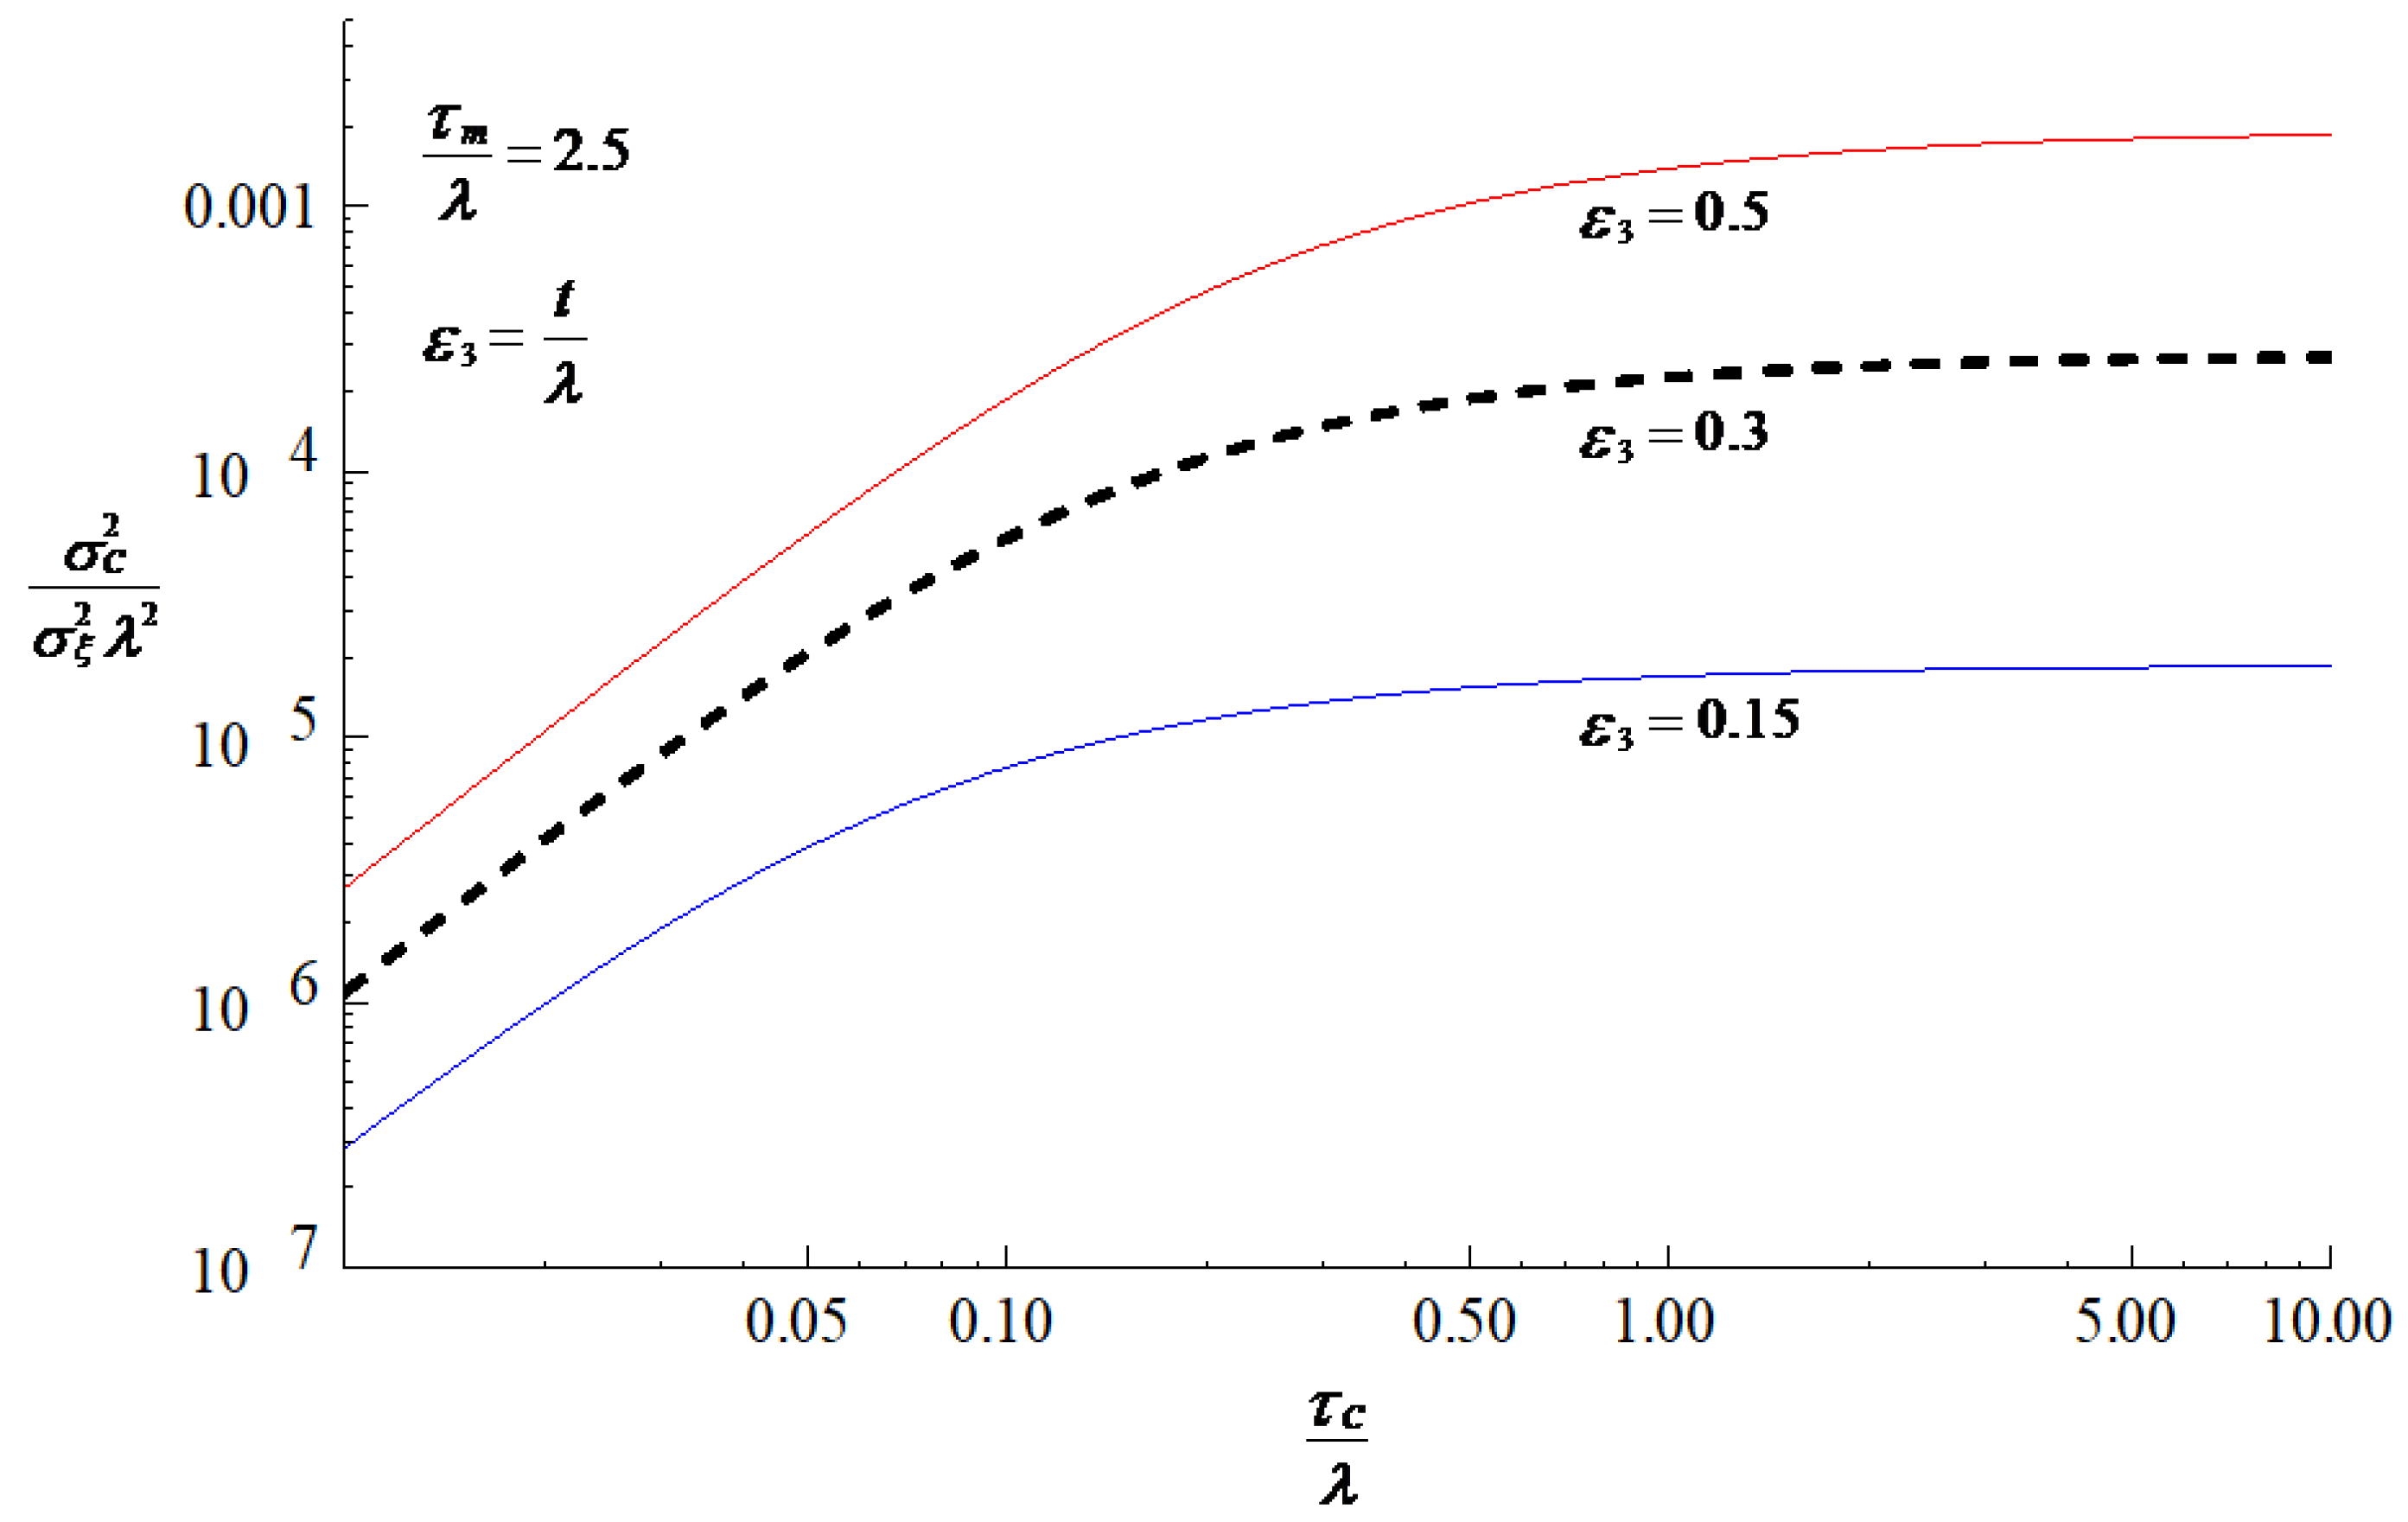
Figure 1. The dependence of dimensionless variance of outflow concentration (Equation (24)) upon the dimensionless inflow response time at various dimensionless time scales.
Applsci 10 05356 g001
Figure 2. The dependence of dimensionless variance of outflow concentration (Equation (24)) upon the dimensionless catchment mean travel time for various values of the dimensionless correlation scales.
Applsci 10 05356 g002
Figure 3. Comparison between the dimensionless evolutionary power spectra for the outflow concentration processes in Equations (23) and (26) at a given dimensionless time.
Applsci 10 05356 g003