Reflective Semiconductor Optical Amplifier Direct Modulation Capability Enhancement Using Birefringent Fiber Loop


Abstract
1. Introduction
2. Working Principle Qualitative Explanation
3. Experiment
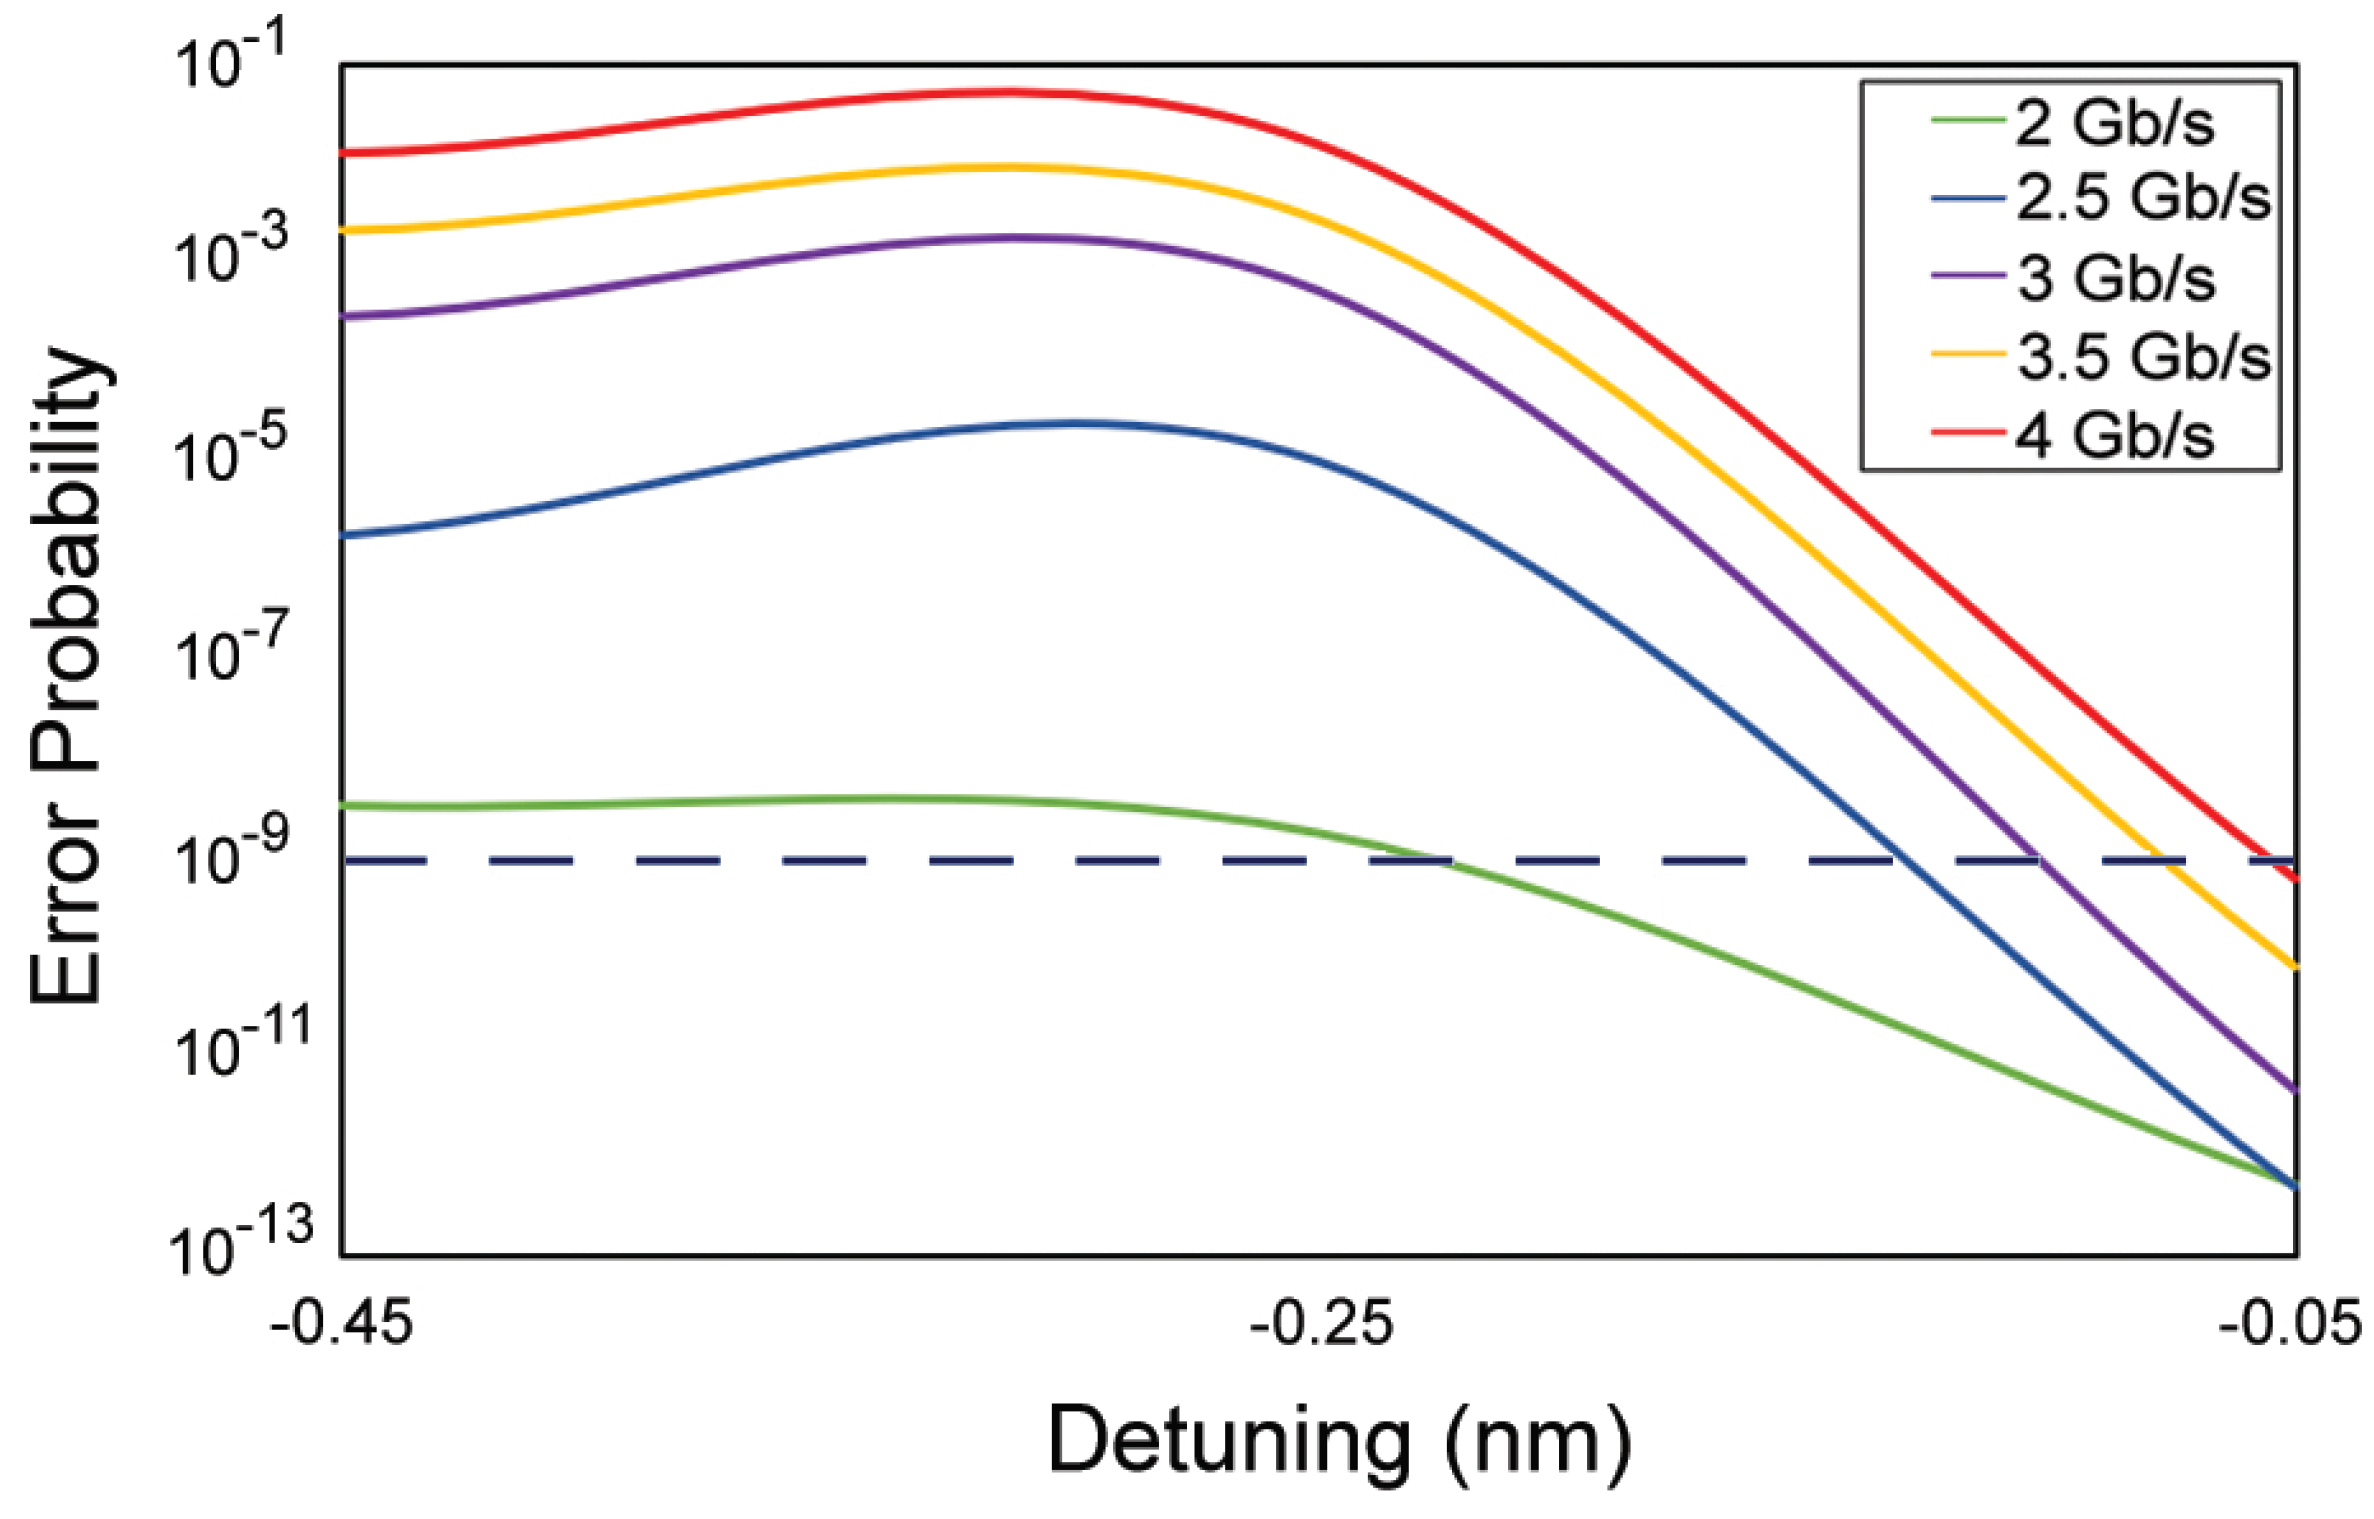
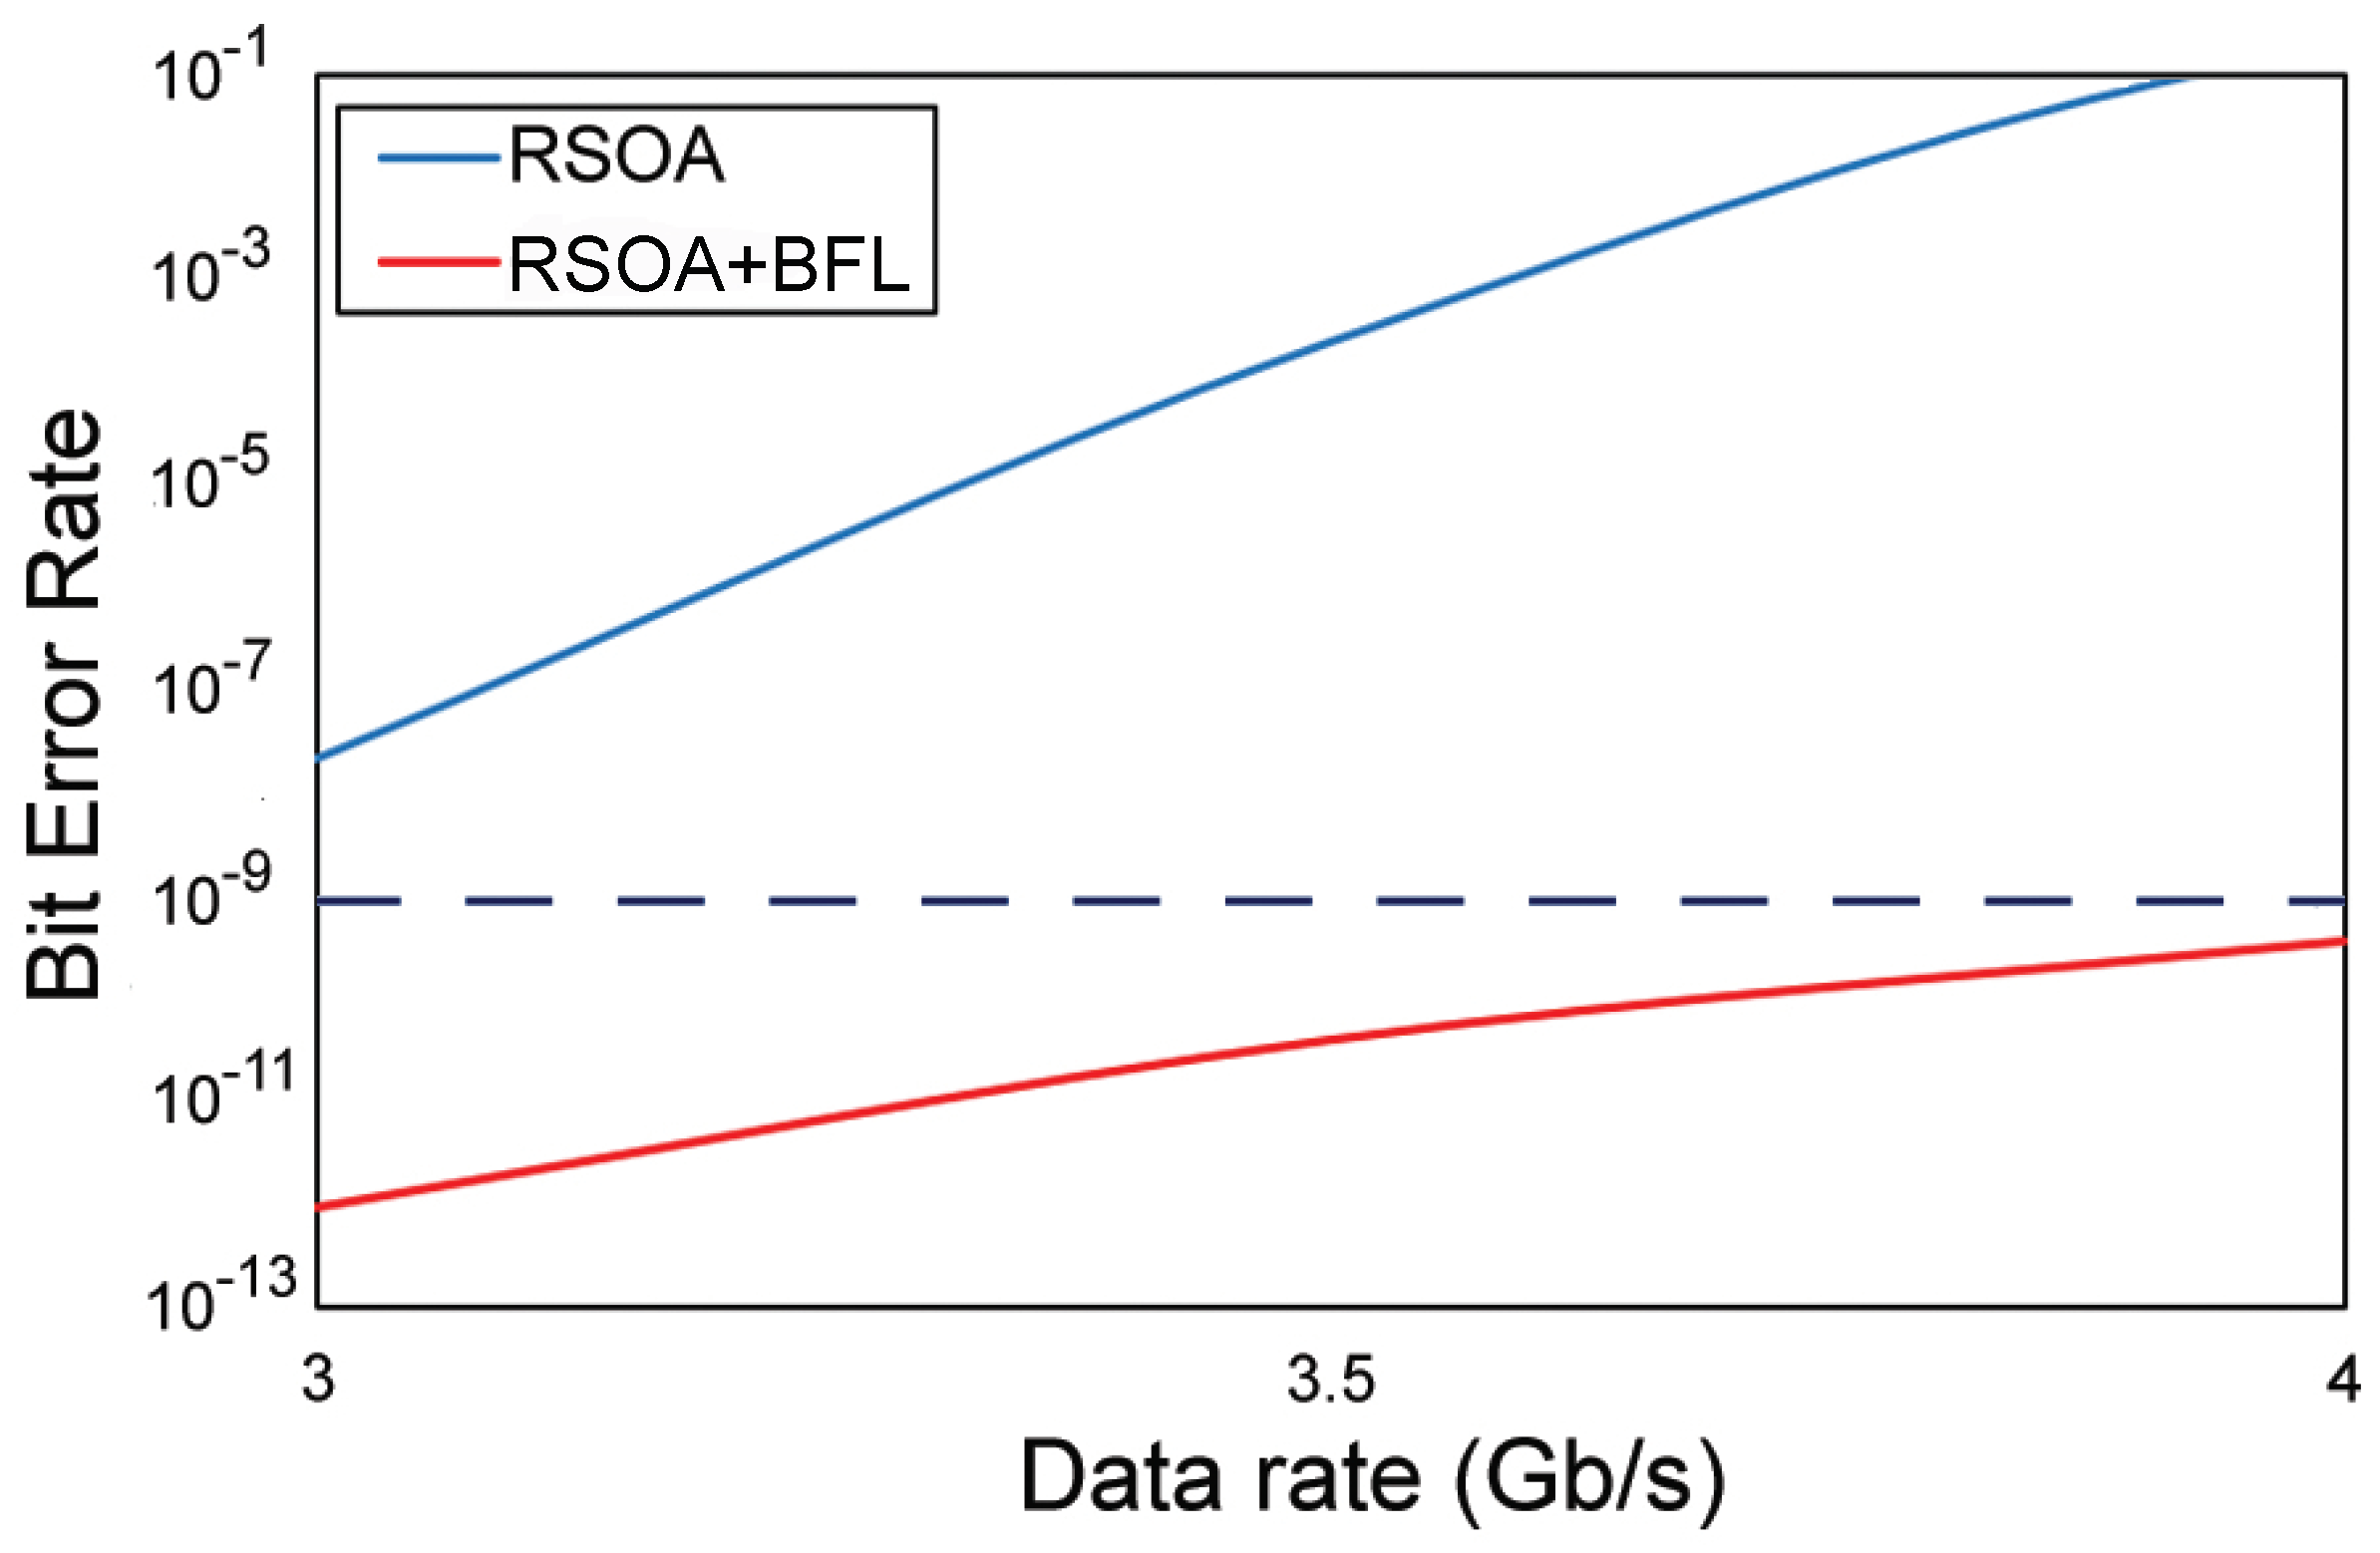
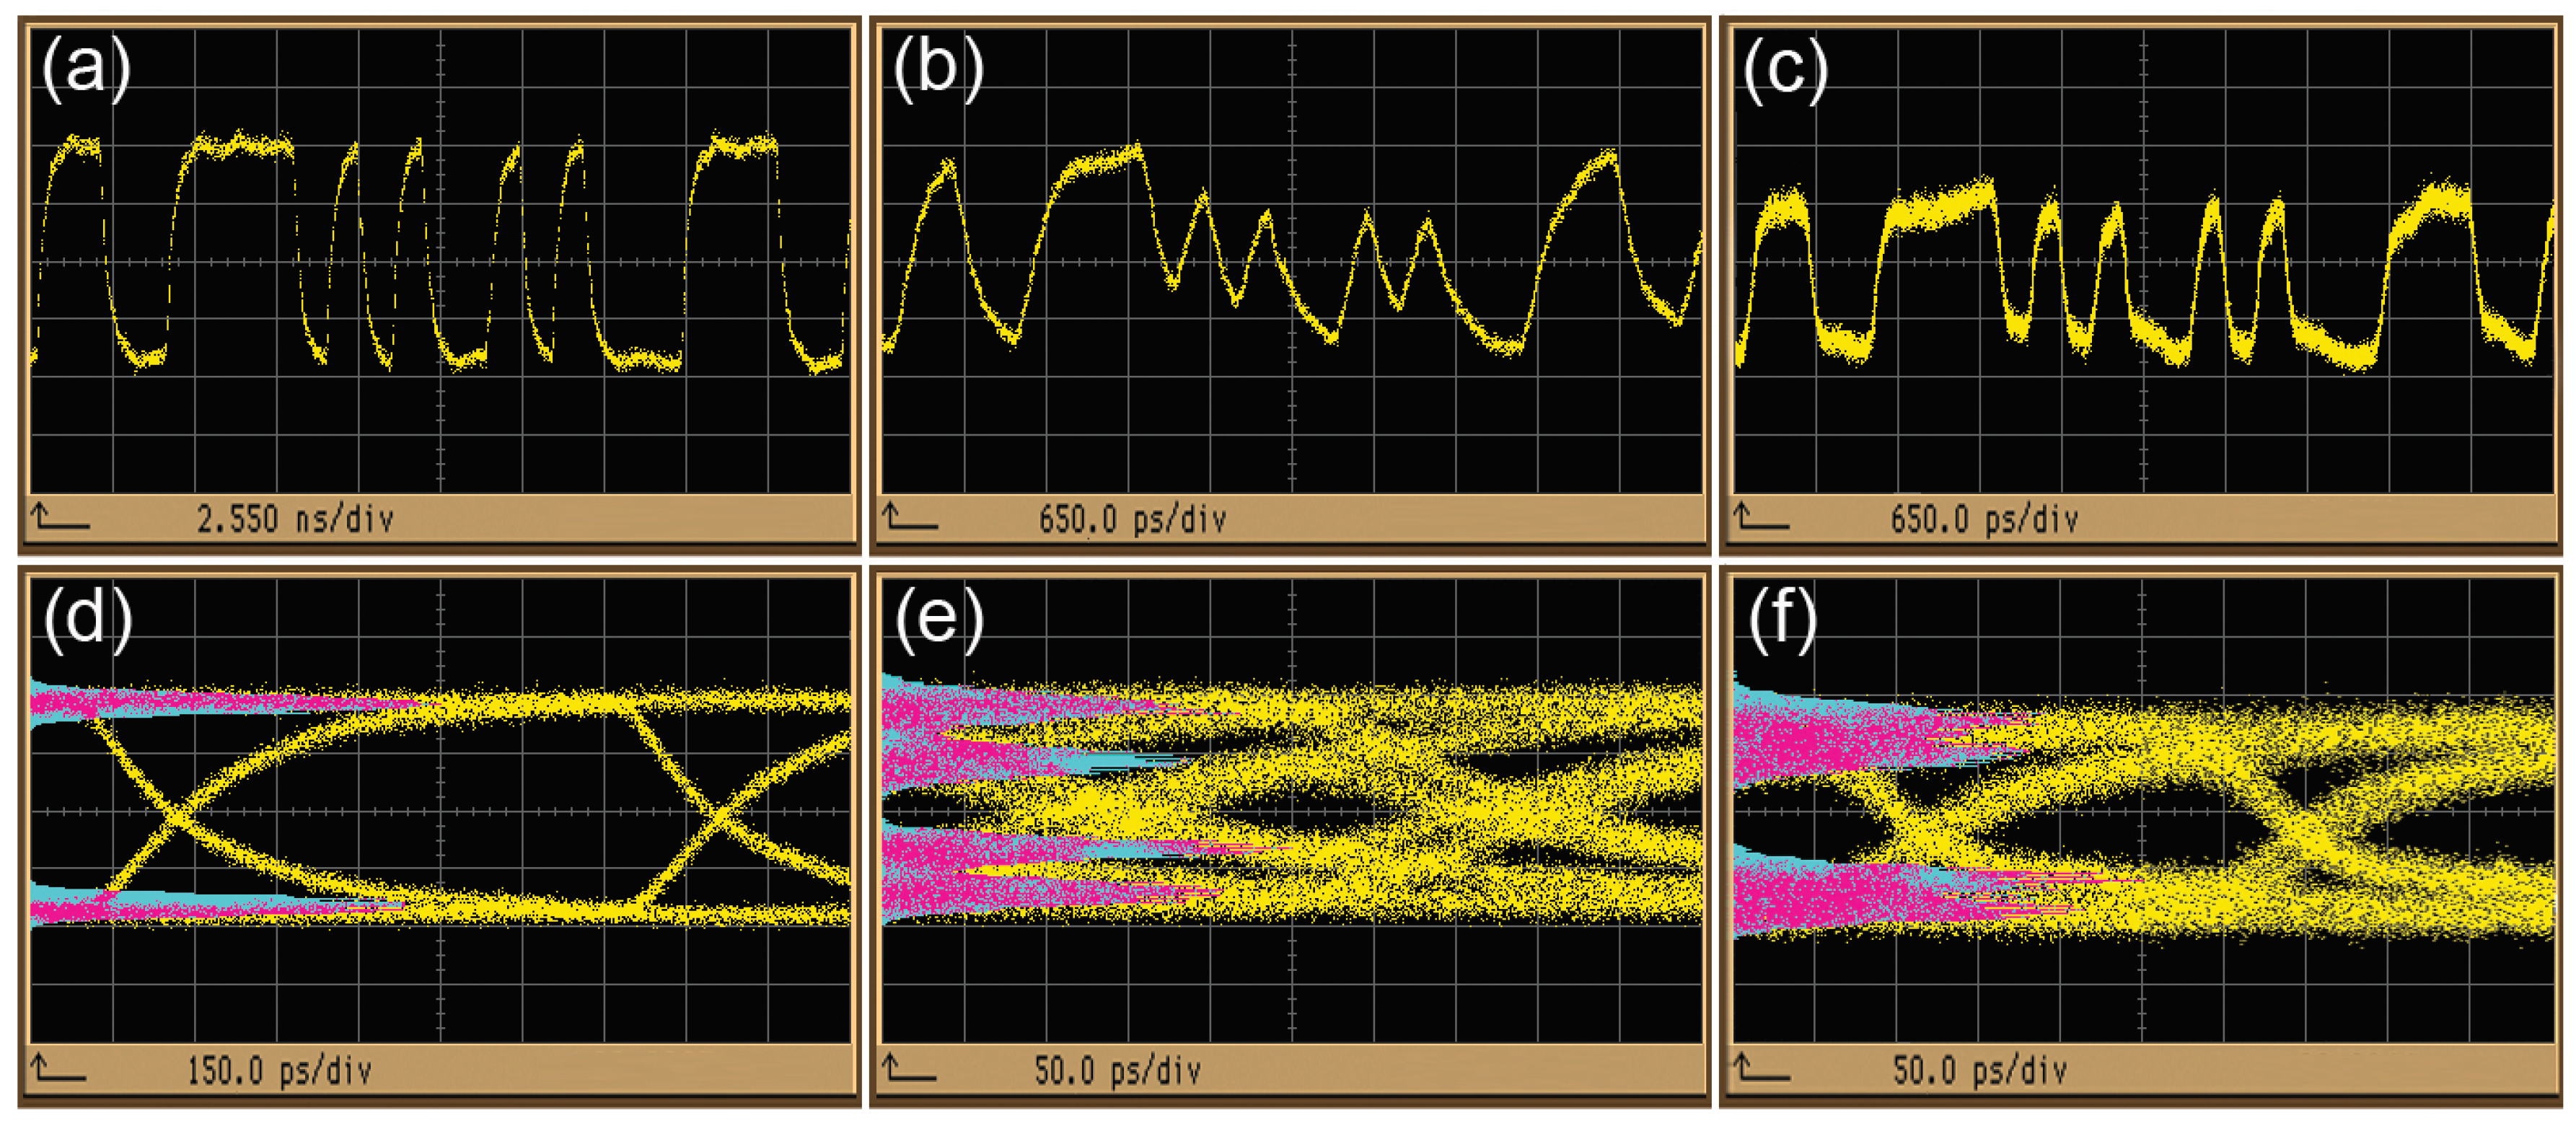
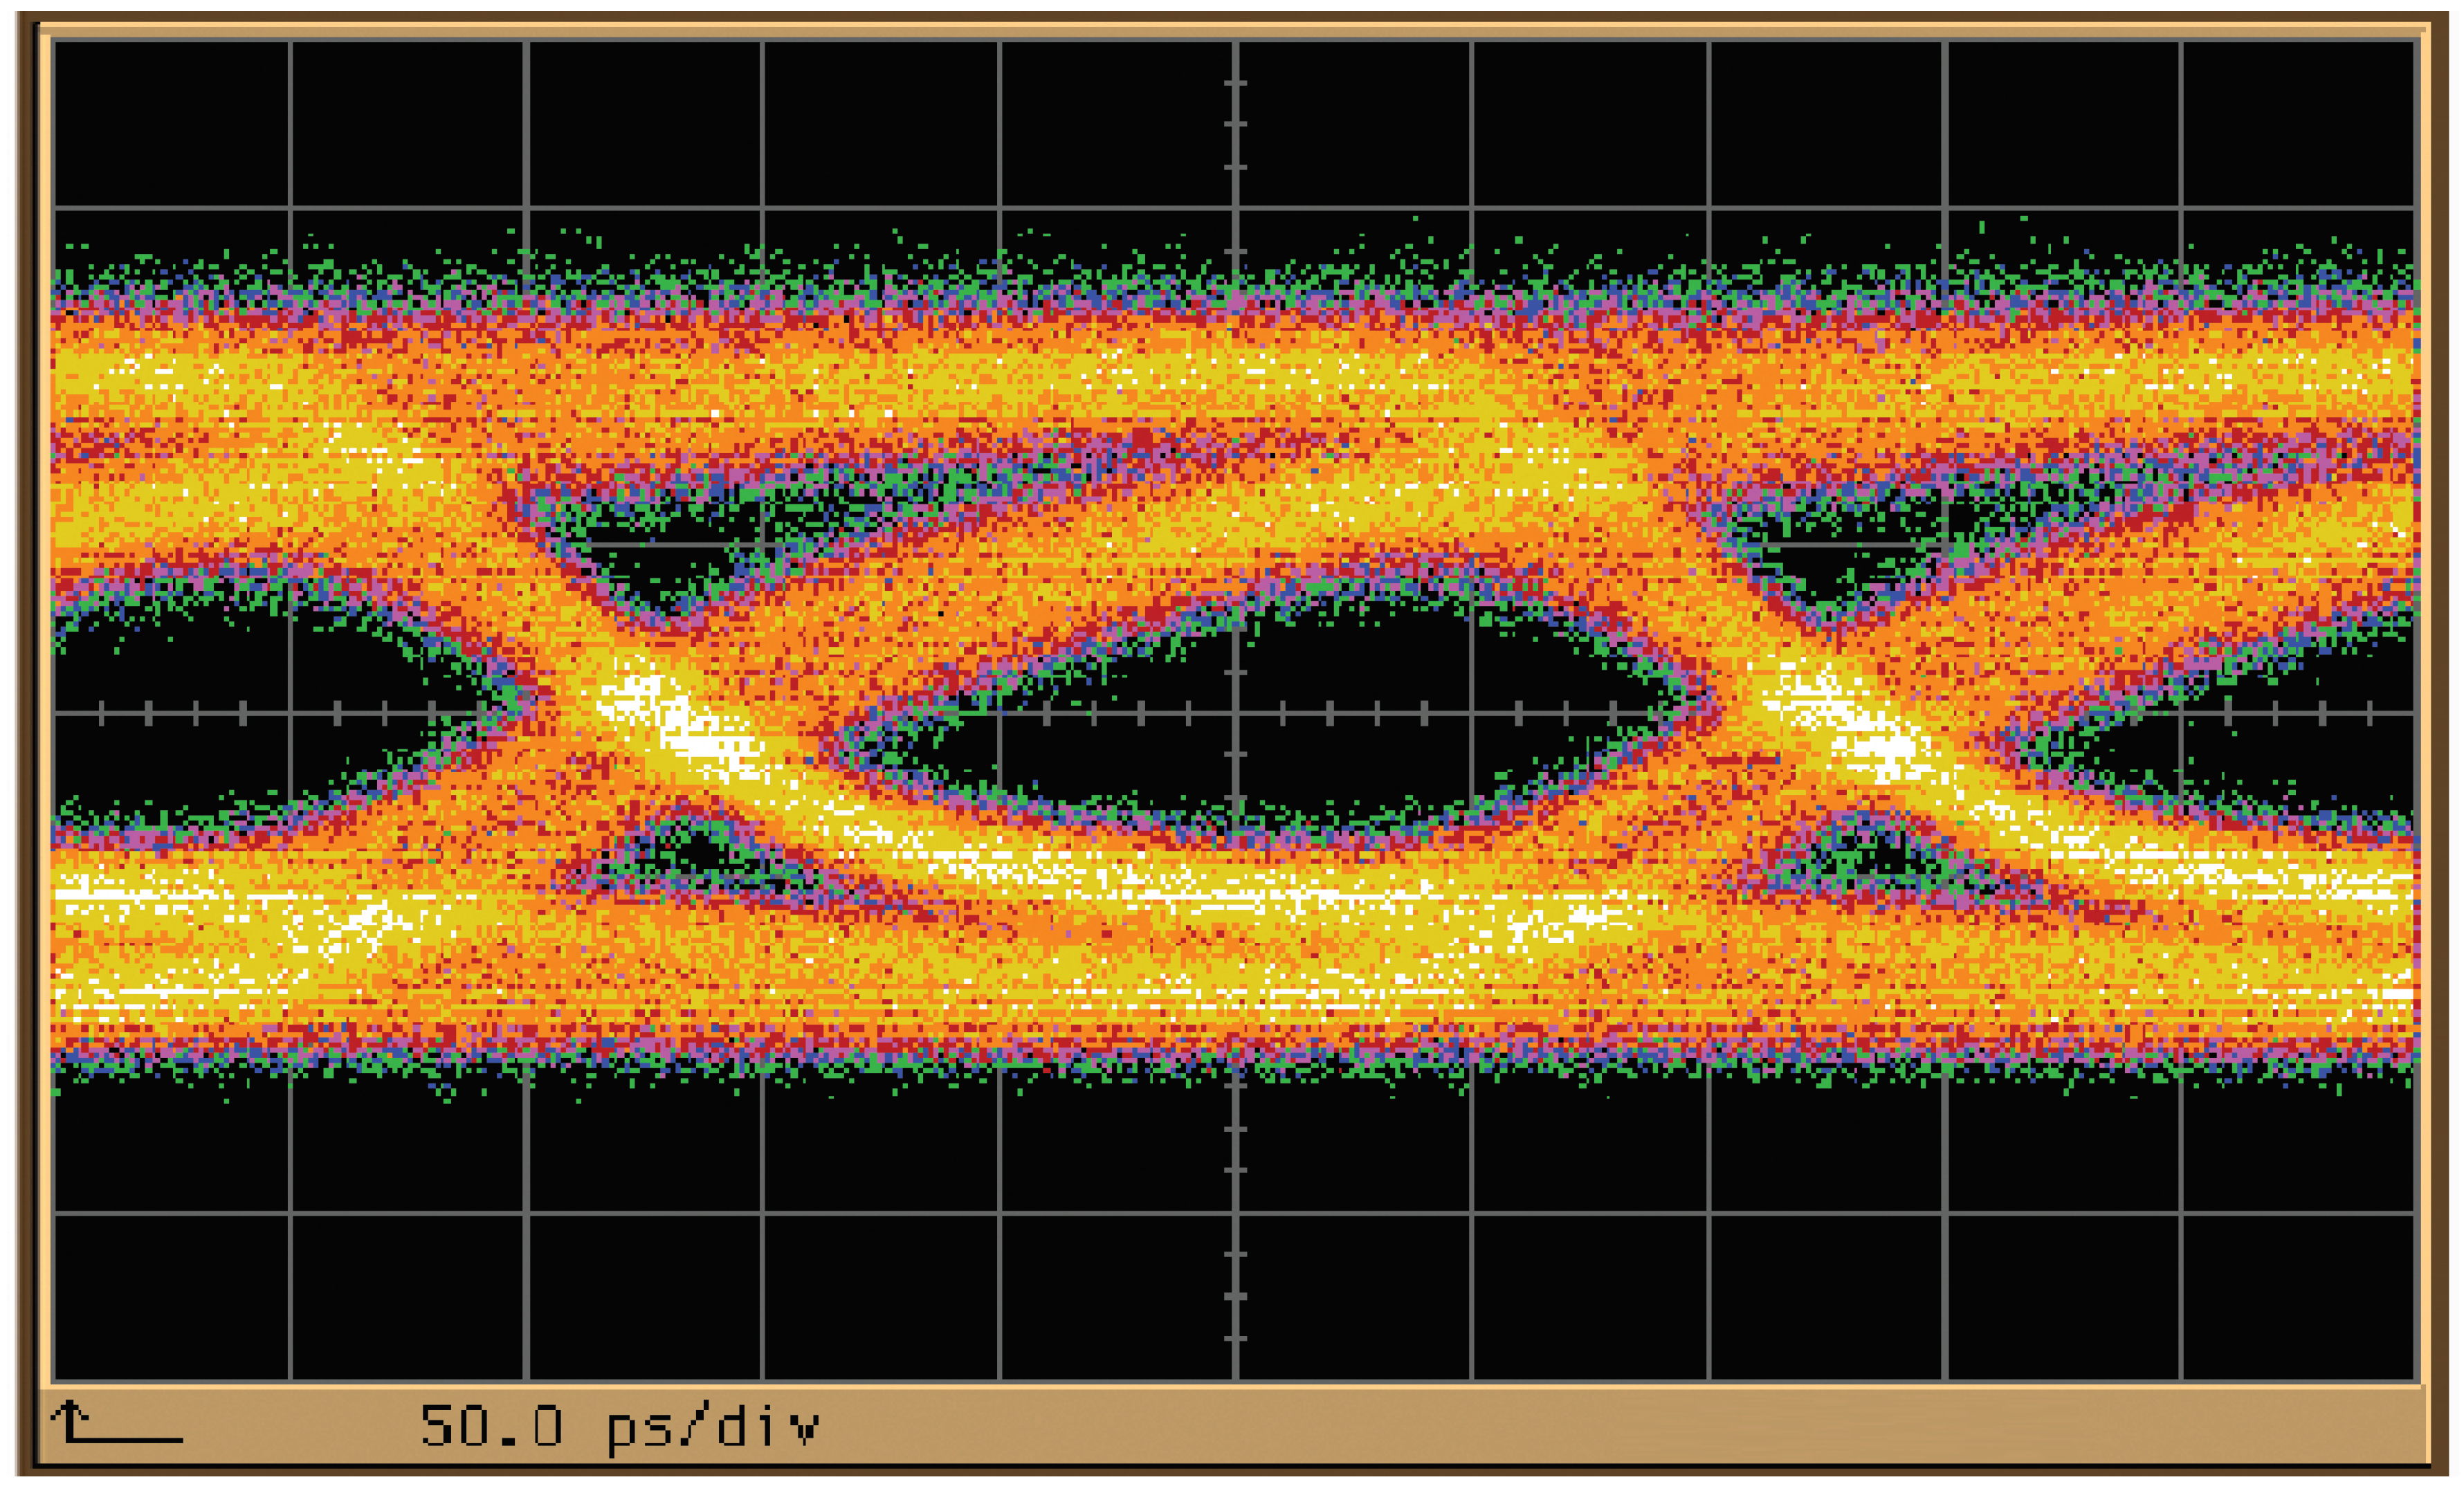
4. Results
5. Conclusions
Author Contributions
Funding
Conflicts of Interest
References
- Prat, J. Next-Generation FTTH Passive Optical Networks; Springer: Berlin/Heidelberg, Germany, 2008; Volume 5. [Google Scholar]
- Connelly, M.J. Reflective semiconductor optical amplifier pulse propagation model. IEEE Photon. Technol. Lett. 2011, 24, 95–97. [Google Scholar] [CrossRef]
- Spiekman, L.H. Active devices in passive optical networks. J. Light. Technol. 2013, 31, 488–497. [Google Scholar] [CrossRef]
- Zhang, W.; Sun, J.; Wang, J.; Liu, L. Multiwavelength mode-locked fiber-ring laser based on reflective semiconductor optical amplifiers. IEEE Photon. Technol. Lett. 2007, 19, 1418–1420. [Google Scholar] [CrossRef]
- Guo, L.; Connelly, M. A novel approach to all-optical wavelength conversion by utilizing a reflective semiconductor optical amplifier in a co-propagation scheme. Opt. Commun. 2008, 281, 4470–4473. [Google Scholar] [CrossRef]
- Liu, Z.; Sadeghi, M.; de Valicourt, G.; Brenot, R.; Violas, M. Experimental validation of a reflective semiconductor optical amplifier model used as a modulator in radio over fiber systems. IEEE Photon. Technol. Lett. 2011, 23, 576–578. [Google Scholar] [CrossRef]
- Peng, P.; Shiu, K.; Liu, W.; Chen, K.; Lu, H. A fiber-optical cable television system using a reflective semiconductor optical amplifier. Laser Phys. 2013, 23, 025106. [Google Scholar] [CrossRef]
- Meehan, A.; Connelly, M.J. Experimental characterization and modeling of the improved low frequency response of a current modulated bulk RSOA slow light based microwave phase shifter. Opt. Commun. 2015, 341, 241–244. [Google Scholar] [CrossRef]
- Wang, X.; Feng, X.; Zhang, P.; Wang, T.; Gao, S. Single-source bidirectional free-space optical communications using reflective SOA-based amplified modulating retro-reflection. Opt. Commun. 2017, 387, 43–47. [Google Scholar] [CrossRef]
- Wei, H.; Krishnaswamy, S. Comparative assessment of erbium fiber ring lasers and reflective SOA linear lasers for fiber Bragg grating dynamic strain sensing. Appl. Opt. 2017, 56, 3867–3874. [Google Scholar] [CrossRef]
- Kotb, A.; Zoiros, K.E.; Guo, C. Performance investigation of 120 Gb/s all-optical logic XOR gate using dual-reflective semiconductor optical amplifier-based scheme. J. Comput. Electron. 2018, 17, 1640–1649. [Google Scholar] [CrossRef]
- Dúill, S.Ó.; Marazzi, L.; Parolari, P.; Brenot, R.; Koos, C.; Freude, W.; Leuthold, J. Efficient modulation cancellation using reflective SOAs. Opt. Express 2012, 20, B587–B594. [Google Scholar] [CrossRef] [PubMed]
- Wong, E. Next-generation broadband access networks and technologies. J. Light. Technol. 2011, 30, 597–608. [Google Scholar] [CrossRef]
- Cho, K.Y.; Takushima, Y.; Chung, Y.C. 10-Gb/s operation of RSOA for WDM PON. IEEE Photon. Technol. Lett. 2008, 20, 1533–1535. [Google Scholar] [CrossRef]
- Totović, A.R.; Crnjanski, J.V.; Krstić, M.M.; Gvozdić, D.M. Numerical study of the small-signal modulation bandwidth of reflective and traveling-wave SOAs. J. Light. Technol. 2015, 33, 2758–2764. [Google Scholar] [CrossRef]
- Rizou, Z.; Zoiros, K.; Connelly, M. Semiconductor optical amplifier pattern effect suppression using optical notch filtering. J. Eng. Sci. Technol. Rev. 2016, 9, 198–201. [Google Scholar] [CrossRef]
- Kim, H. 10-Gb/s operation of RSOA using a delay interferometer. IEEE Photon. Technol. Lett. 2010, 22, 1379–1381. [Google Scholar] [CrossRef]
- Su, T.; Zhang, M.; Chen, X.; Zhang, Z.; Liu, M.; Liu, L.; Huang, S. Improved 10-Gbps uplink transmission in WDM-PON with RSOA-based colorless ONUs and MZI-based equalizers. Opt. Laser Technol. 2013, 51, 90–97. [Google Scholar] [CrossRef]
- Zhang, M.; Wang, D.; Cao, Z.; Chen, X.; Huang, S. Suppression of pattern dependence in 10 Gbps upstream transmission of WDM-PON with RSOA-based ONUs. Opt. Commun. 2013, 308, 248–252. [Google Scholar] [CrossRef]
- Presi, M.; Chiuchiarelli, A.; Corsini, R.; Choudury, P.; Bottoni, F.; Giorgi, L.; Ciaramella, E. Enhanced 10 Gb/s operations of directly modulated reflective semiconductor optical amplifiers without electronic equalization. Opt. Express 2012, 20, B507–B512. [Google Scholar] [CrossRef]
- Rizou, Z.V.; Zoiros, K.E. Theoretical analysis of directly modulated reflective semiconductor optical amplifier performance enhancement by microring resonator-based notch filtering. Appl. Sci. 2018, 8, 223. [Google Scholar] [CrossRef]
- Zoiros, K.; Morel, P. Enhanced performance of semiconductor optical amplifier at high direct modulation speed with birefringent fiber loop. AIP Adv. 2014, 4, 077107. [Google Scholar] [CrossRef]
- Engel, T.; Rizou, Z.V.; Zoiros, K.E.; Morel, P. Semiconductor optical amplifier direct modulation with double-stage birefringent fiber loop. Appl. Phys. B 2016, 122, 158. [Google Scholar] [CrossRef]
- Zoiros, K.E.; Morel, P.; Hamze, M. Performance improvement of directly modulated semiconductor optical amplifier with filter-assisted birefringent fiber loop. Microw. Opt. Technol. Lett. 2015, 57, 2247–2251. [Google Scholar] [CrossRef]
- Duill, S.O.; Barry, L.P. Improved reduced models for single-pass and reflective semiconductor optical amplifiers. Opt. Commun. 2015, 334, 170–173. [Google Scholar] [CrossRef]
- Antonelli, C.; Mecozzi, A.; Hu, Z.; Santagiustina, M. Analytic study of the modulation response of reflective semiconductor optical amplifiers. J. Light. Technol. 2015, 33, 4367–4376. [Google Scholar] [CrossRef]
- Rizou, Z.V.; Zoiros, K.E. Performance analysis and improvement of semiconductor optical amplifier direct modulation with assistance of microring resonator notch filter. Opt. Quantum Electron. 2017, 49, 119. [Google Scholar] [CrossRef]
- Rizou, Z.; Zoiros, K. SOA dynamics and pattern effects. In Handbook of Optoelectronic Device Modeling and Simulation: Fundamentals, Materials, Nanostructures, LEDs, and Amplifiers; CRC Press: Boca Raton, FL, USA, 2017. [Google Scholar]
- Papagiannakis, I.; Omella, M.; Klonidis, D.; Villa, J.A.L.; Birbas, A.N.; Kikidis, J.; Tomkos, I.; Prat, J. Design characteristics for a full-duplex IM/IM bidirectional transmission at 10 Gb/s using low bandwidth RSOA. J. Light. Technol. 2010, 28, 1094–1101. [Google Scholar] [CrossRef]
- Wei, J.; Hamié, A.; Giddings, R.; Tang, J. Semiconductor optical amplifier-enabled intensity modulation of adaptively modulated optical OFDM signals in SMF-based IMDD systems. J. Light. Technol. 2009, 27, 3678–3688. [Google Scholar] [CrossRef]
- Gebrewold, S.A. Reflective Semiconductor Optical Amplifiers (RSOAs) as Colorless Sources in Access Networks. Ph.D. Thesis, ETH Zurich, Zurich, Switzerland, 2016. [Google Scholar]
- Rizou, Z.V.; Zoiros, K.E.; Hatziefremidis, A.; Connelly, M.J. Design analysis and performance optimization of a Lyot filter for semiconductor optical amplifier pattern effect suppression. IEEE J. Sel. Top. Quantum Electron. 2013, 19, 1–9. [Google Scholar] [CrossRef]
- Kashany-Mizrahi, I.; Sadot, D. Low-cost adaptive directly modulated optical OFDM based on semiconductor optical amplifier. Opt. Fiber Technol. 2013, 19, 501–506. [Google Scholar] [CrossRef]
- Zhao, Y.; Song, T.T.; Wang, Q. Recent developments and applications of polarization-maintaining fiber loop mirrors. Instrum. Sci. Technol. 2012, 40, 239–261. [Google Scholar] [CrossRef]
- Kim, D.H.; Kang, J.U. Sagnac loop interferometer based on polarization maintaining photonic crystal fiber with reduced temperature sensitivity. Opt. Express 2004, 12, 4490–4495. [Google Scholar] [CrossRef] [PubMed]
- Chow, C.W.; Tsang, H. Polarization-independent DPSK demodulation using a birefringent fiber loop. IEEE Photon. Technol. Lett. 2005, 17, 1313–1315. [Google Scholar] [CrossRef]
- Johnstone, W. Eye Diagrams & BER in Optical Communications BER (COM) Instructor Manual; OptoSci Ltd.: Glasgow, Scotland, 2010. [Google Scholar]
- de Valicourt, G.; Pommereau, F.; Poingt, F.; Lamponi, M.; Duan, G.; Chanclou, P.; Violas, M.; Brenot, R. Chirp reduction in directly modulated multi-electrode RSOA devices in passive optical networks. IEEE Photon. Technol. Lett. 2010, 22, 1425–1427. [Google Scholar] [CrossRef]
- Agrawal, G.P. Fiber-Optic Communication Systems; John Wiley & Sons: Hoboken, NJ, USA, 2012; Volume 222. [Google Scholar]
- Säckinger, E. Broadband Circuits for Optical Fiber Communication; John Wiley & Sons: Hoboken, NJ, USA, 2005. [Google Scholar]
- de Valicourt, G.; Brenot, R. 10 Gbit/s modulation of reflective SOA without any electronic processing. In Proceedings of the Optical Fiber Communication Conference, Los Angeles, CA, USA, 6–10 March 2011; p. OThT2. [Google Scholar]
- de Valicourt, G.; Violas, M.A.; Wake, D.; van Dijk, F.; Ware, C.; Enard, A.; Make, D.; Liu, Z.; Lamponi, M.; Duan, G.H.; et al. Radio-over-fiber access network architecture based on new optimized RSOA devices with large modulation bandwidth and high linearity. IEEE Trans. Microw. Theory 2010, 58, 3248–3258. [Google Scholar] [CrossRef]
- Cho, K.Y.; Hong, U.H.; Choi, H.; Chung, Y.C. Maximum operable speed of WDM PON employing bandwidth-limited RSOAs. Opt. Commun. 2014, 312, 159–162. [Google Scholar] [CrossRef]
- Vacondio, F.; Sisto, M.M.; Mathlouthi, W.; Rusch, L.A.; LaRochelle, S. Electrical-to-optical conversion of OFDM 802.11 g/a signals by direct current modulation of semiconductor optical amplifiers. In Proceedings of the 2006 International Topical Meeting on Microwave Photonics, Grenoble, France, 3–6 October 2006; pp. 1–4. [Google Scholar]
- Babić, J.P.; Totović, A.R.; Crnjanski, J.V.; Krstić, M.M.; Mašanović, M.L.; Gvozdić, D.M. Enhancement of the MQW-RSOA’s small-signal modulation bandwidth by inductive peaking. J. Light. Technol. 2019, 37, 1981–1989. [Google Scholar] [CrossRef]
- Rizou, Z.; Zoiros, K.; Houbavlis, T. Operating speed extension of SOA external modulator using microring resonator. In Proceedings of the Progress in Electromagnetics Research Symposium (PIERS), Prague, Czech Republic, 6–9 July 2015; pp. 2399–2402. [Google Scholar]
- Vardakas, J.; Zoiros, K.E. Performance investigation of all-optical clock recovery circuit based on Fabry-Pérot filter and semiconductor optical amplifier assisted Sagnac switch. Opt. Eng. 2007, 46, 085005. [Google Scholar]
- Hui, R.; O’Sullivan, M. Fiber Optic Measurement Techniques; Academic Press: Cambridge, MA, USA, 2009. [Google Scholar]


© 2020 by the authors. Licensee MDPI, Basel, Switzerland. This article is an open access article distributed under the terms and conditions of the Creative Commons Attribution (CC BY) license (http://creativecommons.org/licenses/by/4.0/).
Share and Cite
Rizou, Z.V.; Zoiros, K.E.; Rampone, T.; Sharaiha, A. Reflective Semiconductor Optical Amplifier Direct Modulation Capability Enhancement Using Birefringent Fiber Loop. Appl. Sci. 2020, 10, 5328. https://doi.org/10.3390/app10155328
Rizou ZV, Zoiros KE, Rampone T, Sharaiha A. Reflective Semiconductor Optical Amplifier Direct Modulation Capability Enhancement Using Birefringent Fiber Loop. Applied Sciences. 2020; 10(15):5328. https://doi.org/10.3390/app10155328
Chicago/Turabian StyleRizou, Zoe V., Kyriakos E. Zoiros, Thierry Rampone, and Ammar Sharaiha. 2020. "Reflective Semiconductor Optical Amplifier Direct Modulation Capability Enhancement Using Birefringent Fiber Loop" Applied Sciences 10, no. 15: 5328. https://doi.org/10.3390/app10155328
APA StyleRizou, Z. V., Zoiros, K. E., Rampone, T., & Sharaiha, A. (2020). Reflective Semiconductor Optical Amplifier Direct Modulation Capability Enhancement Using Birefringent Fiber Loop. Applied Sciences, 10(15), 5328. https://doi.org/10.3390/app10155328