Article

Rock Cutting Simulation of Point Attack Picks Using the Smooth Particle Hydrodynamics Technique and the Cumulative Damage Model

1
Department of Energy Systems Engineering, Seoul National University, 1 Gwanak-ro Gwanak-gu, Seoul 08826, Korea
2
Geology Division, Korea Institute of Geoscience and Mineral Resources, Daejeon 34132, Korea
*
Author to whom correspondence should be addressed.
Appl. Sci. 2020, 10(15), 5314; https://doi.org/10.3390/app10155314
Submission received: 3 July 2020 / Revised: 27 July 2020 / Accepted: 30 July 2020 / Published: 31 July 2020
(This article belongs to the Special Issue Advances in Geotechnical Engineering)

Abstract

:
Various numerical methods have been used to simulate the rock cutting process. Numerical simulation is a useful tool for estimating the performance of a cutting tool and for understanding the mechanism of rock cutting and interaction between a cutting tool and the rock. These methods supplement the rock cutting test, which is commonly referred to as the linear cutting machine (LCM) test. Mechanical excavators, such as roadheaders, longwall shearers, and trenchers, generally use pick cutters as the cutting tool. In this study, a rock cutting simulation with a pick cutter was developed using the smooth particle hydrodynamics (SPH) technique, which is a mesh-free Lagrangian method. The Drucker–Prager (DP) strength model was used to simulate the brittle behavior of rock. The cumulative damage (CD) model was used to simulate the degraded fragmentation process of rock and the distinctive behavior of rock in the compression and tensile stress regions. In this study, an attempt was made to simulate sequential cutting by multiple pick cutters. The results showed that the numerical simulation matched the experimental results closely in terms of cutter forces, specific energy, and the fragmentation phenomenon. These results confirmed the applicability of the SPH technique in simulating the rock cutting process.

1. Introduction

The mechanical excavation method has been used in many civil and mining projects. It is becoming increasingly popular due to its numerous advantages over the drill and blasting method in terms of safety, stability, high advance rate, and less environmental impact. The important design parameters of mechanical excavators are the arrangement of cutting tools, thrust, torque, and rotational speed of the cutterhead. These design parameters should be estimated carefully by considering the effect of the cutting conditions (i.e., penetration depth (p), cut spacing (s), and cutting angle) on the cutting force, cutting efficiency, and mechanical stability of a machine [1,2].
The linear cutting machine (LCM) test is well-known as an accurate and reliable method for evaluating the design parameters of mechanical excavators [3,4,5,6,7,8]. The LCM has the advantage that it can apply a realistic range of cutter loads without any scale effect during testing. Although the full-scale LCM test is the most reliable method for determining the design parameters of different machines, it usually requires full-size specimens of rock, which makes the test expensive and time-consuming [9,10,11].
Regarding these limitations, numerical simulation is a useful tool for estimating the cutting performance of a cutting tool and for understanding the rock-cutting mechanisms. A numerical simulation can provide information concerning the fragmentation of a rock, and it can be used to estimate the cutting performance of a cutting tool more quickly and less expensively than the LCM test. In addition, in a numerical simulation, it is possible to efficiently evaluate the effects of the different factors on the cutting performance of different cutting tools (e.g., roller disc and pick cutters).
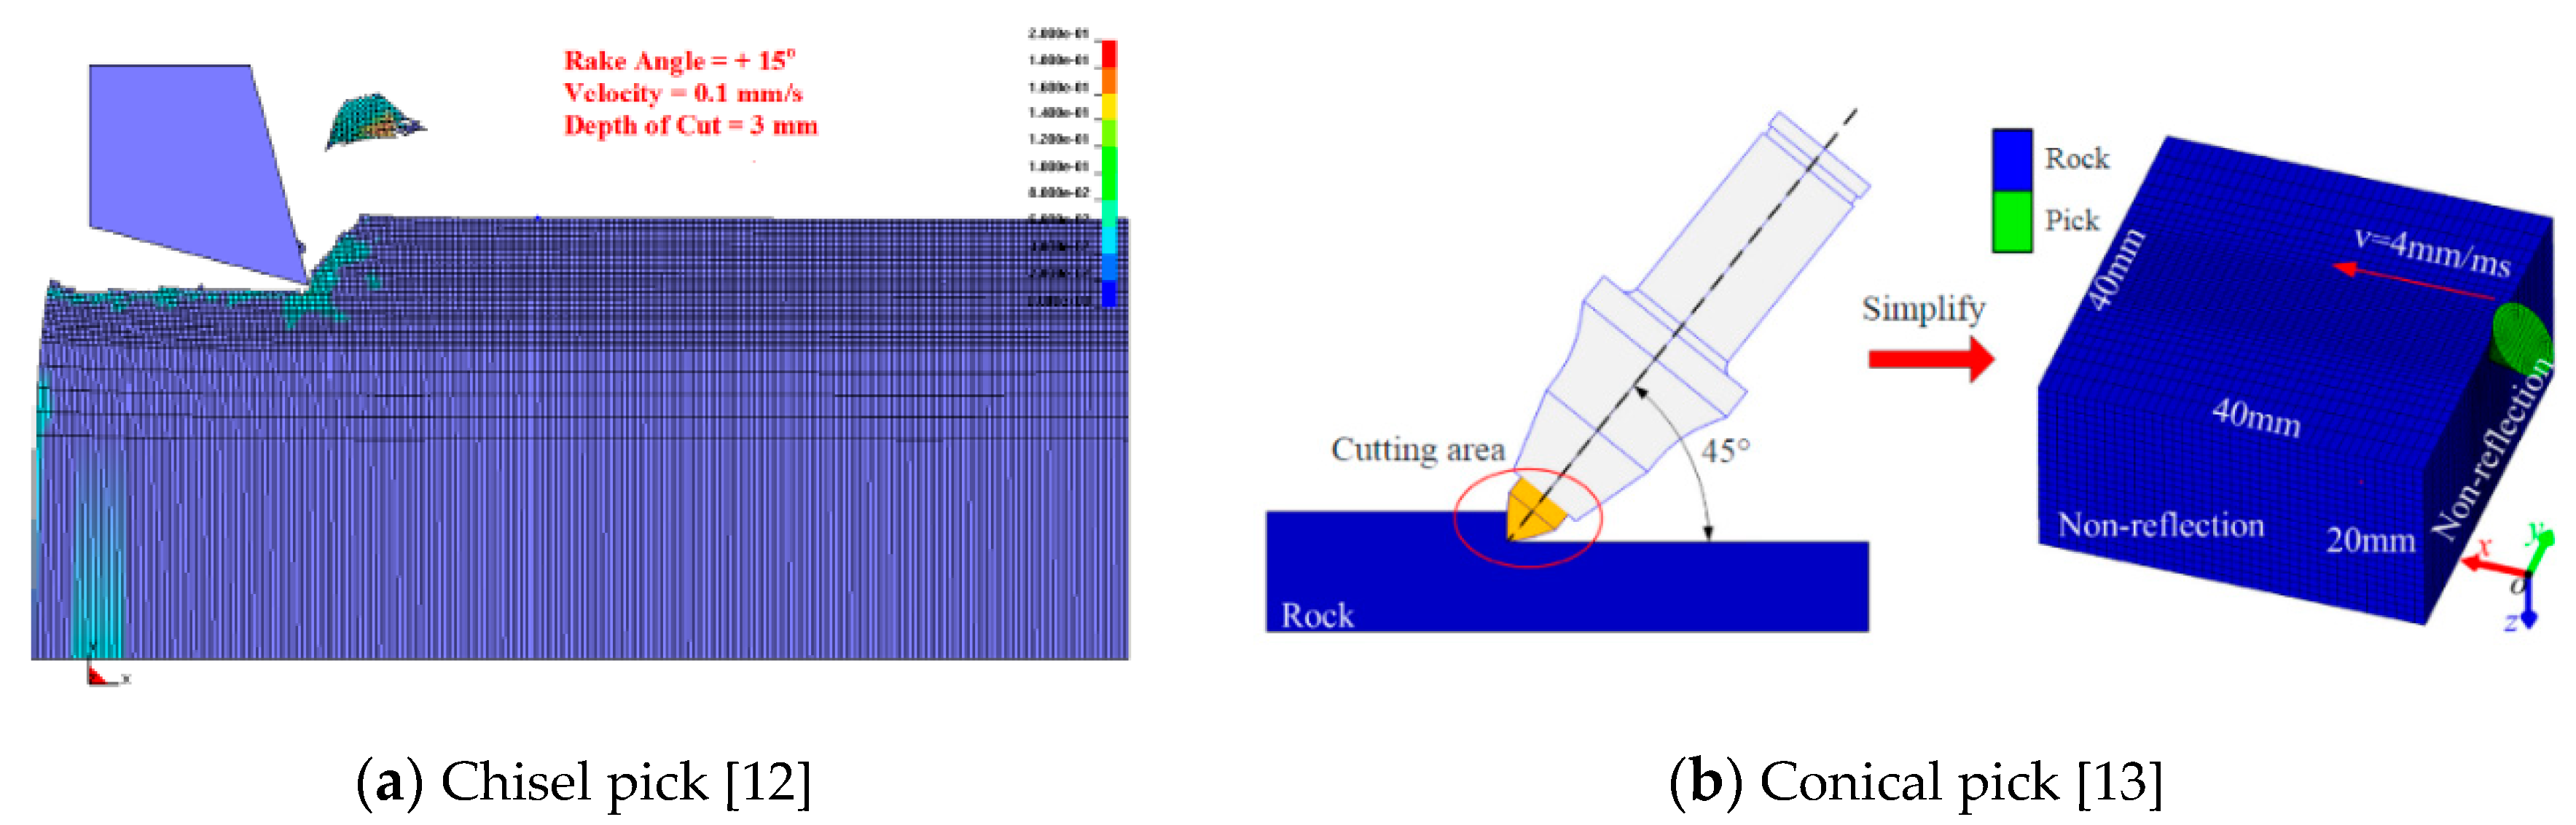
As shown in Figure 1, the finite element method (FEM) is one of the most commonly used methods for solving rock cutting problems [9,12,13]. However, in the FEM, the meshes are distorted significantly by the indentation and penetration processes, and excessive distortion and large deformation of the mesh may cause the simulation to miscarry [14,15]. Erosion (element deletion) and re-meshing techniques have been used to prevent these problems. However, re-meshing is a time-consuming process [15], and the use of the erosion is challenging because it causes losses in the internal energy, strength, and mass of the numerical model [16], which can lead to decreasing the accuracy of the calculations [17,18]. Hence, the erosion option has a significant effect on the results of a numerical simulation. Setting a certain erosion criterion requires calibration with experimental results, because the erosion criterion is not a material property or physics-based phenomenon, and it cannot be calculated quantitatively [17,19]. Therefore, it may be useful to simulate a certain behavior or event with experimental observation, but the value is limited without experimental observation. Despite this weakness, the erosion option is an essential part of the Lagrangian (FEM) analysis.
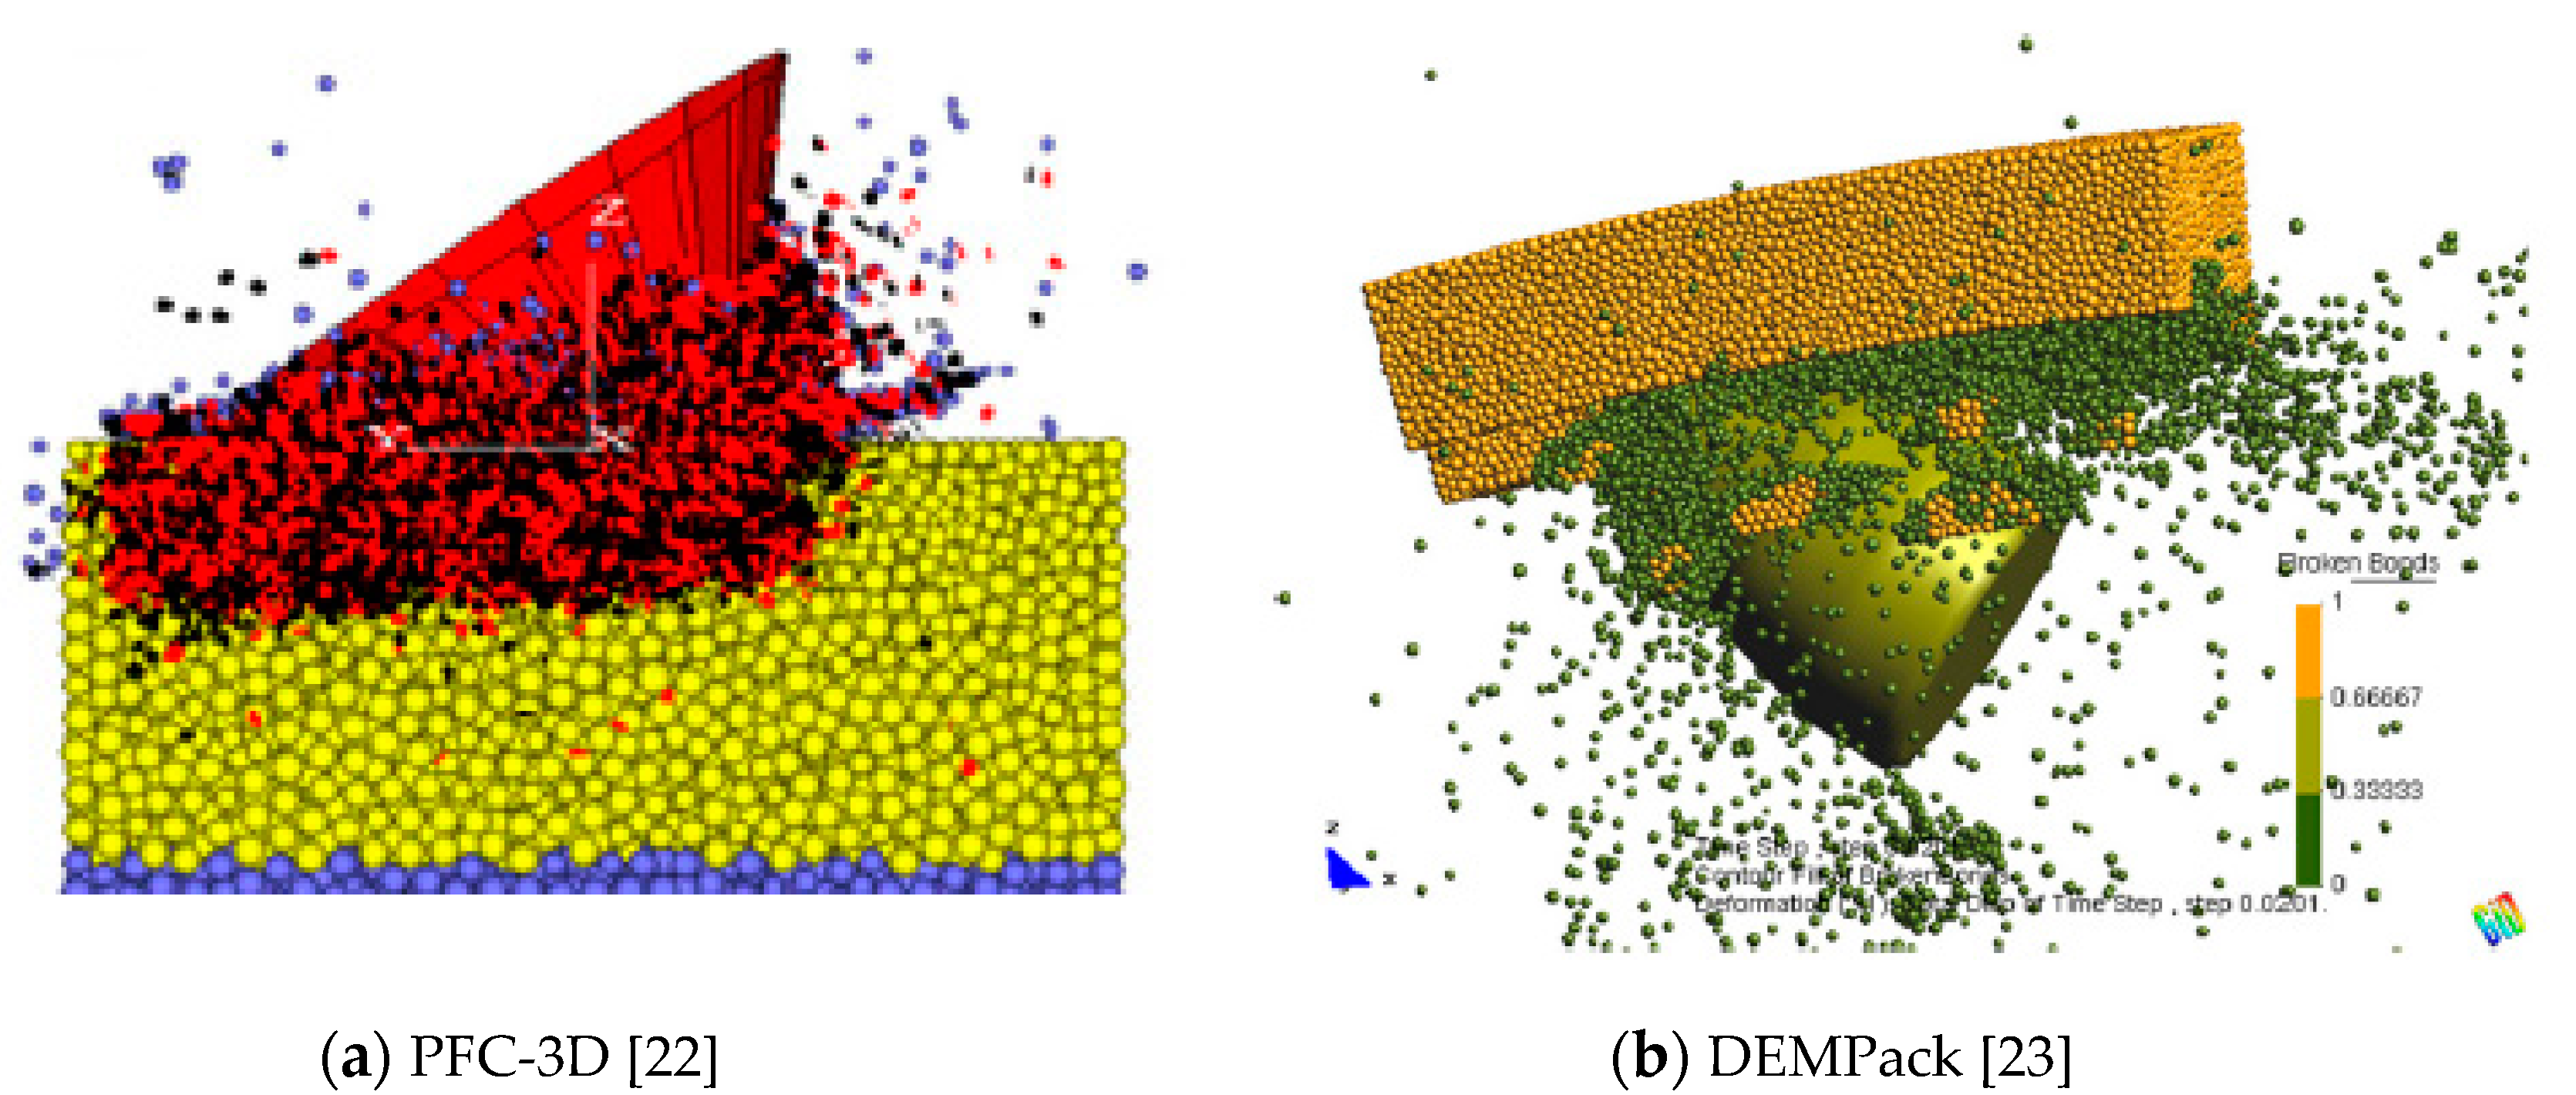
The discrete element method (DEM) provides more realistic simulation results than FEM does for the cracking behavior of rock (Figure 2). However, it is well-known that the DEM usually requires the use of a large number of elements, which leads to long computation time [20]. In addition, in order to determine the mechanical properties of rocks, it is necessary to determine the micro-parameters of the particles through repetitive preliminary analysis. Nevertheless, previous studies have simulated the rock cutting process successfully using the DEM [21,22,23,24,25]. Labra et al. [20] introduced an FEM–DEM coupled numerical model to simulate the rock cutting process with a disc cutter to reduce the computation time of the DEM.
Specific energy (SE) is one of the most important factors in determining the efficiency and optimum condition of a cutting system and in estimating the cutting rate [7]. Specific energy is defined as the energy (work) required to excavate a unit volume or mass of rock, and it is estimated as shown in Equation (1) [26].
S E = F c _ m e a n × l V
where SE is the specific energy (J/m3), Fc_mean is the mean cutting force of a pick cutter (kN), l is the cutting distance (mm), and V is the volume of excavated rock (m3).
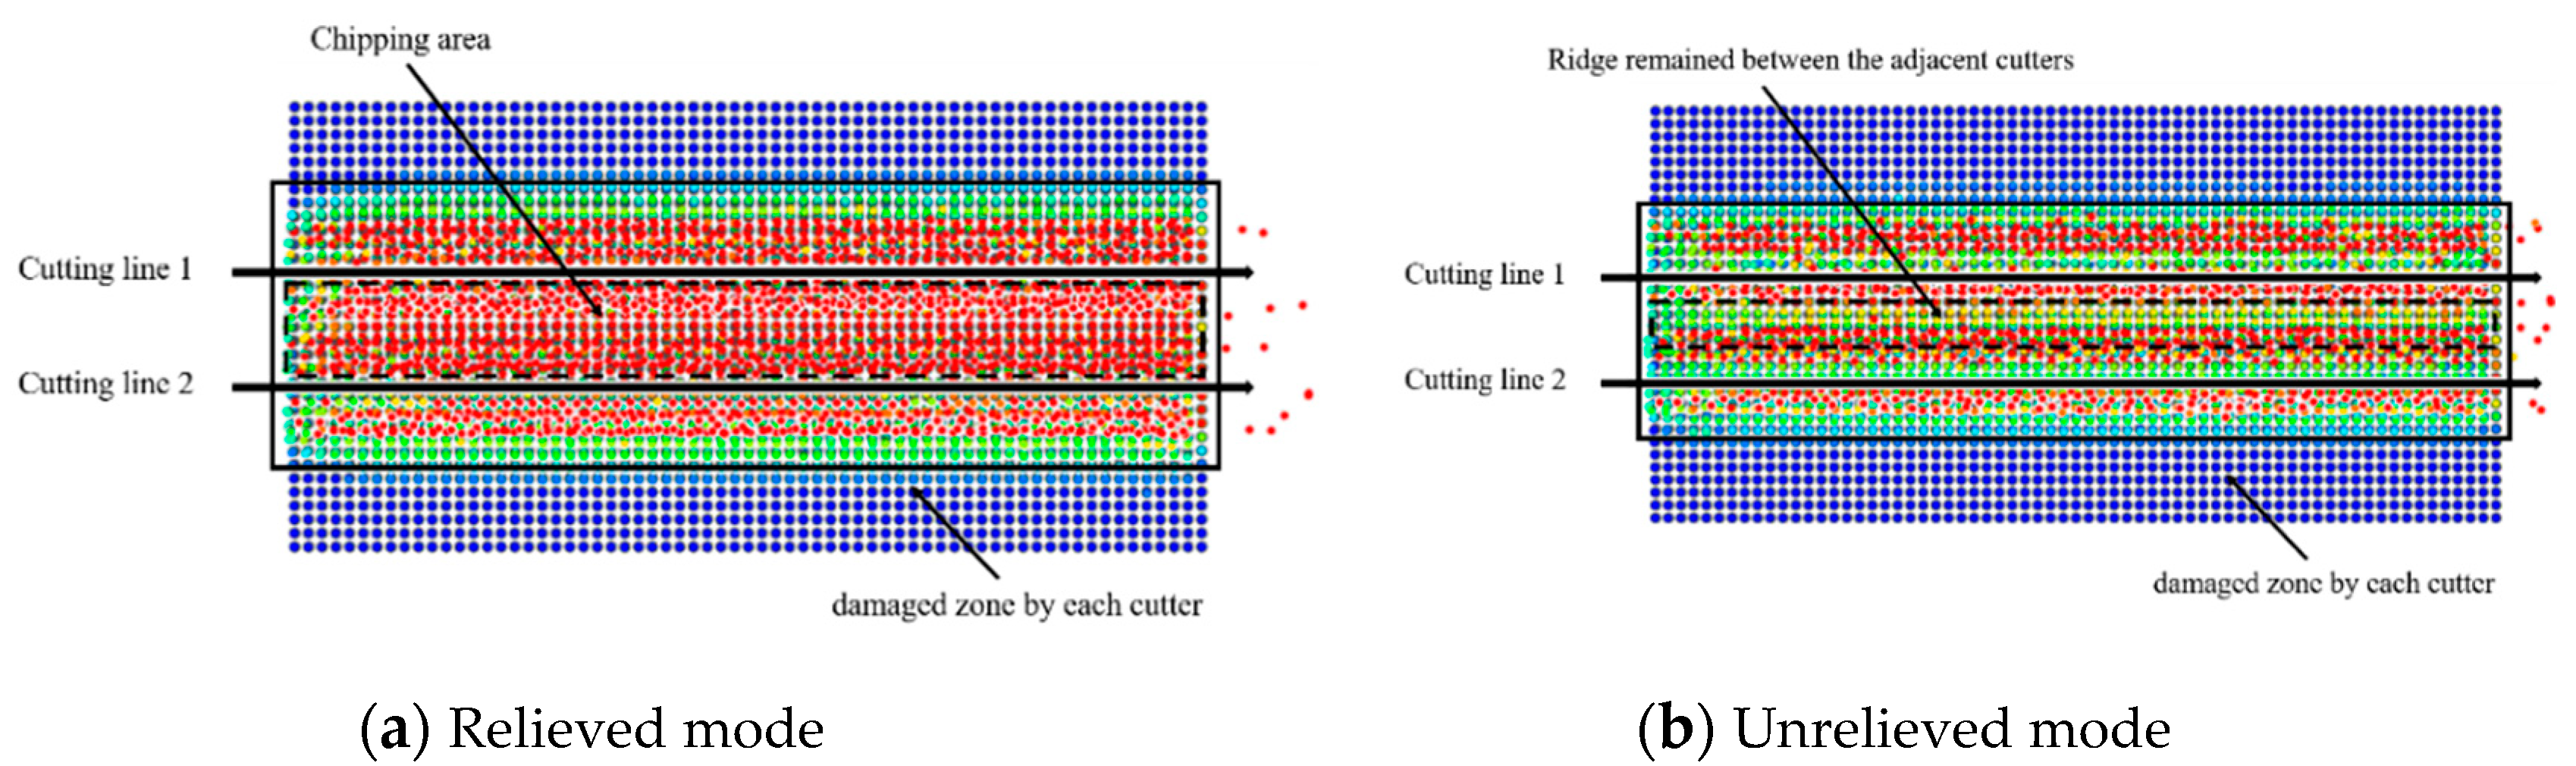
The specific energy is influenced by the cut spacing, and it is minimized at a specific cut spacing. In mechanical rock excavation, the breakage of rock occurs due to the interaction between the adjacent cutters. Figure 3 shows that, if the spacing between adjacent pick cutters is too small, the adjacent pick cutters cannot make significant rock chips. If the spacing between them is too large, they do not make any rock chips. The interaction between adjacent cutters determines whether the cutting mode is relieved or unrelieved. In the relieved cutting mode, the interaction occurs between the cutters, i.e., the cut spacing is small or optimum, whereas in the unrelieved cutting mode, there is no interaction between the cutters, i.e., the cut spacing is large.
It has been shown that the cutting mode or setting a cut spacing significantly affects the cutting forces and specific energy [1,3,7,8,9]. Moreover, it has been shown that the cutting forces and specific energy in unrelieved cutting mode have higher value than those in relieved cutting mode [3,26,27,28]. However, previous numerical studies [12,13,20,21,22,23,24,25] introduced above have been performed for simple 2D analysis or unrelieved cutting mode of a single pick cutter. In these cases, therefore, the cutter forces and specific energy are not adequately evaluated or are overestimated.
As introduced above, the simulation of rock cutting has been improved over time using different numerical methods and material models. These efforts allow us to overcome the limitations of experimental research in rock cutting problems. Although the numerical simulation techniques have been improved, the simulation of rock cutting is still considered to be a difficult task because the mechanisms by which fragmentation occurs and the behaviors of rock during the cutting process are complex. Numerical simulation of actual rock cutting phenomena still require many assumptions, and it is difficult to fully explain the behavior of rocks during the cutting process. Therefore, in numerical simulation of rock cutting, it is important to apply different numerical methods and numerous material models to identify the merits and limitations of each technique. Such numerical studies allow us to substitute the rock cutting tests or reduce the number of the tests that must be used to estimate the design parameters of mechanical excavators.
As parts of these efforts, this study employed the smooth particle hydrodynamics (SPH) method to improve the traditional FEM analysis in rock cutting simulation with a three-dimensional code, i.e., AUTODYN-3D. The SPH method is a gridless (mesh free or meshless) technique for solving computational continuum dynamics problems, and it has several potential advantages over the grid-based Lagrange processor. Specifically, it avoids the problems caused in the traditional FEM by the excessive deformation of the mesh. Despite the many advantages of the SPH technique, its applicability in rock cutting simulation has yet to be evaluated. In this study, the Drucker–Prager (DP) yield model was used to simulate the brittle behavior of rock. In addition, the cumulative damage (CD) model were used to define the failure of material considering distinctive behavior of rock when subjected to compressive and tensile stresses. The three-dimensional geometries of a pick cutter and a rock specimen were modeled by FEM meshes and SPH particles, respectively. The numerical rock cutting tests were performed under different cutting conditions with the proposed numerical model, and the effects of the interactions between adjacent cutters on the fragmentation of the rock were observed. The results (cutting forces, specific energy, and the extent of fragmentation) of the numerical simulations were compared with the LCM test results. This study was first attempt to simulate the sequential cutting process of pick cutters. Also, the applicability of the proposed numerical model was assessed and the options were provided for selecting the appropriate numerical methods and rock modeling techniques to deal with rock cutting problems.

2. Numerical Approaches

2.1. Smooth Particle Hydrodynamics (SPH)

Hydrocode is defined loosely as a code for solving large deformation, finite strain transient problems that occur over a short period of time, and AUTODYN hydrocode is capable of computing strains, stresses, velocities, and the propagation of shock waves as a function of time and position. The software can use both grid-based methods (Lagrange and Euler) and a mesh-free method (SPH) to describe the governing equations.
The SPH technique is an N-body interaction scheme developed by Lucy [29] and Monaghan and Gingold [30]. The method was developed to avoid the limitations associated with the tangling and distortion of mesh that occur when the FEM is applied to problems that involve extremely large deformations. The main difference between the FEM and the SPH method is the absence of a grid [31]. The SPH method is a mesh-free, Lagrangian method in which the medium is divided into a set of discrete elements, which are referred to as particles, and there is no connectivity between adjacent particles. The contribution of each particle to a property at a point of interest is weighted according to the distance of the particle from the point of interest. The particle approximation in the SPH method is defined by Equation (2):
h f ( x ) = f ( y ) · W ( x y ,   h ) d y
where W is the kernel (or smoothing) function. The kernel function is defined using the function by the relation shown in Equation (3):
W ( x ,   h ) = 1 h ( x ) d θ ( x )
where d is the number of space dimensions and h is the so-called smoothing length that varies in time and space. The kernel function should be a centrally peaked function. The most common smoothing kernel function used with the SPH method is the cubic B-spline, which is defined by choosing θ, as in Equation (4).
θ ( u ) = α × { 1 3 2 u 2 + 3 4 u 3 , for   | u | 1 1 4 ( 2 u ) 2 , for   1 | u | 2 0 , for   2 < | u |
where α is a constant of normalization, which depends on the number of spatial dimensions, u = r/h; r is the distance between two particles, and h is the smoothing length (Figure 4).
To calculate the value of a function at particle I in Figure 4, it is necessary to sum the values of the function at all of the neighboring particles (interpolation points J1, J2, I, J3, and J4) multiplied by the weighting function. Hence, the SPH particles are not simply interesting mass points, but they are interpolation points from which the values of functions and their derivatives can be estimated at discrete points in a continuum. In the SPH method, the discrete points at which all of the quantities are evaluated are placed at the center of the SPH particles [16].
Figure 5 shows the calculation cycle of the SPH method, as implemented in AUTODYN. The calculation cycle is similar to that of a Lagrange zone, except for additional steps in which a kernel approximation is used to compute the forces of the spatial derivatives of stress and velocity, which are required to compute strain rates. The SPH method also requires that the particles be sorted at least once every cycle in order to locate a given particle’s current neighboring particles [16].

2.2. Modeling of Rock

Various strength models have been used to simulate the rock cutting process in previous studies. The function of the yield stress of a material was determined by the strength model in AUTODYN. The Drucker–Prager (DP) strength model (Figure 6) is suitable for elasto-plastic materials such as rock [32]. Moreover, the applicability of the DP strength model in rock cutting simulation has been shown in previous studies [6,9,11,33,34,35]. Because it is a linear function, the DP model was converted to the non-linear Stassi-hardening function [36] to describe the brittle behavior that is significantly weaker in tension than in compression during fragmentation of rock cutting [9]. In this study, the yield strength under tensile stress was assumed to be 90% of the Brazilian tensile strength of rock, and yield strength under compressive stress was assumed to be 90% of the uniaxial compressive strengths of rock. Tension cut-off level is determined on the basis of the tensile strength of rock. In Figure 6, on the left hand side of the intersection between the Rankine and Stassi-hardening functions, tensile yielding is dominant; on the right hand side, shear yielding is dominant [9].
The AUTODYN provides several failure models on the basis of the strength and equation of state (EOS) of the material. The damage-based model is used to calculate the damage to a material on the basis of the plastic strain in the plastic strain region (i.e., where the stress level is above the yield stress of the material) according to the defined function. The damage factor is computed on the basis of the plastic strain, and the model reduces the elastic modulus and yield strength on the basis of the damage. The level of damage is also used to define the failure of the material.
Cumulative damage (CD) was proposed by Persson [37] to describe the macroscopic inelastic behavior of materials, such as ceramics and concrete, in which the strength of the material can be degraded significantly by crushing. Therefore, the CD model is also a reasonable model for simulating the rock cutting process because the area between adjacent cutters, where chipping occurs, is damaged by each preceding cutting action.
The CD model computes a damage factor (D) to model the progressive crushing and subsequent weakening of materials. Equation (5) and Figure 7 show that the damage factor is zero for cases of plastic deformation in which the effective plastic strain (EPS) is less than a certain value, i.e., EPS1. When the strain reaches the value of EPS1, the damage factor increases linearly with the strain up to a maximum value of DMAX (<1), which is the value of the effective plastic strain, i.e., EPS2 [16].
D = D M A X ( E P S E P S 1 E P S 2 E P S 1 )
The current value of the damage factor (D) modifies the bulk modulus (K), shear modulus (G), and yield strength (Y) of the material. Y is reduced to Ydam by the damage factor. If the hydrostatic pressure is positive (compressive), the reduced yield strength is defined as in Equation (6):
Y d a m = Y ( 1 D )
If the hydrostatic pressure is negative (tension), the reduced yield strength is defined as in Equation (7), and these reduced functions are presented in Figure 8a. In the same manner as the yield strength, the bulk and shear modulus are also reduced to Kdam and Gdam, respectively, on the basis of the level of damage factor. They are unaffected by compression, but during tension they are progressively reduced to zero when the damage is maximized. Thus, during tension, they are both reduced by the damage factor (Figure 8b). The cutting process of rock involves the combined behavior of compressive and tensile stresses. The characteristics of the materials used in the CD model are suitable for simulating the combined behavior under the stresses in the rock cutting process.
Y d a m = Y ( 1 D D M A X )
Linyi sandstone is from China, and it is considered to be a homogeneous and isotropic material. The mechanical properties of Linyi sandstone are presented in Table 1. Its initial elastic behavior is expressed by an approximation of Hooke’s law [16]. The properties of the rock are represented using a linear EOS. The bulk modulus and shear modulus are calculated on the basis of elasticity, and the reference temperature is set to room temperature, i.e., 20 °C. The input parameters for the DP model are obtained from laboratory tests, and the values for the CD model are validated by trial and error. Table 2 summarizes the input parameters of Linyi sandstone for the CD model.

2.3. Modeling of Pick Cutter

The pick cutter used in this study was the 735 MB manufactured by Vermeer, and Figure 9 shows the schematic and numerical model of the pick cutter. The pick cutter had a 70° tip angle, and the material model of the pick cutter is tungsten carbide, which is usually used for the actual cutting tool. When modeling the pick cutter, excessive small meshes are required to generate the curved tip for the cutter, which reduces the efficiency of the computations. To resolve this problem, the cutter tip was simplified to a linear shape, and the other geometries of the cutter tip (i.e., diameter, length, and tip angle) were set so as to be consistent with those of the actual pick to ensure that there was equivalent contact area between the cutter and the rock model.
The strength of the material is defined by the von Mises function. The model of the pick cutter was assumed not to have any wear, and the failure function was not defined; in actual operating conditions, cutters wear out in the process of rock cutting, but, in both numerical and experimental cases, the pick cutter was only used to cut the rock for a short distance, i.e., 200 mm, as opposed to the much longer period of time in an actual cutting condition.
Equation (8) is the von Mises constitutive model for metal, which is based on large deformation, high strain rate, and high-temperature conditions.
σ = [ A + B × ϵ n ] [ 1 + C × l n ϵ ˙ * ] [ 1 T * m ]
where ϵ is the equivalent plastic strain and ϵ ˙ * = ϵ ˙ / ϵ 0 ˙ is the dimensionless plastic strain. The constants A, B, n, C, and m are the material properties. These properties are provided by the AUTODYN-3D library and are summarized in Table 3.

2.4. Rock Cutting Model

The rock specimen was modeled as a hexahedron, the size of which was 200 mm × 100 mm × 50 mm. The model was built with 3 mm particles, and it consisted of a total of 38,000 particles. On the basis of the results of the preliminary numerical simulation, the height of the rock specimen was set to 50 mm to prevent the cracks in the vertical direction from reaching the bottom of the rock specimen. The bottom surface of the rock model was constrained as a fixed boundary condition to prevent displacement in all directions, and both sides of the rock model were constrained with a roller boundary. The cutters moved linearly in the cutting direction at a constant velocity (10 m/s) boundary condition to simulate the linear rock cutting in the LCM test. It was assumed that the cutting speed did not significantly affect either the cutter forces or the specific energy, as was shown in previous studies [7,38]. The cutting distance was 200 mm for all conditions.
In this study, two cutters moved sequentially to cut the rock model, and the interaction between adjacent pick cutters was observed. The line spacing (distance between the two cutters in the cutting direction) was fixed at 50 mm. The penetration depth ranged from 5 to 11 mm at 2 mm interval. The ratio of cut spacing to penetration depth (s/p ratio) ranged from 1 to 5, and the cut spacing was determined by the predetermined s/p ratio. For all cutting conditions, the attack angle and skew angle of the pick cutter were set to 45° and 0°, respectively. Figure 10 shows the rock cutting model.
AUTODYN automatically calculates and stores the contact forces between the different parts (external contact forces). Therefore, the three directional cutter forces that act on the pick cutter can be obtained by measuring the contact force between the rock model (SPH) and the pick cutter model (Lagrangian) while the pick cutter is cutting the rock model. In this numerical model, the cutting volume was calculated by counting the fragmented particles that reached the maximum damage after the cutting was finished.

3. Results and Discussion

3.1. Rock Fragmentation

In this numerical analysis, the crack propagation and fragmentation behavior of rock were represented by the damage level of each particle. In rock cutting, damage and fragmentation of the rock occur in the area between adjacent cutters and in the area of contact with the cutters. At the point of contact with the pick cutter, the rock fragmentation and stress distribution are affected by the penetration depth, whereas the rock fragmentation pattern between adjacent cutters depend on the cut spacing.
Figure 11 shows the changes in the fragmentation pattern associated with different cut spacings (at the penetration depth of 9 mm). The figures clearly show that the size of the fragmented area was affected by the cut spacing, and the fragmented area became larger as the cut spacing increased for the same penetration depth. The area was maximized at a specific cut spacing. The optimum spacing is defined as the point where the rock can be chipped to the maximum extent for a given penetration depth. The numerical simulations showed that the optimum cut spacings were found to be 20 mm (p = 5 mm), 21 mm (p = 7 mm), 27 mm (p = 9 mm), and 22 mm (p = 11 mm).
Figure 12 shows the damage of rock particle that was accumulated by the interaction of adjacent cutters at the optimum cut spacing (i.e., in the relieved mode). The area between the two cutters, which was damaged by the first cutter, fails when it is damaged again by the second cutter. However, if the cut spacing was larger than the optimum cut spacing (unrelieved mode), the damage was limited to a certain range. Figure 13 shows the difference in the fragmentation pattern of the two cutting modes. Although the rock between adjacent cutters was cut completely by the interaction of the cutters in the relieved mode, a ridge remained between the adjacent cutters at the optimum cut spacing in the unrelieved mode, which means that the interaction between the cutters was inefficient to cut all of the rock particles between the adjacent cutters.
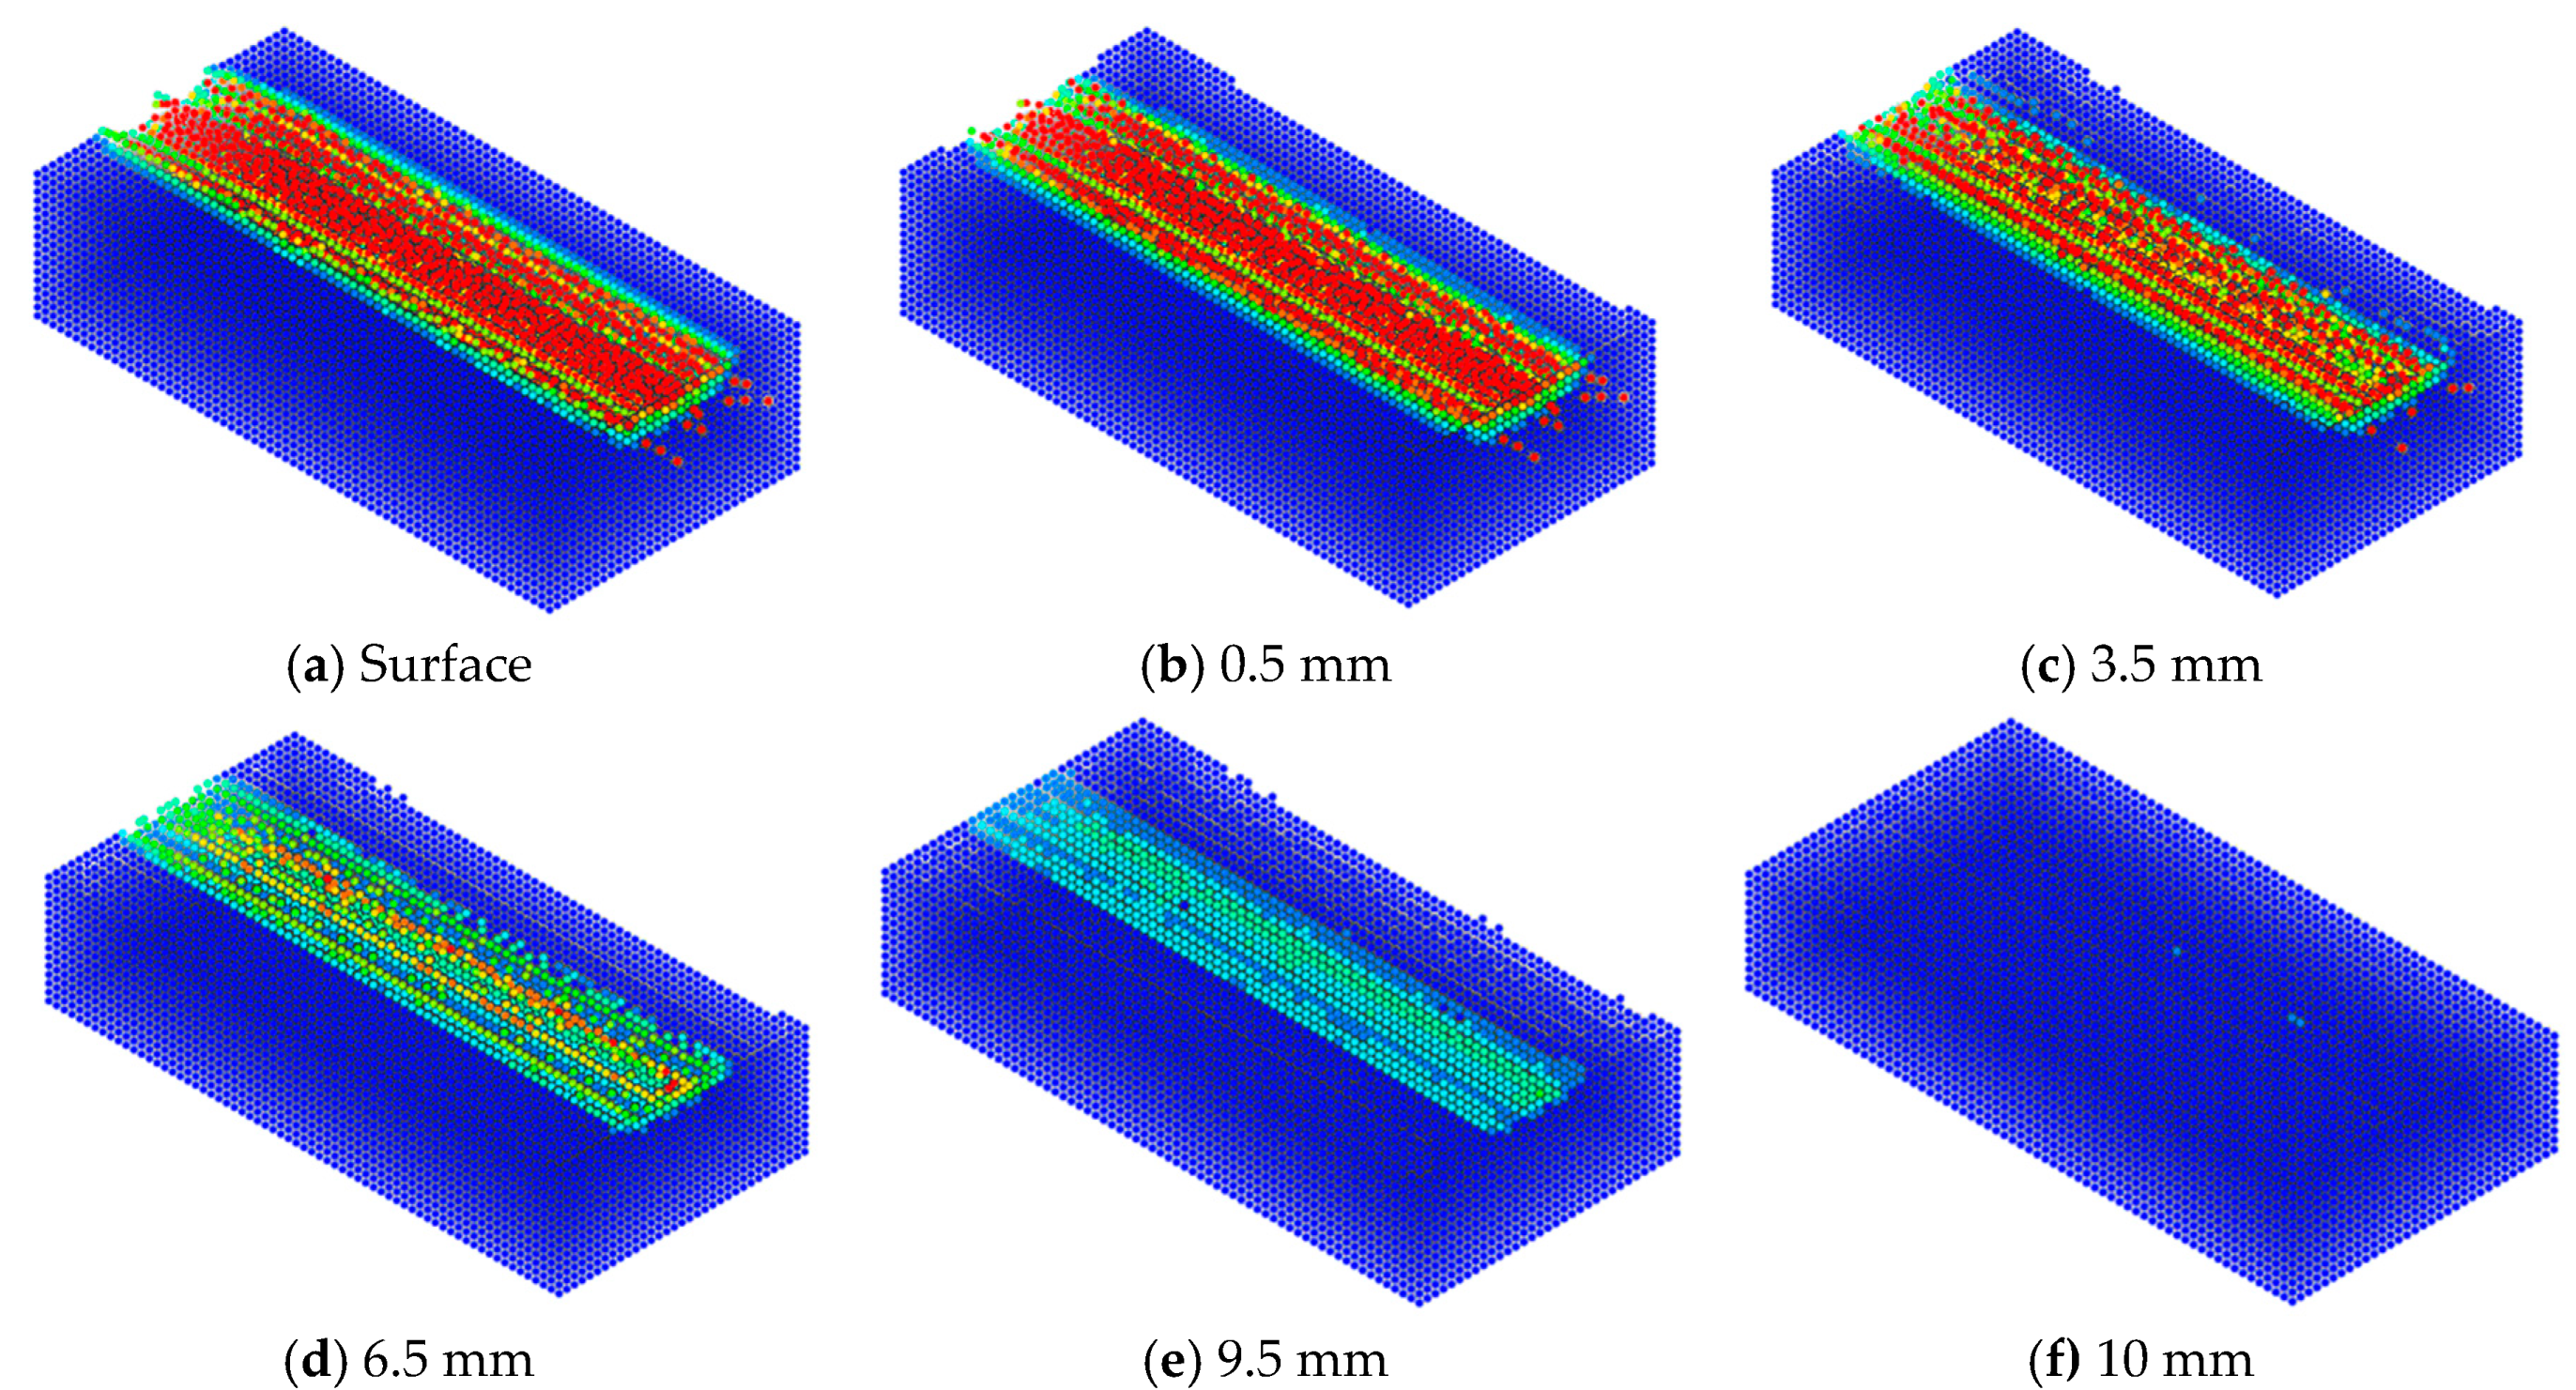
Figure 14 shows the contour of damage of the cut surface for the rock model at different heights (p = 5 mm and s = 20 mm). The term “height” refers to the distance from the surface of a rock model. The crack in the vertical direction propagated up to 10 mm from the surface (as represented by the range of the damaged particles) when the pick cutter penetrated 5 mm. The cracks ranged from 10 mm to 24 mm with changes in penetration depth. Geng et al. [11] noted that the FEM numerical models might need improvements in terms of the reality and accuracy; in the traditional FEM simulations, the rocks beneath the cutter tip usually cut off excessively in the vertical direction, while the chipping of the rocks between the cut spacing is usually less than real situation. This may be because that the plastic hardening and failure in different parts of the rock specimen are usually considered the same by assigning one function of the equivalent stress versus plastic strain for elastic–plastic mechanics of continuous materials. In this study, as described in Figure 8, the rock was modelled to behave according to different functions under compression (beneath the cutter tip) and tensile (chipping between adjacent cut lines) stresses. The results of rock fragmentation in numerical simulation indicated that the different behavior of the rock under compression and tensile stress was adequately simulated. It is noteworthy that the extent of cracking might depend on the both penetration depth of the pick cutter and the particle size of the rock model.

3.2. Cutter Force

The aim of this study was to compare the results of numerical simulations with the LCM test results obtained in a previous study [8]. Figure 15 shows the representative cutter forces obtained from the numerical simulation. The results show that the cutter forces obtained from the first cut were remarkably larger than those from the second cut. The first cut was made under a perfectly constrained condition, which is referred to as the unrelieved cutting mode, but the second cut was done under the relieved cutting mode. The results of cutter forces in numerical simulations were consistent with those from the previous studies [3,26,27,28]; the cutting forces for the unrelieved cutting mode had higher values than those of the relieved cutting mode. Thus, the results indicated that the interaction between the adjacent cutters was well simulated by the numerical simulation. Therefore, in this study, the cutter forces obtained from the second cutting line were used for the analysis. This approach was also used in the experimental cutting tests. In the LCM test, the first cutting line represents the unrelieved cutting mode without any interaction between the adjacent cutting lines [28]. Thus, it is reasonable to exclude the cutter forces obtained from the first cutting line from further analysis. Table 4 summarizes the cutter forces determined by the numerical simulations of different penetration depths and cut spacings. The forces obtained during the cutting tests were averaged to give the mean cutter forces (Fc_mean, Fn_mean, and Fs_mean). Among the three orthogonal force components, the side force acts in a direction orthogonal to the cutting force on the same plane, and it affected the balancing of the pick. In contrast to the normal and cutting force components, the magnitude of side force did not differ significantly for the unrelieved and the relieved cutting modes. Because the effect of the side force on the cutting performance of the pick was not significant when the skew angle was set to 0°, the side force was not analyzed in the later part.
Geng et al. [11] noted that the numerical forces are usually much lower than those of the experimental forces. They stated that this may be because that the crushing and grinding process between the cutter tip and rock is usually ignored in traditional FEM simulations. After the rock elements beneath the cutter tip are eliminated by the erosion, there are no contacts between the cutter tip and rock, which will result in zero values of the cutter forces [9,11]. However, the crushed zone beneath the cutter tip plays an important role in transforming cutter forces to the side directions for chipping in real conditions. Even though the rocks beneath the cutter tip are crushed, they can still bear cutter loads in a condensed state. However, in this study, the cutter forces in numerical simulations resulted in fluctuations based on a certain value rather than zero. As described Figure 8, under compressive stress, the rock particle remains with a certain level of residual strength rather than being deleted as in traditional FEM, even if it reaches the maximum damage. This characteristic of CD failure function is thought to have contributed to the results of realistic cutter forces. Regarding the described characteristics, the proposed numerical model shows an improvement on the traditional FEM models in terms of simulating realistic behavior of rock in cutting process and providing quantitative results in cutter forces.
Figure 16 shows that the results of the cutter forces estimated by LCM with the numerical simulations for all of the cutting conditions considered in this study. Similar to the results obtained from the LCM test, the numerical analysis identified the tendency of the cutting and normal forces to increase with both penetration depth and cut spacing. On average, the relative errors of the cutting force and normal force between the LCM test and numerical simulations were 25.7% (5.6–69.0%) and 15.5% (2.3–33.8%), respectively. The relative error (ε) is calculated by Equation (9).
ε   ( % ) = | F n u m F L C M | F L C M × 100
where ε is the relative error and Fnum and FLCM are the cutter forces obtained from the numerical simulation and LCM test, respectively.
The relative errors in the cutter forces differed with the penetration depth. At 5 mm, the numerical simulation slightly underestimated both the cutting force and the normal force compared with the LCM test. The relative errors in the cutting force and normal force between the LCM and numerical simulation were 13.5% (7.5–21.5%) and 21.3% (16.7–31.1%). As the penetration depth increased to 7 mm, the numerical simulation slightly overestimated the cutting force and underestimated the normal force compared with the LCM test. The relative errors of the cutting force and normal force between the LCM test and numerical simulation were 15.7% (5.6–36.0%) and 20.0% (5.7–33.8%), respectively. At 9 mm, the numerical simulation overestimated the cutting force of a pick cutter. The maximum relative error of the cutting force was 76.4% when the cut spacing was 9 mm. The relative errors of the cutting force and normal force between the LCM test and numerical simulation were 38.9% (16.4–76.4%) and 11.7% (4.5–27.5%). At 11 mm, the numerical simulation significantly overestimated the cutting force at cut spacings of 11 mm and 22 mm. The relative errors at these cut spacings were 69.0% and 54.3%, respectively. However, the normal force of the numerical simulation showed good agreement with the LCM test results for all cut spacings.
Overall, the results showed that the numerical simulation, compared with the LCM test, overestimated the cutting force and underestimated the normal force. It was presumed that this occurred because of the geometric shape of the cutter model. As shown in Figure 9, the shape of the modeled pick cutter was simplified in the modeling process. The contact surface between the pick and the rock was affected by the geometries of the pick. Moreover, the particle size in the current SPH model also may have contributed to the differences in the experimental results because the cutter forces were affected significantly by the area of contact between the rock and the cutter.
On the other hand, it was well established that the cutter forces increased with the penetration depth and cut spacing. As mentioned earlier, the numerical results clearly showed that the effect of the cutting conditions (i.e., penetration depth and cut spacing) on the cutter forces coincided with the experimental results. It indicated that the interaction between the pick cutters and the rock was properly simulated in the numerical simulation. On the basis of the results, the proposed numerical model could provide useful information to understand and evaluate the effects of additional cutting conditions (i.e., skew, attack, and tilt angles), geometries of cutting tools, and mechanical rock properties on the cutting performance of the cutting tools.

3.3. Specific Energy

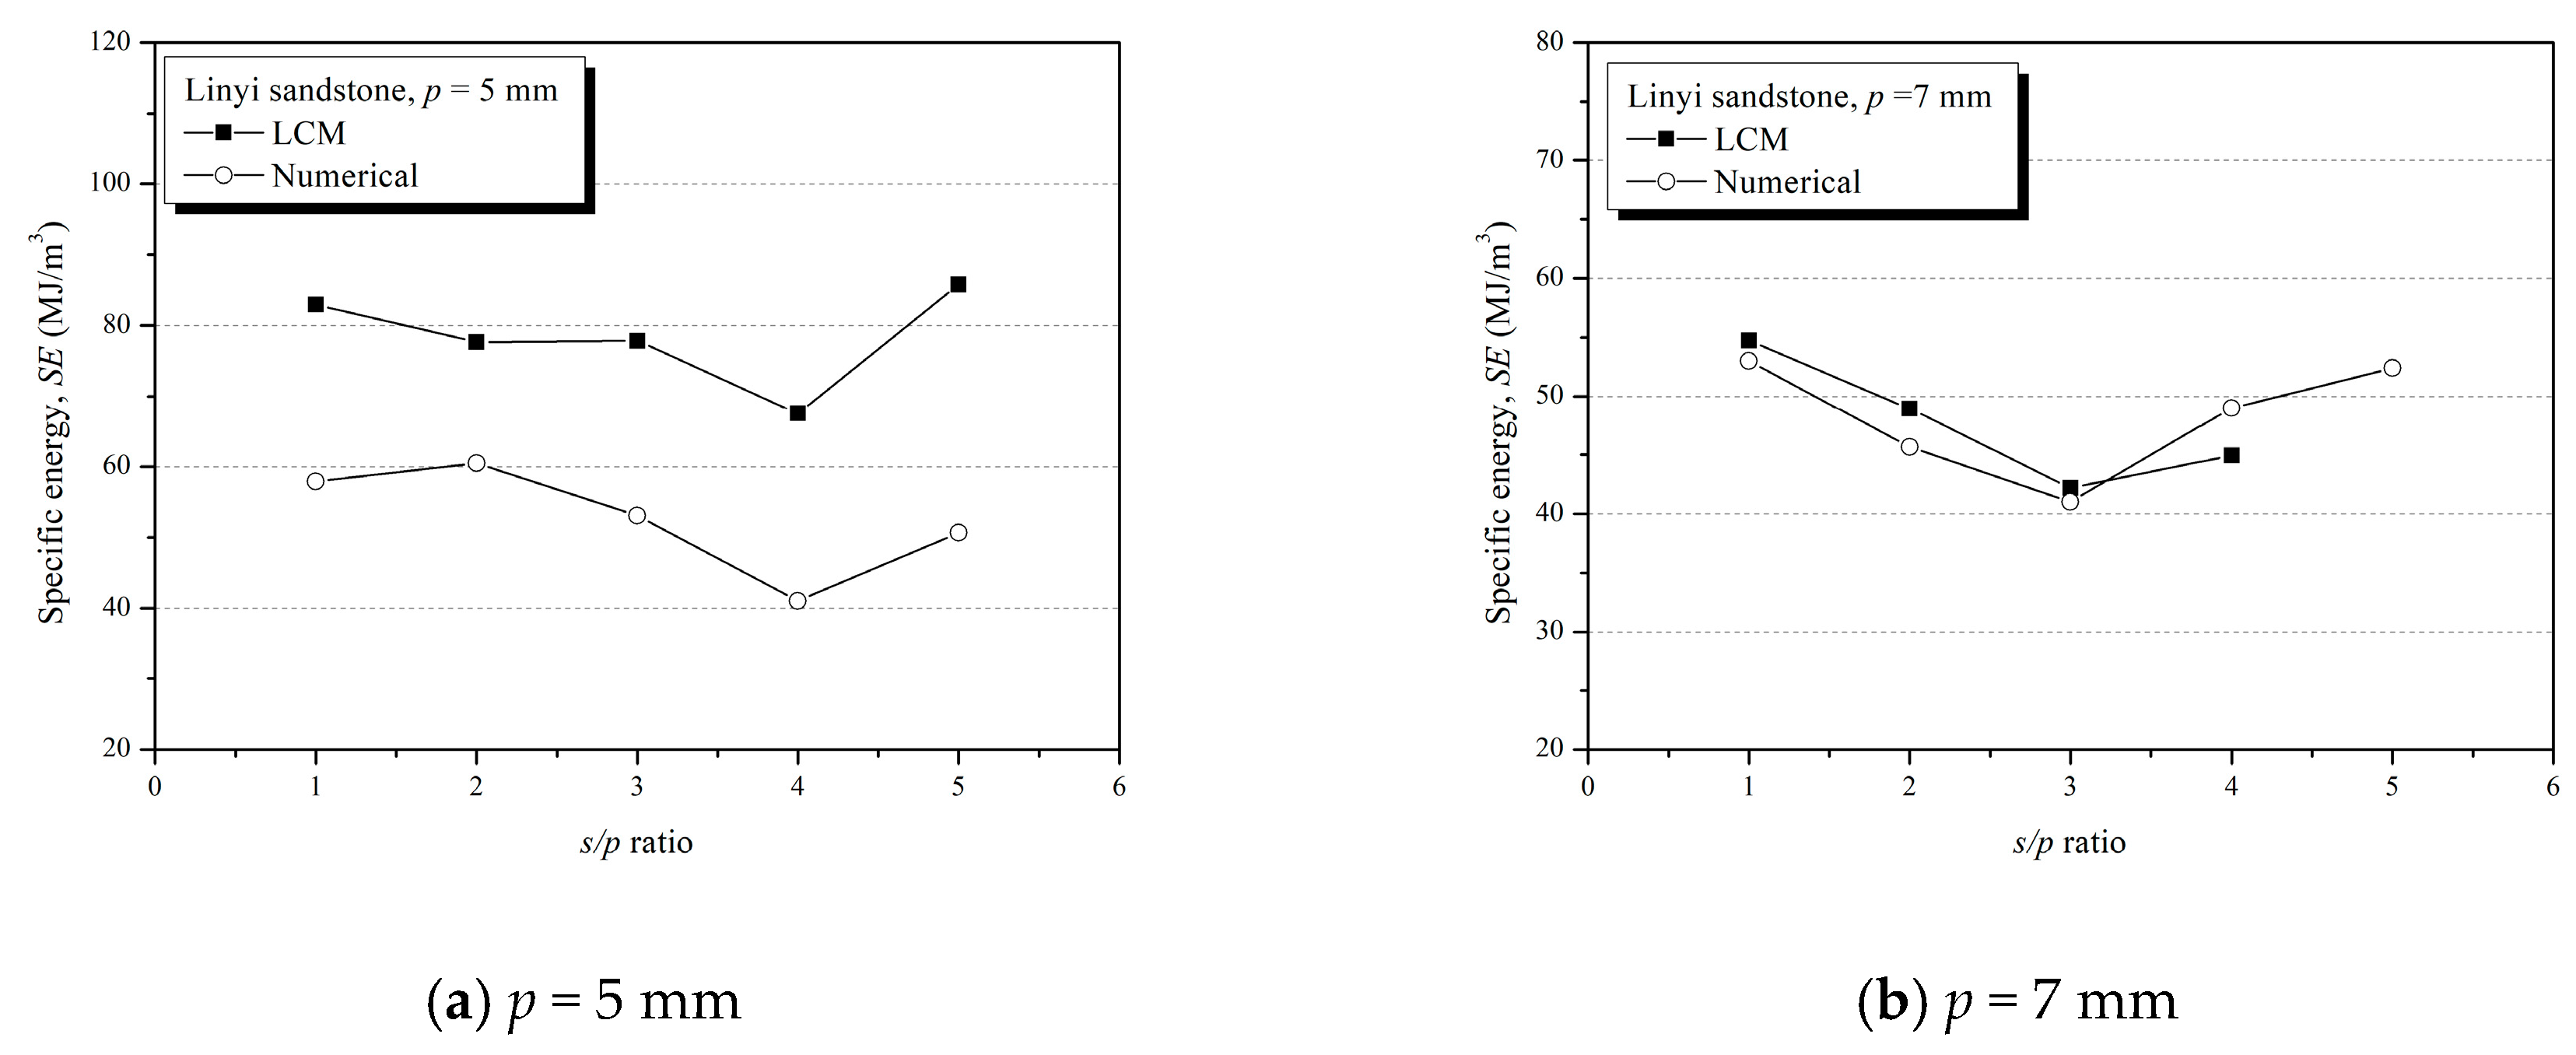
This study also aimed to compare the SE from the numerical simulation with that from the LCM test. As mentioned previously, the SE is a representative index of cutting efficiency. As described in Equation (1), it is calculated by the cutting force and cut volume of the rock during the rock cutting process. Therefore, the result of specific energy is important for assessing the applicability of the numerical simulation. For comparison, Table 5 summarizes the results of the numerical simulations and the LCM tests.
Figure 17 compares the specific energy values that were obtained from the LCM test and the numerical simulations for all cutting conditions. The results showed that the optimum cut spacings at each penetration depth were 20, 21, 28, and 22 mm, respectively. The optimum cut spacings obtained from the numerical simulations were consistent with the experimental values. However, at 11 mm, the optimum cut spacing in the numerical simulation was 22 mm, whereas the optimum cut spacing was 33 mm is in the LCM test. As shown in Figure 17, in the LCM test, the optimum cut spacing was 33 mm if the optimum cut spacing was defined as the minimum point of specific energy. However, in the LCM test, because the specific energy tended to converge after the cut spacing exceeded 22 mm, the minimum point was not clear. Despite the lack of observations, the difference in specific energy between cut spacings of 22 mm and 33 mm was not significant. Therefore, the optimum cut spacing obtained from the numerical simulation was considered to be reasonable.
Overall, the optimum cut spacings of the numerical simulations were generally consistent with the experimental values. However, in quantitative comparisons, the specific energy of the numerical analysis was somewhat different from that of the experimental results. Compared to the LCM test results, the numerical simulations underestimated the specific energy at a penetration depth of 5 mm, and overestimated the specific energy at penetration depths of 9 mm and 11 mm. In contrast, at a penetration depth of 7 mm, the specific energy of the numerical analysis was in good agreement with those of the LCM test. The difference in the specific energy was due to the difference in the cutting force. Table 4 shows that the differences between the LCM test and numerical results for specific energy were similar to the differences in the cutting force, indicating that, in spite of the fact that the numerical simulation had an error in estimating the cutter forces, it accurately identified the fragmentation patterns and the cut volume of the rock. In addition, although they produced different values of specific energy, the numerical simulation and the LCM test showed the same trend in the changes in specific energy for all of the cutting conditions.
In the numerical simulation, the behavior of rock depended on the predetermined EOS, constitutive equation, conservation law, and failure and yield functions. It was fundamentally impossible to explain the complicated and complex behavior of rock during the cutting and chipping process with a single equation. Moreover, in the numerical simulation, the rock model consisted of particles of a certain size, and the size affected both the energy required to cut the certain volume of the rock and the failure pattern of rock. The numerical simulation of rock chipping involved breaking all of the particles between adjacent pick cutters, however, in a real cutting process, only the cutting energy is required to propagate cracks in the local region to cut the rock; rock chips are generated by the connection of the cracks made by adjacent cutters. Thus, the cutting energy required in the numerical simulations is fundamentally different from that required for the chipping process in actual rock cutting.
Moreover, the differences in test settings between the LCM test and numerical simulation might affect the results. In the LCM test, the sides of rock specimen are usually restrained mechanically to prevent the splitting failure of the specimen, while the rock model in numerical simulation is perfectly fixed by means of boundary conditions without the confining stress. The confining pressure might affect the fragmentation patterns during rock cutting, as well as corresponding cutter forces and cutting efficiency [39,40,41]. The stiffness of the LCM may affect the testing results. The previous study [9] reported that movement and vibration of the cutting tool is caused by the finite stiffness of the LCM frame, and the lack of stiffness caused excessive brittle failure of the specimen due to a burst of strain energy accumulated in the frame and subsequent failure by vibration of the cutting tool. Numerical simulation cannot consider the effects because it did not allow displacement of the pick rock cutting. The position and movement of the pick are perfectly controlled by means of boundary conditions.

4. Conclusions

The rock cutting process of a point attack pick was simulated numerically using AUTODYN-3D, and the cutting efficiency was evaluated for several cutting conditions using a proposed numerical model. To overcome the limitations of the traditional (grid-based) FEM in the simulation of rock cutting, the applicability of the SPH technique was evaluated, and a numerical model was proposed to simulate the rock cutting process of pick cutters. The CD failure model was used to simulate progressive degradation. The employment of SPH and CD failure models overcame the limitations of traditional FEM numerical simulations and simulated the realistic rock cutting process successfully.
The results showed that the rock fragmentation processes in both unrelieved and relieved cutting modes were simulated successfully by the numerical model. Changes in rock fragmentation patterns were clearly observed with different cut spacing. This indicated that the interaction between the adjacent picks was properly simulated in the numerical model. It also was supported by the results of changes in the cutter forces and specific energy according to the cut spacing and penetration depth. Thus, the optimum cutting conditions could be clearly found by the numerical simulation on the basis of the comparison with the LCM test.
In addition, the numerical results clearly showed that there was a significant difference in the cutter forces between the relieved cutting and unrelieved cutting modes. The cutter forces of unrelieved cutting were significantly larger than those of the relieved cutting mode in numerical simulations. The results showed that the cutting conditions (i.e., cut spacing and penetration depth) affected the cutter forces. This indicated that the changes in the cutter force owing to the interaction between the adjacent picks was properly simulated in the numerical simulation.
It is very difficult to conclude that certain numerical methods and material constitutive models are the best to simulate the rock cutting process. Therefore, it is important to apply various numerical methods and material models for identifying the merits and limitations of each technique for specific rock cutting problems. The efforts involved in numerical studies allow us to substitute the rock cutting tests or reduce the number of tests required to design mechanical excavators. Overall, the results showed that numerical simulation can provide useful information for evaluating the effects of the influencing parameters on the cutting efficiency and cutting performance of cutting tools. Therefore, the numerical model can be used to investigate the effect of the influencing parameters (i.e., the mechanical properties of rock, skew and attack angles, as well as the geometries of cutting tools) on cutting performance and cutting efficiency. Moreover, it can provide useful information for better understanding of the rock-cutting mechanics.

Author Contributions

Methodology, H.J.; formal analysis, S.C.; investigation, H.Y.; visualization, S.L.; writing—original draft preparation, H.J.; writing—review and editing, S.J. All authors have read and agreed to the published version of the manuscript.

Funding

This study was funded by the Korea Agency for Infrastructure Technology Advancement under the Ministry of Land, Infrastructure and Transport in South Korea (Project No.: 20CTAP-C152888-02).

Acknowledgments

This study was funded by the Korea Agency for Infrastructure Technology Advancement under the Ministry of Land, Infrastructure and Transport in South Korea (Project No.: 20CTAP-C152888-02). The Institute of Engineering Research at Seoul National University (SNU) provided research facilities for this work.

Conflicts of Interest

The authors declare no conflict of interest.

List of Symbols and Acronyms

WKernel function
pPenetration depth
sCut spacing
Fc_meanMean cutting force
Fn_meanMean normal force
Fs_meanMean side force
SESpecific energy
dNumber of space dimension
hSmoothing length
rDistance between two SPH particles
α Normalized constant in d dimensional space
DDamage factor
DMAXMaximum damage factor
YYield strength
KBulk modulus
GShear modulus
EOSEquation of state
ϵEquivalent plastic strain
A, B, n, CConstants for von Mises model
EPSEffective plastic strain

References

  1. Park, J.Y.; Kang, H.; Lee, J.W.; Kim, J.H.; Oh, J.Y.; Cho, J.W.; Rostami, J.; Kim, H.D. A study on rock cutting efficiency and structural stability of a point attack pick cutter by lab-scale linear cutting machine testing and finite element analysis. Int. J. Rock Mech. Min. Sci. 2018, 103, 215–229. [Google Scholar] [CrossRef]
  2. Jeong, H.Y.; Choi, S.B.; Jeon, S.W. Effect of skew angle on the cutting performance and cutting stability of point-attack type picks. Tunn. Undergr. Sp. Technol. 2020, 103, 103507. [Google Scholar] [CrossRef]
  3. Bilgin, N.; Demircin, M.A.; Copur, H.; Balci, C.; Tuncdemir, H.; Akcin, N. Dominant rock properties affecting the performance of conical picks and the comparison of some experimental and theoretical results. Int. J. Rock Mech. Min. Sci. 2006, 43, 139–156. [Google Scholar] [CrossRef]
  4. Chang, S.H.; Choi, S.W.; Bae, G.J.; Jeon, S. Performance prediction of TBM disc cutting on granitic rock by the linear cutting test. Tunn. Undergr. Sp. Technol. 2006, 21, 271. [Google Scholar] [CrossRef]
  5. Gertsch, R.; Gertsch, L.; Rostami, J. Disc cutting tests in Colorado Red Granite: Implications for TBM performance prediction. Int. J. Rock Mech. Min. Sci. 2007, 44, 238–246. [Google Scholar] [CrossRef]
  6. Cho, J.W.; Jeon, S.; Jeong, H.Y.; Chang, S.H. Evaluation of cutting efficiency during TBM disc cutter excavation within a Korean granitic rock using linear-cutting-machine testing and photogrammetric measurement. Tunn. Undergr. Sp. Technol. 2013, 35, 37–54. [Google Scholar] [CrossRef]
  7. Copur, H.; Bilgin, N.; Balci, C.; Tumac, D.; Avunduk, E. Effects of Different Cutting Patterns and Experimental Conditions on the Performance of a Conical Drag Tool. Rock Mech. Rock Eng. 2017, 50, 1585–1609. [Google Scholar] [CrossRef]
  8. Jeong, H.; Jeon, S. Characteristic of size distribution of rock chip produced by rock cutting with a pick cutter. Geomech. Eng. 2018, 15, 811–822. [Google Scholar] [CrossRef]
  9. Cho, J.W.; Jeon, S.; Yu, S.H.; Chang, S.H. Optimum spacing of TBM disc cutters: A numerical simulation using the three-dimensional dynamic fracturing method. Tunn. Undergr. Sp. Technol. 2010, 25, 230–244. [Google Scholar] [CrossRef]
  10. Jeong, H.-Y.; Cho, J.-W.; Jeon, S.; Rostami, J. Performance assessment of hard rock TBM and rock boreability using punch penetration test. Rock Mech. Rock Eng. 2016, 49, 1517–1532. [Google Scholar] [CrossRef]
  11. Geng, Q.; Wei, Z.; Ren, J. New rock material definition strategy for FEM simulation of the rock cutting process by TBM disc cutters. Tunn. Undergr. Sp. Technol. 2017, 65, 179–186. [Google Scholar] [CrossRef]
  12. Menezes, P.L.; Lovell, M.R.; Avdeev, I.V.; Higgs, C.F. Studies on the formation of discontinuous rock fragments during cutting operation. Int. J. Rock Mech. Min. Sci. 2014, 71, 131–142. [Google Scholar] [CrossRef] [Green Version]
  13. Li, H.S.; Liu, S.Y.; Xu, P.P. Numerical simulation on interaction stress analysis of rock with conical picks. Tunn. Undergr. Sp. Technol. 2019, 85, 231–242. [Google Scholar] [CrossRef]
  14. Vignjevic, R.; Hughes, K.; Walker, A.; Taylor, E.A. Overcoming Element Erosion Limitations Within Lagrangian Finite Element Codes. In Proceedings of the European Space Agency, (Special Publication) ESA SP, Darmstadt, Germany, 19–21 March 2001. [Google Scholar]
  15. Madaj, M.; Píška, M. On the SPH orthogonal cutting simulation of A2024-T351 alloy. Procedia CIRP 2013, 8, 152–157. [Google Scholar] [CrossRef] [Green Version]
  16. Autodyn, A. Theory Manual Revision 4.3; Century Dynamics: Concord, CA, USA, 2005. [Google Scholar]
  17. Luccioni, B.; Aráoz, G. Erosion Criteria for Frictional Materials Under Blast Load. Mec. Comput. 2011, 30, 1809–1831. [Google Scholar]
  18. Luccioni, B.M.; Aráoz, G.F.; Labanda, N.A. Defining erosion limit for concrete. Int. J. Prot. Struct. 2013, 4, 315–340. [Google Scholar] [CrossRef]
  19. Kala, J.; Hušek, M. Improved Element Erosion Function for Concrete-Like Materials with the SPH Method. Shock Vib. 2016, 2016, 4593749. [Google Scholar] [CrossRef]
  20. Labra, C.; Rojek, J.; Oñate, E. Discrete/Finite Element Modelling of Rock Cutting with a TBM Disc Cutter. Rock Mech. Rock Eng. 2017, 50, 621–638. [Google Scholar] [CrossRef] [Green Version]
  21. Stavropoulou, M. Modeling of small-diameter rotary drilling tests on marbles. Int. J. Rock Mech. Min. Sci. 2006, 43, 1034–1051. [Google Scholar] [CrossRef]
  22. Su, O.; Ali Akcin, N. Numerical simulation of rock cutting using the discrete element method. Int. J. Rock Mech. Min. Sci. 2011, 48, 434–442. [Google Scholar] [CrossRef]
  23. Rojek, J.; Oñate, E.; Labra, C.; Kargl, H. Discrete element simulation of rock cutting. Int. J. Rock Mech. Min. Sci. 2011, 48, 996–1010. [Google Scholar] [CrossRef]
  24. Huang, H.; Lecampion, B.; Detournay, E. Discrete element modeling of tool-rock interaction I: Rock cutting. Int. J. Numer. Anal. Methods Geomech. 2013, 37, 1913–1929. [Google Scholar] [CrossRef]
  25. Liu, J.; Ma, C.; Zeng, Q.; Gao, K. Discrete Element Simulation of Conical Pick’s Coal Cutting Process under Different Cutting Parameters. Shock Vib. 2018, 2018, 7975141. [Google Scholar] [CrossRef] [Green Version]
  26. Evans, I.; Pomeroy, C.D. The Strength, Fracture and Workability of Coal; Pergamon Press: Oxford, UK, 1966. [Google Scholar]
  27. Roxborough, F.F.; Rispin, A. Investigation into the application of picks for mechanized tunnel boring in the lower chalk. Min. Eng. 1973, 156, 1–13. [Google Scholar]
  28. Balci, C.; Demircin, M.A.; Copur, H.; Tuncdemir, H. Estimation of optimum specific energy based on rock properties for assessment of roadheader performance. J. S. Afr. Inst. Min. Metall. 2004, 104, 633–642. [Google Scholar]
  29. Lucy, L.B. A numerical approach to the testing of the fission hypothesis. Astron. J. 1977, 82, 1013–1024. [Google Scholar] [CrossRef]
  30. Monaghan, J.J.; Gingold, R.A. Shock simulation by the particle method SPH. J. Comput. Phys. 1983, 52, 374–389. [Google Scholar] [CrossRef]
  31. Villumsen, M.F.; Fauerholdt, T.G. Prediction of Cutting Forces in Metal Cutting, Using the Finite Element Method, a Lagrangian Approach. Analysis 2008, 1–16. [Google Scholar]
  32. Tham, C.Y. Reinforced concrete perforation and penetration simulation using AUTODYN-3D. Finite Elem. Anal. Des. 2005, 41, 1401–1410. [Google Scholar] [CrossRef]
  33. Li, H.; Du, E. Simulation of rock fragmentation induced by a tunnel boring machine disk cutter. Adv. Mech. Eng. 2016, 8, 1–11. [Google Scholar] [CrossRef] [Green Version]
  34. Zhu, X.; Dan, Z. Numerical simulation of rock breaking by PDC bit in hot dry rocks. Nat. Gas Ind. B 2019, 6, 619–628. [Google Scholar] [CrossRef]
  35. Liu, W.; Qian, X.; Li, T.; Zhou, Y.; Zhu, X. Investigation of the tool-rock interaction using Drucker-Prager failure criterion. J. Pet. Sci. Eng. 2019, 173, 269–278. [Google Scholar] [CrossRef]
  36. Stassi-D’Alia, F. Flow and fracture of materials according to a new limiting condition of yelding. Meccanica 1967, 2, 178–195. [Google Scholar] [CrossRef]
  37. Persson, A. CM1—A Simple Model for the Dynamic Deformation and Failure Properties of Brittle Materials. In 4th International Symposium on Ceramic Materials and Components for Engines; Carlsson, R., Johansson, T., Kahlman, L., Eds.; Springer: Dordrecht, The Netherlands, 1992. [Google Scholar]
  38. Sanio, H.P. Prediction of the performance of disc cutters in anisotropic rock. Int. J. Rock Mech. Min. Sci. 1985, 22, 153–161. [Google Scholar] [CrossRef]
  39. Li, X.; Wang, S.; Ge, S.; Malekian, R.; Li, Z. Numerical simulation of rock fragmentation during cutting by conical picks under confining pressure. Comptes Rendus Mec. 2017, 345, 890–902. [Google Scholar] [CrossRef]
  40. Ma, H.; Yin, L.; Ji, H. Numerical study of the effect of confining stress on rock fragmentation by TBM cutters. Int. J. Rock Mech. Min. Sci. 2011, 48, 1021–1033. [Google Scholar] [CrossRef]
  41. Ma, H.; Gong, Q.; Wang, J.; Yin, L.; Zhao, X. Study on the influence of confining stress on TBM performance in granite rock by linear cutting test. Tunn. Undergr. Sp. Technol. 2016, 57, 145–150. [Google Scholar] [CrossRef]
Figure 1. Finite element method (FEM) simulation of a rock cutting by pick cutter.
Applsci 10 05314 g001
Figure 2. Discrete element method (DEM) simulation of a rock cutting by pick cutter.
Applsci 10 05314 g002
Figure 3. The rock cutting pattern by two adjacent pick cutters according to the cut spacing to penetration depth ratio (modified after [7]).
Applsci 10 05314 g003
Figure 4. Kernel function for the interpolation of smooth particle hydrodynamics (SPH) [16].
Applsci 10 05314 g004
Figure 5. Computational cycle for SPH code [16].
Applsci 10 05314 g005
Figure 6. Description of the Drucker–Prager (DP) model with Stassi-hardening function (from [9]).
Applsci 10 05314 g006
Figure 7. Cumulative damage as a function of effective plastic strain (from [16]).
Applsci 10 05314 g007
Figure 8. Differences in behavior of cumulative damage (CD) model material in compressive and tensile regions (modified from [16]).
Applsci 10 05314 g008
Figure 9. A schematic diagram and numerical model of a pick cutter.
Applsci 10 05314 g009
Figure 10. Rock cutting model used in this study.
Applsci 10 05314 g010
Figure 11. The rock fragmentation pattern at different cut spacings.
Applsci 10 05314 g011
Figure 12. The damage accumulation due to interaction of adjacent cutters.
Applsci 10 05314 g012
Figure 13. The interaction between the adjacent cutters in numerical simulation at different cutting modes.
Applsci 10 05314 g013
Figure 14. Distribution of damage extent in vertical direction after cutting (cutting condition: p = 5 mm, s = 20 mm).
Applsci 10 05314 g014
Figure 15. The representative cutter forces obtained from the numerical simulation.
Applsci 10 05314 g015
Figure 16. The comparison of the cutter forces obtained from the linear cutting machine (LCM) test and the numerical simulation.
Applsci 10 05314 g016
Figure 17. The comparison of the specific energy between the LCM and the numerical results.
Applsci 10 05314 g017aApplsci 10 05314 g017b
Table 1. Mechanical properties of Linyi sandstone.
PropertiesUnitValue
Densityg/cm32.4
Porosity%8.2
Uniaxial compressive strengthMPa64.0
Brazilian tensile strengthMPa4.7
Young’s modulusGPa10.2
Poisson’s ratio0.2
Schmidt hammer rebound hardness *57.3
Shore hardness *43.5
P-wave velocitym/s2317
S-wave velocitym/s1531
* Schmidt hammer rebound and Shore hardness values were obtained by averaging the upper 10 values from 20 tests performed.
Table 2. Input parameters of Linyi sandstone for CD model.
Model (Category)ParameterInput Value
Linear (equation of state (EOS))Density (g/cm3)2.41
Bulk modulus (kPa)5.67 × 10⁶
Reference temperature (K)293
Drucker–Prager (strength)Shear modulus (kPa)4.25 × 10⁶
Pressure hardening typeStassi
Yield stress in tension (kPa)4.23 × 10³
Yield stress in compression (kPa)5.76 × 10⁴
Cumulative damage (failure)Plastic strain (D = 0)0.10
Plastic strain (D = DMAX)1.0
Maximum damage factor0.99
ErosionNone
Minimum density cut-off (SPH)0.2 (default)
Maximum density cut-off (SPH)1.0 (default)
Maximum sound speed (m/s)10,000
Table 3. Input parameters of tungsten carbide for a pick cutter.
CategoryModelParameterValue (Unit)
Equation of state (EOS)ShockDensity18.1 (g/cm3)
Gruneisen coefficient4000
S11.268
StrengthVon MisesShear modulus160 (GPa)
Yield stress2 (GPa)
Failurenonenonenone
Table 4. The results of cutter forces in the linear cutting machine (LCM) tests and numerical simulations.
Penetration Depth, p (mm)Cut Spacing, s (mm)Mean Cutting ForceMean Normal Force
LCM * (kN)Numerical
(kN)
Relative Error (%)LCM *
(kN)
Numerical
(kN)
Relative Error (%)
553.232.8412.13.632.9419.0
104.214.619.54.413.0431.1
155.194.807.55.294.3118.5
205.784.8017.05.884.9016.7
256.375.0021.56.475.1021.2
773.534.8036.03.533.335.7
145.105.7813.35.104.4113.5
216.176.667.96.865.0027.1
286.966.575.67.254.8033.8
35-7.06--5.39-
995.008.8276.45.684.1227.5
186.669.2138.37.947.357.1
277.559.4124.69.418.727.3
368.339.7016.410.9810.494.5
45-9.02--13.82-
11116.9611.7669.07.256.964.0
227.9412.2554.38.438.622.3
338.9210.7820.99.6010.5810.2
4410.0010.585.812.9411.1713.7
* The results of LCM tests were obtained from [8].
Table 5. The results of specific energy in LCM test and numerical simulation.
Penetration Depth, p (mm)Cut Spacing, s (mm)Specific Energy (MJ/m3)
LCM *Numerical
5582.9657.89
1077.6560.45
1577.8653.08
2067.5741.05
2585.8150.66
7754.7453.00
1448.9445.67
2142.1740.99
2844.9449.00
35-52.42
9949.7357.94
1837.6949.88
2733.1242.80
3639.7053.76
45-52.86
111146.3055.46
2234.3943.10
3331.1046.32
4432.7145.40
* The results of LCM tests were obtained from [8].

