Article

Influence of the Improvement in Thermal Expectation Levels with Adaptive Setpoint Temperatures on Energy Consumption

by
David Bienvenido-Huertas
1,*,
Daniel Sánchez-García
1,
Carlos Rubio-Bellido
1 and
Jesús A. Pulido-Arcas
2
1
Department of Building Construction II, University of Seville, 41012 Seville, Spain
2
Center for Research and Development of Higher Education, Graduate School of Arts and Sciences, College of Arts and Sciences, The University of Tokyo, Tokyo 113-8654, Japan
*
Author to whom correspondence should be addressed.
Appl. Sci. 2020, 10(15), 5282; https://doi.org/10.3390/app10155282
Submission received: 6 July 2020 / Revised: 23 July 2020 / Accepted: 29 July 2020 / Published: 30 July 2020

Abstract

:
A sustainable use of active heating, ventilation, and air conditioning (HVAC) systems is crucial for minimum energy consumption. Currently, research studies are increasingly applying adaptive setpoint temperatures, thus reducing considerably the energy consumption without influencing comfort levels excessively. Most of them, however, are focused on the limit values of adaptive comfort standards without considering the tolerance in users’ adaptation capacity. This research study analyzed various tolerance ranges in the recent adaptive thermal comfort model from EN 16798-1:2019 used in setpoint temperatures. The study focused on the south of Europe, considering 47 cities in Spain, 18 cities in Portugal, 13 cities in Greece, and 20 cities in Italy. In addition, such cities were analyzed in three climate scenarios: present time, 2050, and 2100. The results showed that values prefixed by EN 16798-1:2019 for new buildings (tolerance of 0.00 °C) produced significant savings with respect to the static model and that each progressive improvement in users’ thermal expectations in 0.25 °C increased the energy consumption between 6.57 and 9.31% in all scenarios analyzed. Even applying a thermal tolerance of 1.50 °C, energy savings are currently produced with respect to the static model. This tendency increases in future scenarios until a thermal tolerance of 1.75 °C. The results of this paper provide greater knowledge about the possible energy increase that the improvement in users’ expectations would produce.

1. Introduction

By 2050, it is estimated that the European building stock will have reduced greenhouse gas emissions by 90% when compared to 1990 [1]. If this reduction percentage is achieved, it will strongly affect climate change control due to the activity of the building stock [2]. In addition, other social and health aspects, such as energy poverty [3,4,5] or mortality because of inappropriate thermal conditions [6,7], could be reduced. The improvement in building energy performance is therefore crucial. For this purpose, attention should be paid on the use of heating, ventilation, and air conditioning (HVAC) systems as they are the main energy consumption source in buildings [8,9]. The combination of energy conservation measures with smart designs will improve the performance of the building stock. However, the main challenges for a more sustainable use of energy in buildings are not just focused on obtaining buildings with better systems [10,11], a better envelope [12,13,14], and an energy self-production [15,16,17], but also on the use of buildings [18,19].
The influence of users on the behavior of HVAC systems is due to the main goal of such systems: to maintain satisfactory thermal conditions inside the dwelling. One of the possibilities to reduce this energy consumption is by modifying setpoint temperatures [20]. The nudge of the HVAC system setpoint temperatures can strongly impact the energy performance of the building [21], mainly due to its influence on the energy demand required for the HVAC system [22]. In this regard, Lakeridou et al. [23] analyzed the effect of increasing the cooling setpoint temperature by 2 °C in a field study conducted in an administrative building in 2010. A total of 129 participants were surveyed, and the results showed that the rise in the setpoint temperature did not affect their thermal comfort. Hoyt et al. [24] studied the energy saving obtained by varying the setpoint temperatures of HVAC systems in office buildings. Significant savings were obtained in the energy consumption, with variations of 1 °C in heating and of 3 °C in cooling. A similar study was carried out by Spyropoulos and Balaras [25]. In this study, the authors studied several Greek bank branches. The use of setpoint temperatures of 20 °C for heating and of 26 °C for cooling achieved energy savings of up to 45%. Fernandez et al. [26] analyzed the effect of increasing the range of the thermostat by 1.1 °C in heating and cooling, as well as other improvement measures in the HVAC systems of office buildings. Energy savings oscillated between 12 and 20%. Parry et al. [27] studied the possibilities of reducing the energy consumption of a Swiss office building. Increasing the cooling setpoint temperature up to 4 °C reduced the annual building energy consumption by a third. Additionally, Saidur [28] analyzed that the increase in the air conditioning setpoint temperature from 22 to 26 °C can save by 24% the energy consumption of office buildings in Malaysia. Likewise, Yamtraipat et al. [29] evaluated the effect of increasing the air conditioning setpoint temperature by 26 °C in 13 office buildings in Thailand. The results showed a total saving of 804.60 GWh/year. Finally, Moon and Han [30] analyzed the effect of gradually increasing the setpoint temperatures in residential buildings in Detroit and Miami. The results reflected that, depending on the type of climate, the modification of the setpoint temperatures influenced heating in cold climates and cooling in hot climates.
Most of these research studies considered that HVAC systems are used with static setpoint temperatures. The use of this type of setpoint temperatures has discrepancies with the adaptability of users to real buildings [31,32,33]. There is solid evidence, however, that users perceive comfort according to the external thermal variations [34]. In this regard, users of residential buildings can adopt adaptive strategies limiting the energy consumption of HVAC systems [35,36]. Thus, the use of such new adaptive comfort models to adjust setpoint temperatures (i.e., adaptive setpoint temperatures) of buildings is an opportunity to guarantee important energy savings without influencing users’ thermal comfort. The possible energy savings by implementing such models have been investigated by several research studies. In a first study, Van der Linden et al. [37] analyzed the energy saving achieved by applying the thermal comfort model from kennisinstituut voor de installatiesector (ISSO) 74 [38]. The use of the lower limit of such standard achieved an energy saving of 74%. Later, Yun et al. [39] carried out another study with this approach. In their work, the authors analyzed the application of the adaptive comfort model to the operational conditions of air conditioning systems in an office building. The results showed the possibility of using the adaptive thermal comfort model with 87% of users satisfied. However, recent studies have focused on the energy savings which can be achieved in residential buildings. Sánchez-Guevara Sánchez et al. [40] studied the variation of setpoint temperatures in three residential buildings located in various cities in Spain. Setpoint temperatures monthly varied by using the adaptive thermal comfort model from American Society of Heating, Refrigerating and Air-Conditioning Engineers (ASHRAE) 55-2017 [41]. The energy consumption of the case studies analyzed was reduced between 20 and 80%. Likewise, in a recent study, Sánchez-García et al. [42] studied the application of adaptive setpoint temperatures in a residential building. The analysis was conducted in the same cities on which the study by Sánchez-Guevara Sánchez et al. [40] was based. The energy consumption was saved between 10 and 46% according to the type of climate in which the building was located. In another study, Wang et al. [43] evaluated different approaches to use the thermostat, including the ASHRAE adaptive comfort model. This analysis was performed on residential buildings in five United States cities (San Francisco, New York City, Phoenix, Miami, and Fairbanks). The results showed savings of up to 54% with the adaptive model power consumption. Finally, Bienvenido-Huertas et al. [44] analyzed the influence of the alpha value used to calculate the prevailing mean outdoor temperature with adaptive setpoint temperatures. The results showed deviations of up to 0.47 and 1.30% in heating and cooling energy consumption, respectively.
Nevertheless, the various research studies related to the application of adaptive setpoint temperatures present several knowledge gaps. The first knowledge gap is related to the tolerance of applying such limit values. Under actual application conditions, users are likely to have limitations to reach the limit values of the adaptive comfort standards. In such standards, the increase in limit values means a decrease in percentage of acceptability of the category. It is also fundamental to consider the influence of users’ habits. In this regard, it is worth stressing that the adaptation capacity of the occupants’ thermal comfort usually has asymmetric trajectories [45]. Users more used to the use of HVAC systems will have therefore more difficulties to increase the limit values of the operative temperature than those not using such systems [45]. For this reason, this study analyzed various tolerance ranges in the adaptive thermal comfort model used in setpoint temperatures. The study was focused on new buildings as this type of constructions is where users could have a greater demand in thermal comfort limits. To do this, the amplitude of comfort limits was reduced by intervals of 0.25 °C, and consequently, the amplitude of the comfort zone was narrowed to a total of 0.5 °C in each interval by increasing the tolerance variable.
Furthermore, other three important gaps of the previous studies have been tackled in this research. The first gap is related to the adaptive thermal comfort model used because most research studies were based on EN 15251:2007 [46]. However, this standard has been recently modified by EN 16798-1:2019 [47]. As a result, new research studies using the new standard will give updating knowledge about the effectiveness of adaptive setpoint temperatures. Secondly, the comparison of results from the application of adaptive setpoint temperatures with respect to static effective setpoint temperatures will lead to greater knowledge about the saving degree. Thirdly, most research studies were conducted in certain cities by using adaptive setpoint temperatures. For this reason, this research analyzed many cities from various countries: 47 cities in Spain, 18 cities in Portugal, 13 cities in Greece, and 20 cities in Italy. Among countries of the European Union, these four countries were selected due to their great climate vulnerability to climate change. These cities correspond to the capitals of the regions of each country. Additionally, the analysis was conducted in the current climate scenario, as well as in unfavorable climate change scenarios for 2050 and 2100.
This paper is divided as follows: on the one hand, theoretical bases of adaptive comfort models related to the various levels of users’ tolerance, how climate simulations were performed, and the modelling of dwelling used in the study are explained in the methodology; on the other hand, results are discussed as follows: the effect of the increase in tolerance in heating and cooling consumption in the current scenario is first discussed for the various regions considered, and the same process is then conducted for 2050 and 2100. Finally, the most relevant conclusions are drawn.

2. Methodology

2.1. Thermal Comfort Model: Adaptive Setpoint Temperatures and Tolerances

The European adaptive thermal comfort model currently in force is EN 16798-1:2019 [47]. This standard led to the update of EN 15251:2007 [46]. EN 16798-1:2019 establishes three different categories in which the internal operative temperature should oscillate according to the type of building and to occupants’ expectations (e.g., category I should be used in spaces for people with special requirements, such as old people or ills, category II should be used in new buildings, and category III in existing buildings).
Such categories indicate the values in which the internal operative temperature should oscillate through upper and lower limits. Equations (1) and (2) indicate the limit values of category II (i.e., new buildings) [47], which is the aim of this research. Such limits are established through linear correlations whose independent variable is an external average temperature known as the running mean outdoor temperature ( T r m ). T r m is obtained by the weighted sum of daily mean external temperatures from the previous days (see Equation (3)) [47]. It is important to note that T r m will be useful not only to obtain the limits of the internal operative temperature, but to determine whether the adaptive comfort model from EN 16798-1:2019 could be applied. In this sense, EN 16798-1:2019 establishes that the adaptive comfort model could be applied if T r m is between 10 and 30 °C.
U p p e r   l i m i t   ( C a t e g o r y   I I ) = 0.33 · T r m + 21.8     [ ° C ] ( 10 T r m 30 )
L o w e r   l i m i t   ( C a t e g o r y   I I ) = 0.33 · T r m + 14.8     [ ° C ] ( 10 T r m 30 )
T r m = ( T e x t , d a y 1 + 0.8 T e x t , d a y 2 + 0.6 T e x t , d a y 3 + 0.5 T e x t , d a y 4 + 0.4 T e x t , d a y 5 + 0.3 T e x t , d a y 6 + 0.2 T e x t , d a y 7 ) / 3.8     [ ° C ]
As discussed above, many research studies have analyzed the use of the upper and lower limits of the adaptive model as the setpoint temperatures of HVAC systems. The use of the limit values of the adaptive model could lead to significantly save the energy consumption. However, its use implies a higher level of users’ adaptability, so it is necessary to analyze the effect of better users’ thermal expectations with respect to the limit values of the adaptive thermal comfort model.
For this purpose, the limit values related to category II were used. Heating and cooling limits were reduced in intervals of 0.25 °C, narrowing the comfort zone to a total of 0.5 °C in each interval. Figure 1 graphically represents the limits of the thermal comfort models used in this study. The numeric value indicates the designation of the adaptive thermal comfort model which coincides with the reduction in degrees with respect to the limit values of category II. Concerning the values assigned to setpoint temperatures when the adaptive thermal comfort model is not applied, the criterion used in other similar research studies was used [42,48]: to horizontally extend the comfort limits. Furthermore, a static model was used as a reference model. The static model was designed by using the static setpoint temperatures set in the standard of adaptive comfort for HVAC systems: between 20 and 25 °C for heating periods, and between 23 and 26 °C for cooling periods. Table 1 summarizes the correlations and limit values used in each model.

2.2. Cities Analyzed

In a recent study, the applicability of adaptive thermal comfort models throughout the planet was evaluated [49]. The results showed a relationship between latitude and the application of the adaptive thermal comfort models. In this sense, latitudes near the equator have an application of more than 90% of the days of the year, while latitudes near the geographic poles have an application lower than 10% [49]. This aspect is due to the values that external temperatures usually have at each latitude. Therefore, the variation of the external temperature is among the fundamental aspects in the use of adaptive thermal comfort models. However, there are regions far from the equator in which an adequate application of adaptive thermal comfort models was detected, such as the Mediterranean region [49].
As this research aimed at having greater knowledge about the application of this type of setpoint temperature, the main cities of countries in southern Europe with the greatest surface were analyzed (Figure 2). The criterion chosen to select the cities was that they were the capitals of the regions of each country. These cities usually have a greater population and a higher building energy consumption [50,51]. Therefore, the study of these cities would allow to analyze the energy-saving potential that can be achieved under the climatic conditions where the buildings with the highest energy consumption are located. As a result, 47 cities in Spain, 18 cities in Portugal, 13 cities in Greece, and 20 cities in Italy were selected (see Table 2). As for Greece, it is worth stressing that the regional division was based on the 13 regions set in the Kallikratis Plan [52], which was enforced in 2011.
As mentioned in Section 1, the results of this research were obtained through an exhaustive simulation process. Simulations were performed with EnergyPlus. To do this, obtaining the EnergyPlus weather (EPW) files of each city was required. Such EPW files were used for simulations and for the determination of the limit values of adaptive models (see Figure 3). This is done through the hourly temperature data available in each EPW. With these data, it is possible to determine the daily average temperature data in each file, and by applying Equations (1)–(3), the upper and lower limits of thermal comfort are determined. EPW files were obtained through METEONORM [53]. METEONORM is a software made up of 8325 weather stations which generates climate schedule values in any Earth’s location through spatial interpolations. The radiation period considered for generating the EPW files was 1991–2010, and the temperature period was 2000–2009.
This research was also aimed at analyzing the influence of tolerances on the adaptive setpoint temperatures in future climate change scenarios. The EPW files of each cities were therefore obtained in the years 2050 and 2100 through METEONORM. The former was selected because it is the year established by the European Union to reduce by 90% the greenhouse gas emissions generated by the building sector, and the latter was selected to analyze the behavior of the adaptive strategies at the end of the 21st century. Scenario A2 from the Intergovernmental Panel on Climate Change was chosen as it is one of the most unfavorable scenarios [54]. Such scenario considers a very heterogeneous world and is characterized by a constant increase in population and with economic developments focused on each region [54]. In this scenario, a rise in temperatures between 2 and 5.4 °C is forecast at the end of the 21st century with respect to the values at the end of the 20th century. Despite the fact that the representative concentration pathways are the last scenarios published, the uncertainty regarding the future evolution of climate throughout the 21st century does not allow us to determine the scenario that will finally take place [55]. For this reason, the analysis of the building energy performance in the future should be contextualized with the climate change scenario used [56]. This study used a scenario A2 as it is widely applied [57,58,59,60,61,62,63,64] and is among the scenarios with the highest incidence of climate in the Special Report on Emissions Scenarios [54].

2.3. Case Study

For simulations, a virtual prototype building was designed (see Figure 4). This prototype case study is an ideal residential building designed according to the minimum energy demand criteria established for new buildings in the countries analyzed [65,66]. It is a building with a rectangular floor plan of dimensions of 12 × 10 m and it has two dwellings per floor. The internal space of each dwelling is divided into a bedroom, a bathroom, a kitchen, a living room, and a corridor. The use of a virtual prototype of case studies to establish considerations and operational hypotheses has been used in various studies: (i) Grazieschi et al. [66] used a virtual prototype of a two-story building to analyze optimal solutions in the life cycle of an autonomous building; (ii) Rossi and Rocco [67] designed a virtual test-room to analyze the influence of the periodic thermal transmittance and the internal areal heat capacity on the energy demand of the interior space; (iii) Rodrigues et al. [68] and Fernandes et al. [69] designed a wide variety of virtual prototypes of residential buildings using the Evolutionary Program for the Space Allocation Problem algorithm to assess the influence of thermal properties on energy performance; (iv) Jiru [70] and Abediniangerabi et al. [71] analyzed different virtual prototypes of buildings included in the ASHRAE Standard 90-2010 to evaluate energy conservation measures; (v) Kim et al. [72] analyzed the performance of the variable refrigerant flow and the rooftop variable air volume systems in a virtual prototype of an office building; (vi) O’Neill and Niu [73] used a virtual prototype of a single-family home to assess the effect of occupancy on energy performance; (vii) Shishegar and Boubekri [74] used a four-story virtual office building to evaluate the installation of daylight controllers; (viii) Sardoueinasab et al. [75] used a virtual prototype of the Pacific Northwest National Laboratory office building to analyze air leaks in the parallel fan-powered terminal units; (ix) Ciancio et al. [57] used a virtual prototype of a residential building to assess its energy demand with climate change in different cities in Europe.
Regarding the virtual prototype used in the research, it is important to highlight that, to reduce the elements through which heat transfers take place, the case study corresponded to an intermediate floor, so that heat losses or gains produced through the roof were reduced. Given the aim of this study (analyzing the effect of the variation of setpoint temperatures on the energy consumption), both thermal properties and the load profile were the same in all locations, so there were no other factors varying the energy consumption: variations in the energy consumption were caused by setpoint temperatures. The thermal properties of the vertical elements are specified in Table 3. Regarding windows, a design with a thermal transmittance of 4.2 W/(m2K) and a constant solar heat gain coefficient (SHGC) of 0.6 were used.
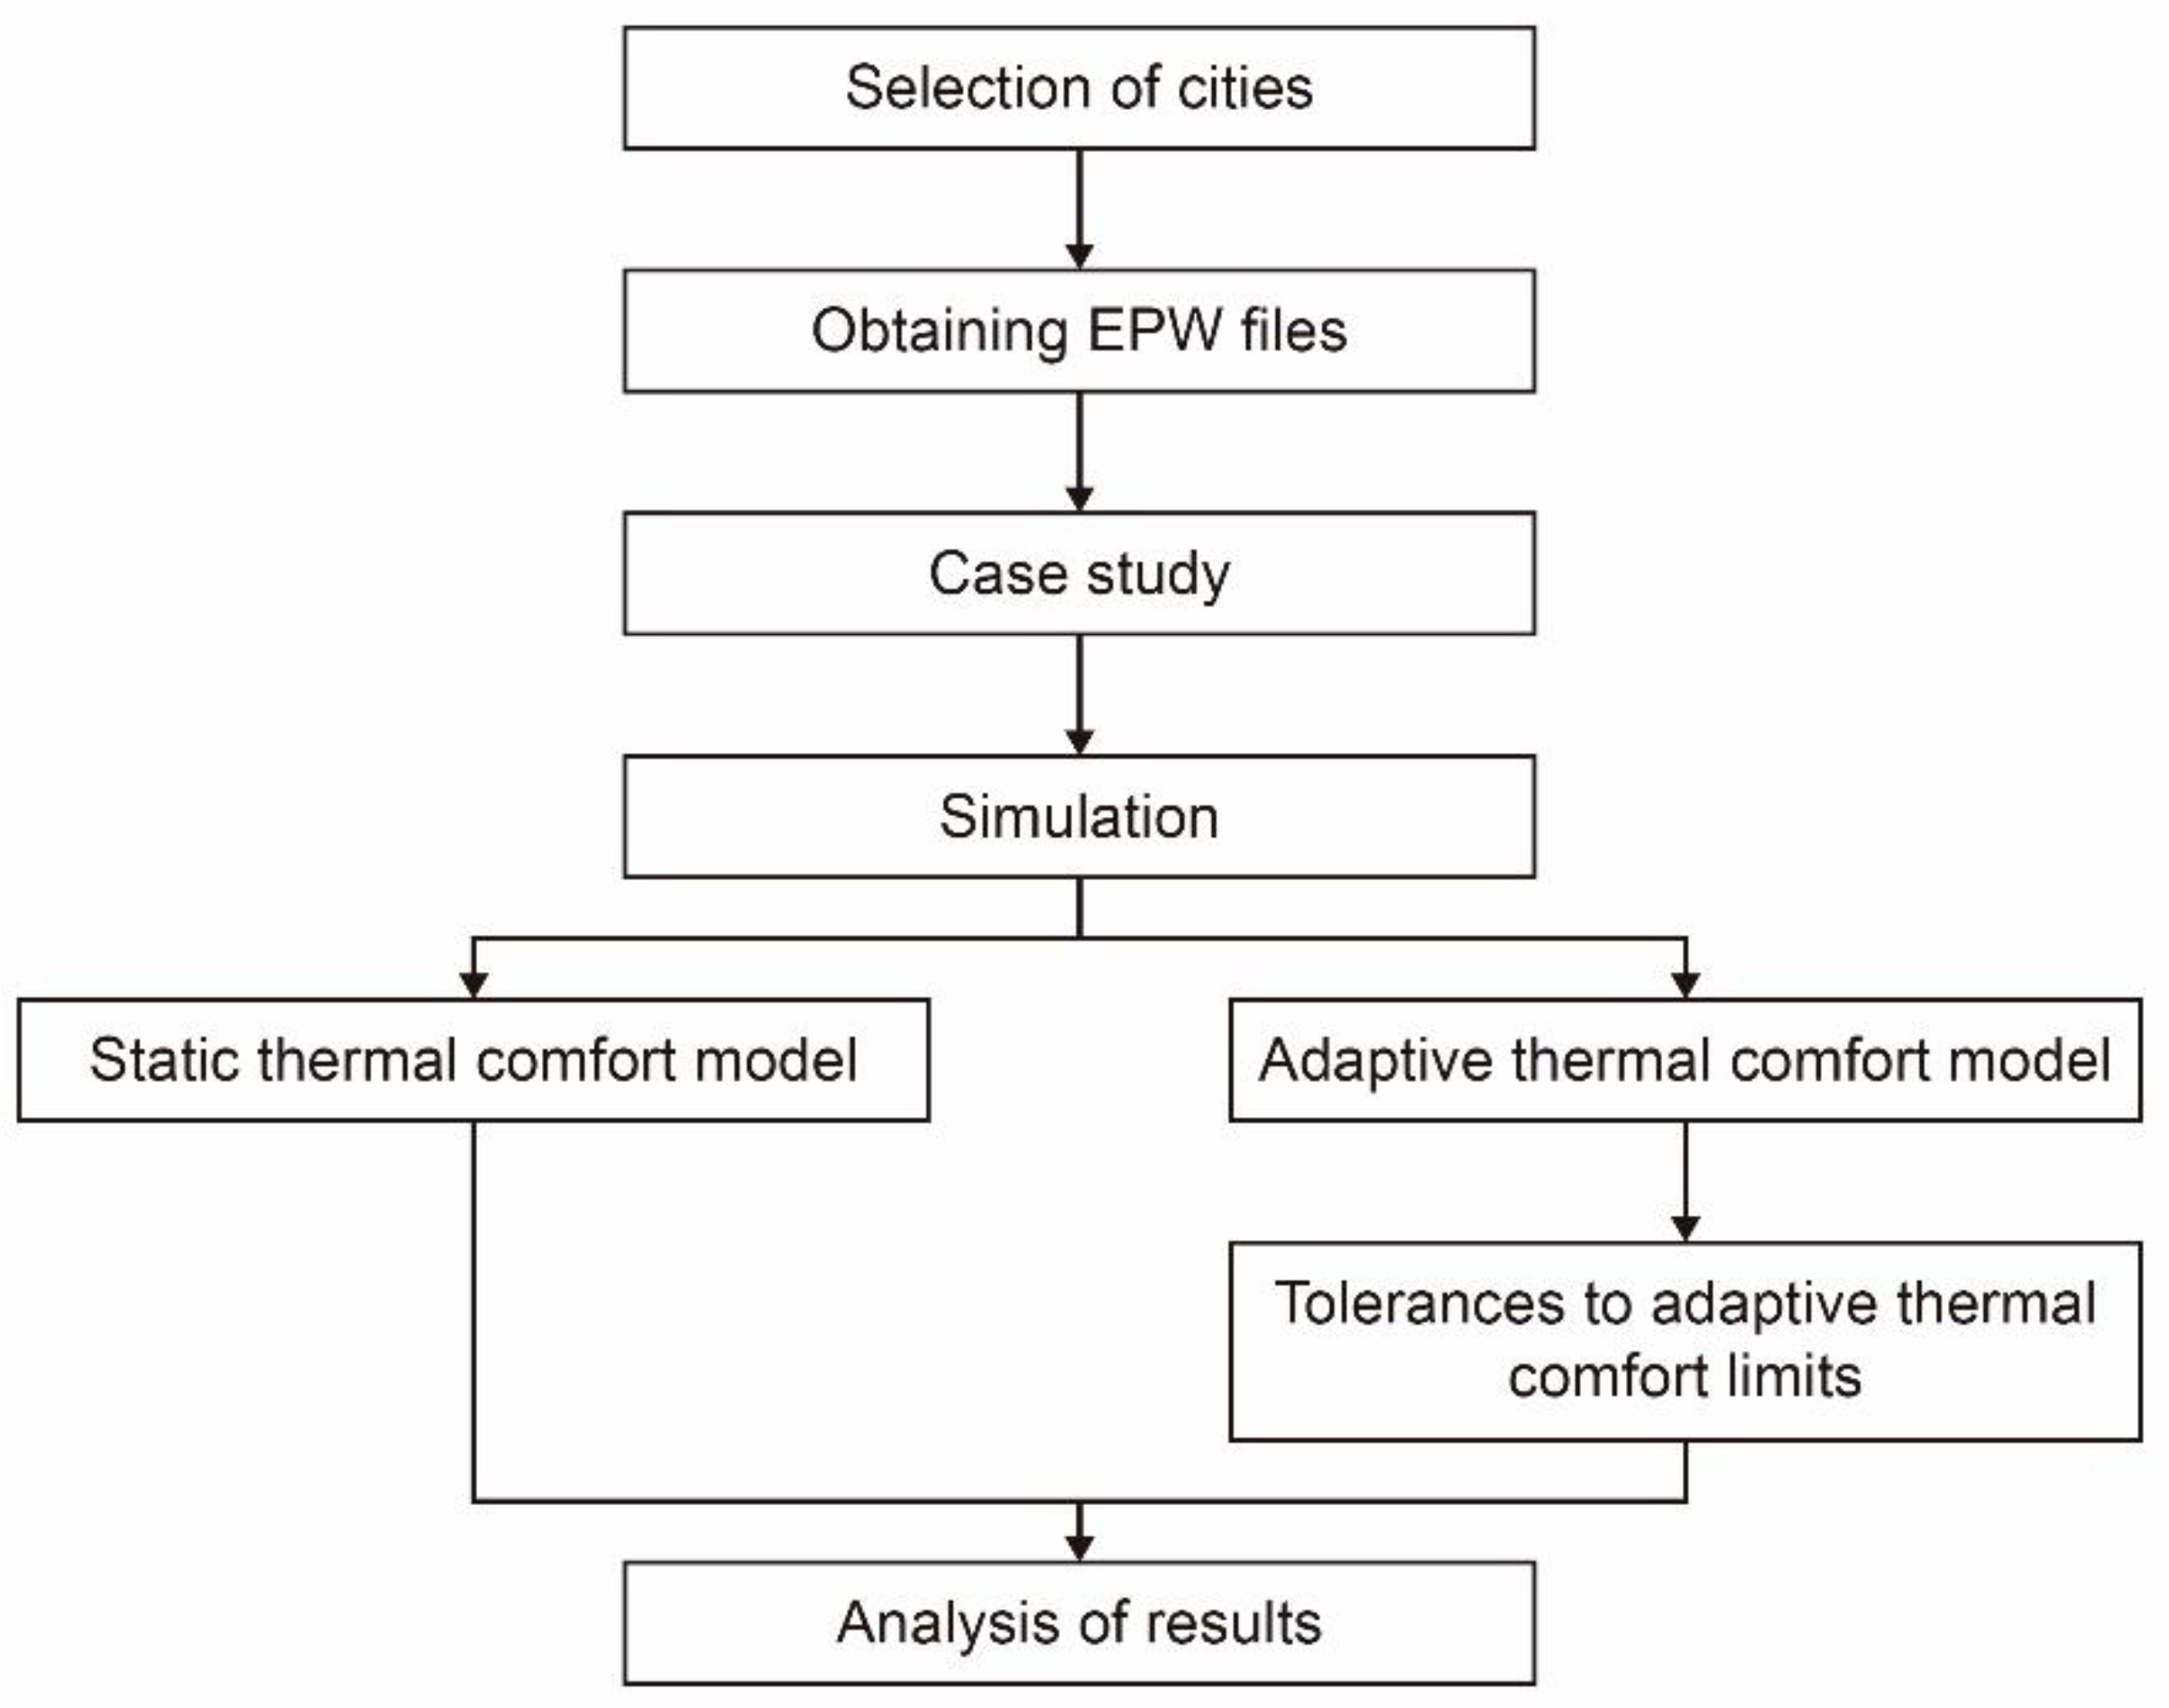
Regarding the load profile, a similar profile than that used in previous research studies was used [42,48]. Figure 5 presents the hourly percentage contribution of each load. The profile considers that the occupancy of the case study varies depending on the day: from Monday to Friday, the occupancy varies from 25 to 100%, whereas Saturdays and Sundays the case study has an occupancy of 100%. The load of lighting devices and equipment has the same usage profile, which varies depending on the time of the day. Values of 100% for the various loads are as follows: the latent load is 1.36 W/m2, the sensitive load is 2.15 W/m2, and the load for both equipment and lighting devices is 4.40 W/m2. It is worth stressing that the case study was designed with a variable refrigerant flow (VRF) system with a coefficient of performance (COP) of 3.10 and an energy efficiency ratio (EER) of 3.00. Regarding the thermal comfort models and the setpoint temperatures, Table 1 indicated the values associated with the upper and lower limits of each adaptive model. Likewise, Table 1 indicated the setpoint temperatures considered for the static thermal comfort approach. These values were configured in the simulations carried out of the case study in EnergyPlus. Figure 6 summarizes the simulation process carried out in the research.

3. Results and Discussion

Firstly, simulations were performed. A total of 14 simulations were performed in each city and three climate scenarios were analyzed (current day, 2050, and 20,100), so results are based on 4116 different simulations. Then, such data were independently analyzed according to the climate scenario. Section 3.1 shows and discusses the results obtained in the current scenario, and Section 3.2 discusses the comparative analysis among the different countries. Finally, Section 3.3 deals with the results obtained in 2050 and 2100.

3.1. Effect of the Increase in Tolerance in the Current Scenario

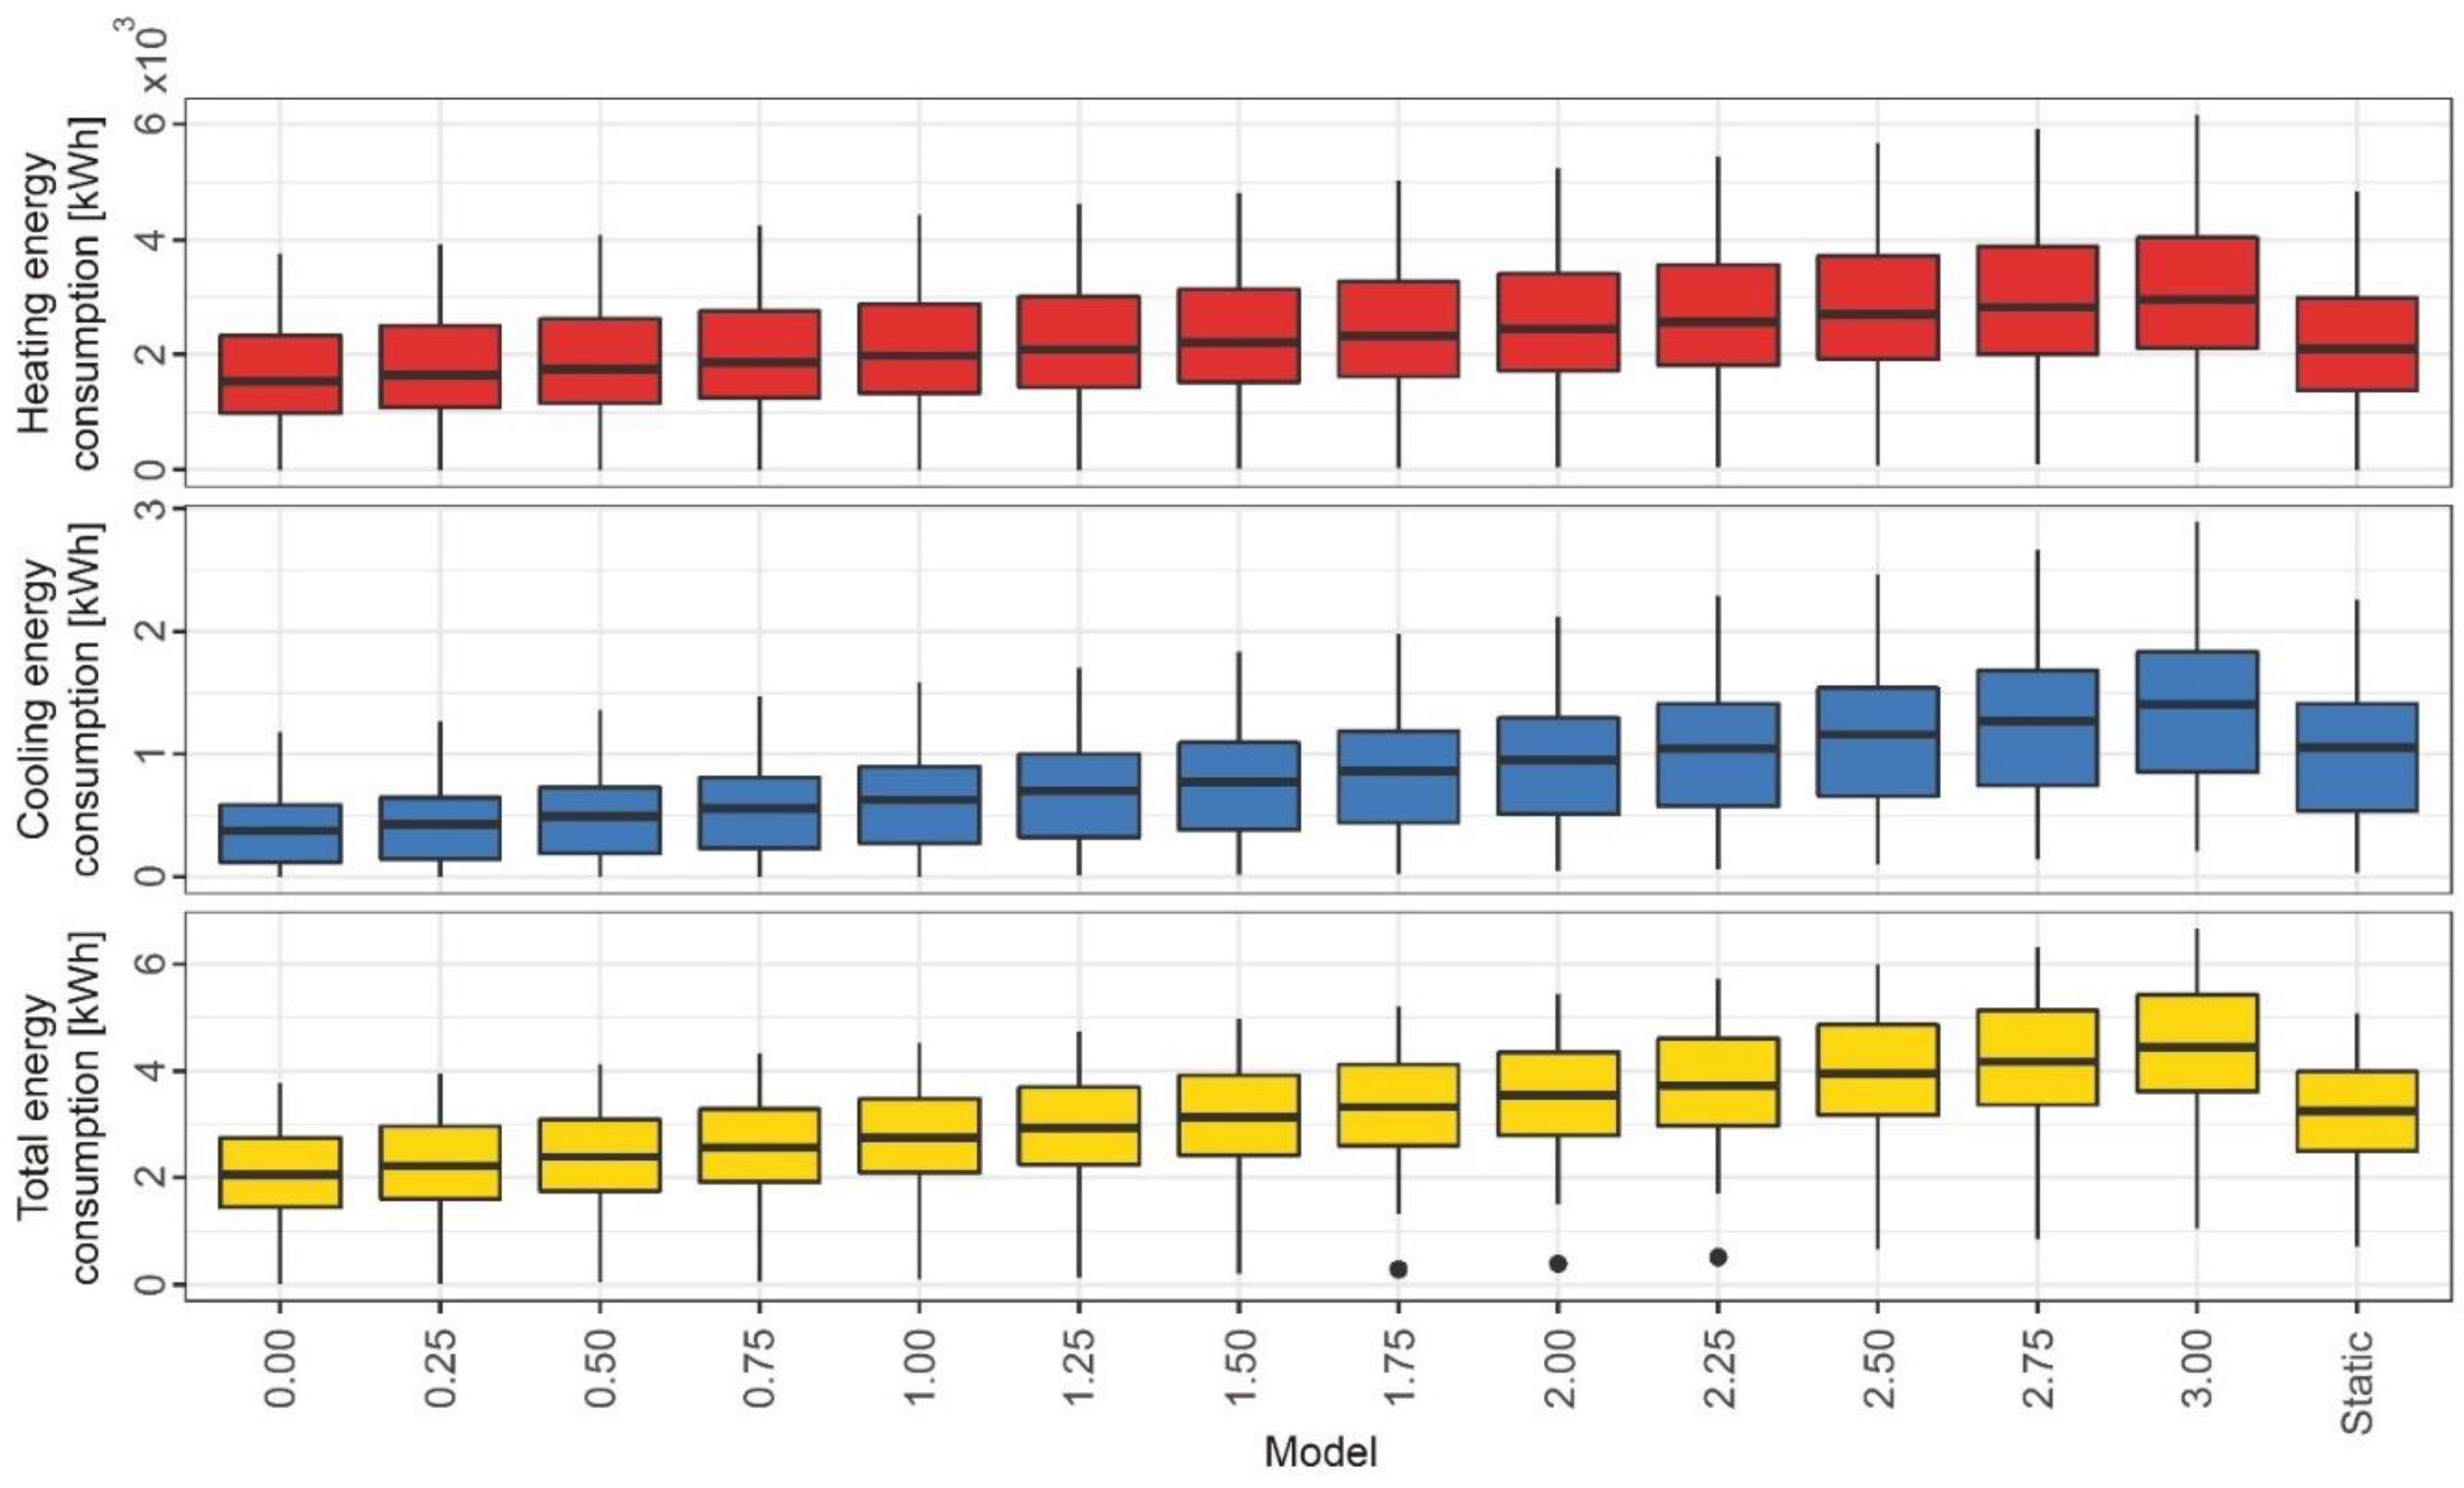
By analyzing the results of the current scenario, it was found that the level of users’ thermal expectations progressively increased in the building energy consumption. Figure 7 shows that the distribution of the annual results of energy consumption in all the cities analyzed progressively increased both consumptions (heating and cooling). Furthermore, such increase led to an energy consumption more like that of the static model, even obtaining a greater energy consumption. In this regard, up to a tolerance of 1.50 °C, average savings were achieved in the total energy consumption, whereas higher tolerances implied a greater energy consumption than the static model (see Table 4).
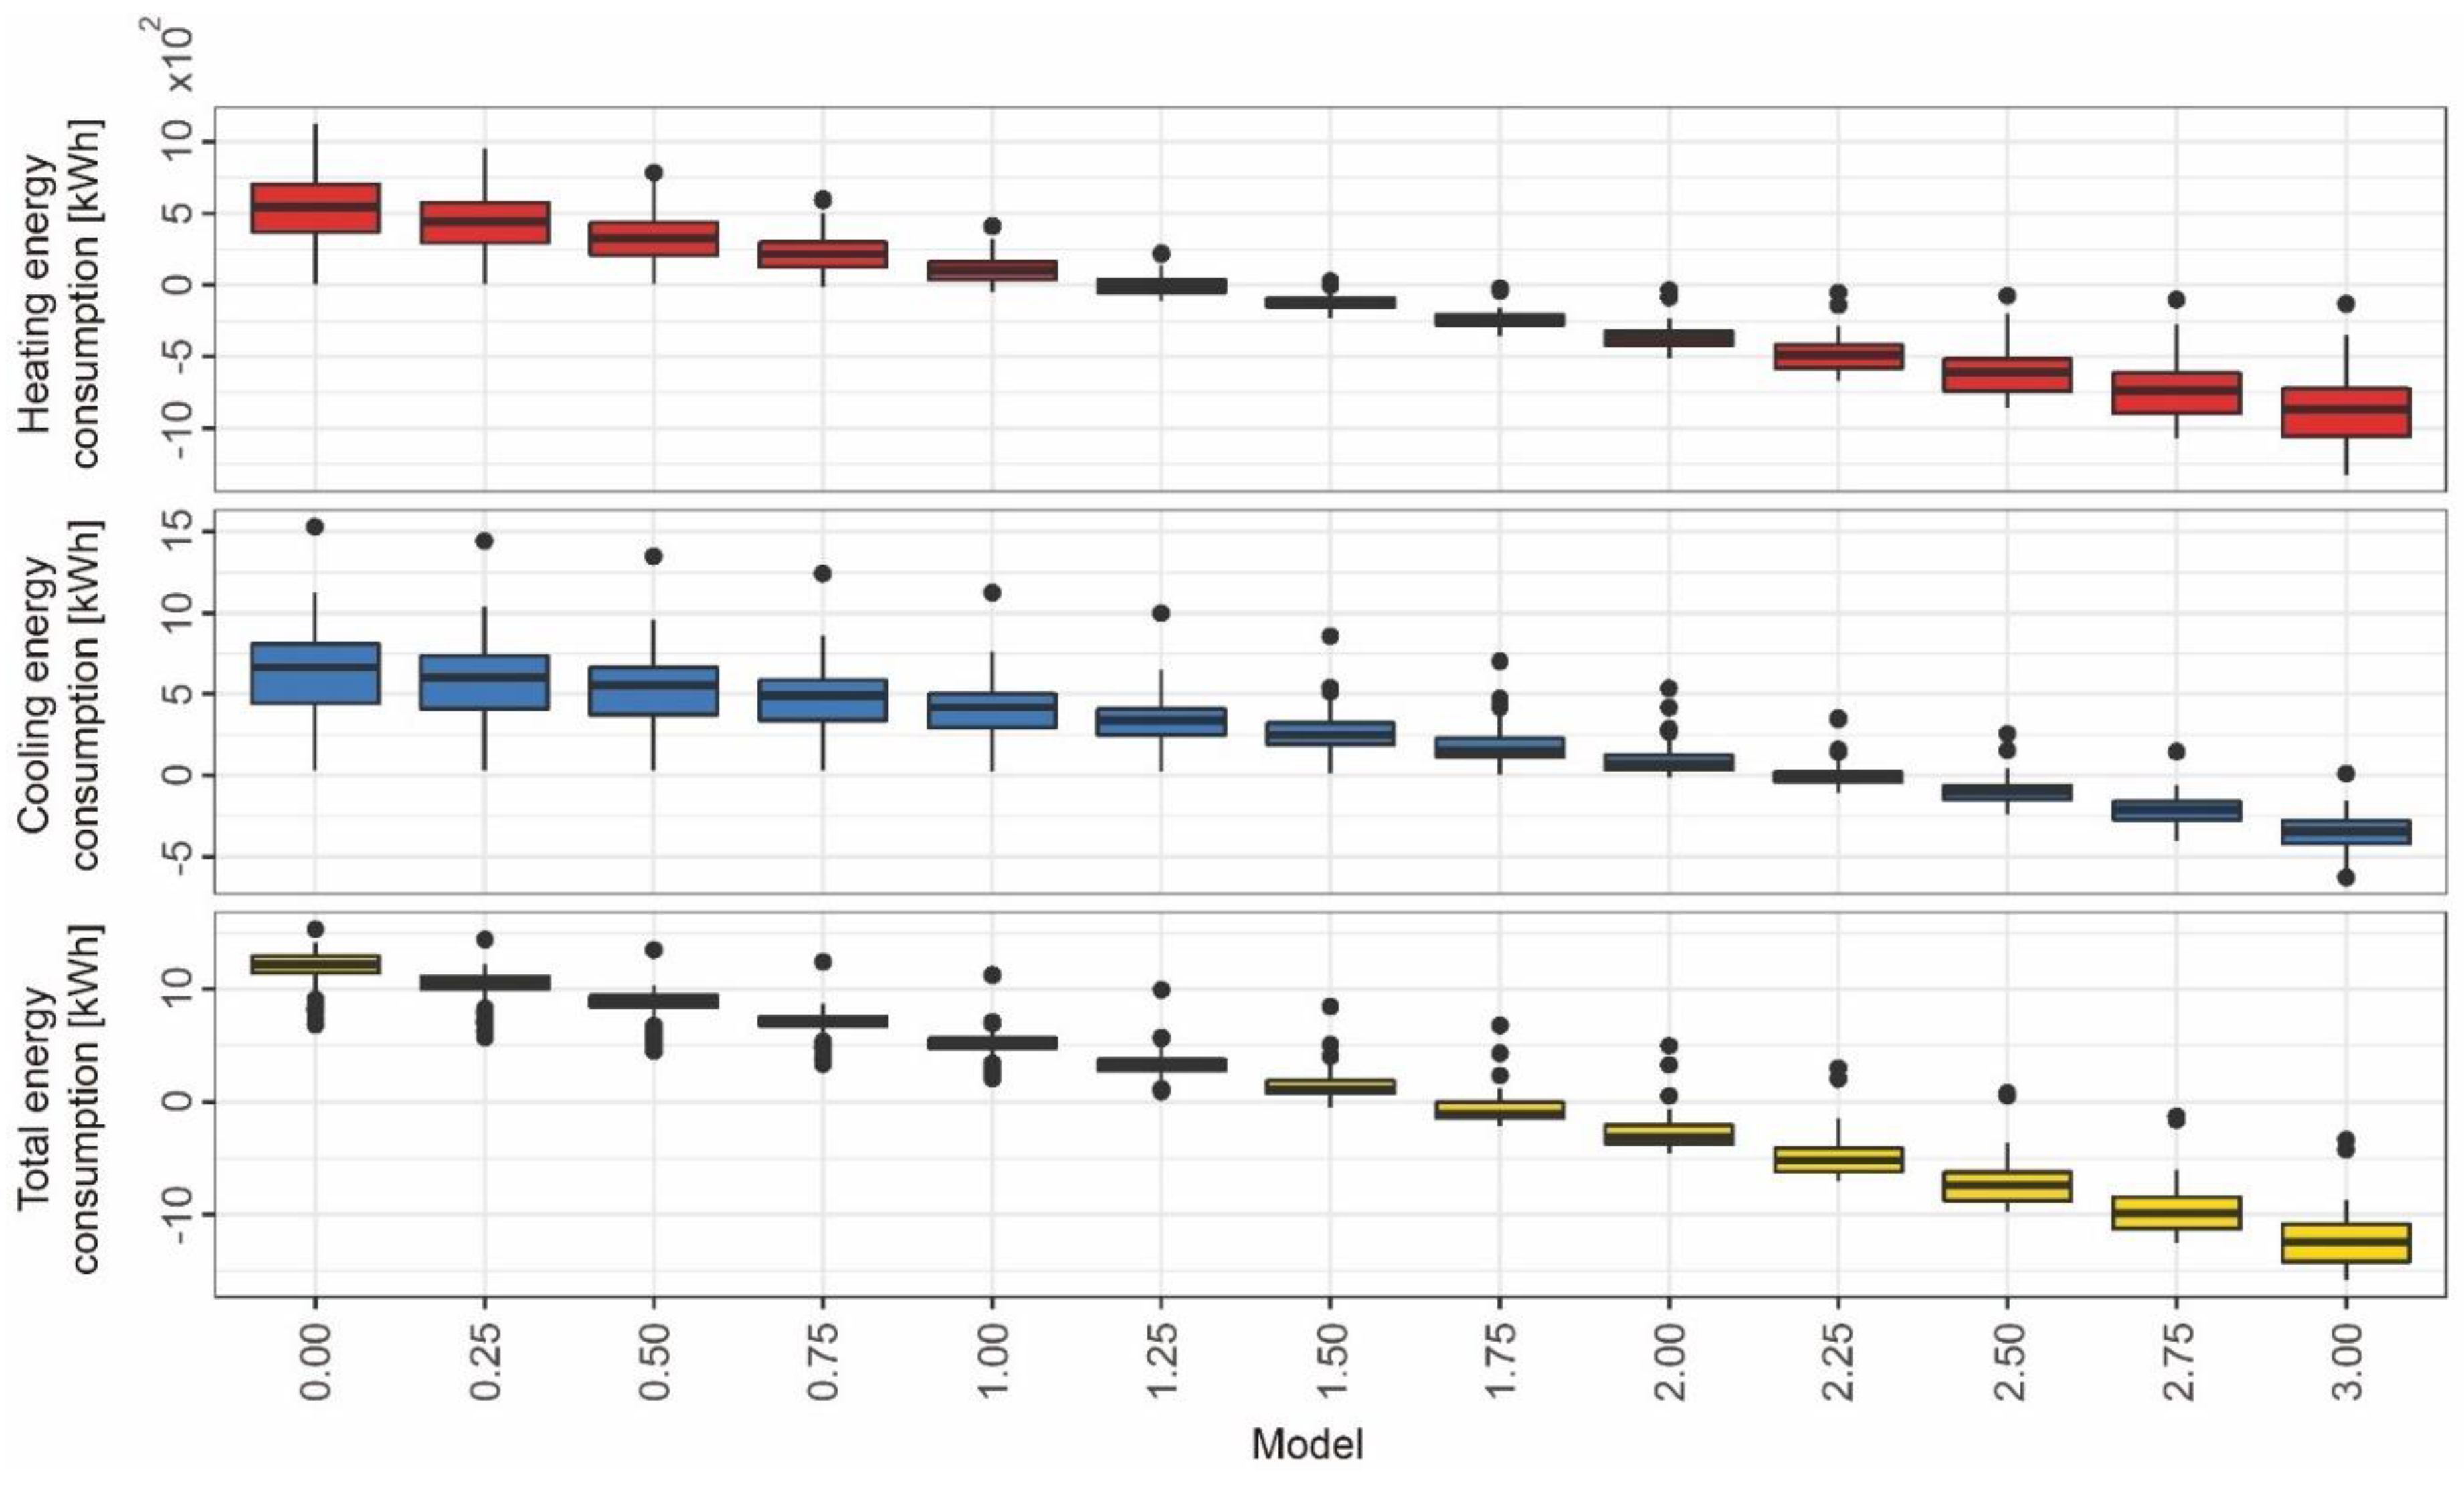
To understand this effect, it is fundamental to analyze the energy saving obtained by adaptive models in each type of consumption. Figure 8 represents the distributions of energy-saving data obtained with respect to the static model. The distributions had different tendencies according to the type of energy consumption, whereas in heating, negative values of energy saving were achieved from the adaptive model of tolerance of 1.00 °C in some cities, while some negative values were not achieved in cooling consumption until the model of tolerance of 2.00 °C. Two fundamental aspects are found: (i) the possible limitations of heating adaptive setpoint temperatures with static temperatures when correlations of determination of such limit obtain temperatures greater than 20 °C. In this sense, the increase in demand level with heating temperatures could hinder the potential energy saving that could be obtained with these setpoint temperatures. (ii) The cooling temperature leads to a greater tolerance in which guarantees a greater application of these measures without influencing the thermal comfort or the energy saving achieved. It is important to stress that cooling consumptions are based on the period considered to use cooling systems, so the percentage contribution of cooling consumption with the total could be greater.
Regarding the total energy consumption, as the heating contribution in the results obtained was greater than the cooling contribution, the tendency found in the total energy consumption was similar to the heating consumption, obtaining negative results in the tolerance of 1.75 °C. In this type of energy consumption, the increase distribution of the energy consumption raises from a tolerance of 1.75 to 3.00 °C. Thus, energy increase distributions ranged between 338.78 and 1583.98 kWh/year, instead of between 23.73 and 356.39 kWh/year. The excessive increase in the user’s expectation level could considerably increase the building energy consumption. The progressive increase in thermal expectation in 0.25 °C generates a tendency of percentage average increase between 6.57 and 8.86% with respect to the total energy consumption obtained in the previous tolerance level (e.g., the increase in energy consumption of the tolerance of 0.25 °C with respect to 0.00 °C was 8.86%) (see Figure 9). This percentage increase in energy consumption is greater in low tolerance values due to the greater percentage variation caused by lower energy consumption values.
Therefore, the improvement in users’ expectation levels with respect to the limit values used for adaptive setpoint temperatures could significantly increase the energy consumption. In contrast, cooling the decrease in the limit value in tolerances of up to 1.00 °C obtains savings greater than 45%, while the rise in setpoint temperatures in heating has a significant worsening effect on the energy-saving measure. Thus, it is possible that users slightly improve the expectation level in hot seasons without influencing the energy saving achieved by measures, whereas in cold seasons, the adjustment to the lower limit value of EN 16798-1:2019 (i.e., the model with tolerance of 0.00 °C) is the best solution. Regardless, the adjustment to the limit values of category II is still the best application approach of adaptive setpoint temperatures in new buildings.

3.2. Regional Comparison of the Energy Saving Achieved by Using Adaptive Setpoint Temperatures

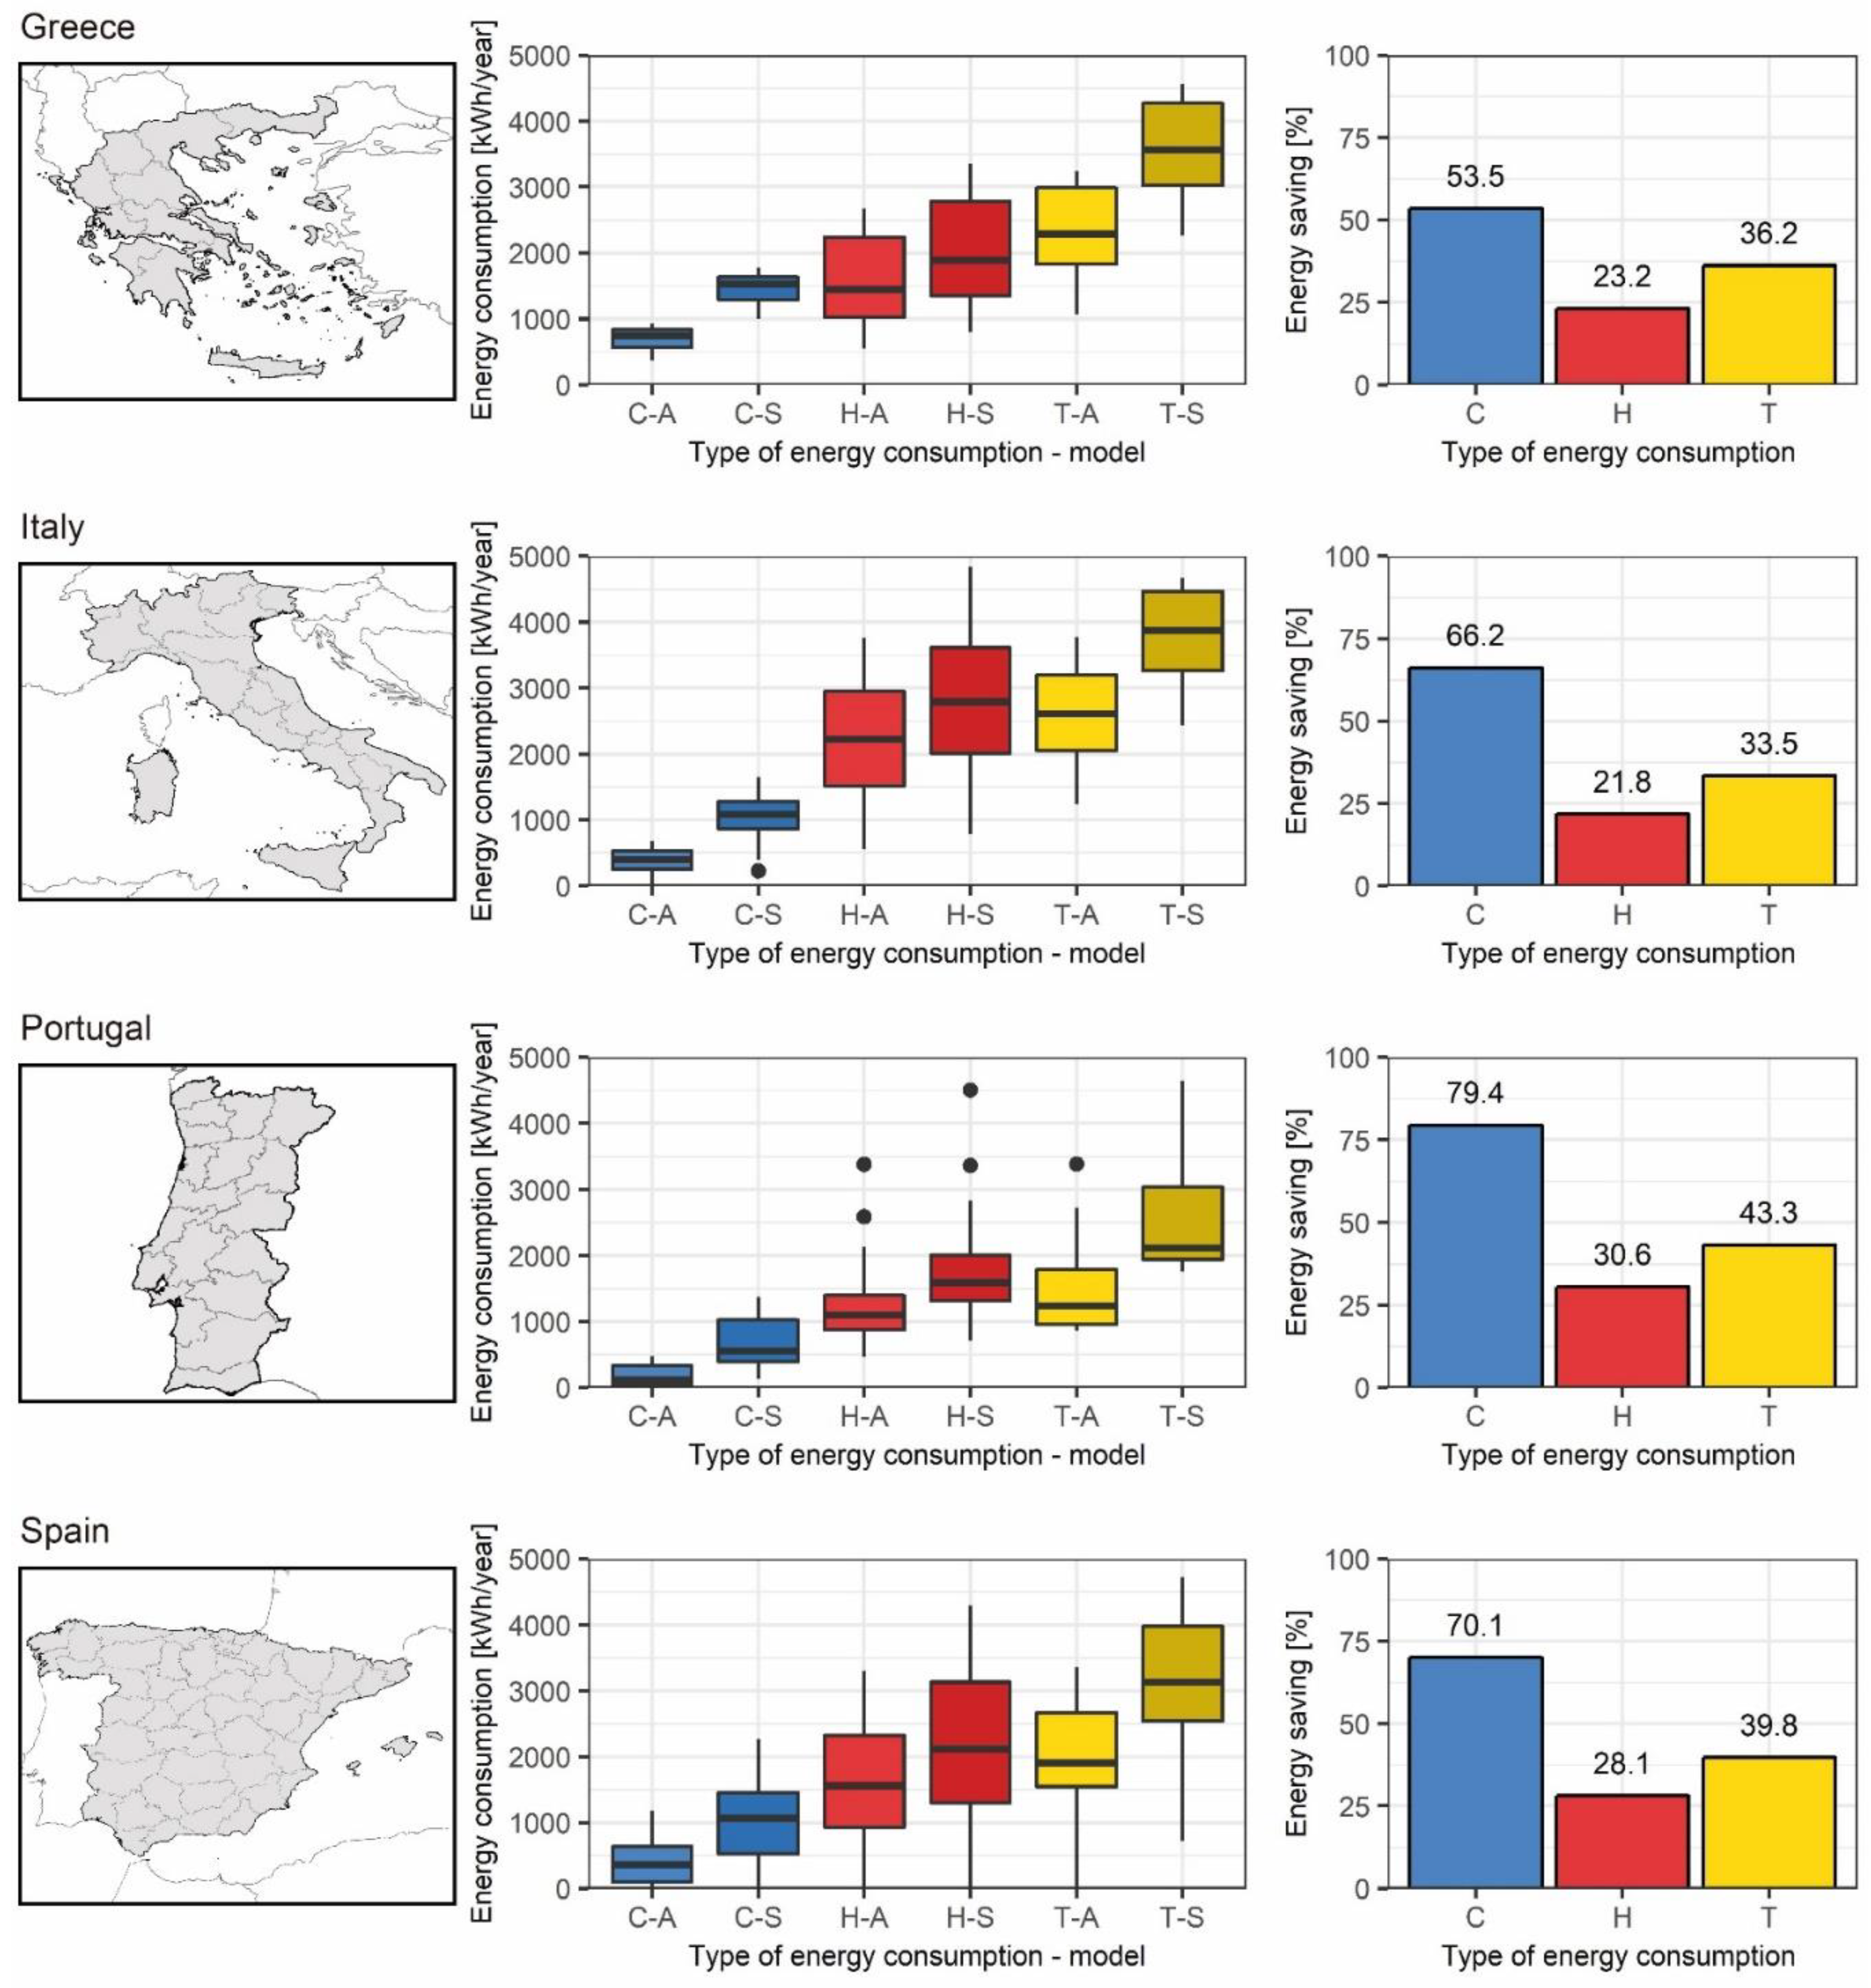
As mentioned in Section 3.1, the energy saving obtained by the adaptive model without tolerance was high. For this reason, it was interesting to analyze the possible differences of energy performance of the adaptive setpoint temperatures among the main cities of the four countries considered. Figure 10 shows the annual energy consumption distribution obtained in each country and the percentage average saving obtained. Table 5, Table 6, Table 7 and Table 8 represent the energy consumption savings obtained by the model with tolerance of 0.00 °C in each city. By using adaptive setpoint temperatures, the energy consumption decreased, with the same differences between cooling and heating discussed in the previous section. Although the results obtained in each city showed a greater energy saving in heating than in cooling, the lowest period assigned to the use of the cooling system stresses the potential of using adaptive setpoint temperatures to reduce the cooling energy consumption. Furthermore, the average percentage saving in the different countries shows a clear difference between cooling and heating energy consumption (see Figure 10): the cooling energy consumption had an average percentage saving greater than 50% in the four countries, whereas the heating average percentage saving was lower than 31%.
Despite the use of adaptive setpoint temperatures obtained reductions in both types of energy consumption, the energy saving varied according to the cities analyzed in each country. Similar tendencies were found in countries which are near each other: (i) Greece and Italy were characterized by presenting similar energy savings in the total consumption, ranging from 1142.51 and 1324.44 and 1337.54 kWh/year in the Italian cities; (ii) Spain and Portugal obtained similar tendencies in the total energy saving achieved, with oscillations between 684.04 and 418.59 kWh/year in the Spanish cities, and between 803.99 and 1264.57 kWh/year in the Portuguese cities. The greatest and the lowest energy-saving values were obtained in Spain because of the huge variety of existing climate typologies in the country which vary the potential of application of these energy-saving measures. The cities with a lower energy saving (e.g., La Coruña) were therefore characterized by presenting a low cooling energy consumption with the static model. Thus, although the application of the adaptive model practically removed the cooling consumption, its effect on the total energy consumption was low. Wang et al. [43] found that the analyzed North American cities with a colder climate had a lower percentage of energy savings than the cities with warmer climates. Likewise, the studies carried out by Sánchez-García et al. [42] and Bienvenido-Huertas et al. [44] showed that, among the cities analyzed, the energy savings obtained with the adaptive setpoint temperatures were always greater in the cities with a higher cooling energy demand.

3.3. Effect of the Climate Change Scenarios for 2050 and 2100

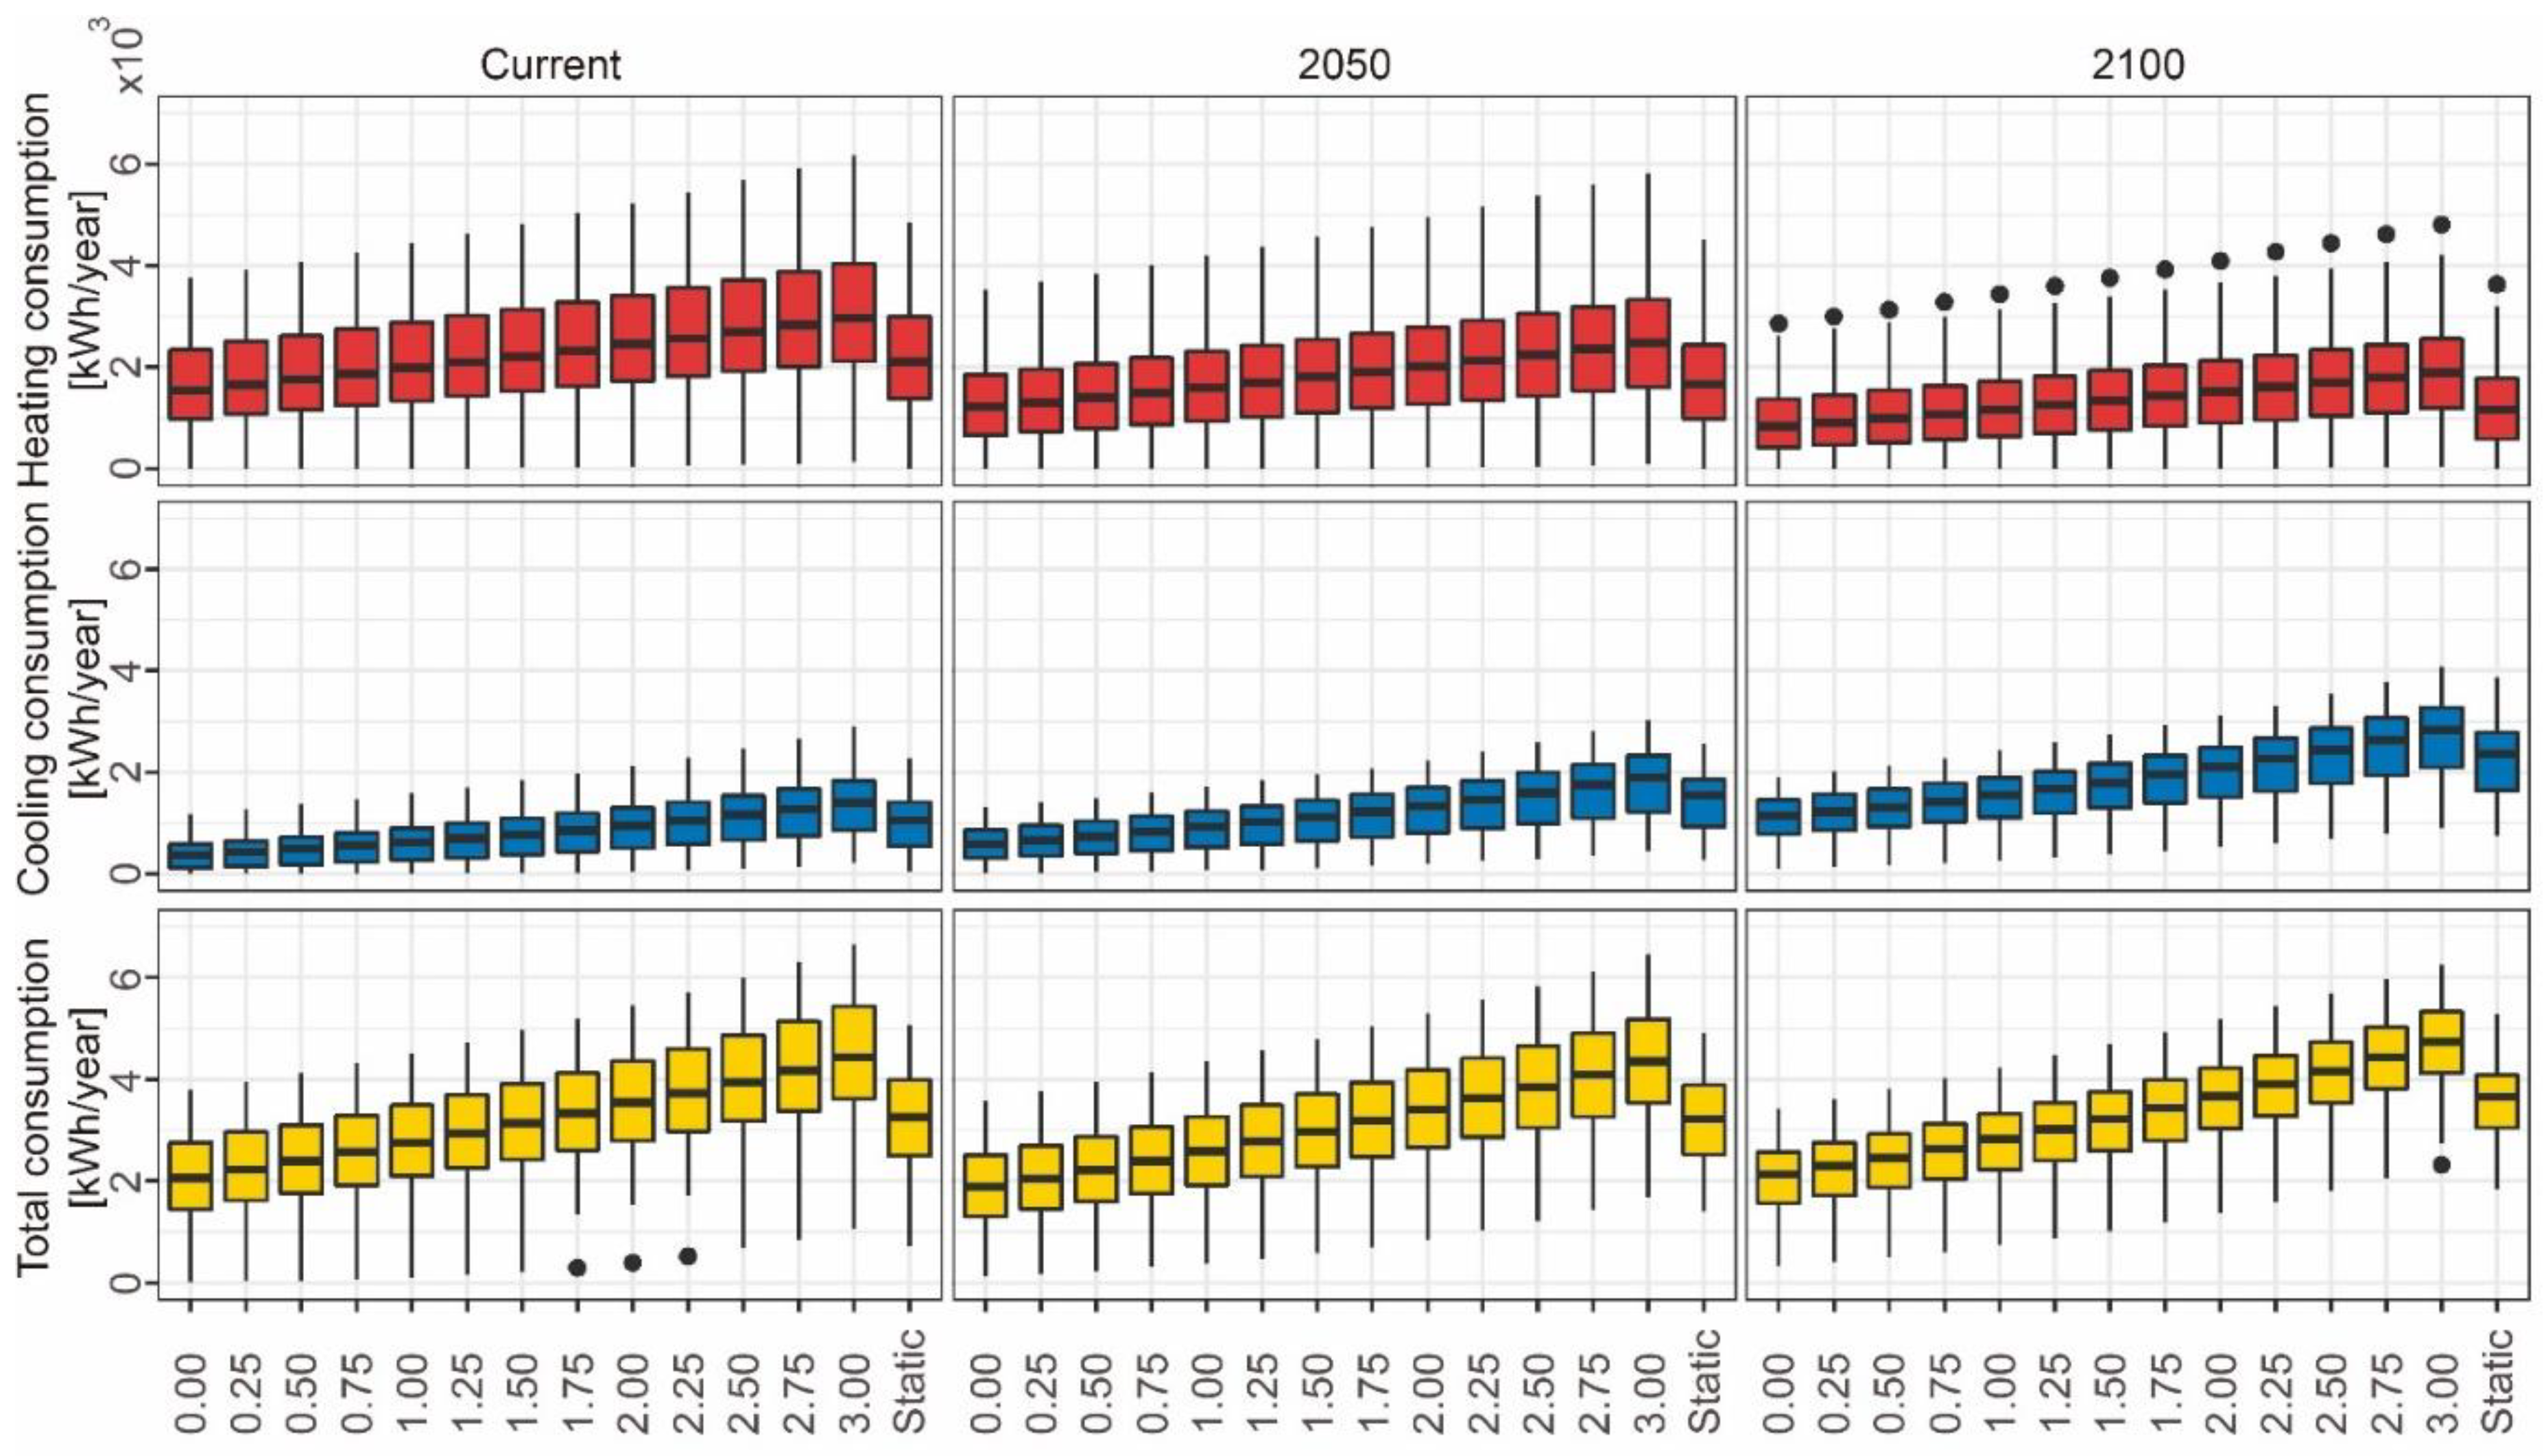
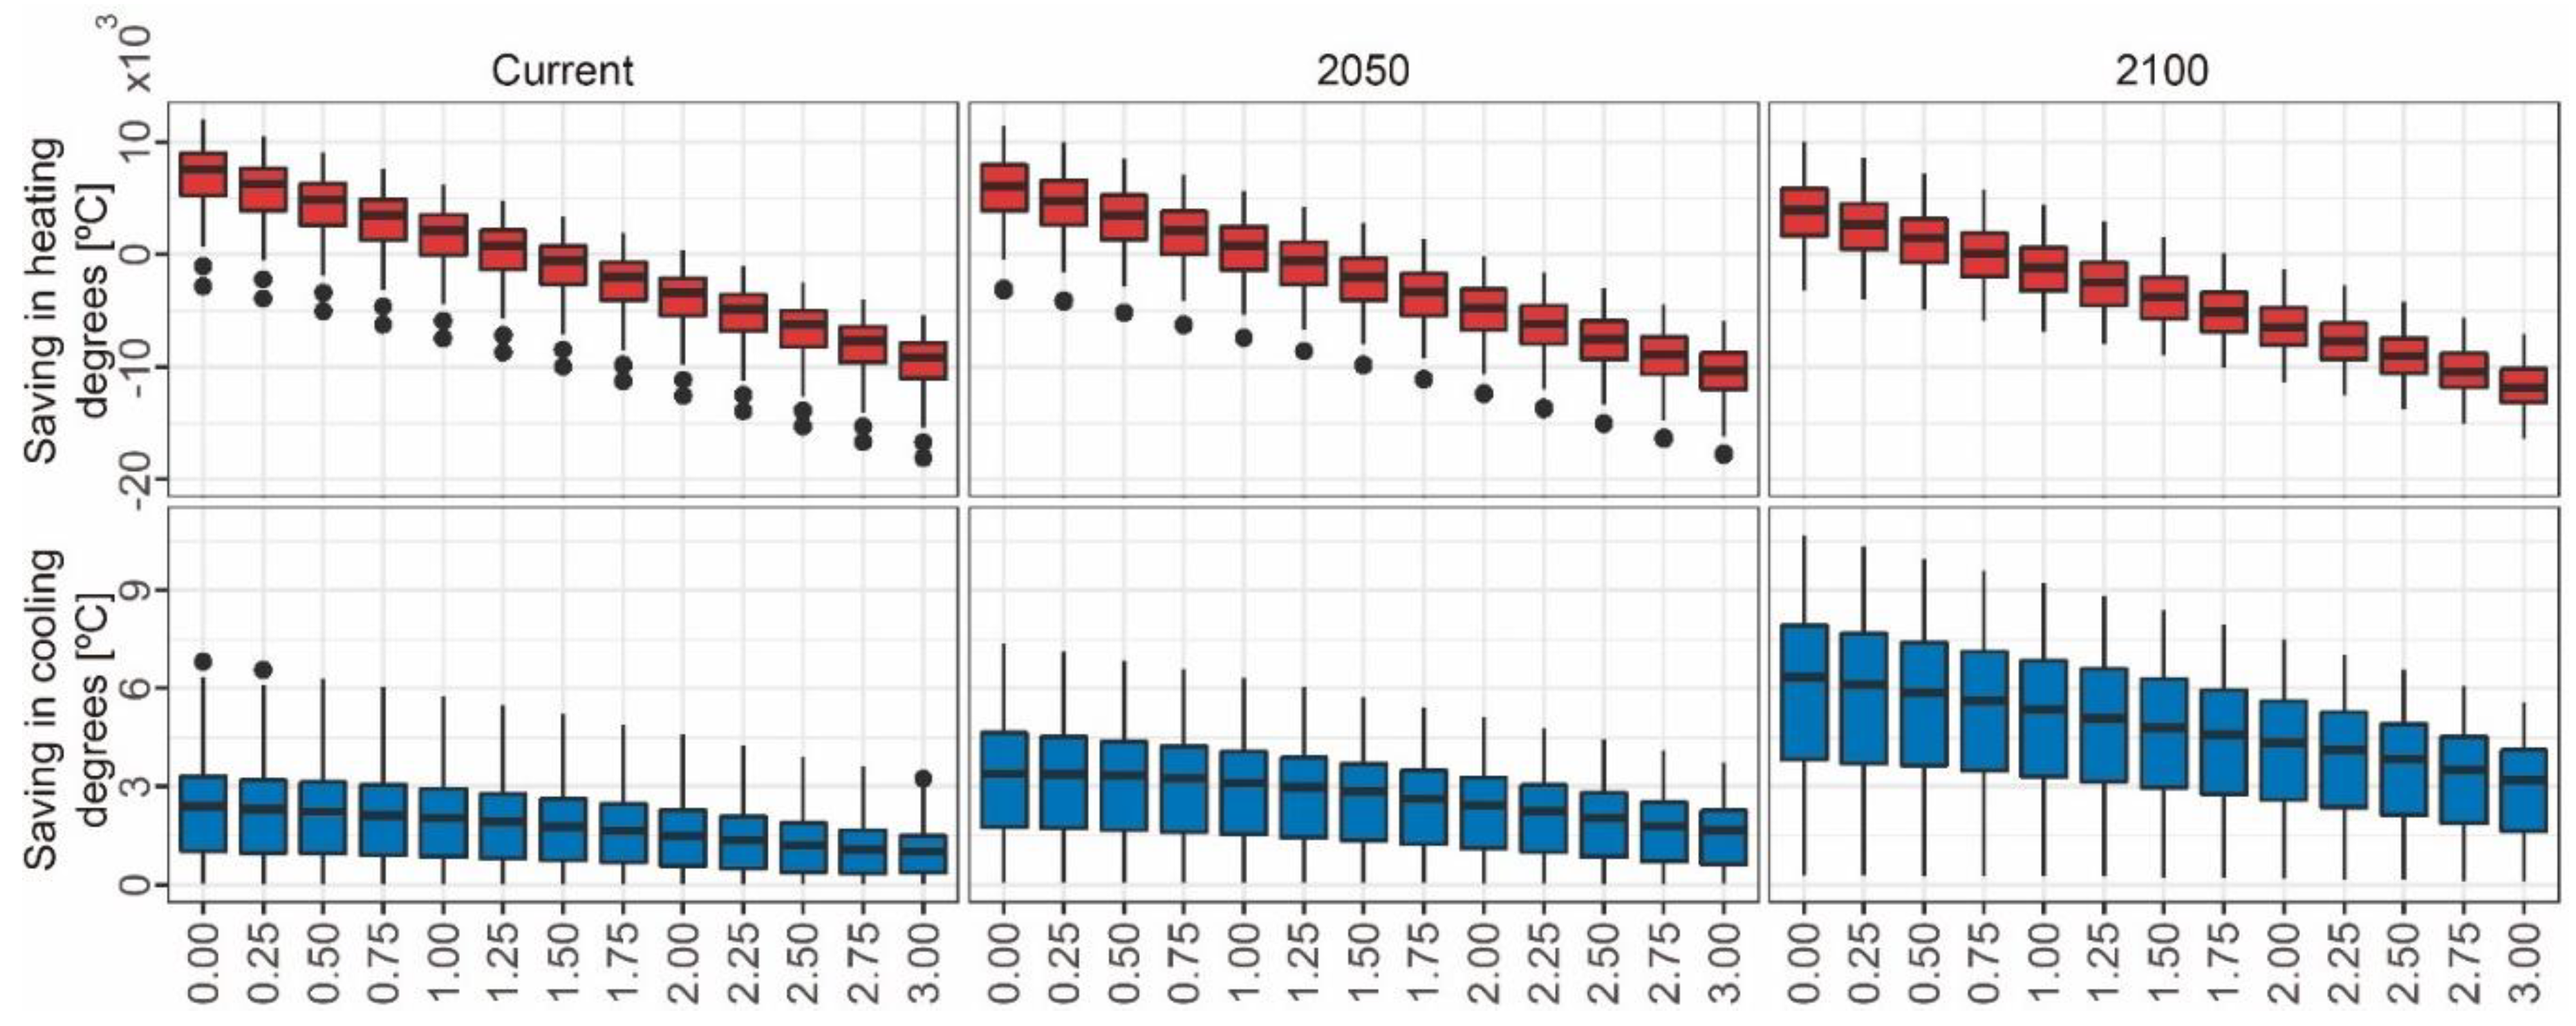
The effect of climate change slightly varied the application of adaptive models and the possibilities of thermal tolerance. Figure 11 and Figure 12 represent the energy consumption related to the different thermal models in both scenarios. To facilitate the comparisons, box-plots of the current scenario are represented. As can be seen, the progressive external temperature rise had different effects: (i) the heating consumption decreased with the future scenarios; (ii) the cooling consumption increased. In addition, the contribution of the cooling consumption is almost the same as that of the heating consumption at the end of the century. This aspect is important because, in the simulation process, the heating period was greater than the cooling period. A possible progressive increase in cooling periods throughout the 21st century could therefore imply a greater increase in cooling consumption. However, the adoption of an adaptive model leads to important savings in the total energy consumption with respect to an effective static model due to the progressive increase in saving in cooling degrees. Figure 13 represents the saving distributions in degrees with respect to the static model which were obtained in the different scenarios. The use of adaptive models implies considerable savings in cooling degrees. By using almost any adaptive model, savings in cooling degrees are achieved, although such saving is greater as lower is the level of thermal tolerance. It is important to consider that a rise in the level of thermal tolerance means a narrowing of the comfort zone in a total of 0.5 °C (i.e., the cooling setpoint value is reduced by 0.25 °C and the heating setpoint value is increased by 0.25 °C). Heating and cooling degrees is the difference between the external temperature and the setpoint temperature, in which a value of 20 °C is generally used. However, this study analyzes the saving in heating and cooling degrees by comparing the difference between the static and the adaptive model. In such way, instead of using 20 °C as a reference, the static model is used and compared with the adaptive model. A saving in degrees would therefore imply that it could be an energy saving depending on the climate of the zone. Furthermore, this saving in cooling degrees presents a progressive increase throughout the 21st century due to the rise in external temperatures. This tendency, however, is not reflected in the total energy consumption due to the saving in heating degrees. While a high saving in heating degrees is achieved with low tolerances, the increase in tolerance means a progressive loss of the saving in heating degrees, even increasing heating degrees with respect to the static model.
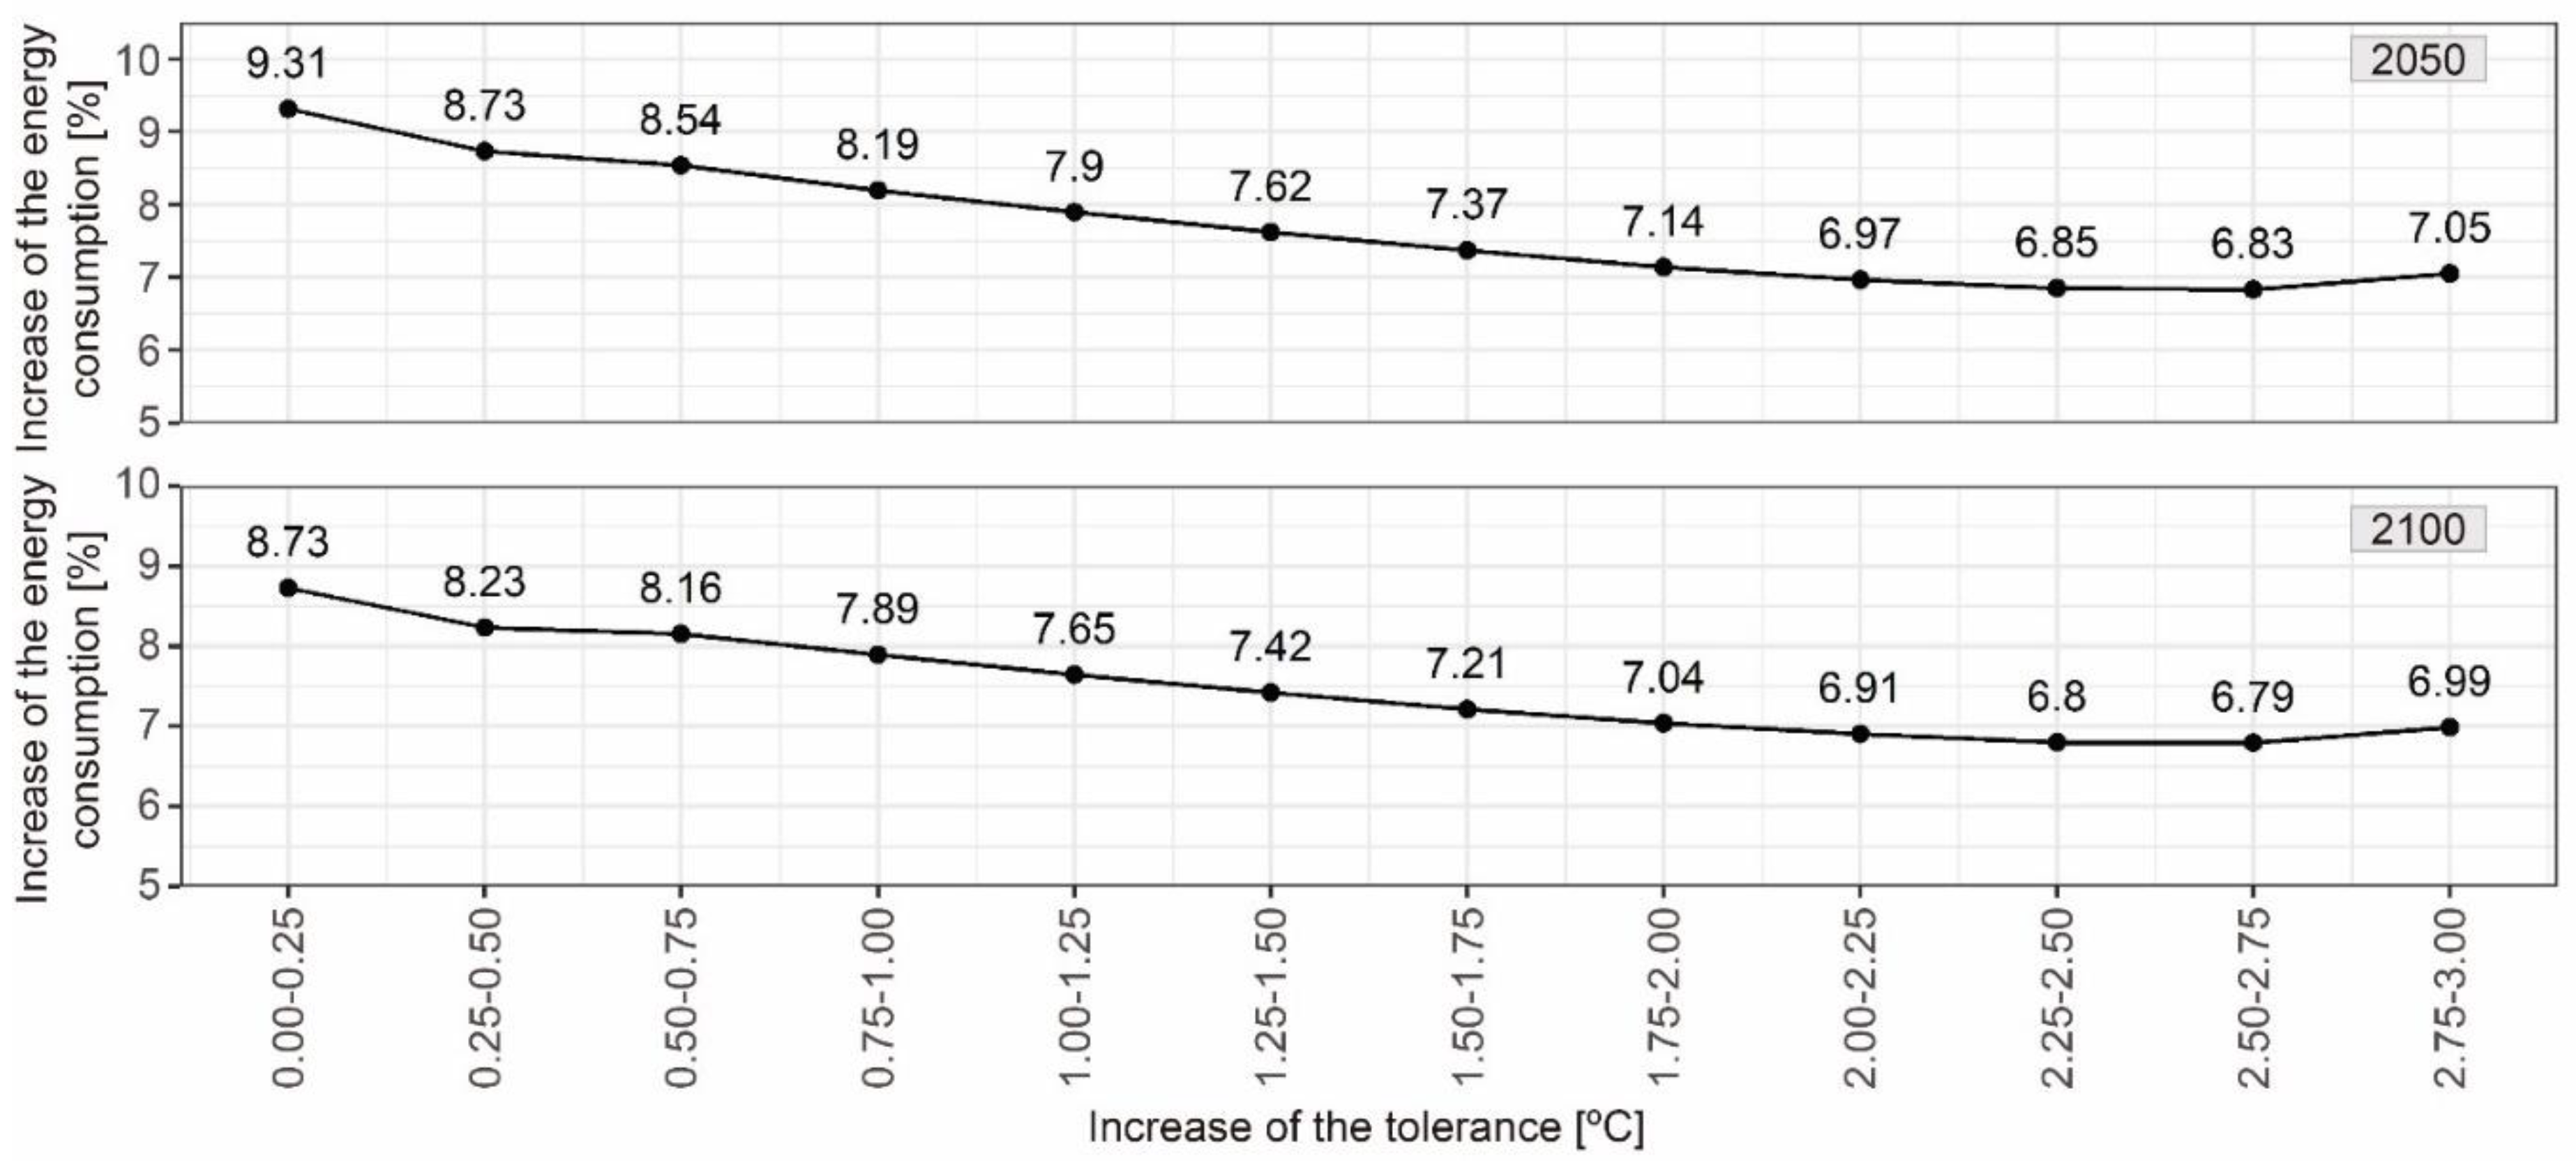
The rise in external temperatures throughout the 21st century implies that the maximum tolerance interval from which the energy consumption is worse than that of the static model increases. Table 9 represents the average increase or decrease percentages of the energy consumption. The maximum thermal tolerance interval, from which a decrease in total energy consumption is obtained, went from 1.50 °C in the current scenario to 1.75 °C in 2050 and 2100 because of the progressive importance of the cooling consumption and of its potential of energy saving with respect to the static setpoint temperature of 26 °C. Moreover, the rise in thermal tolerance in 0.25 °C in 2050 and in 2100 presents similar tendencies of percentage increase to those obtained in the current scenario, with an increase between 6.83 and 9.31% in 2050 and between 6.79 and 8.73% in 2100. As a result, the improvement in users’ thermal expectations always presents a similar increase tendency of the building energy consumption, although the energy-saving percentages with respect to a static behavior could vary with respect to the future climate change scenarios.
A greater awareness of users about the need to establish adaptive limits without tolerance in the use of HVAC systems would therefore ensure both a more sustainable energy performance of buildings and acceptable thermal conditions inside them according to the existing standards of adaptive thermal comfort. However, presumably the possible energy savings achieved with this strategy can be increased by using natural ventilation. In this regard, one of the limitations of the study is that the maintenance of comfort hours is based on the use of HVAC systems. The combined use of adaptive setpoint temperatures with natural ventilation would imply higher savings in the energy consumption of residential buildings. Therefore, the combination of natural ventilation and adaptive setpoint temperatures should be studied in future research studies.

4. Conclusions

This paper analyzed the influence of the improvement in users’ thermal expectation levels by using adaptive setpoint temperatures. The analysis was based on the category for new buildings included in EN 16798-1:2019 and was conducted in an international context by analyzing the main cities of four countries of southern Europe and in three different climate scenarios. The results based on 4116 simulations showed the following aspects:
-
The use of adaptive thermal comfort models with a tolerance of 0.00 °C led to significant energy consumption savings with respect to a highly effective static model. The improvement in users’ expectation level implied that, from the narrowing of the comfort zone in 3 °C (i.e., applying the model with a tolerance of 1.50 °C), there were no savings in the energy consumption with respect to the static model. However, this tendency was different according to the type of consumption analyzed, demonstrating that the cooling energy consumption had a greater possibility of tolerance. This aspect would imply that, in certain moments, users do not need to set the internal spaces with the linear correlations from EN 16798-1:2019 when the running mean outdoor temperature is near or greater than 30 °C.
-
The application of strategies of adaptive setpoint temperatures for new buildings obtained energy savings greater than 1000 kWh/year in most cities analyzed. Furthermore, there were similar energy-saving tendencies among the countries which were near each other. In this regard, the energy saving was similar between Greece and Italy, and between Spain and Portugal. Spain was the country which was characterized by presenting the greatest and the lowest energy-saving values due to the huge variety of existing climate typologies in the countries, some of which were characterized by a minimum energy demand with the static model.
-
The progressive improvement in users’ thermal expectations in 0.25 °C implied a rise with respect to the energy consumption obtained in the previous tolerance level between 6.57 and 9.31% in all the scenarios analyzed.
-
In future climate change scenarios, the rise in external temperatures meant that the saving in cooling degrees with respect to the static model increased, thus implying that the maximum tolerance, from which an energy saving was obtained with respect to the static model, increased from 1.50 °C of the current scenario to 1.75 °C of future scenarios. This aspect is useful to corroborate the possibilities of using a less demanding upper limit when average external temperatures are near or higher than 30 °C.
To conclude, the results of this research give greater knowledge about the possibilities of using adaptive setpoint temperatures and the possible impact the improvement in users’ thermal expectations. The research results may provide an opportunity for architects or engineers to establish operational patterns of the most efficient HVAC systems. Furthermore, local governments can design user awareness campaigns to recommend a more appropriate use of HVAC systems by family units. Due to the possible influence of users, further steps of this research will be focused on performing actual monitoring of users using adaptive setpoint temperatures. In addition, the analysis of the combination of adaptive setpoint temperatures and natural ventilation would imply an adaptive strategy framework for mixed-mode buildings. Finally, the case studies from other continents or regions (e.g., United States of America or China) should be analyzed in future works.

Author Contributions

Conceptualization, methodology, investigation, writing—original draft preparation, and editing and visualization, D.B.-H., D.S.-G., C.R.-B. and J.A.P.-A. All authors have read and agreed to the published version of the manuscript.

Funding

This research received no external funding.

Conflicts of Interest

The authors declare no conflict of interest.

Nomenclature

A2climate change scenario
ASHRAEAmerican Society of Heating Refrigerating and Air-Conditioning Engineers
COPCoefficient of Performance
EEREnergy Efficiency Ratio
EPWEnergyPlus Weather
HVACHeating, Ventilation, and Air Conditioning
SHGCSolar Heat Gain Coefficient
T e x t , d a y daily mean external temperature [°C]
T r m running mean outdoor temperature [°C]
VRFVariable Refrigerant Flow

References

  1. European Commission. A Roadmap for Moving to a Competitive Low Carbon Economy in 2050; European Commission: Brussels, Belgium, 2011; pp. 1–15. [Google Scholar]
  2. Intergovernmental Panel on Climate Change (Ed.) Climate Change 2014: Synthesis Report. Contribution of Working Groups I, II and III to the Fifth Assessment Report of the Intergovernmental Panel on Climate Change; Cambridge University Press: Cambridge, UK, 2014.
  3. Bienvenido-Huertas, D.; Pérez-Fargallo, A.; Alvarado-Amador, R.; Rubio-Bellido, C. Influence of climate on the creation of multilayer perceptrons to analyse the risk of fuel poverty. Energy Build. 2019, 198, 38–60. [Google Scholar] [CrossRef]
  4. Pérez-Fargallo, A.; Rubio-Bellido, C.; Pulido-Arcas, J.A.; Trebilcock, M. Development policy in social housing allocation: Fuel poverty potential risk index. Indoor Built Environ. 2017, 26, 980–998. [Google Scholar] [CrossRef]
  5. Castaño-Rosa, R.; Solís-Guzmán, J.; Marrero, M. A novel Index of Vulnerable Homes: Findings from application in Spain. Indoor Built Environ. 2020, 29, 311–330. [Google Scholar] [CrossRef]
  6. Liddell, C.; Morris, C.; Thomson, H.; Guiney, C. Excess winter deaths in 30 European countries 1980–2013: A critical review of methods. J. Public Health 2016, 38, 806–814. [Google Scholar] [CrossRef] [Green Version]
  7. Teller-Elsberg, J.; Sovacool, B.; Smith, T.; Laine, E. Fuel poverty, excess winter deaths, and energy costs in Vermont: Burdensome for whom? Energy Policy 2016, 90, 81–91. [Google Scholar] [CrossRef] [Green Version]
  8. Kurekci, N.A. Determination of optimum insulation thickness for building walls by using heating and cooling degree-day values of all Turkey’s provincial centers. Energy Build. 2016, 118, 197–213. [Google Scholar] [CrossRef]
  9. Vine, E.L.; Kazakevicius, E. Residential energy use in Lithuania: The prospects for energy efficiency. Energy 1999, 24, 591–603. [Google Scholar] [CrossRef] [Green Version]
  10. Au-Yong, C.P.; Ali, A.S.; Ahmad, F. Improving occupants’ satisfaction with effective maintenance management of HVAC system in office buildings. Autom. Constr. 2014, 43, 31–37. [Google Scholar] [CrossRef] [Green Version]
  11. Cho, J.; Kim, Y.; Koo, J.; Park, W. Energy-cost analysis of HVAC system for office buildings: Development of a multiple prediction methodology for HVAC system cost estimation. Energy Build. 2018, 173, 562–576. [Google Scholar] [CrossRef]
  12. Echarri, V. Thermal ceramic panels and passive systems in mediterranean housing: Energy savings and environmental impacts. Sustainability 2017, 9, 1613. [Google Scholar] [CrossRef] [Green Version]
  13. Aksoy, U.T.; Inalli, M. Impacts of some building passive design parameters on heating demand for a cold region. Build. Environ. 2006, 41, 1742–1754. [Google Scholar] [CrossRef]
  14. Invidiata, A.; Lavagna, M.; Ghisi, E. Selecting design strategies using multi-criteria decision making to improve the sustainability of buildings. Build. Environ. 2018, 139, 58–68. [Google Scholar] [CrossRef]
  15. Stern, P.C.; Janda, K.B.; Brown, M.A.; Steg, L.; Vine, E.L.; Lutzenhiser, L. Opportunities and insights for reducing fossil fuel consumption by households and organizations. Nat. Energy 2016, 1, 16043. [Google Scholar] [CrossRef]
  16. Echarri-Iribarren, V.; Rizo-Maestre, C.; Sanjuan-Palermo, J.L. Underfloor heating using ceramic thermal panels and solar thermal panels in public buildings in the Mediterranean: Energy savings and healthy indoor environment. Appl. Sci. 2019, 9, 2089. [Google Scholar] [CrossRef] [Green Version]
  17. Ruth, C.E.; Byrne, R.; Hewitt, N.J.; MacArtain, P. Electricity autoproduction, storage and billing: A case study at Dundalk Institute of Technology, Ireland. Sustain. Energy Technol. Assess. 2019, 35, 257–264. [Google Scholar] [CrossRef]
  18. Allouhi, A.; El Fouih, Y.; Kousksou, T.; Jamil, A.; Zeraouli, Y.; Mourad, Y. Energy consumption and efficiency in buildings: Current status and future trends. J. Clean. Prod. 2015, 109, 118–130. [Google Scholar] [CrossRef]
  19. Ueno, T.; Sano, F.; Saeki, O.; Tsuji, K. Effectiveness of an energy-consumption information system on energy savings in residential houses based on monitored data. Appl. Energy 2006, 83, 166–183. [Google Scholar] [CrossRef]
  20. Papadopoulos, S.; Kontokosta, C.E.; Vlachokostas, A.; Azar, E. Rethinking HVAC temperature setpoints in commercial buildings: The potential for zero-cost energy savings and comfort improvement in different climates. Build. Environ. 2019, 155, 350–359. [Google Scholar] [CrossRef]
  21. Parkinson, T.; de Dear, R.; Brager, G. Nudging the adaptive thermal comfort model. Energy Build. 2020, 206, 109559. [Google Scholar] [CrossRef]
  22. Ren, Z.; Chen, D. Modelling study of the impact of thermal comfort criteria on housing energy use in Australia. Appl. Energy 2018, 210, 152–166. [Google Scholar] [CrossRef]
  23. Lakeridou, M.; Ucci, M.; Marmot, A.; Ridley, I. The potential of increasing cooling set-points in air-conditioned offices in the UK. Appl. Energy 2012, 94, 338–348. [Google Scholar] [CrossRef]
  24. Hoyt, T.; Arens, E.; Zhang, H. Extending air temperature setpoints: Simulated energy savings and design considerations for new and retrofit buildings. Build. Environ. 2014, 88, 89–96. [Google Scholar] [CrossRef] [Green Version]
  25. Spyropoulos, G.N.; Balaras, C.A. Energy consumption and the potential of energy savings in Hellenic office buildings used as bank branches—A case study. Energy Build. 2011, 43, 770–778. [Google Scholar] [CrossRef]
  26. Fernandez, N.; Katipamula, S.; Wang, W.; Huang, Y.; Liu, G. Energy savings modelling of re-tuning energy conservation measures in large office buildings. J. Build. Perform. Simul. 2015, 8, 391–407. [Google Scholar] [CrossRef]
  27. Parry, M.L.; Canziani, O.F.; Palutikof, J.P.; van der Linden, P.J.; Hanson, C.E. Contribution of Working Group II to the Fourth Assessment Report of the Intergovernmental Panel on Climate Change; Cambridge University Press: Cambridge, UK, 2007. [Google Scholar]
  28. Saidur, R. Energy consumption, energy savings, and emission analysis in Malaysian office buildings. Energy Policy 2009, 37, 4104–4113. [Google Scholar] [CrossRef]
  29. Yamtraipat, N.; Khedari, J.; Hirunlabh, J.; Kunchornrat, J. Assessment of Thailand indoor set-point impact on energy consumption and environment. Energy Policy 2006, 34, 765–770. [Google Scholar] [CrossRef]
  30. Moon, J.W.; Han, S.H. Thermostat strategies impact on energy consumption in residential buildings. Energy Build. 2011, 43, 338–346. [Google Scholar] [CrossRef]
  31. Mishra, A.K.; Ramgopal, M. Field studies on human thermal comfort—An overview. Build. Environ. 2013, 64, 94–106. [Google Scholar] [CrossRef]
  32. Van Hoof, J. Forty years of Fanger’s model of thermal comfort: Comfort for all? Indoor Air 2008, 18, 182–201. [Google Scholar] [CrossRef]
  33. Rupp, R.F.; Vásquez, N.G.; Lamberts, R. A review of human thermal comfort in the built environment. Energy Build. 2015, 105, 178–205. [Google Scholar] [CrossRef]
  34. Nicol, J.F.; Humphreys, M.A. Adaptive thermal comfort and sustainable thermal standards for buildings. Energy Build. 2002, 34, 563–572. [Google Scholar] [CrossRef]
  35. Wong, N.H.; Feriadi, H.; Lim, P.Y.; Tham, K.W.; Sekhar, C.; Cheong, K.W. Thermal comfort evaluation of naturally ventilated public housing in Singapore. Build. Environ. 2002, 37, 1267–1277. [Google Scholar] [CrossRef]
  36. Ye, X.J.; Zhou, Z.P.; Lian, Z.W.; Liu, H.M.; Li, C.Z.; Liu, Y.M. Field study of a thermal environment and adaptive model in Shanghai. Indoor Air 2006, 16, 320–326. [Google Scholar] [CrossRef]
  37. van der Linden, A.C.; Boerstra, A.C.; Raue, A.K.; Kurvers, S.R.; De Dear, R.J. Adaptive temperature limits: A new guideline in the Netherlands: A new approach for the assessment of building performance with respect to thermal indoor climate. Energy Build. 2006, 38, 8–17. [Google Scholar] [CrossRef]
  38. Boerstra, A.C.; van Hoof, J.; van Weele, A.M. A new hybrid thermal comfort guideline for the Netherlands: Background and development. Archit. Sci. Rev. 2015, 58, 24–34. [Google Scholar] [CrossRef]
  39. Yun, G.Y.; Lee, J.H.; Steemers, K. Extending the applicability of the adaptive comfort model to the control of air-conditioning systems. Build. Environ. 2016, 105, 13–23. [Google Scholar] [CrossRef] [Green Version]
  40. Sánchez-Guevara Sánchez, C.; Mavrogianni, A.; Neila González, F.J. On the minimal thermal habitability conditions in low income dwellings in Spain for a new definition of fuel poverty. Build. Environ. 2017, 114, 344–356. [Google Scholar] [CrossRef]
  41. American Society of Heating Refrigerating and Air Conditioning Engineers. ASHRAE Standard 55-2017 Thermal Environmental Conditions for Human Occupancy; American Society of Heating Refrigerating and Air Conditioning Engineers: Atlanta, GA, USA, 2017. [Google Scholar]
  42. Sánchez-García, D.; Bienvenido-Huertas, D.; Tristancho-Carvajal, M.; Rubio-Bellido, C. Adaptive Comfort Control Implemented Model (ACCIM) for Energy Consumption Predictions in Dwellings under Current and Future Climate Conditions: A Case Study Located in Spain. Energies 2019, 12, 1498. [Google Scholar] [CrossRef] [Green Version]
  43. Wang, C.; Pattawi, K.; Lee, H. Energy saving impact of occupancy-driven thermostat for residential buildings. Energy Build. 2020, 211, 109791. [Google Scholar] [CrossRef]
  44. Bienvenido-Huertas, D.; Sánchez-García, D.; Pérez-Fargallo, A.; Rubio-Bellido, C. Optimization of energy saving with adaptive setpoint temperatures by calculating the prevailing mean outdoor air temperature. Build. Environ. 2020, 170, 106612. [Google Scholar] [CrossRef]
  45. Luo, M.; Wang, Z.; Brager, G.; Cao, B.; Zhu, Y. Indoor climate experience, migration, and thermal comfort expectation in buildings. Build. Environ. 2018, 141, 262–272. [Google Scholar] [CrossRef] [Green Version]
  46. European Committee for Standardization. EN 15251:2007 Indoor Environmental Input Parameters for Design and Assessment of Energy Performance of Buildings Addressing Indoor Quality, Thermal Environment, Lighting and Acoustics; European Committee for Standardization: Brussels, Belgium, 2007. [Google Scholar]
  47. European Committee for Standardization. EN 16798-1:2019 Energy Performance of Buildings—Ventilation for Buildings—Part 1: Indoor Environmental Input Parameters for Design and Assessment of Energy Performance of Buildings Addressing Indoor Air Quality, Thermal Environment, Lighting and Acous; European Committee for Standardization: Brussels, Belgium, 2019. [Google Scholar]
  48. Sánchez-García, D.; Rubio-Bellido, C.; Tristancho, M.; Marrero, M. A comparative study on energy demand through the adaptive thermal comfort approach considering climate change in office buildings of Spain. Build. Simul. 2020, 13, 51–63. [Google Scholar] [CrossRef]
  49. Bienvenido-Huertas, D.; Rubio-Bellido, C.; Pérez-Fargallo, A.; Pulido-Arcas, J.A. Energy saving potential in current and future world built environments based on the adaptive comfort approach. J. Clean. Prod. 2020, 249, 119306. [Google Scholar] [CrossRef]
  50. Mi, Z.; Guan, D.; Liu, Z.; Liu, J.; Viguié, V.; Fromer, N.; Wang, Y. Cities: The core of climate change mitigation. J. Clean. Prod. 2019, 207, 582–589. [Google Scholar] [CrossRef]
  51. Marvuglia, A.; Havinga, L.; Heidrich, O.; Fonseca, J.; Gaitani, N.; Reckien, D. Advances and challenges in assessing urban sustainability: An advanced bibliometric review. Renew. Sustain. Energy Rev. 2020, 124, 109788. [Google Scholar] [CrossRef]
  52. Hellenic Parliament. Ν. 3852/2010, New Architecture of Local Government and Decentralized Administration-Kallikratis Program; Hellenic Parliament: Athens, Greece, 2010. [Google Scholar]
  53. METEONORM. Handbook Part II: Theory (Version 7.3.1); METEONORM: Bern, Switzerland, 2019. [Google Scholar]
  54. Nakićenović, N.; Swart, R. Special Report on Emissions Scenarios. A Special Report of Working Group III of the Intergovernmental Panel on Climate Change; Cambridge University Press: Cambridge, UK, 2000; ISBN 0 521 80081 1. [Google Scholar]
  55. Nematchoua, M.K.; Orosa, J.A.; Reiter, S. Climate change: Variabilities, vulnerabilities and adaptation analysis—A case of seven cities located in seven countries of Central Africa. Urban Clim. 2019, 29, 100486. [Google Scholar] [CrossRef]
  56. Verichev, K.; Zamorano, M.; Carpio, M. Effects of climate change on variations in climatic zones and heating energy consumption of residential buildings in the southern Chile. Energy Build. 2020, 215, 109874. [Google Scholar] [CrossRef]
  57. Ciancio, V.; Salata, F.; Falasca, S.; Curci, G.; Golasi, I.; de Wilde, P. Energy demands of buildings in the framework of climate change: An investigation across Europe. Sustain. Cities Soc. 2020, 154244. [Google Scholar] [CrossRef]
  58. Roetzel, A.; Tsangrassoulis, A.; Dietrich, U. Impact of building design and occupancy on office comfort and energy performance in different climates. Build. Environ. 2014, 71, 165–175. [Google Scholar] [CrossRef]
  59. Mourshed, M. The impact of the projected changes in temperature on heating and cooling requirements in buildings in Dhaka, Bangladesh. Appl. Energy 2011, 88, 3737–3746. [Google Scholar] [CrossRef] [Green Version]
  60. Invidiata, A.; Ghisi, E. Impact of climate change on heating and cooling energy demand in houses in Brazil. Energy Build. 2016, 130, 20–32. [Google Scholar] [CrossRef]
  61. Triana, M.A.; Lamberts, R.; Sassi, P. Should we consider climate change for Brazilian social housing? Assessment of energy efficiency adaptation measures. Energy Build. 2018, 158, 1379–1392. [Google Scholar] [CrossRef] [Green Version]
  62. Shen, P.; Lior, N. Vulnerability to climate change impacts of present renewable energy systems designed for achieving net-zero energy buildings. Energy 2016, 114, 1288–1305. [Google Scholar] [CrossRef]
  63. Shen, P. Impacts of climate change on U.S. building energy use by using downscaled hourly future weather data. Energy Build. 2017, 134, 61–70. [Google Scholar] [CrossRef]
  64. Robert, A.; Kummert, M. Designing net-zero energy buildings for the future climate, not for the past. Build. Environ. 2012, 55, 150–158. [Google Scholar] [CrossRef]
  65. Bienvenido-Huertas, D.; Oliveira, M.; Rubio-Bellido, C.; Marín, D. A Comparative Analysis of the International Regulation of Thermal Properties in Building Envelope. Sustainability 2019, 11, 5574. [Google Scholar] [CrossRef] [Green Version]
  66. Grazieschi, G.; Gori, P.; Lombardi, L.; Asdrubali, F. Life cycle energy minimization of autonomous buildings. J. Build. Eng. 2020, 30, 101229. [Google Scholar] [CrossRef]
  67. Rossi, M.; Rocco, V.M. External walls design: The role of periodic thermal transmittance and internal areal heat capacity. Energy Build. 2014, 68, 732–740. [Google Scholar] [CrossRef]
  68. Rodrigues, E.; Fernandes, M.S.; Gaspar, A.R.; Gomes, Á.; Costa, J.J. Thermal transmittance effect on energy consumption of Mediterranean buildings with different thermal mass. Appl. Energy 2019, 252, 113437. [Google Scholar] [CrossRef]
  69. Fernandes, M.S.; Rodrigues, E.; Gaspar, A.R.; Costa, J.J.; Gomes, Á. The impact of thermal transmittance variation on building design in the Mediterranean region. Appl. Energy 2019, 239, 581–597. [Google Scholar] [CrossRef] [Green Version]
  70. Jiru, T.E. Combining HVAC energy conservation measures to achieve energy savings over standard requirements. Energy Build. 2014, 73, 171–175. [Google Scholar] [CrossRef]
  71. Abediniangerabi, B.; Shahandashti, S.M.; Bell, B.; Chao, S.H.; Makhmalbaf, A. Building energy performance analysis of ultra-high-performance fiber-reinforced concrete (UHP-FRC) façade systems. Energy Build. 2018, 174, 262–275. [Google Scholar] [CrossRef]
  72. Kim, D.; Cox, S.J.; Cho, H.; Im, P. Evaluation of energy savings potential of variable refrigerant flow (VRF) from variable air volume (VAV) in the U.S. climate locations. Energy Rep. 2017, 3, 85–93. [Google Scholar] [CrossRef]
  73. O’Neill, Z.; Niu, F. Uncertainty and sensitivity analysis of spatio-temporal occupant behaviors on residential building energy usage utilizing Karhunen-Loève expansion. Build. Environ. 2017, 115, 157–172. [Google Scholar] [CrossRef]
  74. Shishegar, N.; Boubekri, M. Quantifying electrical energy savings in offices through installing daylight responsive control systems in hot climates. Energy Build. 2017, 153, 87–98. [Google Scholar] [CrossRef]
  75. Sardoueinasab, Z.; Yin, P.; O’Neal, D. Energy modeling and analysis of inherent air leakage from parallel fan-powered terminal units using EMS in EnergyPlus. Energy Build. 2018, 176, 109–119. [Google Scholar] [CrossRef]
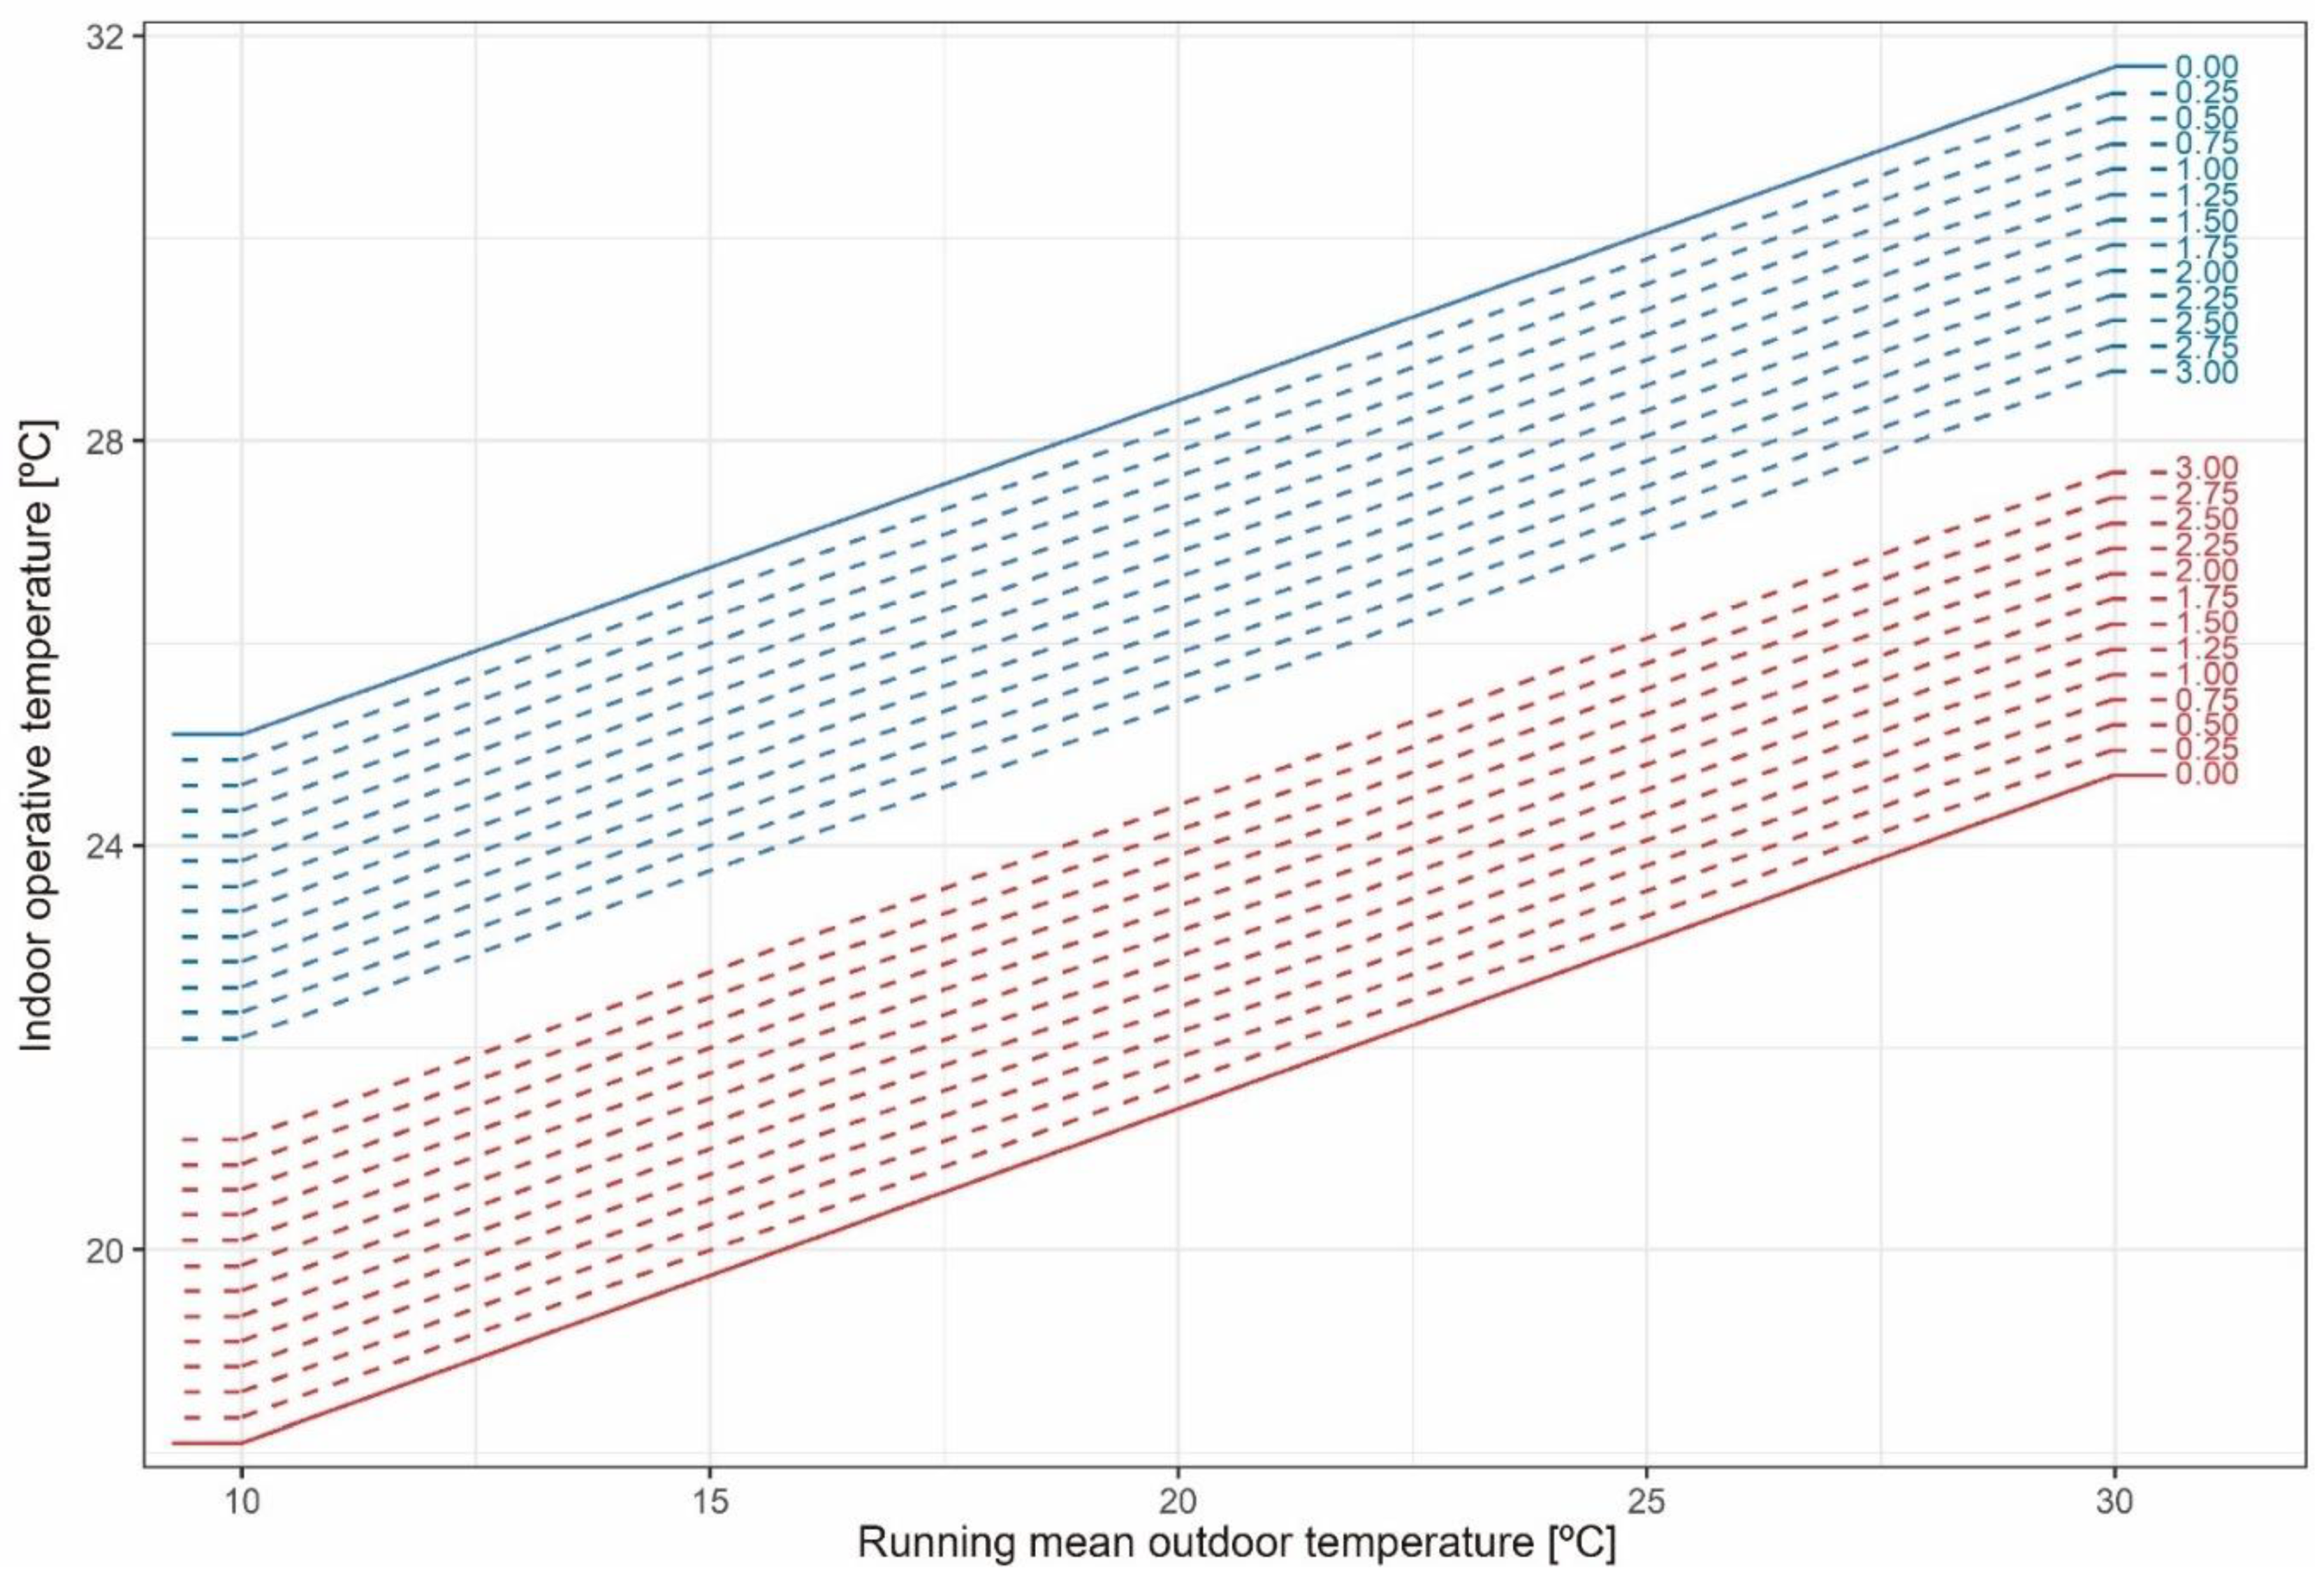
Figure 1. Limit values of the adaptive thermal comfort model for new buildings from EN 16798-1:2019 and the analyzed tolerances. Dashed lines show the tolerances considered.
Applsci 10 05282 g001
Figure 2. Countries considered.
Applsci 10 05282 g002
Figure 3. Examples of the internal operative temperature obtained in the current scenario in the city of Seville with adaptive models with tolerance of 0.00, 1.50, and 3.00 °C, and the static model. The heating setpoint temperature is represented in red line, and the cooling setpoint temperature in blue line.
Applsci 10 05282 g003
Figure 4. Scheme of the model of the case study designed.
Applsci 10 05282 g004
Figure 5. Hourly distribution of loads.
Applsci 10 05282 g005
Figure 6. Flow chart of the simulation process.
Applsci 10 05282 g006
Figure 7. Box-plots with the energy consumption distribution obtained in all cities with each configuration of static setpoint temperatures (current scenario).
Applsci 10 05282 g007
Figure 8. Box-plots with the energy-saving distribution between each adaptive model and the static model (current scenario).
Applsci 10 05282 g008
Figure 9. Average increase percentage in the total energy consumption due to the improvement in the user’s expectations in 0.25 °C (current scenario).
Applsci 10 05282 g009
Figure 10. Summary of the results obtained in each country between the model of tolerance of 0.00 °C and the static model.
Applsci 10 05282 g010
Figure 11. Box-plots with the energy consumption distribution obtained in all cities with each configuration of static setpoint temperatures in the three scenarios (current day, 2050, and 2100).
Applsci 10 05282 g011
Figure 12. Box-plots of the saving in heating and cooling degrees between adaptive models and the static model in the three scenarios (current day, 2050, and 2100).
Applsci 10 05282 g012
Figure 13. Average increase percentage in the energy consumption due to the improvement in the user’s expectations in 0.25 °C in 2050 and 2100.
Applsci 10 05282 g013
Table 1. The setpoint temperature adapted to each model analyzed.
ModelToleranceSetpoint Temperature (°C)
T r m   <   10 10     T r m     30 T r m   >   30
Lower
Limit
Upper
Limit
Lower LimitUpper LimitLower
Limit
Upper
Limit
Adaptive0.0018.125.1 0.33 · T r m + 14.8 0.33 · T r m + 21.8 24.731.7
0.2518.3524.85 0.33 · T r m + 15.05 0.33 · T r m + 21.55 24.9531.45
0.5018.624.6 0.33 · T r m + 15.3 0.33 · T r m + 21.3 25.231.2
0.7518.8524.35 0.33 · T r m + 15.55 0.33 · T r m + 21.05 25.4530.95
1.0019.124.1 0.33 · T r m + 15.8 0.33 · T r m + 20.8 25.730.7
1.2519.3523.85 0.33 · T r m + 16.05 0.33 · T r m + 20.55 25.9530.45
1.5019.623.6 0.33 · T r m + 16.3 0.33 · T r m + 20.3 26.230.2
1.7519.8523.35 0.33 · T r m + 16.55 0.33 · T r m + 20.05 26.4529.95
2.0020.123.1 0.33 · T r m + 16.8 0.33 · T r m + 19.8 26.729.7
2.2520.3522.85 0.33 · T r m + 17.05 0.33 · T r m + 19.55 26.9529.45
2.5020.622.6 0.33 · T r m + 17.3 0.33 · T r m + 19.3 27.229.2
2.7520.8522.35 0.33 · T r m + 17.55 0.33 · T r m + 19.05 27.4528.95
3.0021.122.1 0.33 · T r m + 17.8 0.33 · T r m + 18.8 27.728.7
Static-20 a25 a20 a25 a20 a25 a
23 b26 b23 b26 b23 b26 b
a Heating period, b Cooling period.
Table 2. Cities considered from each country.
CountryCapital City
GreeceAthens, Ermoupoli, Ioannina, Irakleio, Kerkyra, Komotini, Kozani, Lamia, Larisa, Mytilini, Patra, Thessaloniki, and Tripoli
ItalyAncona, Aosta, Bari, Bologna, Cagliari, Campobasso, Catanzaro, Florence, Genoa, L’Aquila, Milan, Naples, Palermo, Perugia, Potenza, Rome, Trento, Trieste, Turin, and Venice
PortugalAveiro, Beja, Braga, Bragança, Castelo Branco, Coimbra, Evora, Faro, Guarda, Leiria, Lisboa, Portalegre, Porto, Santarem, Setubal, Viana Castelo, Vila Real, and Viseu
SpainAlbacete, Alicante, Almeria, Avila, Badajoz, Barcelona, Bilbao, Burgos, Caceres, Cadiz, Castellon, Ciudad Real, Cordoba, Cuenca, Gerona, Granada, Guadalajara, Huelva, Huesca, Jaen, La Coruña, Leon, Lerida, Logroño, Lugo, Madrid, Malaga, Murcia, Orense, Oviedo, Palencia, Pamplona, Pontevedra, Salamanca, San Sebastian, Santander, Segovia, Seville, Soria, Tarragona, Teruel, Toledo, Valencia, Valladolid, Vitoria, Zamora, and Zaragoza
Table 3. Thermal properties of external and internal walls.
ElementLayerThickness (m)Thermal Conductivity
(W/(mK))
Thermal Capacity
(J/(kgK))
Density
(kg/m3)
External wall1. Perforated brick0.1150.3501000780
2. Cement mortar0.0151.00010001700
3. EPS insulation0.0200.032145050
4. Hollow brick0.0700.3201000770
5. Gypsum plaster0.0150.57010001000
Internal wall1. Plasterboard0.0250.2501000900
2. Air gap0.100---
3. Plasterboard0.0250.2501000900
Table 4. Percentage deviation between the energy consumption of the adaptive model and the consumption of the static model in the current scenario. Positive values correspond to a decrease in energy consumption, and negative values correspond to an increase.
TolerancePercentage Deviation (%)
Current
CoolingHeatingTotal
0.0068.9026.4838.74
0.2564.3221.3433.67
0.5058.7316.0128.77
0.7552.6810.4223.34
1.0045.894.5817.65
1.2538.34−1.4711.70
1.5029.93−7.795.47
1.7520.57−14.34−1.03
2.0010.09−21.09−7.82
2.25−1.72−28.06−14.93
2.50−15.23−35.20−22.40
2.75−31.14−42.59−30.42
3.00−51.01−50.46−39.34
Table 5. Energy saving achieved in the analyzed Greek cities.
CityEnergy Consumption Saving (kWh/Year)
CoolingHeatingTotal
Athens851.17344.001195.17
Ermoupoli983.15237.321220.46
Ioannina669.71632.071301.78
Irakleio946.53244.831191.36
Kerkyra777.68364.831142.51
Komotini712.83576.731289.57
Kozani649.37675.071324.44
Lamia835.83444.831280.67
Larisa728.11567.491295.60
Mytilini841.91346.701188.61
Patra830.61326.411157.02
Thessaloniki770.62539.501310.12
Tripoli624.27650.381274.65
Table 6. Energy saving achieved in the analyzed Italian cities.
CityEnergy Consumption Saving (kWh/Year)
CoolingHeatingTotal
Ancona637.02576.221213.23
Aosta204.241084.311288.56
Bari700.56509.131209.69
Bologna672.49625.281297.77
Cagliari848.81350.981199.79
Campobasso451.21732.201183.41
Catanzaro797.75397.851195.59
Florence636.49519.751156.24
Genoa767.03445.211212.24
LAquila776.30540.221316.51
Milan595.17707.581302.75
Naples724.73426.261150.99
Palermo980.20223.241203.44
Perugia666.04578.031244.08
Potenza353.65940.691294.35
Rome756.70446.121202.81
Trento617.32720.221337.54
Trieste670.65560.011230.66
Turin532.89797.581330.47
Venice623.05634.711257.76
Table 7. Energy saving achieved in the analyzed Portuguese cities.
CityEnergy Consumption Saving (kWh/Year)
CoolingHeatingTotal
Aveiro345.90483.52829.42
Beja708.61466.411175.01
Braga256.75579.06835.81
Bragança442.92775.501218.43
Castelo Branco621.81578.061199.87
Coimbra433.53506.42939.95
Evora678.97503.431182.41
Faro892.65241.811134.46
Guarda126.631123.061249.69
Leiria413.69429.77843.46
Lisboa781.05306.811087.86
Portalegre310.35493.64803.99
Porto640.37624.211264.57
Santarem634.48363.84998.32
Setubal737.15324.721061.87
Viana Castelo353.28463.47816.75
Vila Real415.88701.771117.65
Viseu328.34767.781096.12
Table 8. Energy saving achieved in the analyzed Spanish cities.
CityEnergy Consumption Saving
(kWh/Year)
CityEnergy Consumption Saving
(kWh/Year)
CoolingHeatingTotal CoolingHeatingTotal
Albacete637.69689.181326.86Lugo30.01835.70865.70
Alicante890.60297.971188.57Madrid729.53632.141361.66
Almeria896.35236.091132.44Malaga886.73274.511161.24
Avila372.48991.631364.11Murcia975.28295.631270.91
Badajoz902.49411.351313.84Orense284.66595.20879.87
Barcelona714.91464.761179.68Oviedo64.36755.43819.79
Bilbao395.31535.87931.18Palencia500.99820.171321.16
Burgos415.61860.751276.36Pamplona440.43748.661189.09
Caceres776.91516.031292.94Pontevedra445.74482.17927.91
Cadiz811.27319.811131.08Salamanca390.13892.131282.26
Castellon899.36364.171263.54San Sebastian472.22527.05999.27
Ciudad Real719.16554.491273.65Santander135.51607.87743.38
Cordoba994.97336.181331.16Segovia416.58856.251272.83
Cuenca590.98827.621418.59Seville1093.08236.421329.51
Gerona691.66545.821237.49Soria414.30916.181330.48
Granada735.27582.021317.28Tarragona862.89395.201258.09
Guadalajara628.25714.261342.52Teruel603.17781.631384.81
Huelva925.19261.641186.82Toledo742.89631.151374.04
Huesca643.73665.881309.61Valencia860.86368.801229.66
Jaen730.13563.671293.80Valladolid455.27787.401242.67
La Coruña129.65554.39684.04Vitoria210.59868.951079.54
Leon439.44827.521266.97Zamora464.27815.541279.81
Lerida813.96420.821234.78Zaragoza661.18571.231232.41
Logroño501.03661.311162.34
Table 9. Percentage deviation between the energy consumption of the adaptive model and the consumption of the static model in the three scenarios. Positive values correspond to a decrease in energy consumption, and negative values correspond to an increase.
TolerancePercentage Deviation (%)
Current20502100
CoolingHeatingTotalCoolingHeatingTotalCoolingHeatingTotal
0.0068.9026.4838.7462.3726.9141.9353.6026.8043.59
0.2564.3221.3433.6757.6821.0036.9249.4319.4638.90
0.5058.7316.0128.7752.6814.9031.7645.1411.6334.08
0.7552.6810.4223.3447.148.5226.2440.413.2828.89
1.0045.894.5817.6541.141.9320.4535.37−5.5823.44
1.2538.34−1.4711.7034.65−4.8714.4030.02−14.9217.74
1.5029.93−7.795.4727.64−11.848.0724.33−24.7311.76
1.7520.57−14.34−1.0320.06−18.971.4718.27−34.935.50
2.0010.09−21.09−7.8211.87−26.23−5.4111.80−45.49−1.05
2.25−1.72−28.06−14.932.97−33.66−12.644.87−56.37−7.95
2.50−15.23−35.20−22.40−6.78−41.29−20.26−2.61−67.59−15.22
2.75−31.14−42.59−30.42−17.68−49.10−28.42−10.77−79.34−23.00
3.00−51.01−50.46−39.34−30.39−57.42−37.45−19.98−92.22−31.57