Article

Optimization of Optical Trapping and Laser Interferometry in Biological Cells

Department of Physics, Graduate School of Sciences, Kyushu University, 744 Motooka, Nishi-ku, Fukuoka 819-0395, Japan
*
Author to whom correspondence should be addressed.
Appl. Sci. 2020, 10(14), 4970; https://doi.org/10.3390/app10144970
Submission received: 31 May 2020 / Revised: 5 July 2020 / Accepted: 16 July 2020 / Published: 19 July 2020
(This article belongs to the Special Issue Optical Trapping)

Abstract

:
Optical trapping and laser interferometry enable the non-invasive manipulation of colloids, which can be used to investigate the microscopic mechanics of surrounding media or bound macromolecules. For efficient trapping and precise tracking, the sample media must ideally be homogeneous and quiescent whereas such conditions are usually not satisfied in vivo in living cells. In order to investigate mechanics of the living-cell interior, we introduced (1) the in-situ calibration of optical trapping and laser interferometry, and (2) 3-D feedback control of a sample stage to stably track a colloidal particle. Investigating systematic errors that appear owing to sample heterogeneity and focal offsets of a trapping laser relative to the colloidal probe, we provide several important caveats for conducting precise optical micromanipulation in living cells. On the basis of this study, we further improved the performance of the techniques to be used in cells, by optimizing the position sensitivity of laser interferometry and the stability of the feedback simultaneously.

Graphical Abstract

1. Introduction

Since optical trapping (OT) was invented by Ashkin et al. in the late 20th century [1], it has found applications in biology, physics, material sciences, and engineering [2,3]. Nanometer- to micrometer-sized objects, whose refractive indices are slightly larger than the surrounding media, are trapped by a laser tightly focused to the diffraction limit with a high numerical aperture (NA) objective lens (Figure 1a). Along with the progress of techniques to control the focal position of the laser, multiple particles are now simultaneously manipulated in three-dimensional space in a specimen. For instance, biological cells can be aligned in order to create custom-designed tissues with a bottom-up approach [4,5]. The position of the trapped spherical particles can be measured at precisions less than nm and at a bandwidth up to 100 kHz by using the technique referred to as back-focal-plane laser interferometry (LI) [6]. As shown in Figure 1b, the probe laser is irradiated to the particle, and the interference of the scattered and unscattered lasers is detected with a quadrant photodiode (QPD) that is placed at the back-focal plane (BFP) of the condenser lens. The QPD signal then provides the particle position (x, y) relative to the symmetry axis (z axis) of the laser once an appropriate calibration of the QPD signal for the probe position is performed. The high spatio-temporal resolution and low-invasive nature of the techniques (OT and LI) are particularly useful for investigating the dynamics of mesoscale (nm ~ µm) objects in vitro, e.g., biological macromolecules (proteins, nucleic acids, and polysaccharides) and organelles as their assemblies [7,8]. For instance, OT and LI have been performed using probe particles attached to biopolymers. Thereby, the mechanics (e.g., force-extension relation) and dynamic functions (e.g., unidirectional stepping movements) of the attached molecule have been investigated. Until now, such precise execution of OT and LI that can be used for exact scientific investigation has been possible in homogeneous specimens in vitro that are prepared in a pure and quiescent buffer [7].
On the other hand, it has been challenging to conduct similar experiments in vivo in living cells. One of the reasons for this is that the optical properties are heterogeneous in cells and different between cells [9,10]. Propagation of the laser in a heterogeneous media gives rise to optical aberrations [11] that affect OT and LI [12,13]. Therefore, the strength of OT and the position sensitivity of LI show extra dispersions and systematic errors unless careful calibrations are conducted for every particle and occasion in living cells. Second, the living cell interior is highly crowded with various biomacromolecules, and therefore highly viscoelastic [14], whereas cells with high metabolic activities exhibit vigorous cytoplasmic fluctuations [15]. OT in such viscoelastic and active situations requires a strong laser power, which would induce photo-thermal and photochemical reactions and eventually lead to the damage of cells [16,17,18]. A probe particle in a weak optical trap, on the other hand, readily goes out of the laser focus. OT and LI in living cells must then fail. In order to achieve precise and less invasive LI in living cells, we have recently introduced 3D-feedback tracking of a probe particle that is performed in conjunction with in-situ calibration of the QPD signal [15]. The piezo-mechanical stage, on which a culture of living cells is placed, was smoothly repositioned via the feedback control to maintain the probe particle in the laser focus. The precise LI was then conducted while the probe particle is stably tracked in a weak probe laser (<0.5 mW). Although there are a variety of caveats for executing the techniques in biological cells, they have been only partially presented in our previous publication because of the space limitations [15].
The aim of this study is to clarify the necessity of the technology for conducting precise OT and LI in living cells by investigating the performance of the feedback-tracking technique and in-situ calibration in various conditions. In addition, we seek the means to further improve the methodology. First, we investigated the dependence of the position sensitivity of LI (hereafter referred to as LI sensitivity) on the refractive index of the media surrounding the probe particle. When aqueous glycerol solutions were used as a reference sample with a well-determined and homogeneous refractive index, measured LI sensitivities conformed to theoretical predictions for all measured probe particles. The LI sensitivity in living cells was precisely measured under the 3-D feedback tracking. Nevertheless, the distribution of the sensitivity in living cells was much greater than that in homogeneous reference samples (aqueous solution) and systematically deviated from theoretical predictions, especially when the refractive index of the probe particle is close to that of surrounding cytoplasm. We then conclude that the in-situ calibration of the LI sensitivity is a prerequisite for conducting LI precisely in living cells.
It is to be noted that the stable tracking of a probe particle is required, not to mention the LI experiments in living cells, but also for the precise in-situ calibrations as mentioned above. Ensuring the feedback stability is as important as increasing the measurement sensitivity of LI. In the second part of this article, we seek the means to achieve the best performance of both these requirements at the same time. We investigated the LI sensitivity and the feedback stability as a function of probe offsets from the laser focus. When probe offsets (x, y) in directions perpendicular to the optical axis (z) are concerned, the most sensitive LI and the most stable feedback tracking are achieved when a probe particle is located on the optical axis (x = y = 0). The feedback tracking in the z direction (along the optical axis) is the most stable at the focal plane (z = 0) when the ordinary setup of the commercial microscope is used. However, the probe particle located at z = 0 does not show the best LI sensitivity. The sensitivity indicates a remarkable z offset dependence and the best height of the probe position deviates from z = 0 by the order of wavelength of visible light. We then show that the LI sensitivity and the feedback-tracking stability are optimized independently. The best z position for the feedback-tracking stability can be shifted to match to the best position for LI sensitivity by tuning the optical settings for the microscope imaging. As a conclusion for the second part of this article, we emphasize that the feedback tracking in the z direction, that requires more subtle and careful tuning of the system, is as important as x and y directions for conducting OT and LI in living cells.

2. Laser Interferometry

Laser interferometry (LI) is a technique to detect the position of a trapped particle with a high spatio-temporal resolution [6]. As shown in Figure 1b, the trapped particle with the displacement x from the optical axis diffracts the probe laser. After being collimated, the outgoing laser is projected on to the quadrant photodiode that images the back-focal plane of the condenser lens. When the probe particle is smaller than the beam waist (w0) or the wavelength (λ) of the trapping laser, the scattered and unscattered light creates an interference pattern at the QPD. The technique is therefore conventionally referred to as back-focal-plane laser interferometry (LI) [6]. LI measures the QPD output voltage V ( t ) = M ( I + I ) / ( I + + I ) which is proportional to the normalized difference of the laser intensities (I+ and I) that arrive at (+) and (−) halves of the QPD, respectively. Here, M indicates the gain of electronic amplifiers. Within the linear range where the QPD output V(t) is proportional to the probe displacement x from the optical axis, and LI measures x with high spatio-temporal resolution.
The position sensitivity of LI, which is defined as S V / x = M ( I + I ) / { ( I + + I ) x } , indicates the basic performance of LI once M is properly normalized. When a Gaussian laser is used for LI in homogeneous media, the sensitivity depends on parameters, e.g., refractive indices of solvent n and probe particle np, radius of the probe a, beam waist w0, and wavelength of the laser λ.
Scattering of a laser by spherical objects can be predicted by solving the classical electromagnetic theory, which is referred to as Lorenz–Mie theory [19]. The theory supposedly provides for the accurate prediction of the laser diffraction as long as permitted by the power of numerical calculations. However, it is hard to incorporate the actual condition of LI experiments. For instance, various aberrations arise while the laser propagates in the experimental setup and in the sample. Especially, the spherical aberration usually neglected in the calculation appears when the refractive index of the sample media is different from that of immersion oils used for the objective and condenser lenses [20]. When a laser passes through these high-NA lenses, its polarization is compromised. The asphericity of colloids, stray lights from various reflection surfaces, and other misalignments in the optical setup also influence the LI sensitivity, which are hard to take into account in the theoretical predictions. When designing LI experiments, it is worth considering more-drastically simplified approximations in order to obtain a qualitative understanding of how the LI sensitivity depends on various parameters (a, n, np, etc.).
For a probe particle whose radius is larger than the wavelength of a laser ( a λ ), the approximation with the geometrical optics is relevant to investigate the propagation of light. That was done in detail by taking multiple scattering at the probe surfaces into account [21]. Here, with more drastic approximation neglecting surface reflections, the position sensitivity of the laser interferometry is approximately given as
I + I I + + I · 1 x n ( n p n ) n p 1 a .    ( Geometrical )
On the other hand, at the opposite limit ( a λ ), the effective dipole moment induced at the probe emits the scattered electric field (Rayleigh scattering). The sensitivity is estimated for monochromatic Gaussian laser beam as [6]
I + I I + + I · 1 x n ( n p 2 n 2 ) n p 2 + 2 n 2 a 3 λ w 0 3 .    ( Rayleigh )
In these two limiting situations, the LI sensitivity can be expressed by separating variables as
S ( n , n p , a , w 0 , λ )   ~   f ( n , n p ) G ( a , w 0 , λ ) ,
where f ( n , n p ) describes how sample refractive index n affects the sensitivity and offers useful insights on how the heterogeneity of the refractive index in cells provides errors in LI experiments. For brevity, we choose to define
f G     n ( n p n ) / n p
f R     n ( n p 2 n 2 ) / ( n p 2 + 2 n 2 ) .
Here and hereafter, G and R in subscripts indicate geometrical optics and Rayleigh regimes, respectively. On the other hand, G (a, w0, λ) in Equation (3) includes all the other effects of the optical conditions of OT and LI. Although a, w0, and λ are raised as a typical example of parameters, many other conditions (e.g., alignment of optics and aberrations of laser lights) could also affect G though they are usually hard to control. Thus, in order to systematically investigate LI sensitivities, the effect of the uncontrollable factor G must be carefully removed by conducting additional experiments in a reference material, as we will explain later. At the condition a λ , the electric field of the laser interacts with the probe in a more complicated manner than the two extreme optical regimes [19]. Therefore, it is not obvious whether the description approximated as Equation (3) is applicable for this condition. However, as we will see later, our experimental results show that separation of variables in Equation (3) also holds beyond the range of the approximations (i.e., for a λ ).
From the simplified theoretical expressions, several caveats are obtained for conducting LI. (1) The probe laser should be tightly focused to have as small a w0 as possible, especially when using small probe particles with a λ (or in a broader condition a < w0). (2) The larger difference of the refractive index between the probe particle and surrounding media (larger difference of np and n) is preferred as long as the non-conservative scattering force does not prevent optical trapping [22]. (3) The position sensitivity of LI takes its maximum for a ~ λ ~ w0. Therefore, a ~ λ ~ w0 ~ 1 µm is chosen for OT and LI in living cells [15].

3. Materials and Methods

3.1. Experimental Setup

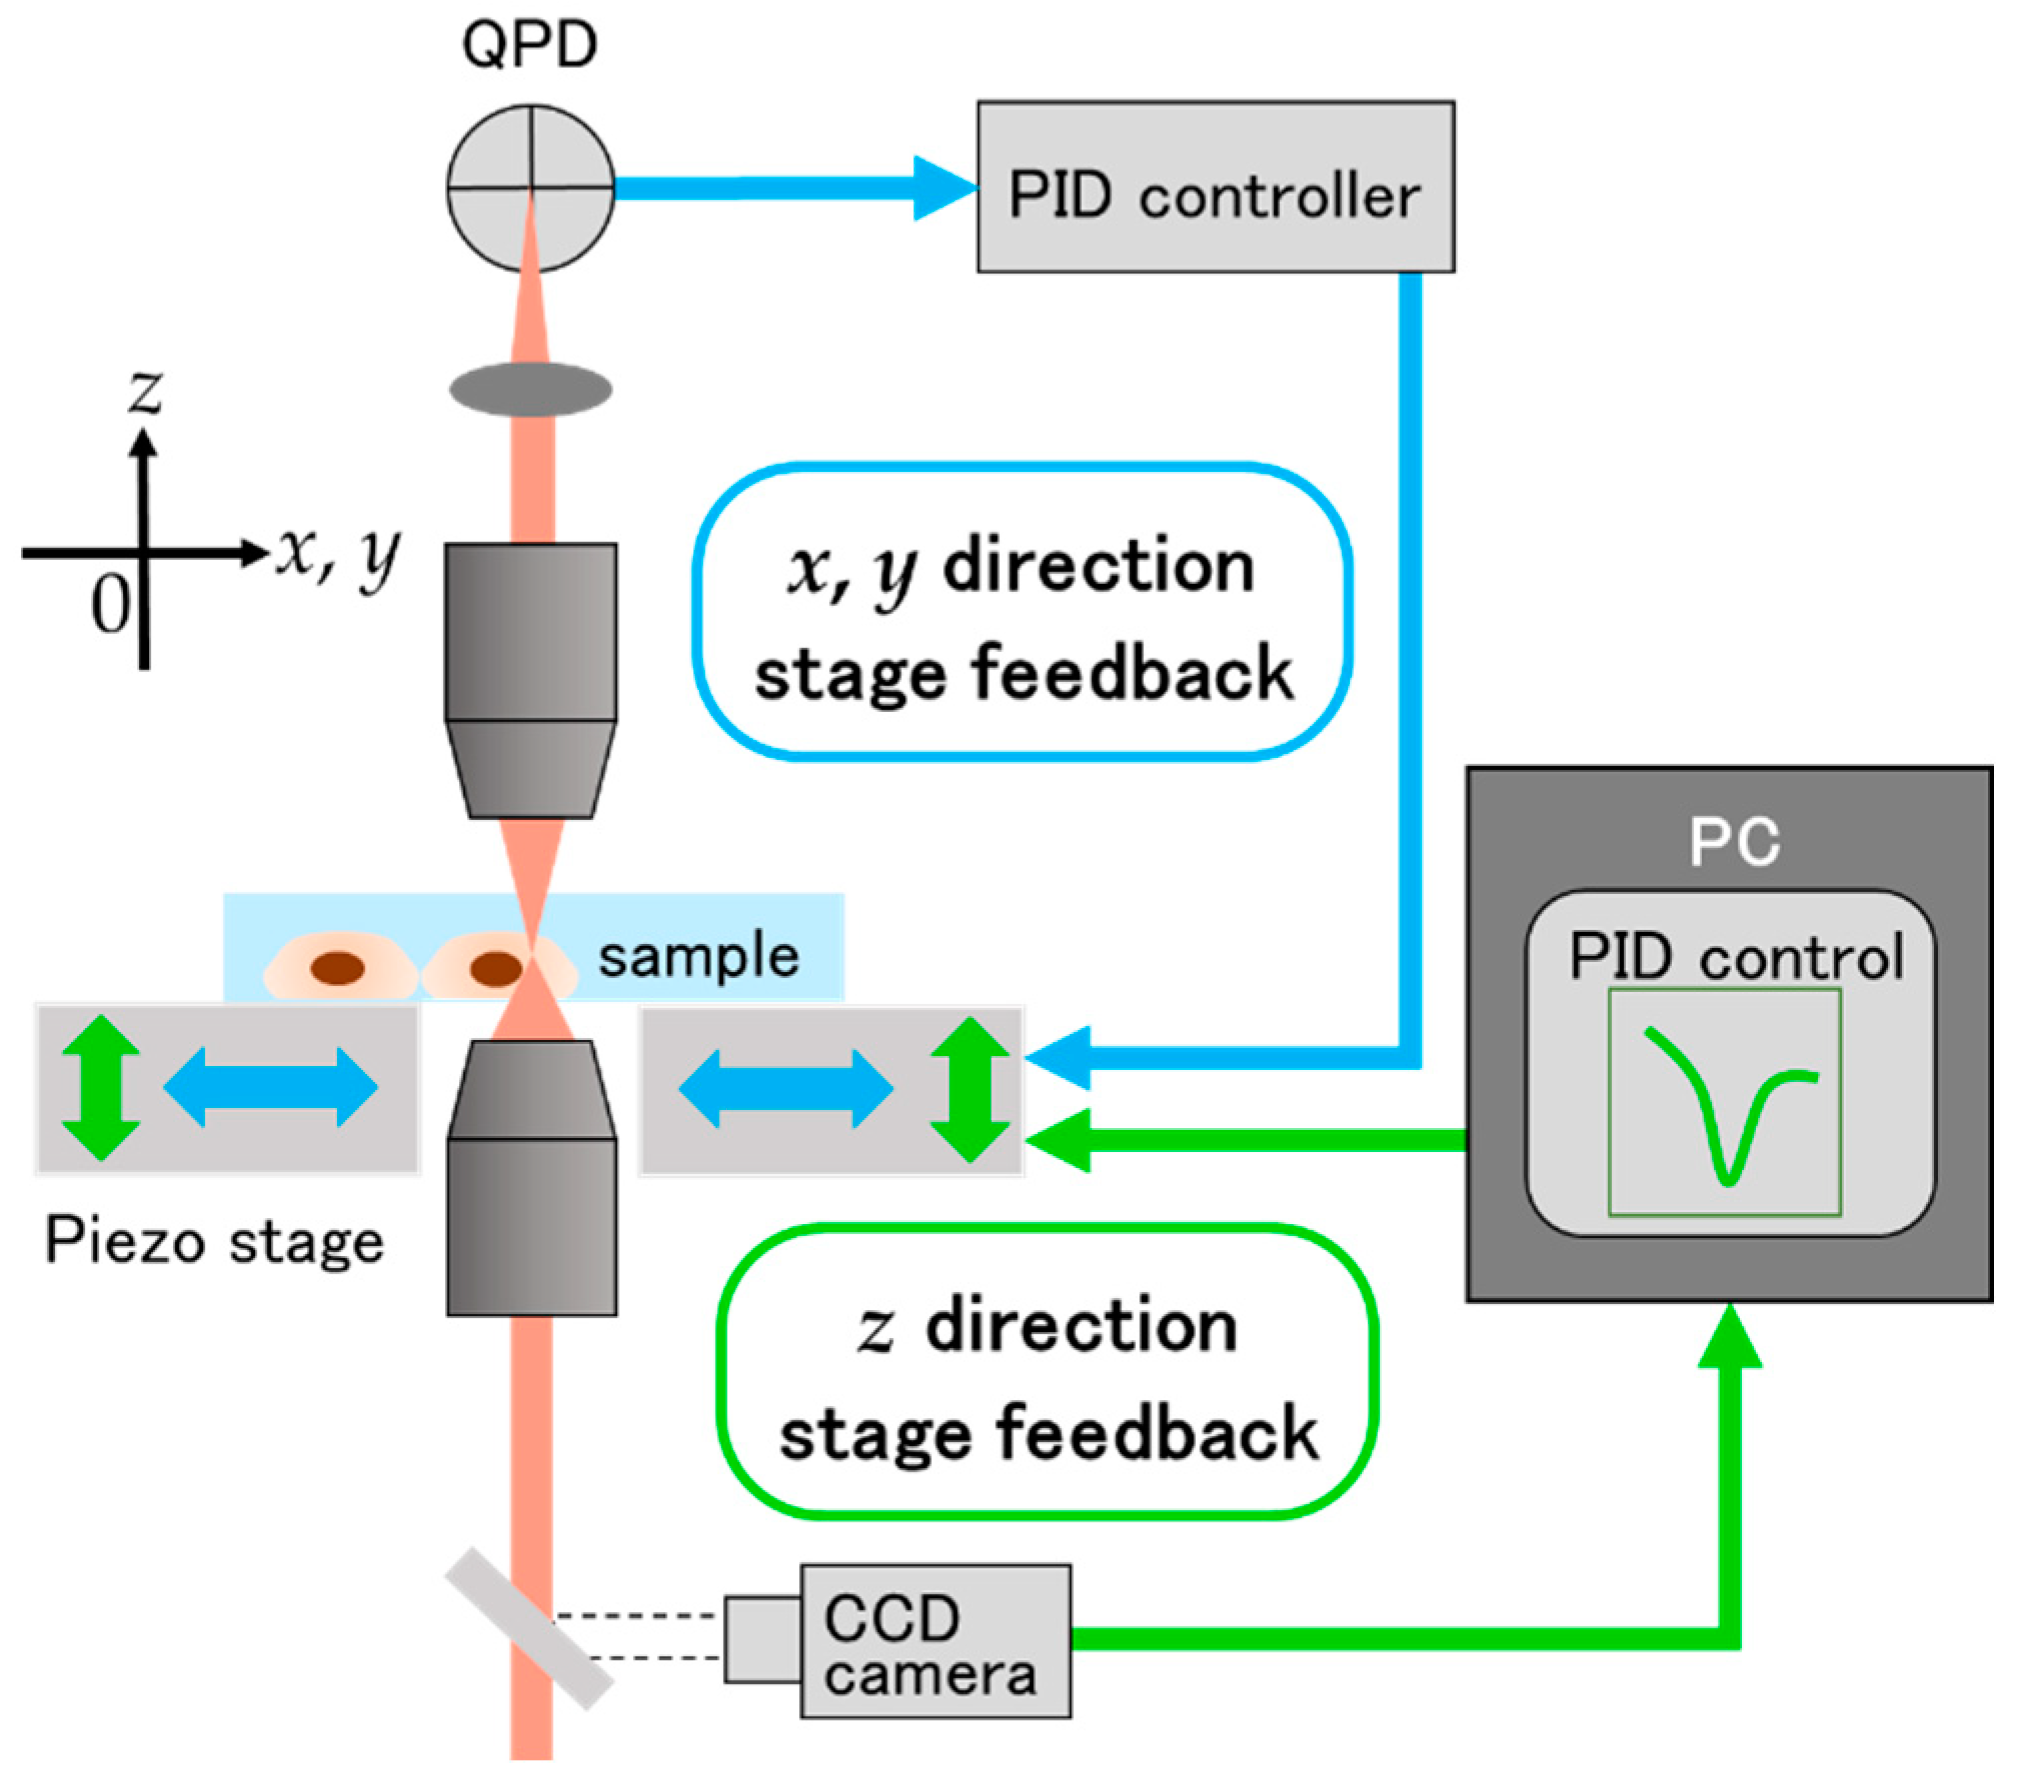
Details for the OT and LI setup incorporating the feedback tracking of a probe particle is given elsewhere [15]. Briefly, the experimental setup is shown schematically in Figure 2. The optical trapping of particles (melamine: microParticles GmbH, Berlin, Germany, silica and latex: Polysciences, Warrington, PA, USA) was made with a 1064 nm laser (Nd: YVO4, Compass, Coherent, Santa Clara, CA, USA). The diameter of particles used for all experiments in this study was 2a = 1 µm. Laser light is tightly focused on to a probe particle by a high NA objective lens (NA = 1.3, Neofluar, oil immersion, Zeiss, Oberkochen, Germany). The laser that passed through the sample was collimated with a condenser lens (NA = 1.0, water immersion, Nikon, Tokyo, Japan), and the back-focal plane of the condenser lens was then projected on the quadrant photodiode (QPD). With this arrangement, the particle position was detected with the back-focal-plane laser interferometry [6]. The origin of the coordinate (position of the laser focus) in the z direction was determined as follows. First, the focus of the microscope image and the focus of the laser were overlapped by observing the bottom surface of the sample and the laser reflection from it. After confirming that probe particles in purely viscous reference materials were trapped at the focus of the microscope under this condition, the microscope image of the probe particle in the measurement sample was then used to estimate the displacement z. OT and LI were performed in cells while the piezo stage on which the sample was placed was controlled via feedback. For horizontal directions (x, y), the QPD signal was read by the proportional–integral-derivative controller (PID controller) (SIM960; 100 kHz, Stanford Research Systems, Inc., Sunnyvale, CA, USA). The controller generated the signal which was sent to the piezo-mechanical stage so as to align the QPD signal with the target value (setpoint) (Figure 2). The QPD signal and the displacement signal of the piezo stage were recorded simultaneously, and the net displacement of the probe was then obtained by summing each signal after calibrating. For three-dimentional feedback control, the probe position in z direction was obtained by analyzing the microscope image of the particle. The analysis was made with a custom-made LabView program and the voltage signal to control the piezo stage was made with PCI-1408 analog I/O board (National Instruments, Austin, TX, USA). The detailed procedure of the analysis is given in Section 4.2.

3.2. LI Sensitivity

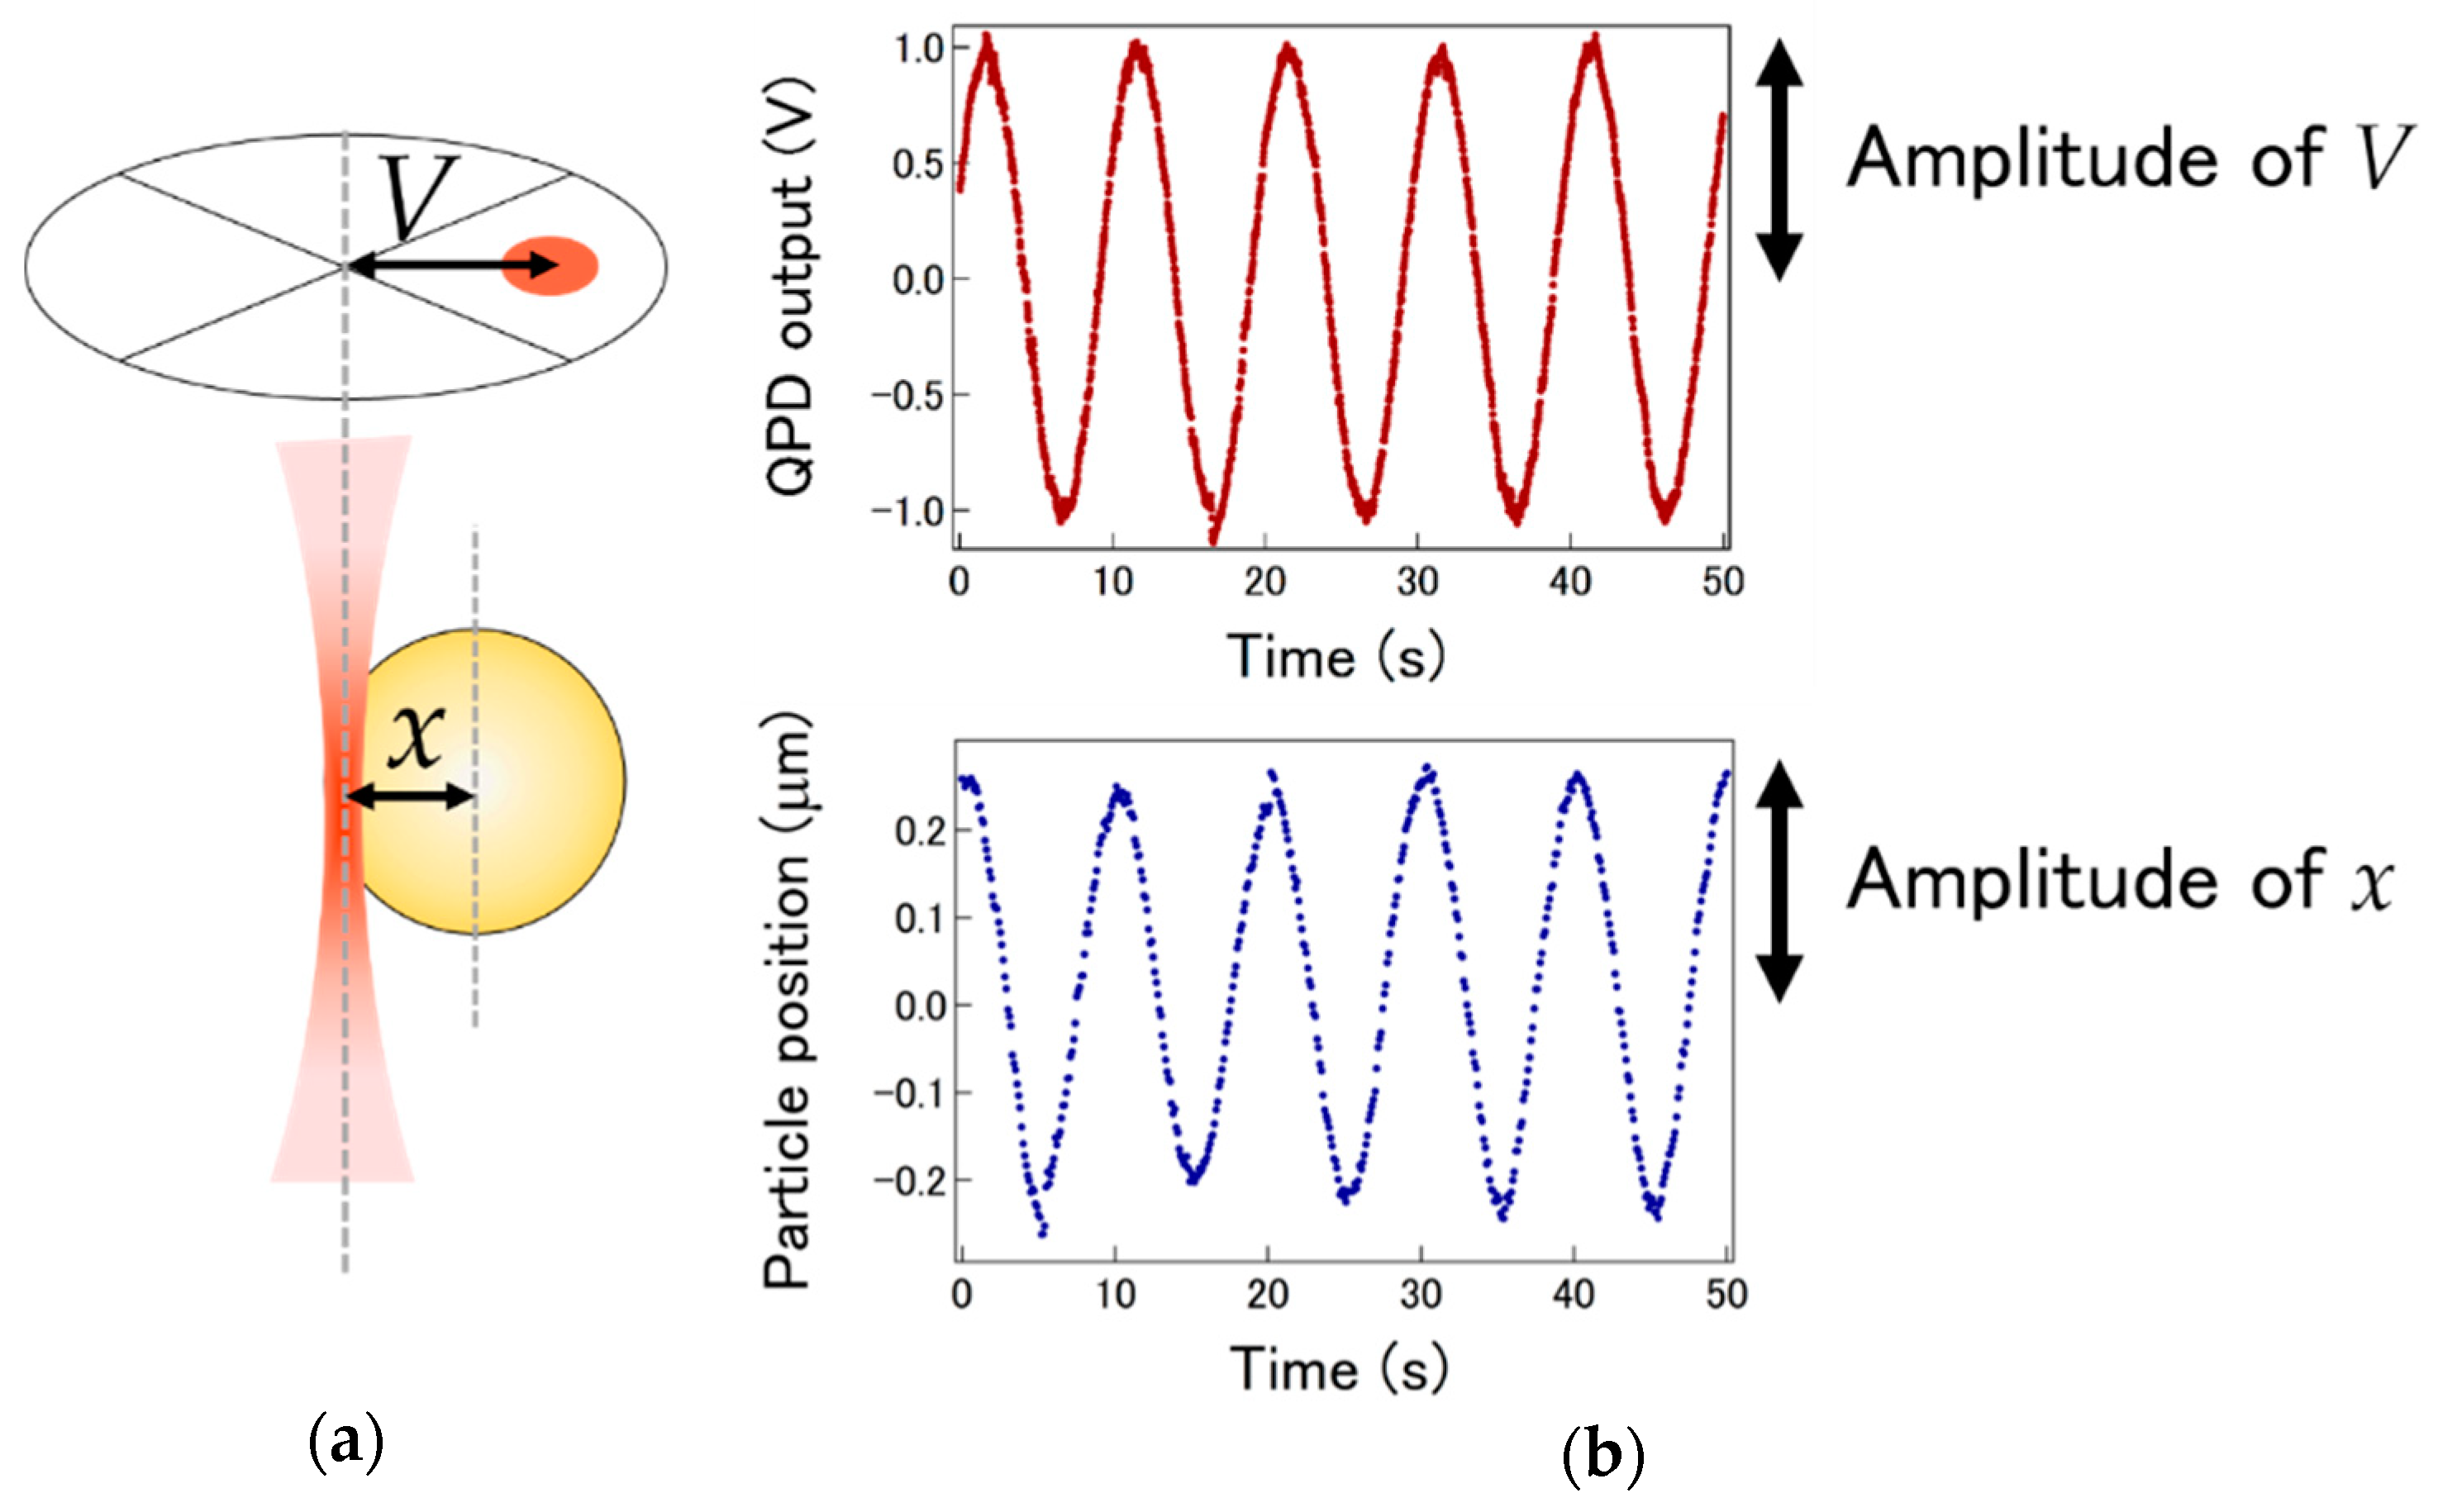
Position sensitivity of LI in a aqueous glycerol was obtained by analyzing the power spectral density of the thermal fluctuation of probe particle [23,24]. Sensitivities in cells and agarose gels were obtained by sinusoidally oscillating the piezo stage (0.1 Hz, amplitude ~ 250 nm) while QPD output signals and microscope images were recorded. The sensitivities were then obtained as the ratio of the amplitude of these signals (Figure 3a,b). For measurements in living cells, in order to remove errors caused by the vigorous spontaneous fluctuations, periodical oscillations of the probe particle were made under the feedback control of the piezo stage. As shown in Figure 3b, setpoint (target value) for the feedback control was oscillated sinusoidally at the periodicity of 10 s so that QPD output V ( x) becomes sinusoidal [15]. Since the feedback delay (τ ~ 10 ms) of the system [15] is much faster than the oscillation period, the feedback control works as intended.
LI sensitivity and OT strength change owing to the slight alteration of optical settings of the equipment. For instance, separation between the probe particle and the condenser lens (2.80 mm) changes while exchanging samples repeatedly, affecting the optical magnification for the diffraction of the laser. Even the laser emission is slightly altered once the laser is turned off and restarted. These factors affect the sensitivities via G (a, w0, λ) in Equation (3). As a control, immediately before or after every experiments, sensitivity S40 was measured in a reference media (40 wt% glycerol solution) without changing any other conditions of experimental settings. Further, 40% glycerol solution was chosen as a reference material since its refractive index n40 = 1.384 is close to that of the cell interior [9,25,26,27,28,29,30,31]. The normalized LI sensitivity A was then obtained by dividing S with S40 as   A S/S40 = f(n,np)/f(n40,np). Therefore, the theoretical predictions of the normalized sensitivities are given for geometrical and Rayleigh approximations as,
A { ( 6 ) A G = n ( n p n ) / n 40 ( n p n 40 ) ( Geometrical ) ( 7 ) A R = n ( n p 2 n 2 ) ( n p 2 + 2 n 40 2 ) / n 40 ( n p 2 n 40 2 ) ( n p 2 + 2 n 2 ) ( Rayleigh )

3.3. Numerical Calculation of LI Sensitivity

Numerical calculations based on Lorenz–Mie theory were conducted in order to predict z dependence of LI sensitivity. Using Mieplot software [32], calculations were conducted using parameters relevant for our experimental conditions (a, λ, w0, n, and np are 0.5 µm, 1064 nm, 0.55 µm, 1.38, and 1.68, respectevely). For each vertical offset z, we calculated the laser scattering caused by small offsets (x, y), and then obtained the sensitivity Sth(z). Out-going laser lights were collected in the far field within the scattered angle < 46.4° (relevant to the numerical aparture of condenser lens, NA = 1.0). The normalized LI sensitivity Ath(z) was then obtained as Ath(z) Sth (z) S(0)/Sth (0).

3.4. Gel Preparation

Agarose powder (BD, Franklin Lakes, NJ, USA) was mixed with melamine particles and dissolved in distilled water to obtain 0.5 wt% aqueous solution. The solution was heated in a microwave oven to dissolve and loaded into a glass-bottom dish before being cooled. Samples were kept at rest for an hour for polymerization at room temperature.

3.5. Cell Preparation

HeLa cells were cultured in CO2 incubator in D-MEM (045-30285, FUJIFIUM Wako Pure Chemical, Osaka, Japan) with 10% FBS and 100 U/mL antibiotics (penicillin and streptomycin cocktail) at 37 °C. When the population of cells in a flask was confluent, cells were trypsinized and seeded on to glass-bottom dishes. Colloidal particles (melamine and silica) were introduced into HeLa cells using a gene gun (PDS-1000/He, Bio-Rad, Hercules, CA, USA). After excess beads that did not enter cells were removed by washing the dishes with phosphate-buffered saline, medium was changed to ordinary D-MEM with 10% FBS. The dishes were then incubated in a CO2 incubator for at least several hours until cells recover from the damage caused by the bombardments of colloids by the Gene Gun. Finally, a culture medium D-MEM (044-32955, FUJIFIUM Wako Pure Chemical, Osaka, Japan) or CO2-independent medium L-15 (21083027, gibco, Thermo Fisher Scientific, Waltham, MA, USA) mixed antibiotics without serum was added to perform the measurements.

3.6. Control of Intracellular Concentrations

The refractive index of the cytoplasm in living cultured cells was varied by changing the concentration of intracellular macromolecules. In order to investigate the dependence of LI sensitivities on refractive indices in cells, cells were osmotically compressed by adding sucrose to the culture media. The relation between the cell volume and the osmotic pressure is known to follow Ponder’s relationship [33,34,35], Π { v ( 1 R ) v iso } = Π iso R v iso . Here, Π , Π iso , v, and R are osmotic pressure, isotonic osmotic pressure, volume fraction of a cell, and the Ponder’s value (volume fraction of intracellular liquid in isotonic condition, R = 0.7), respectively [35]. By using this relation, we controlled the cell volumes while the amount of bio-macromolecules was fixed. The refractive index of inside of cells n was then estimated by using the Lorenz-Lorenz equation described as
n 2 1 / n 2 + 2 = ( 1 v iso / v ) ( n water 2 1 / n water 2 + 2 ) + ( v iso / v ) ( n iso 2 1 / n iso 2 + 2 ) ,
where nwater and niso represent the refractive index of water and isotonic cell, respectively [36].

4. Experimental Results and Discussions

4.1. LI Sensitivity Depending on Optical Properties

As explained in previous sections, the LI sensitivity depends on various material parameters and experimental conditions in a complicated manner. Furthermore, the factor G in Equation (3) changes its value gradually day by day, even if one tries to keep the same experimental conditions as much as possible. Calibration of the LI sensitivity is therefore required for every experiment, even when in vitro samples are measured. When a probe particle is dispersed in a homogeneous solvent with known viscosity, the LI sensitivity and the stiffness of OT can be obtained by observing thermal fluctuations of the probe particle by utilizing the Fluctuation-dissipation theorem [24]. The position sensitivity of LI and the stiffness of OT do not change if the reference solvent used for the calibration and the material of interest have almost the same refractive index. Since dilute samples have their refractive indices similar to the solvents, this calibration procedure has been widely used for many of LI experiments [23].
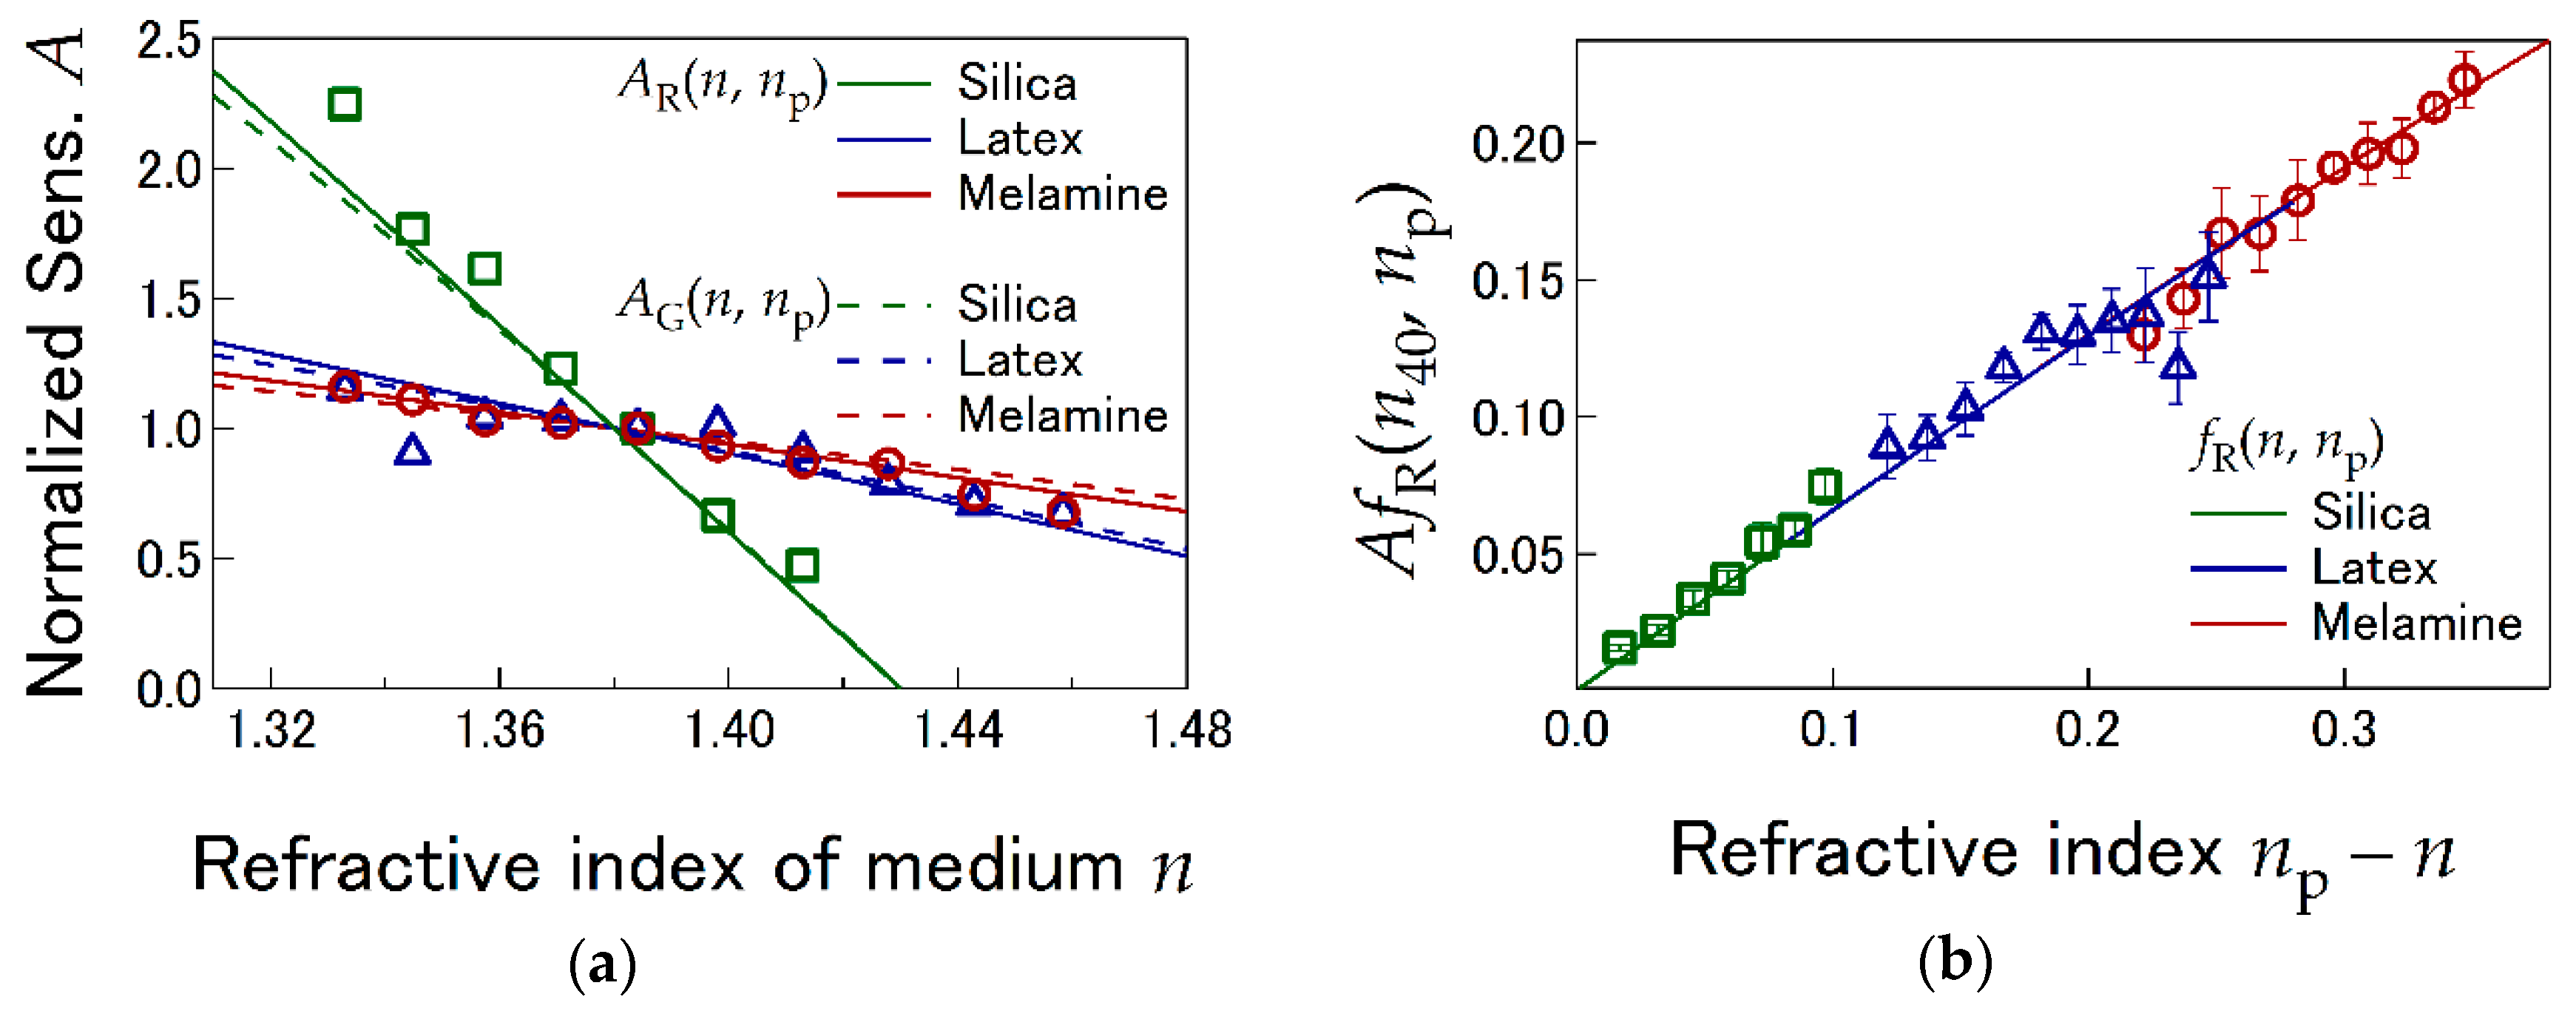
Using the calibration procedure, LI sensitivities were measured in 0–90% glycerol solutions with three types of probe particles (melamine: np = 1.68, latex: np = 1.58, and silica: np = 1.43). The factor G (a, w0, λ) in Equation (3) is affected by optical and electronical conditions other than refractive indices (n and np), and some of them are hard to control, as explained in previous sections. The contribution of the factor G to the LI sensitivity was therefore removed from the LI sensitivity by normalizing as A   S/S40 where S40 is the sensitivity measured in the same setup in 40 wt% glycerol solution. Results of the LI sensitivity are shown in Figure 4a as a function of refractive indices of surrounding media n. The refractive indices of glycerol solutions were obtained from Ref. [31]. The concentration of the solutions were determined in the range where the refractive index is pertinent to that of eukaryotic cells used in this study (n ~ 1.38 ± 0.02 for isotonic cytoplasm) [9,25,26,27,28,29,30]. We compared the experimental results to the theoretical predictions based on geometrical optics (Equation (4)) and the Rayleigh scattering (Equation (5)) approximations. In our experimental conditions, Equations (4) and (5) provide similar predictions, and the overall trend of the normalized LI sensitivity A conforms to these formulae. These results imply that the simple formulae can be extended to apply to the experimental condition a ~ λ, as long as n and np are chosen for LI experiments feasible in living cells. As we see in Figure 4a, the normalized LI sensitivity strongly depends on the refractive index n of surrounding solutions when silica particles are used, but the dependence is modest for melamine particles. This indicates that the LI sensitivity in heterogeneous living cells could be more stable if melamine particles are used as a probe.
On the basis of the observation above, the sensitivity f(n, np) which is not affected by the uncontrollable factor G can be estimated as A fR(n40, np) where n40 represents the refractive index of 40% glycerol solution. As it is shown in Figure 4b, all f(n, np) estimated from experimental results are collapsed to a single line that is proportional to Δn npn, and they agree well to theoretical prediction fR(n, np). Note that OT and LI experiments, including ours, are possible at conditions where np is slightly larger than n since the scattering force prevents OT at too large Δn [1]. In this case, f(n, np) is simply proportional to Δn and does not largely depend on the regimes for approximations, which is consistent to our results. The LI sensitivity is the largest for melamine particle (Figure 4b).
We then turn to measure the LI sensitivity in living HeLa cells. Since cells are highly crowded with concentrated biopolymers, their refractive indices are largely different from that of the solvent and are not known exactly. The calibration procedure using a reference material as written above is not appropriate. In this study, therefore, the sensitivity S was directly measured in living cells as the ratio of the amplitude of the QPD output V to that of the probe displacement x [15,23]. While sinusoidally moving the piezo-mechanical sample stage, the QPD signal and the video of microscopic image of the probe were recorded [15]. Since a probe in a living cell spontaneously moves during the calibration owing to the vigorous cytoplasmic fluctuations, movement of the piezo stage was controlled with 3D feedback as expressed in the materials and methods section. Even if this direct in-situ calibration is conducted using the feedback-tracking technique, LI experiments are destabilized when the laser propagates through highly heterogenous regions in cells such as cell-cell and cytoplasm-nucleus boundaries. Therefore, probe particles that are located in relatively homogeneous regions in between nucleus and cell-cell boundaries were chosen for LI experiments in prior study [15] and also in this study. Refractive indices of cells n were changed by controlling the cell volume v by adding sucrose to the culture media. By assuming that the total amount of solid contents in cells was kept constant, and that the mean refractive index of cells is n = 1.38 [9,25,26,27,28,29,30] for isotonic cytoplasm and n = 1.33 for v → ∞, the refractive index in the cells was estimated by the mixing rule based on the Lorenz–Lorenz relation [36].
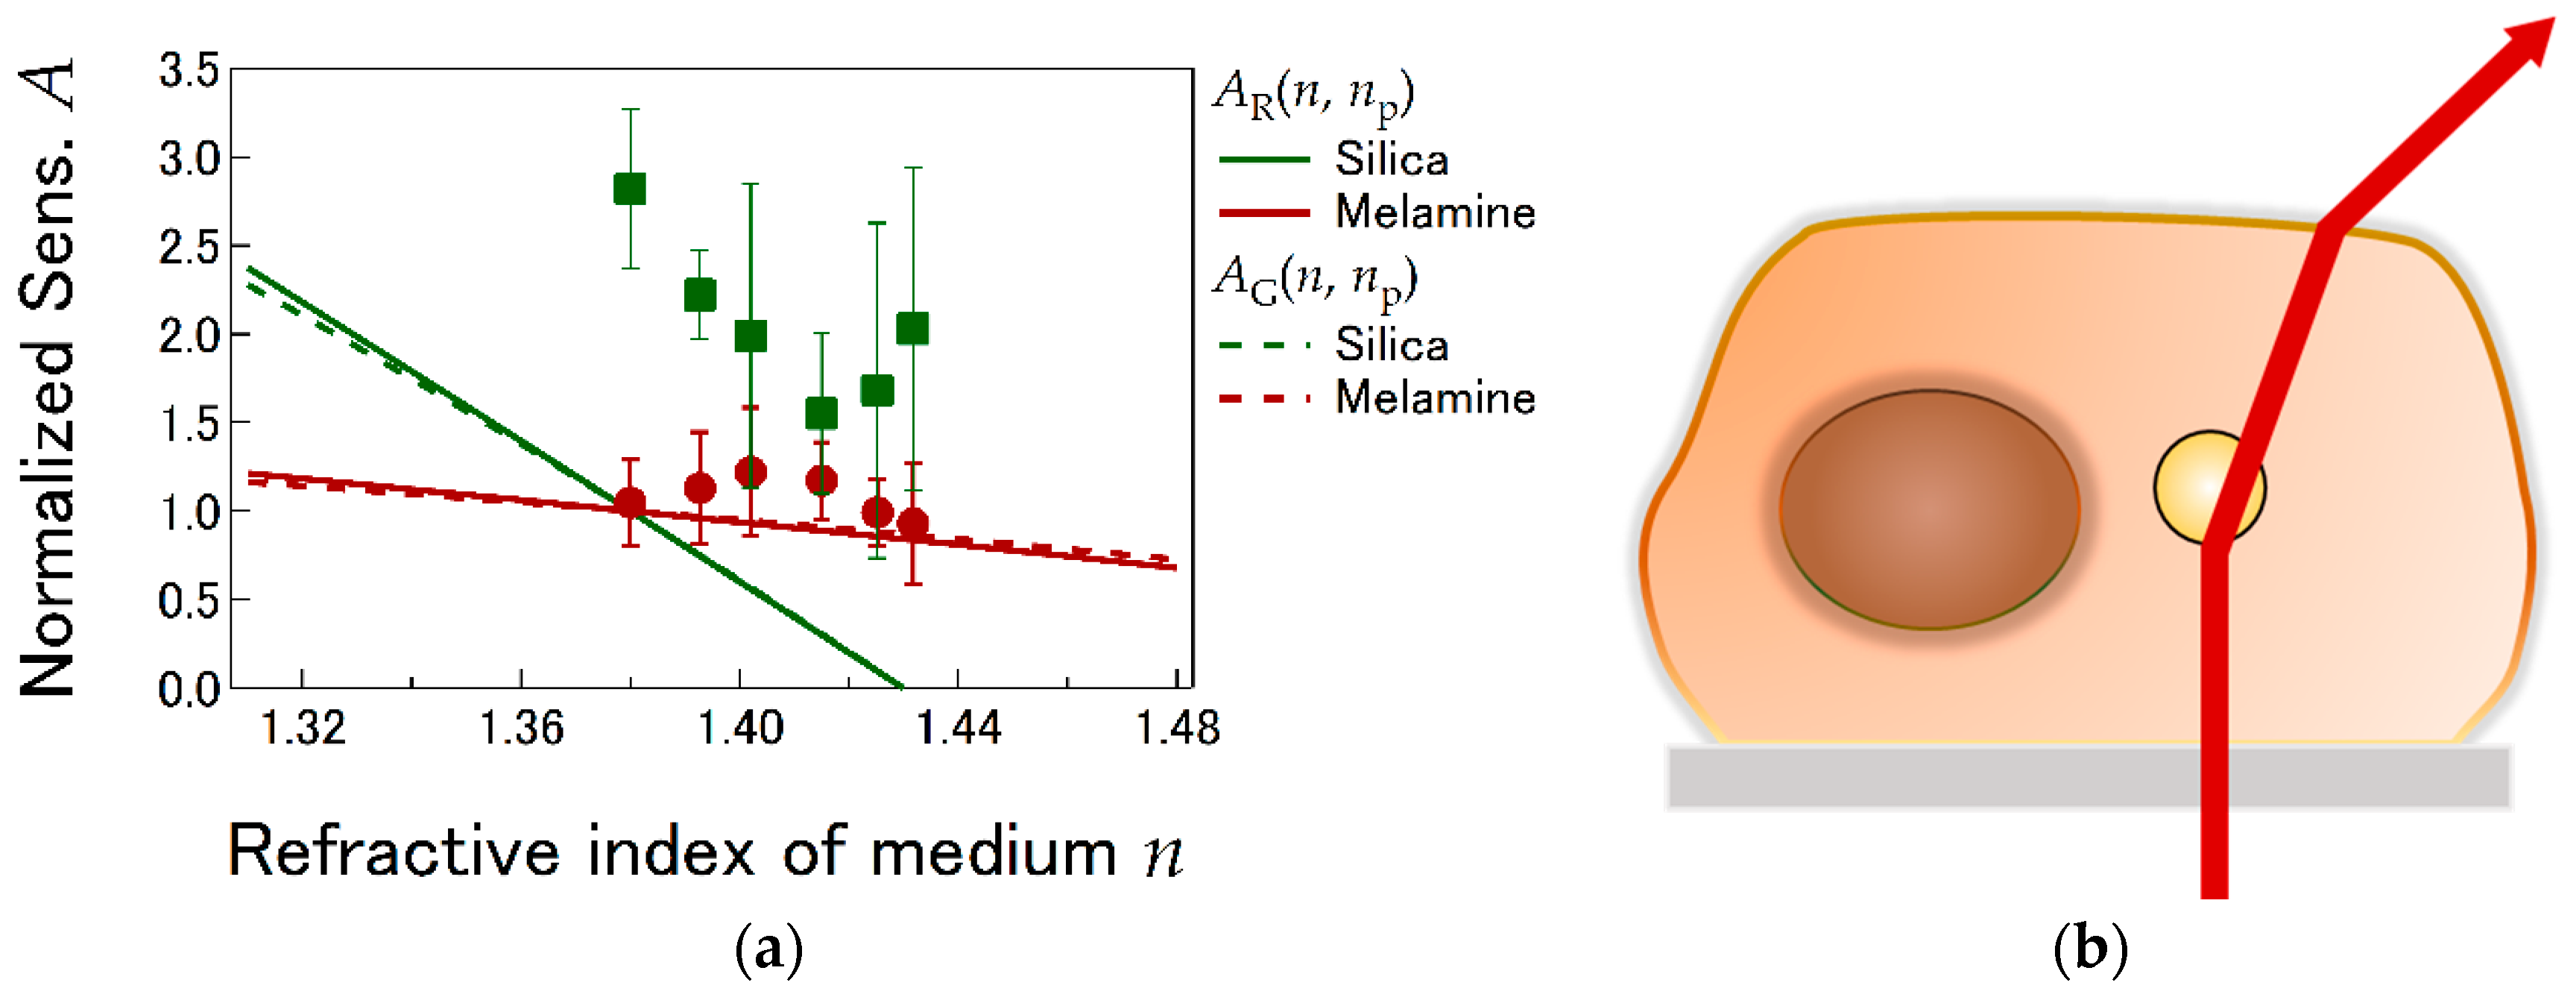
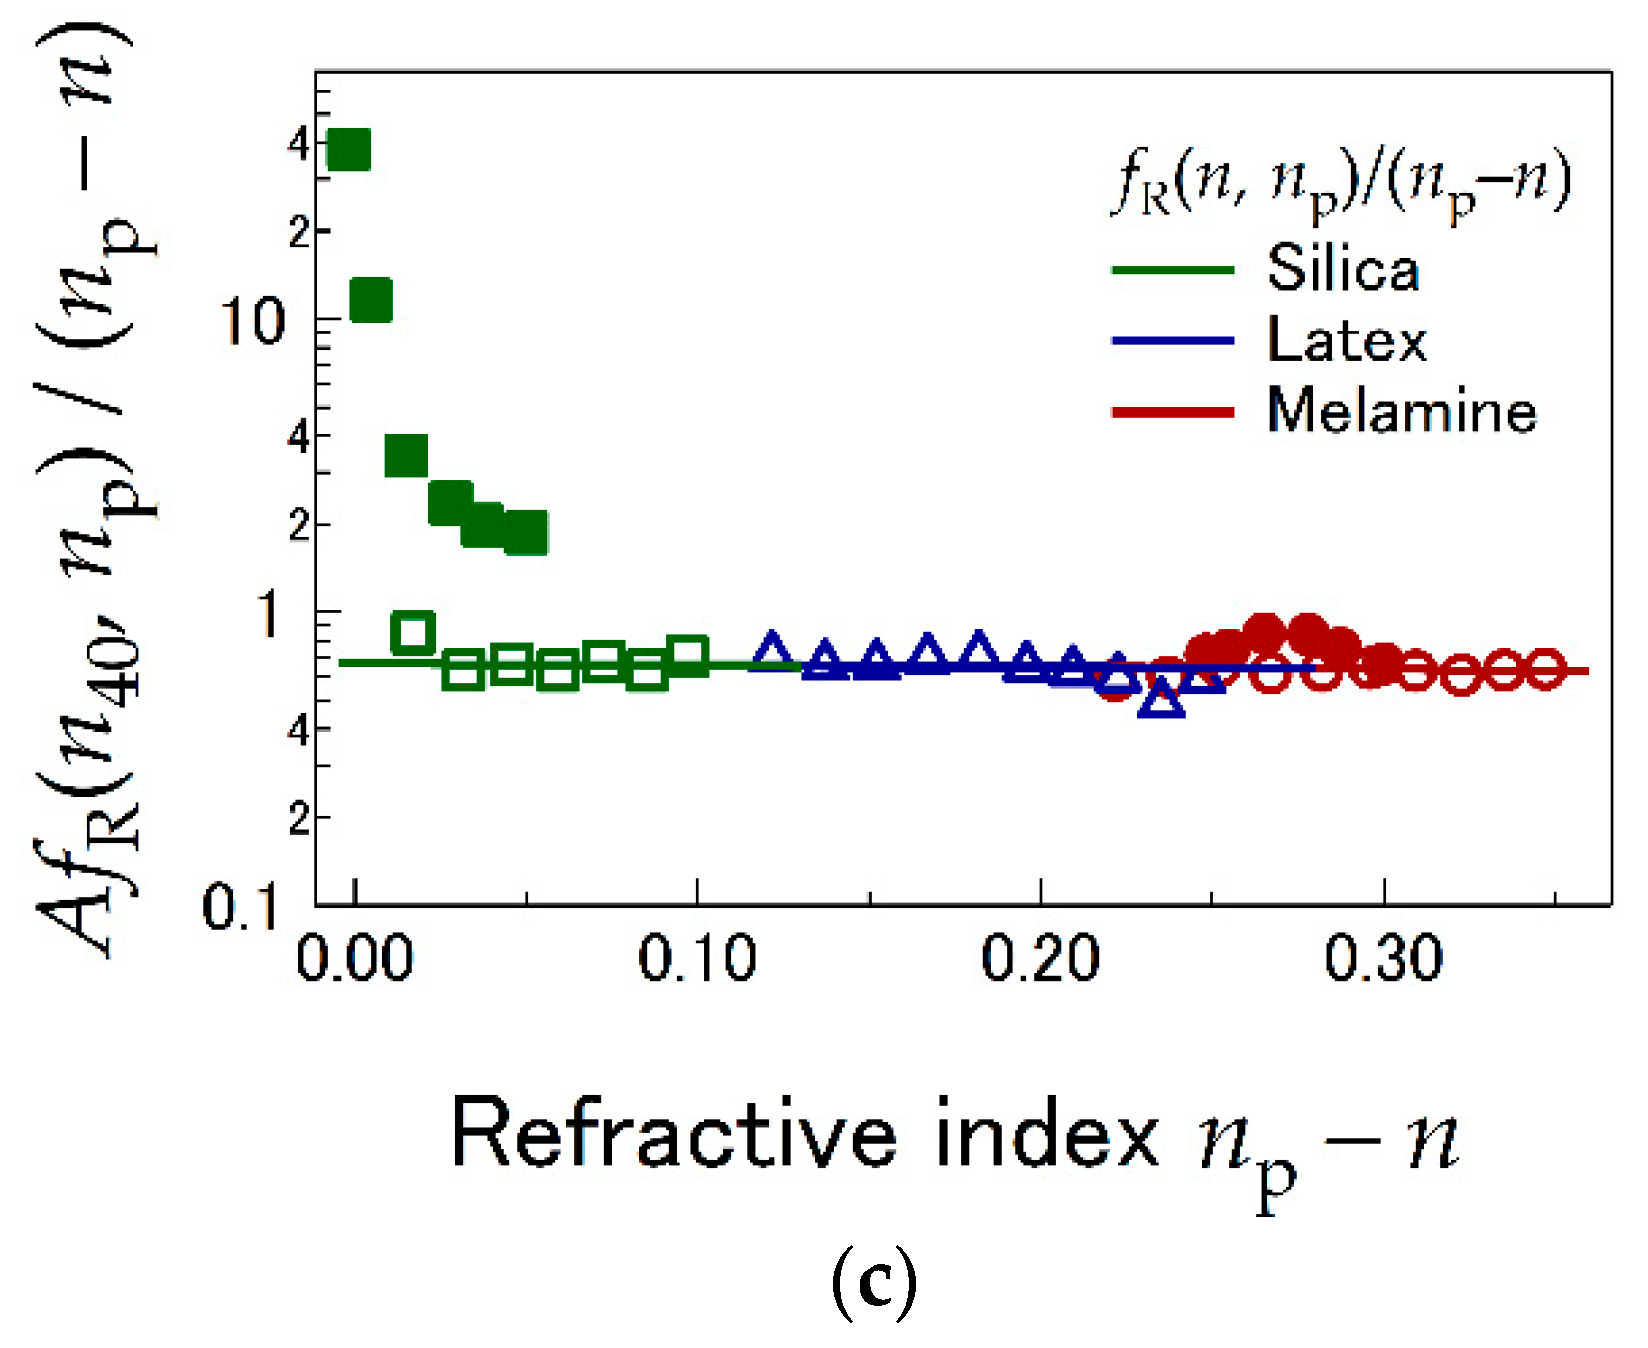
As shown in Figure 5a, normalized LI sensitivities A in cells are systematically higher than the theoretical predictions for both melamine and silica particles. Laser aberrations owing to the heterogeneity in cells would reduce sensitivities, rather than increase. A part of the reason for this may be the amplification of the laser diffraction at the cell–culture interface. As shown in Figure 5b, the laser deflection is amplified by ~5% at the cell (n ~ 1.38)–media (n ~ 1.33) interface after it is refracted by the probe. Since this deflection at the boundary does not occur in experiments in the reference material (40% aqueous glycerol), this amplification effect may explain the slightly higher sensitivity of melamine particle in living cells than that in glycerol solutions. However, errors measured in silica particles are elusive. This is seen more clearly in Figure 5c, in which AfR(n40, np)/(npn) ~ f(n, np)/(npn) obtained in cells and aqueous glycerol are plotted. The dispersions as well as the systematic deviations from theoretical predictions (which is almost constant in this plot) are remarkably large for silica particles, especially when the cell refractive index is similar to np. The silica particle, though it has been widely used for LI experiments, is therefore not suitable as a probe for LI measurements in living cells. Although LI sensitivities are expected to take negative values when np is larger than n , we did not observe the corresponding phase shift by π in the sinusoidal response of the QPD signal. When the refractive index of silica particles (np = 1.43) is close to that of surrounding cytoplasm, the laser deflection by the probe is extremely small. Under this condition, various artifacts originating from, e.g., laser diffraction at the cell surface and by the other organelles, would not be negligible. On the other hand, LI in cells using melamine particles provide reasonable agreement to theoretical predictions for all the experimental conditions explored in this study. This is the reason why the melamine particle is chosen for LI experiments in living cells [15]. Nevertheless, the relative standard deviation of the LI sensitivity is larger in living cells compared to that in glycerol, clarifying the necessity of in-situ calibration with feedback-tracking technique in cells.

4.2. LI Sensitivity Depending on Radial and Axial Offsets

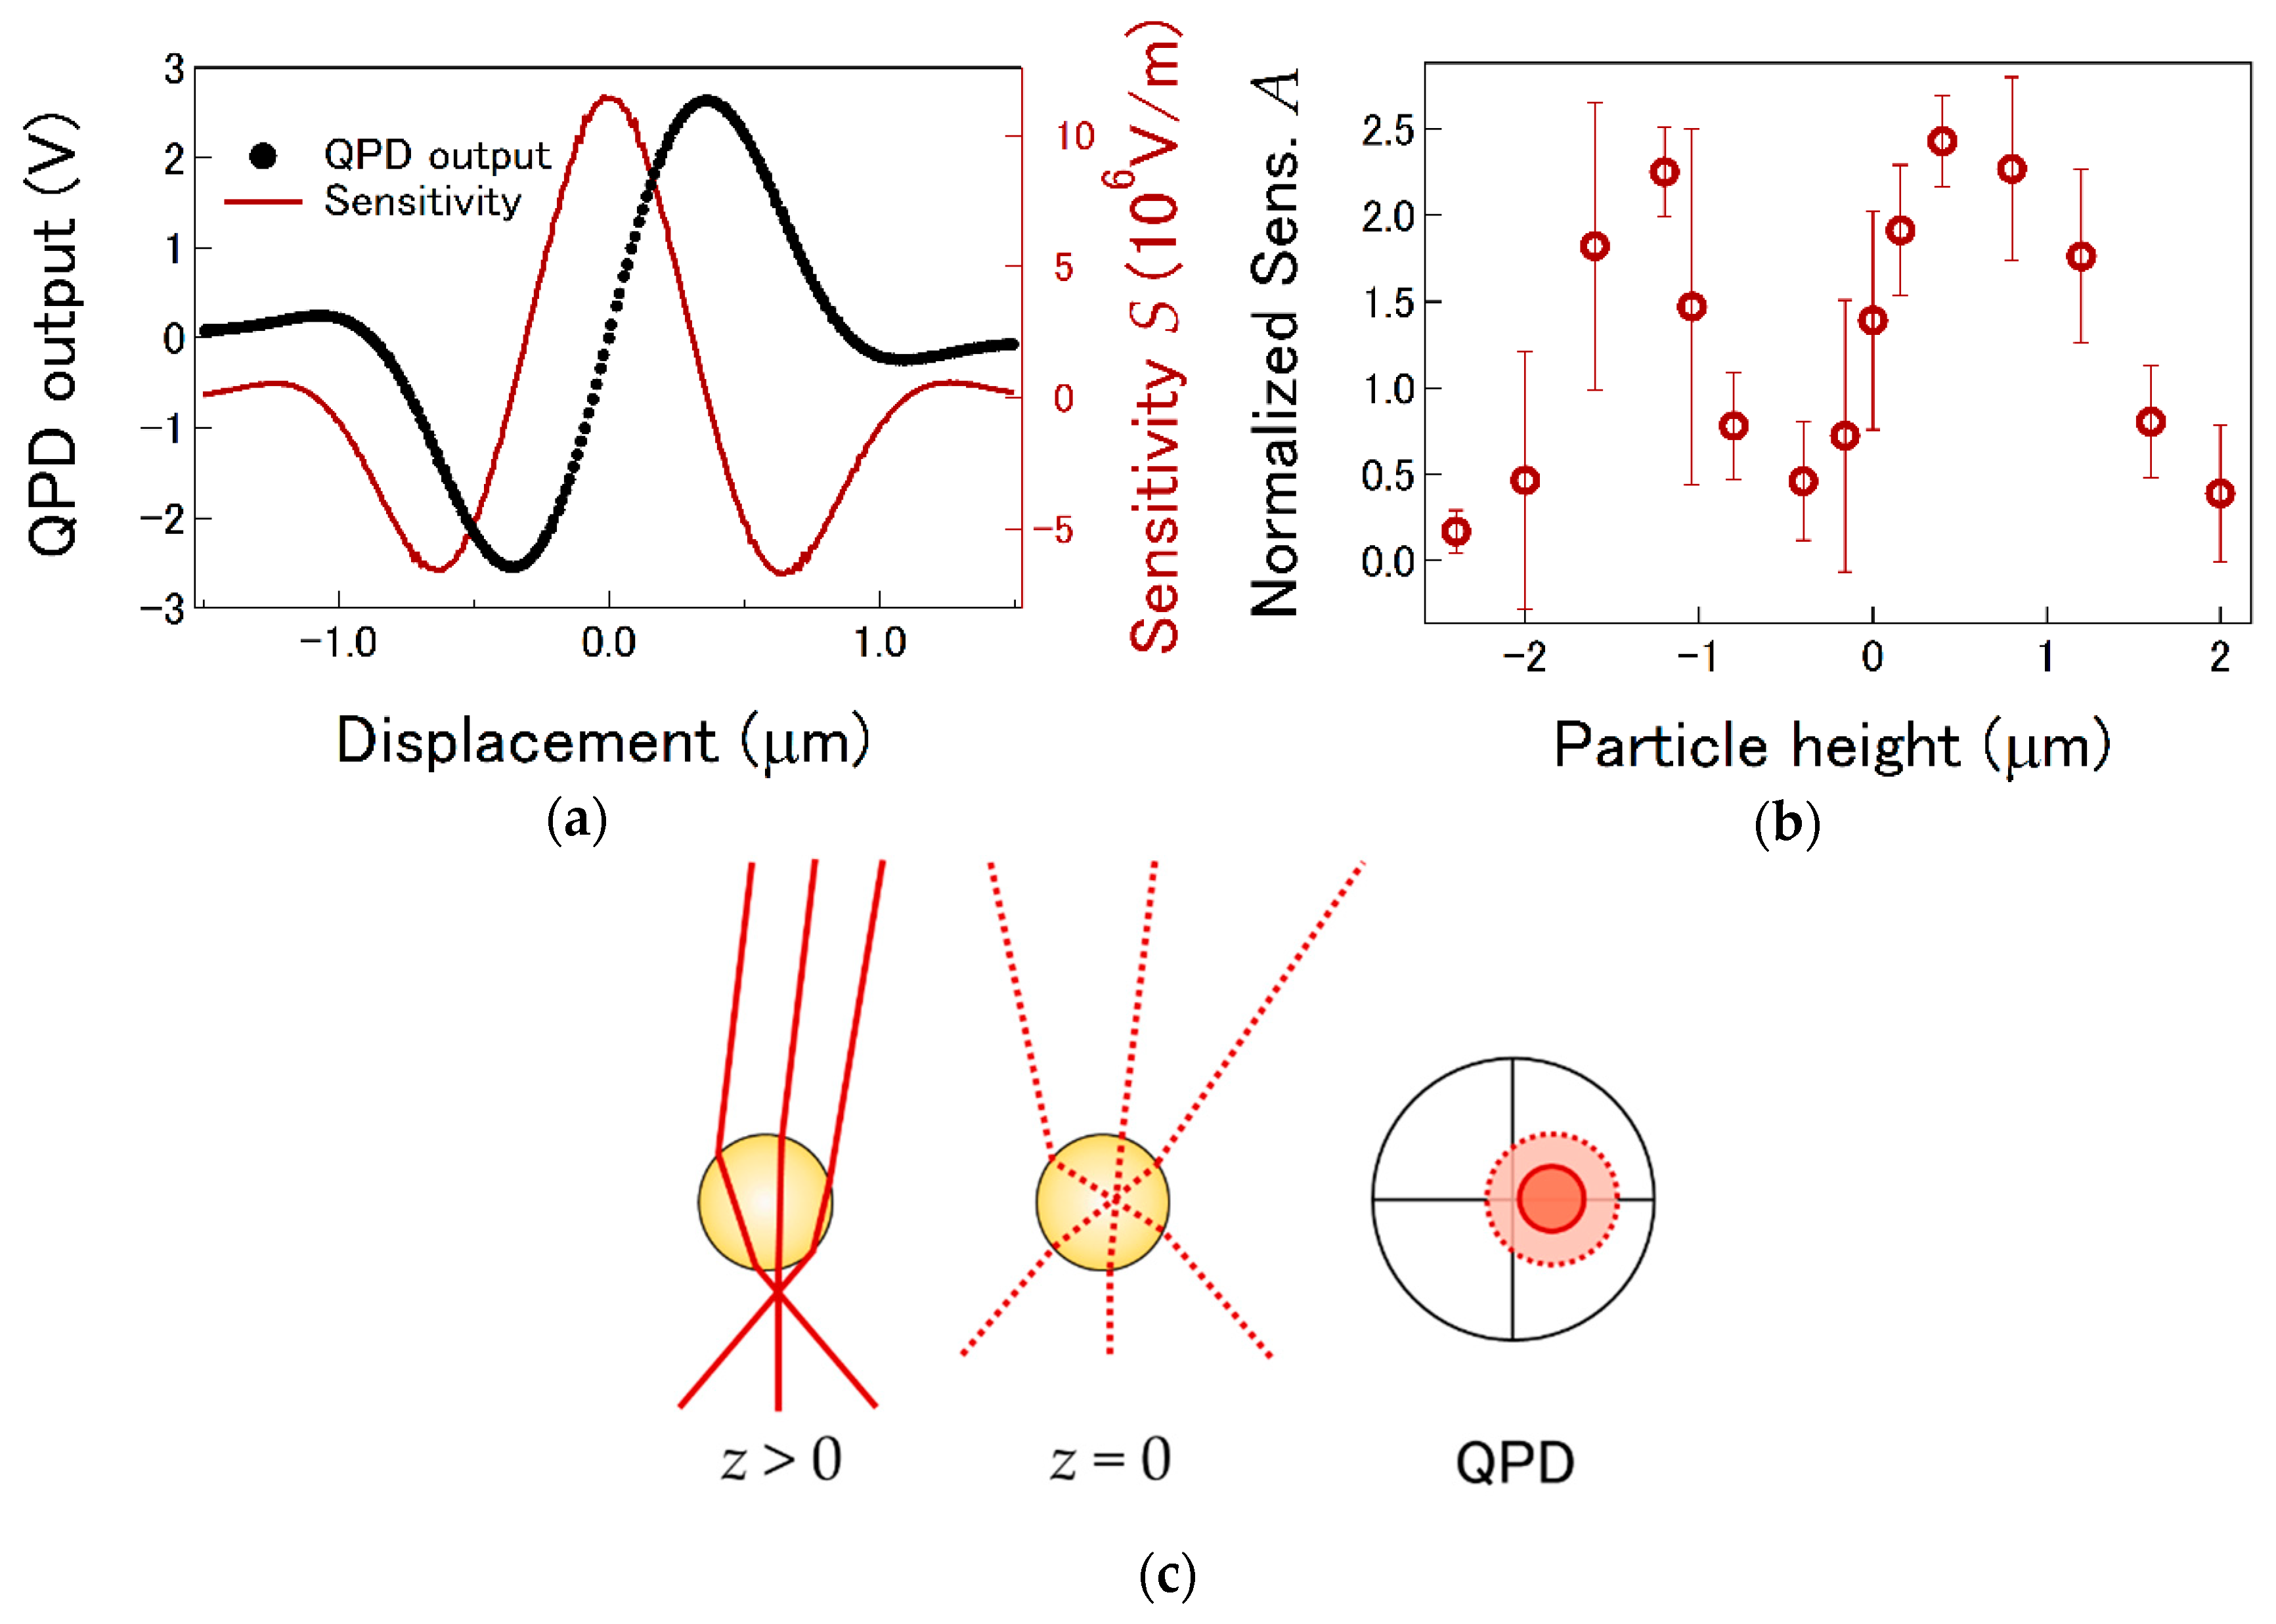
Next, in order to optimize the position sensitivity of LI, we investigate the LI signal as a function of the probe position relative to the focus of the probe laser [6]. The black-dotted curve in Figure 6a shows the LI signal as a function of the radial offset (x, y) of the probe center from the laser focus. In this experiment, the probe particle was kept located at the focus plane (z = 0). LI outputs are proportional to probe displacements when the probe is within the range of less-than ~±0.13 µm from the optical axis. Its gradient shown by the red curve provides the LI sensitivity which is approximately constant in the narrow linear range; the radial displacements of a probe need to be smaller than the range LI experiments. In living cells, however, the probe particle moves more than µm during the experimental period of time. The feedback-tracking technique is therefore used to stably track a vigorously fluctuating probe in non-equilibrium systems [15]. A piezo stage on which a sample dish is placed is controlled with a feedback in order to maintain a probe in the laser focus.
It has been expected that the LI sensitivity could have larger tolerance on the probe offset in the z direction (axial offset) compared to the radial offsets. However, z offset also affects the sensitivity when the probe fluctuations are vigorous [37]. Therefore, in this study, we have searched for the best z position for the sensitivity of LI. Probe particles were dispersed in an elastic hydrogel (0.5 wt% agarose [38]) and LI sensitivity was measured as a function of the probe position in z direction. The melamine particle with 2a = 1 µm diameter was used as a probe. Since the agarose gel is highly elastic at the concentration prepared for our experiments, a weak optical trap does not substantially affect the probe position. Therefore, we measured the LI sensitivity while scanning the axial position (z) of the probe. As shown in Figure 6b, the best sensitivity was not obtained when the probe is located at the plane of the laser focus (z = 0) [37]. The sensitivity increases when the probe is above the laser focus (z > 0) and reaches its maximum at z ~ 0.4 µm. Since the probe particle could work as a convex lens and reduce the size of the laser profile at the BFP while the average deflection of the laser is less affected (Figure 6c), the sensitivity takes the maximum there. When the probe is situated beneath the plane of the laser focus (z < 0), on the other hand, the dispersion of sensitivities was larger. Although the mean sensitivity takes its second maximum around z ~ −1.2 µm, LI experiments are not appropriate at z < 0 because of the large errors.
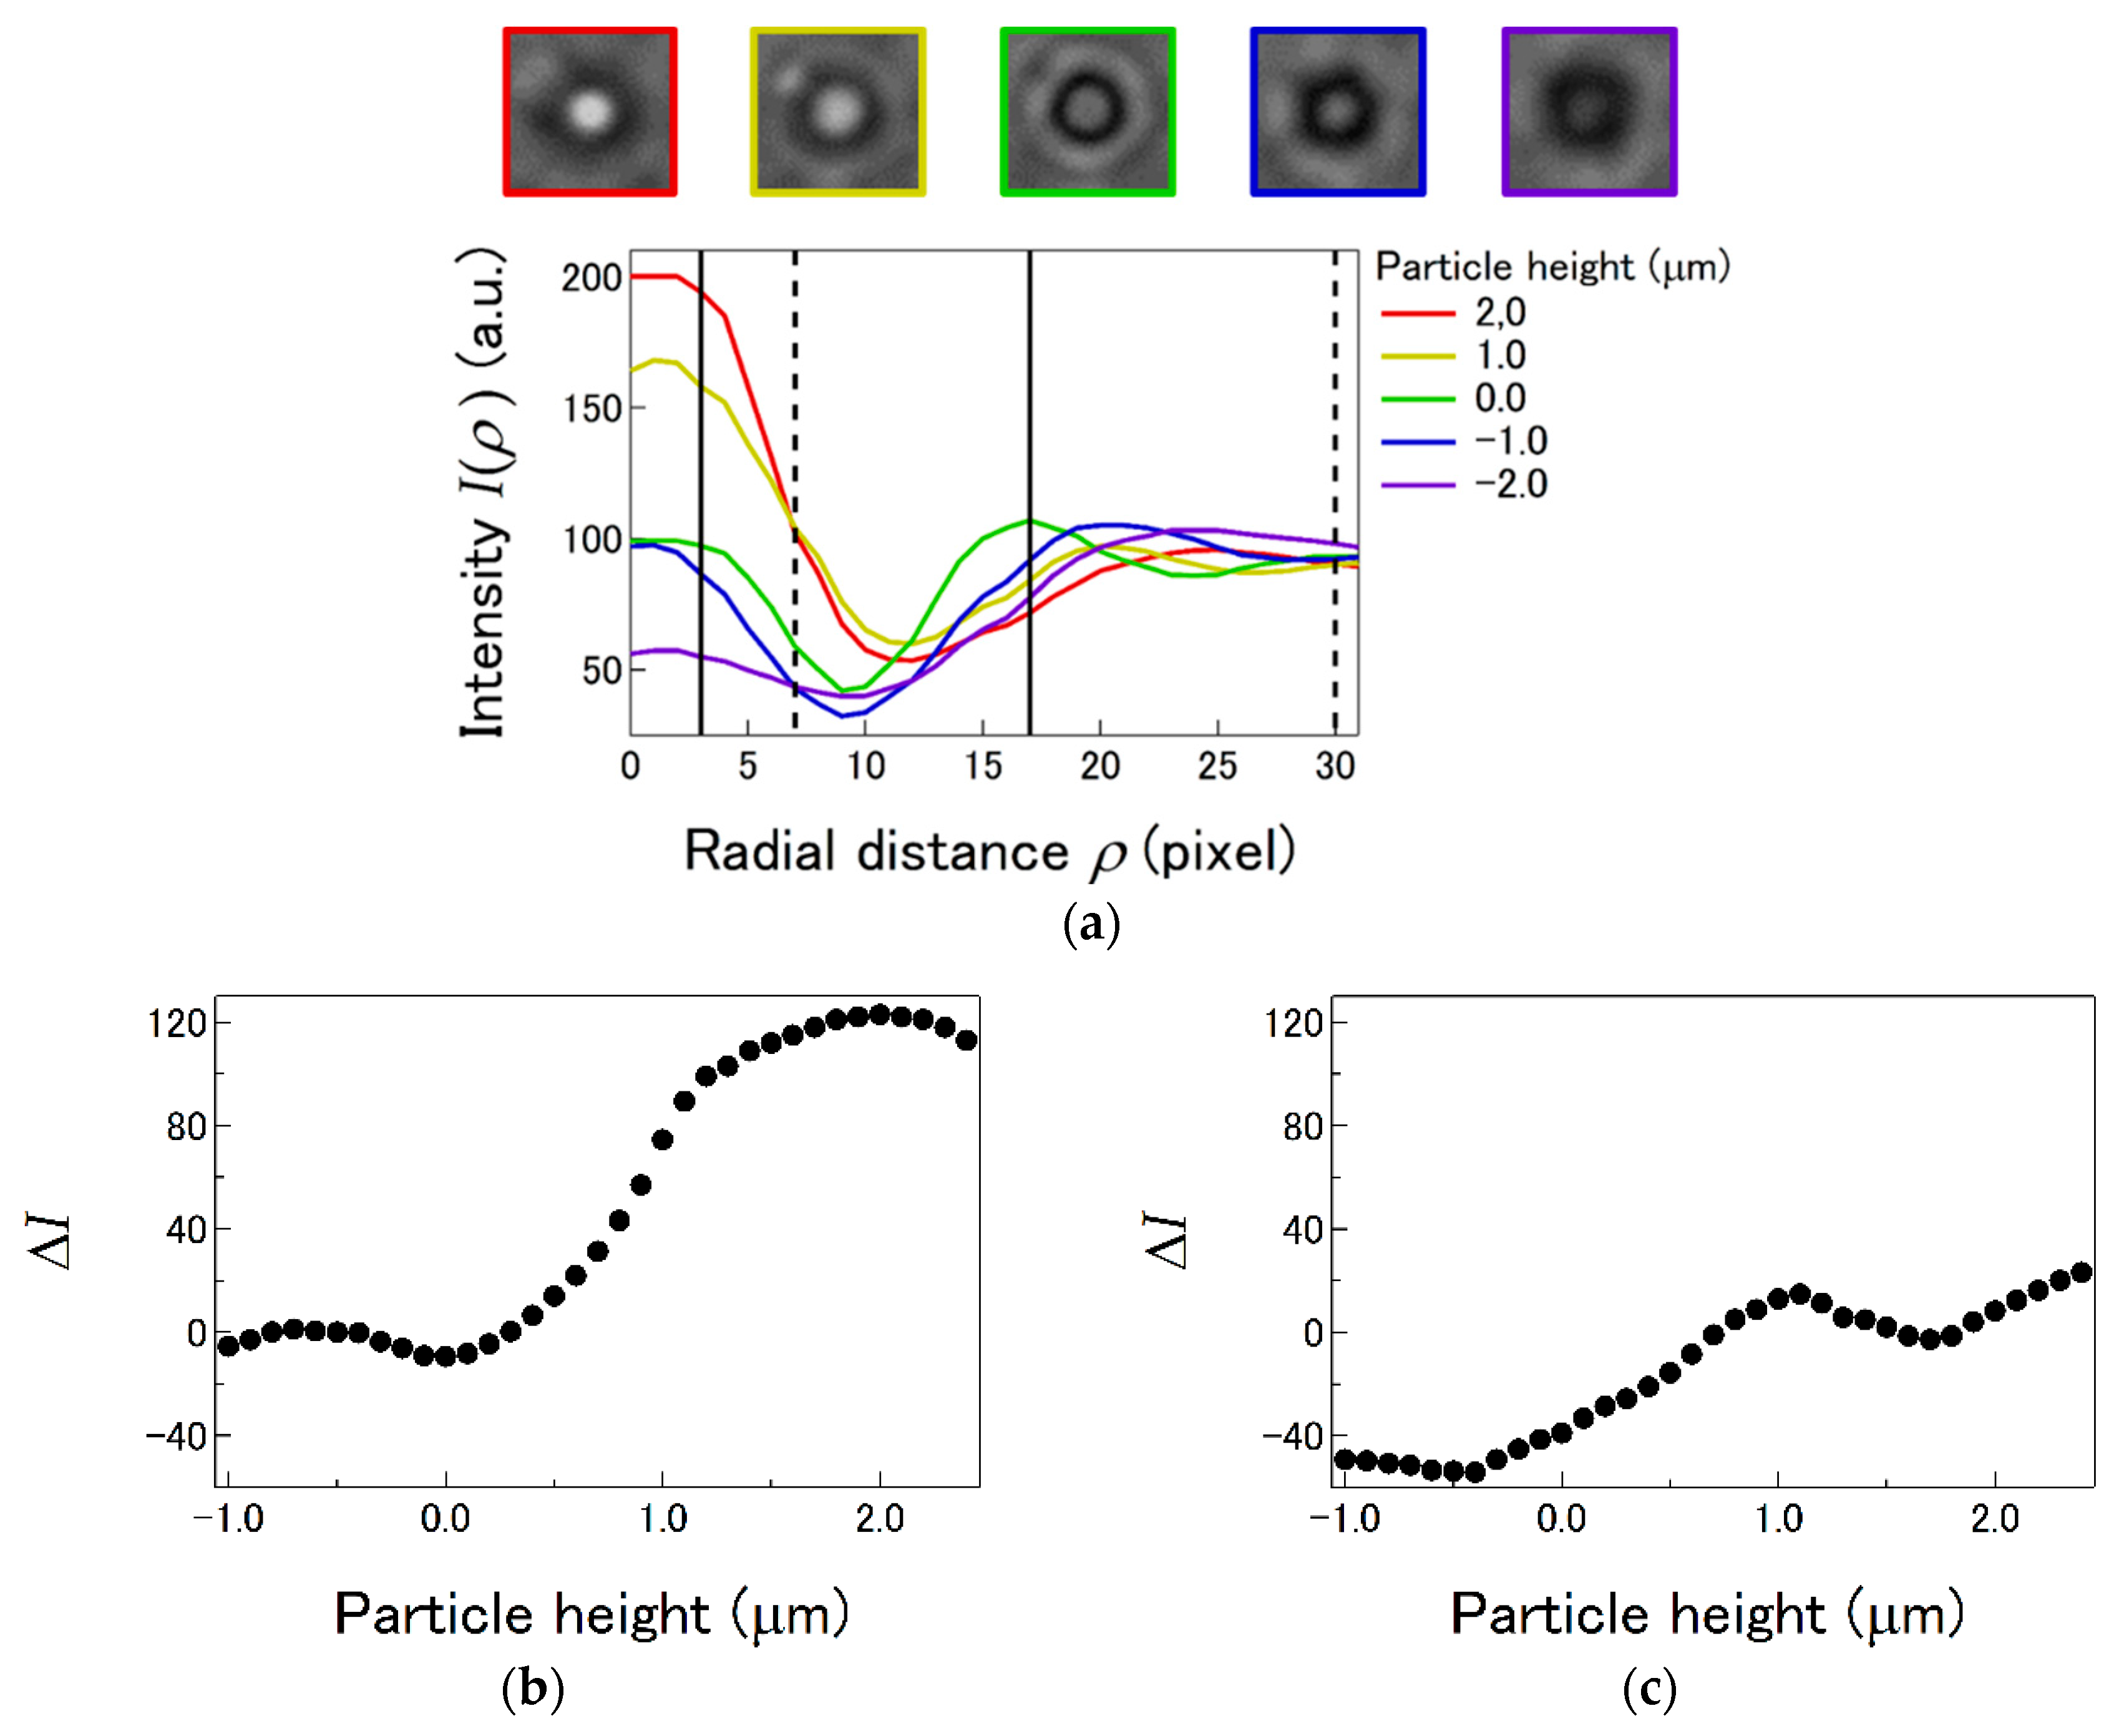
For OT and LI experiments in living cells, since the height of the particle vigorously fluctuates, z position of the probe particle must be also controlled by the feedback [15]. However, the feedback control in z direction is not as stable as the other directions, causing once-in-a-while failure of the particle tracking. We therefore investigate the reason and explore the way to optimize the feedback stability. For the feedback control in z direction, the probe height was obtained from the microscope images of the particles. The procedure for the image analysis utilizes a similar principle to holographic microscopy [39], though we use it in a more practical manner. First, the pixel intensity I (ρ) as a function of radial distance ρ from the probe center was obtained from the microscope image as shown in Figure 7a. It is seen that the radial intensity profile of the probe image depends on the probe height. We chose two different positions from the probe center (ρ = 4 and 22 pix) and obtained the difference of the pixel intensities ΔI as shown by the solid and broken lines in Figure 7a. By moving the piezo stage in the z direction, it is observed that ΔI changes linearly while the probe height is altered in the rage of −0.3 μm < z < 0.2 μm, as shown by the blue circles in Figure 7b. It was confirmed that ΔI can be used as a measure for probe heights in the linear region. When the feedback control of probe position is conducted in this range in the z direction, ΔI can be used as the “measure signal” that should be maintained at a certain assigned value referred to as the “setpoint”. When a probe accidentally goes out of the proportional range, on the other hand, the feedback tracking fails.
In the usual set up of the microscope used for OT and LI, the focus of microscope image and the focus of the trapping laser is overlapped at z = 0. In this condition, z position optimized for LI sensitivity (z ~ 0.4 µm, Figure 6b) is at the edge of the range in which ΔI is linearly dependent on the probe height z. Thus, z position at which the best LI sensitivity is achieved is not ideal for the feedback-tracking stability. However, the focus position for the microscope image can be shifted by inserting TV lens in front of camera and tuning the distance between them. The red triangles in Figure 7b show ΔI measured by shifting the microscope focus towards z > 0. Note that ΔI now changes linearly with probe heights in the range of 0.4 < z < 1.1 µm. The probe height in which the optimized LI sensitivity is achieved then resides in the middle of the range.
We performed similar experiments in a living cell (Figure 6a). During the measurement, the feedback control was conducted only in radial directions (x, y), but not in the z direction since z positions of the probe must be scanned exceeding the range of heights in which the feedback control is available in the z direction. Instead, the stage was moved in z direction faster than the time scale of probe fluctuations in cells. For the same set of images recorded during the scan, ΔI was calculated for ρ = 3 and 17 pix in Figure 8b and ρ = 7 and 30 pix in Figure 8c. The feedback control of the probe height is accurate and stable when the absolute value of the slope of ΔI is sufficiently large (z ~ 0.8 µm in Figure 8b and ~ 0.5 µm in Figure 8c). It is seen that the slope and the linear range of ΔI depends on the choice of ρ. The range of heights in which ΔI is linearly dependent is largely determined by the relative distance between laser focus and the focus of microscope images. However, it is hard to finely tune the setup before every experiment. Imaging conditions for the microscope such as lighting show subtle changes for every experiment and that could slightly shift the range of ΔI and affect feedback stability. Thereby, rather than adjusting the camera position for every experiment, one can optimize the LI sensitivity and the feedback stability by fine tuning the choice of ρ and setpoint.
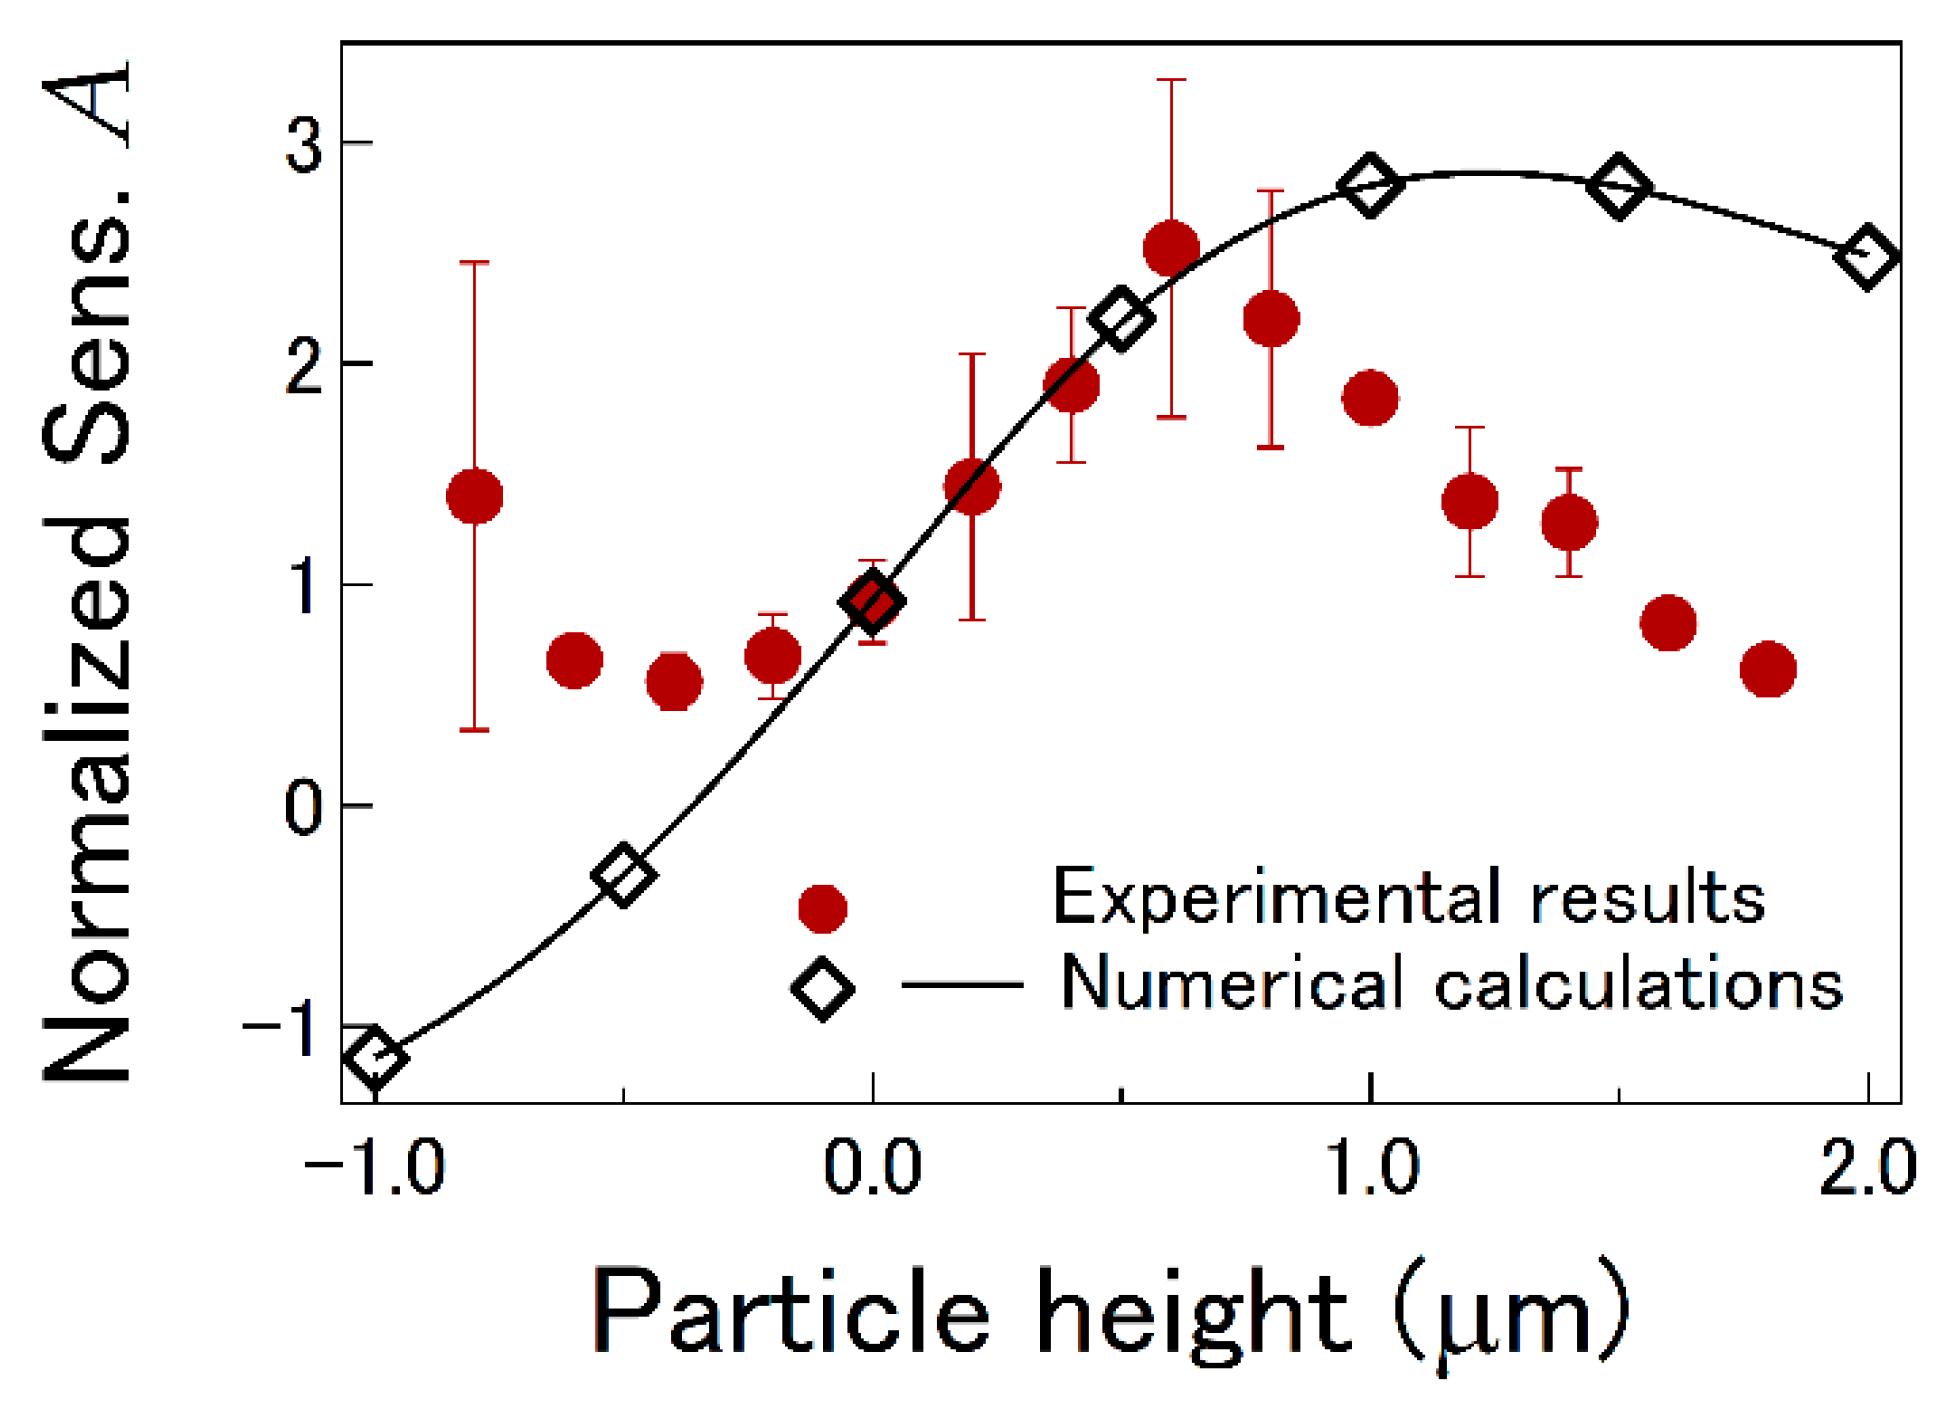
Finally, we measured the LI sensitivity in living cells as a function of probe offset in z direction while conducting 3-D feedback tracking. In order to conduct the feedback tracking in wide range of z, the different setup for the camera position was chosen when measuring below and above z = 1.5 µm. As shown with closed red circles in Figure 9, experimental results exhibit a similar trend to that observed in the agarose gel (Figure 6b). Note again that the sensitivity is remarkably reduced at z = 0 , and takes its maximum at z ~ 0.5 µm. Open black diamonds in Figure 9 show the results of numerical calculations based on Lorenz–Mie theory [32]. The simulation results were interpolated to provide the solid curve as an eye guide. Trend of the measured sensitivity (closed red circles) agrees with the theory in the range 0.0 µm < z < 0.5 µm. The numerically-calculated sensitivity takes negative values when the probe particle is located below the laser focus (z < 0). Considering that the optical trapping force is derived from the change of the momentum of photons, the conversion of the sign is elusive and not observed in experiments. Lorenz–Mie theory has been frequently used for investigating the scattering of the plane light wave by a spherical object [19]. In order to predict the LI sensitivity for the optically trapped particle, it might be necessary to extend classical Lorenz–Mie theory for a strongly focused Gaussian laser. Regardless of the exact physical origin, the focal-offset dependence of the LI sensitivity clarifies that the probe heights compared to the laser focus must be maintained for the best LI sensitivity during LI experiments in cells. The feedback tracking is indispensable for that purpose and the stability must be optimized independently.

5. Conclusions

In this study, we investigated the way to optimize OT and LI experiments in biological cells. Using cultured cells and in vitro homogeneous samples, positional sensitivities of LI experiments were measured for various conditions and compared to theoretical predictions. The dependence of the LI sensitivity on the refractive indices of in vitro samples (aqueous glycerol) and probe particles (silica, latex, melamine) conformed to geometrical optics and Rayleigh scattering theory. In living cells, LI sensitivities were measured while the relative location (x, y, z) of a probe to the laser focus is maintained with the feedback-tracking technique. Regardless of the precise measurements with the feedback control, results in living cells showed greater systematic and random errors, especially when silica particles were used as a probe. Our investigations indicate that the in-situ calibrations of the positional sensitivity are a prerequisite for LI experiments in living cells because the cell interior is heterogeneous in space and the heterogeneity fluctuates with time.
The feedback-tracking technique was necessary for LI experiments and in-situ calibrations in living cells, not only because probes readily go out of the laser focus during the experimental period of time, owing to vigorous cytoplasmic fluctuations. As we showed in this study, even if the probe is maintained around the focus of the laser, the LI sensitivity still depends on the slight deviations from the laser focus. Therefore, the offsets between the probe particle and the laser focus must be maintained with small tolerance for the precise OT and LI in living cells. We report that the LI sensitivity was stable in a narrow range − 0.15   μ m   <   x ,   y   <   0.15   μ m ) for probe offsets in radial directions. For offset in the direction of the optical axis, it was found that the LI sensitivity at z = 0 is significantly reduced. The sensitivity is both higher and more stable when the probe is located above the laser focus (z ~ 0.6 µm). However, the stable feedback tracking was not possible at the position. For conducting feedback tracking in the z direction, we measured the z position of the probe particle by analyzing the microscope image. Since the high-magnification and high-NA objective lens was used for OT and LI, the probe image was already significantly defocused at z ~ 0.6 µm. The feedback tracking was then destabilized since the z position could not be precisely estimated. In this study, the feedback stability and the LI sensitivity was optimized simultaneously by shifting the focus of the microscope image by moving the camera position and by conducting extra tuning in the z estimation procedure. We believe that the achieved precision and stability of LI experiments are unprecedented in living cells, and thus will open the door to novel micromechanical investigations of living cell interiors.

Author Contributions

Conceptualization, D.M.; formal analysis, Y.S. and M.I.; investigation, Y.S. and M.I.; writing—original draft preparation, D.M.; writing—review and editing, Y.S. and D.M.; supervision, D.M.; funding acquisition, D.M. All authors have read and agreed to the published version of the manuscript.

Funding

This work was supported by JSPS KAKENHI Grant Number JP18H01189, JP25103011, JP15H03710 (to DM).

Conflicts of Interest

The authors declare no conflict of interest.

References

  1. Ashkin, A.; Dziedzic, J.M.; Bjorkholm, J.E.; Chu, S. Observation of a Single-Beam Gradient Force Optical Trap for Dielectric Particles. Opt. Lett. 1986, 11, 288–290. [Google Scholar] [CrossRef] [Green Version]
  2. Ashkin, A. Optical trapping and manipulation of neutral particles using lasers. Proc. Natl. Acad. Sci. USA 1997, 94, 4853–4860. [Google Scholar] [CrossRef] [Green Version]
  3. Svoboda, K.; Block, S.M. Biological Applications of Optical Forces. Annu. Rev. Biophys. Biomol. Struct. 1994, 23, 247–285. [Google Scholar] [CrossRef] [PubMed]
  4. Wang, X.; Chen, S.; Kong, M.; Wang, Z.; Costa, K.D.; Li, R.A.; Sun, D. Enhanced cell sorting and manipulation with combined optical tweezer and microfluidic chip technologies. Lab Chip 2011, 11, 3656–3662. [Google Scholar] [CrossRef] [PubMed]
  5. Zhang, H.; Liu, K.K. Optical tweezers for single cells. J. R. Soc. Interface 2008, 5, 671–690. [Google Scholar] [CrossRef] [PubMed] [Green Version]
  6. Gittes, F.; Schmidt, C.F. Interference model for back-focal-plane displacement detection in optical tweezers. Opt. Lett. 1998, 23, 7–9. [Google Scholar] [CrossRef]
  7. Ariga, T.; Tomishige, M.; Mizuno, D. Nonequilibrium Energetics of Molecular Motor Kinesin. Phys. Rev. Lett. 2018, 121, 218101. [Google Scholar] [CrossRef] [Green Version]
  8. Svoboda, K.; Schmidt, C.F.; Schnapp, B.J.; Block, S.M. Direct Observation of Kinesin Stepping by Optical Trapping Interferometry. Nature 1993, 365, 721–727. [Google Scholar] [CrossRef]
  9. Schurmann, M.; Scholze, J.; Muller, P.; Guck, J.; Chan, C.J. Cell nuclei have lower refractive index and mass density than cytoplasm. J. Biophotonics 2016, 9, 1068–1076. [Google Scholar] [CrossRef]
  10. Przibilla, S.; Dartmann, S.; Vollmer, A.; Ketelhut, S.; Greve, B.; von Bally, G.; Kemper, B. Sensing dynamic cytoplasm refractive index changes of adherent cells with quantitative phase microscopy using incorporated microspheres as optical probes. J. Biomed. Opt. 2012, 17, 097001. [Google Scholar] [CrossRef] [Green Version]
  11. Kam, Z.; Hanser, B.; Gustafsson, M.G.; Agard, D.A.; Sedat, J.W. Computational adaptive optics for live three-dimensional biological imaging. Proc. Natl. Acad. Sci. USA 2001, 98, 3790–3795. [Google Scholar] [CrossRef] [PubMed] [Green Version]
  12. Mullenbroich, M.C.; McAlinden, N.; Wright, A.J. Adaptive optics in an optical trapping system for enhanced lateral trap stiffness at depth. J. Opt. UK 2013, 15, 075305. [Google Scholar] [CrossRef]
  13. Seitz, P.C.; Stelzer, E.H.K.; Rohrbach, A. Interferometric tracking of optically trapped probes behind structured surfaces: A phase correction method. Appl. Opt. 2006, 45, 7309–7315. [Google Scholar] [CrossRef] [PubMed]
  14. Norregaard, K.; Metzler, R.; Ritter, C.M.; Berg-Sorensen, K.; Oddershede, L.B. Manipulation and Motion of Organelles and Single Molecules in Living Cells. Chem. Rev. 2017, 117, 4342–4375. [Google Scholar] [CrossRef] [PubMed] [Green Version]
  15. Nishizawa, K.; Bremerich, M.; Ayade, H.; Schmidt, C.F.; Ariga, T.; Mizuno, D. Feedback-tracking microrheology in living cells. Sci. Adv. 2017, 3, e1700318. [Google Scholar] [CrossRef] [PubMed] [Green Version]
  16. Khokhlova, A.; Zolotovskii, I.; Stoliarov, D.; Vorsina, S.; Liamina, D.; Pogodina, E.; Fotiadi, A.A.; Sokolovski, S.G.; Saenko, Y.; Rafailov, E.U. The Photobiomodulation of Vital Parameters of the Cancer Cell Culture by Low Dose of Near-IR Laser Irradiation. IEEE J. Sel. Top. Quant. Electron. 2019, 25, 1–10. [Google Scholar] [CrossRef]
  17. Konig, K.; Liang, H.; Berns, M.W.; Tromberg, B.J. Cell damage by near-IR microbeams. Nature 1995, 377, 20–21. [Google Scholar] [CrossRef]
  18. Neuman, K.C.; Chadd, E.H.; Liou, G.F.; Bergman, K.; Block, S.M. Characterization of photodamage to Escherichia coli in optical traps. Biophys. J. 1999, 77, 2856–2863. [Google Scholar] [CrossRef] [Green Version]
  19. Hulst, H.C.; van de Hulst, H.C. Light Scattering by Small Particles; Dover Publications: New York, NY, USA, 1981. [Google Scholar]
  20. Vermeulen, K.C.; Wuite, G.J.; Stienen, G.J.; Schmidt, C.F. Optical trap stiffness in the presence and absence of spherical aberrations. Appl. Opt. 2006, 45, 1812–1819. [Google Scholar] [CrossRef] [Green Version]
  21. Ashkin, A. Forces of a Single-Beam Gradient Laser Trap on a Dielectric Sphere in the Ray Optics Regime. Biophys. J. 1992, 61, 569–582. [Google Scholar] [CrossRef] [Green Version]
  22. Jones, P.H.; Maragò, O.M.; Volpe, G. Optical Tweezers: Principles and Applications; Cambridge University Press: Cambridge, UK, 2015. [Google Scholar] [CrossRef]
  23. Mizuno, D.; Head, D.A.; MacKintosh, F.C.; Schmidt, C.F. Active and Passive Microrheology in Equilibrium and Nonequilibrium Systems. Macromolecules 2008, 41, 7194–7202. [Google Scholar] [CrossRef]
  24. Gittes, F.; Schmidt, C.F. Signals and noise in micromechanical measurements. Methods Cell Biol. 1998, 55, 129–156. [Google Scholar] [CrossRef]
  25. Phillips, K.G.; Jacques, S.L.; McCarty, O.J.T. Measurement of Single Cell Refractive Index, Dry Mass, Volume, and Density Using a Transillumination Microscope. Phys. Rev. Lett. 2012, 109, 118105. [Google Scholar] [CrossRef] [PubMed] [Green Version]
  26. Lue, N.; Popescu, G.; Ikeda, T.; Dasari, R.R.; Badizadegan, K.; Feld, M.S. Live cell refractometry using microfluidic devices. Opt. Lett. 2006, 31, 2759–2761. [Google Scholar] [CrossRef]
  27. Sernetz, M.; Thaer, A. Immersion Refractometry on Living Cells with Method of Refractive Index Gradient. Z. Anal. Chem. Fresenius 1970, 252, 90. [Google Scholar] [CrossRef]
  28. Barer, R.; Joseph, S. Refractometry of Living Cells 1. Basic Principles. Q. J. Microsc. Sci. 1954, 95, 399–423. [Google Scholar] [CrossRef]
  29. Rappaz, B.; Marquet, P.; Cuche, E.; Emery, Y.; Depeursinge, C.; Magistretti, P.J. Measurement of the integral refractive index and dynamic cell morphometry of living cells with digital holographic microscopy. Opt. Express 2005, 13, 9361–9373. [Google Scholar] [CrossRef] [Green Version]
  30. Curl, C.L.; Bellair, C.J.; Harris, T.; Allman, B.E.; Harris, P.J.; Stewart, A.G.; Roberts, A.; Nugent, K.A.; Delbridge, L.M.D. Refractive index measurement in viable cells using quantitative phase-amplitude microscopy and confocal microscopy. Cytom. Part A 2005, 65, 88–92. [Google Scholar] [CrossRef]
  31. Glycerine Producers Association. Physical Properties of Glycerine and Its Solutions; Glycerine Producers Association: New York, NY, USA, 1963. [Google Scholar]
  32. Laven, P. Simulation of rainbows, coronas, and glories by use of Mie theory. Appl. Opt. 2003, 42, 436–444. [Google Scholar] [CrossRef]
  33. Ting-Beall, H.P.; Needham, D.; Hochmuth, R.M. Volume and osmotic properties of human neutrophils. Blood 1993, 81, 2774–2780. [Google Scholar] [CrossRef] [Green Version]
  34. Guilak, F.; Erickson, G.R.; Ting-Beall, H.P. The effects of osmotic stress on the viscoelastic and physical properties of articular chondrocytes. Biophys. J. 2002, 82, 720–727. [Google Scholar] [CrossRef] [Green Version]
  35. Zhou, E.H.; Trepat, X.; Park, C.Y.; Lenormand, G.; Oliver, M.N.; Mijailovich, S.M.; Hardin, C.; Weitz, D.A.; Butler, J.P.; Fredberg, J.J. Universal behavior of the osmotically compressed cell and its analogy to the colloidal glass transition. Proc. Natl. Acad. Sci. USA 2009, 106, 10632–10637. [Google Scholar] [CrossRef] [PubMed] [Green Version]
  36. Tasic, A.Z.; Djordjevic, B.D.; Grozdanic, D.K.; Radojkovic, N. Use of Mixing Rules in Predicting Refractive-Indexes and Specific Refractivities for Some Binary-Liquid Mixtures. J. Chem. Eng. Data 1992, 37, 310–313. [Google Scholar] [CrossRef]
  37. Chang, A.T.; Chang, Y.R.; Chi, S.; Hsu, L. Optimization of probe-laser focal offsets for single-particle tracking. Appl. Opt. 2012, 51, 5643–5648. [Google Scholar] [CrossRef] [PubMed]
  38. Bodensiek, K.; Li, W.X.; Sanchez, P.; Nawaz, S.; Schaap, I.A.T. A high-speed vertical optical trap for the mechanical testing of living cells at piconewton forces. Rev. Sci. Instrum. 2013, 84, 113707. [Google Scholar] [CrossRef]
  39. Lee, S.H.; Grier, D.G. Holographic microscopy of holographically trapped three-dimensional structures. Opt. Express 2007, 15, 1505–1512. [Google Scholar] [CrossRef]
Figure 1. (a) Schematic description of the optical trap. A representative laser ray incident along z axis is traced and deflected at the particle surface as shown by the red arrow. The compensating force is then applied to the particle towards the focus of the laser (blue arrow), that is chosen as the origin of the Cartesian coordinate (x, y, z). (b) Schematic illustration of back-focal-plane laser interferometry (LI). Image of the interference pattern at the back focal plane (BFP) was projected on to the quadrant photodiode (QPD). The average position of the interference pattern shifts in proportion to the displacement x of the particle from the laser focus (black arrow).
Applsci 10 04970 g001
Figure 2. Experimental setup for OT (optical trapping) and LI (laser interferometry) that is implemented with 3-D feedback-control of piezo stage. Incident beam is tightly focused near the probe particle in a cell by the objective lens. Scattered and unscattered lights are collimated by the condenser lens; the QPD at the BFP of the condenser lens detects the laser refraction that is proportional to the probe offsets in (x, y). QPD signal is applied to the measure input of the PID controller for the feedback control of the piezo stage for horizontal directions (x, y). Microscopic image is captured and analyzed in the personal computer to obtain z position of the probe. The feedback control signal for z direction is then created and applied to piezo.
Applsci 10 04970 g002
Figure 3. Procedure for measuring LI sensitivity in agarose gel and in living cells. (a) The sensitivity S is given by the ratio of sinusoidal output of QPD V(t) to the displacement x(t) of the probe as S = (amplitude of V)/(amplitude of x). (b) V(t) and x(t) in agarose gel (see Section 3.4). Piezo sample stage was directly oscillated by a sinusoidal signal generated in a function generator. Similar data [sinusoidal V(t) and x(t)] were collected to obtain S in living cells while sinusoidal oscillation of a probe was made by the feedback which is provide a sinusoidal signal to setpoint of PID controller to control piezo stage in x or y directions.
Applsci 10 04970 g003
Figure 4. (a) Normalized LI sensitivity A S/S40 in aqueous glycerol with 2a = 1 µm probe particles (green: silica, blue: latex, red: melamine). Symbols (open squares, triangles and circles) are experimental data. Solid and broken curves are obtained based on geometrical optics [Equation (4)] and Rayleigh scattering [Equation (5)] approximations, respectively. In the range of explored conditions, approximated theories agree to experimental data that are provided by symbols with the same color. (b) LI sensitivities AfR(n40, np), which is free of uncontrollable factor G, are shown as a function of Δn, together with the predictions fR(n, np) made by Rayleigh scattering approximation (solid curves). Error bars represent standard deviations of the mean (N = 10).
Applsci 10 04970 g004
Figure 5. (a) Normalized LI sensitivity A in living HeLa cells and their theoretical predictions (green: silica, red: melamine, 2a = 1 µm). Symbols (closed squares and circles) are experimental results and error bars indicate standard deviations of the mean (silica: N = 3~5, melamine: N = 5). Solid and broken curves are the same theoretical predictions as those in Figure 4a. (b) Amplification of laser refraction at the cell-culture boundary. Scattered laser is refracted by the difference of the refractive index between cells (1.38) and culture medium (1.33). (c) AfR(n40, np)/(npn) in cells (closed symbols) and aqueous glycerol (open symbols) are shown together with the theoretical prediction fR(n, np)/(np − n). Silica probe in living cells shows enormous systematic and random errors from the theoretical prediction.
Applsci 10 04970 g005aApplsci 10 04970 g005b
Figure 6. (a) QPD output voltage (closed circles, left axis) as a function of probe offset (x or y) from the laser focus. 2a = 1 µm melamine particles in 0.5 wt% agarose gel were used. The piezo-sample stage was moved while the QPD signal and the probe position were measured. QPD signals are proportional to the probe offsets at the narrow proximity of the laser focus. LI sensitivity S was obtained as the gradient of the QPD output as shown by the red curve (right axis). (b) Height dependence of the Normalized LI sensitivity measured with 2a = 1 µm melamine particles in 0.5 wt% agarose gel. Error bars represent the standard deviations of the mean (N = 5). (c) Schematic illustrations of a typical laser lay for z > 0 (left, solid lines) and z = 0 (middle, broken lines), and the BFP image of the laser projected on to the QPD (right). The BFP image of the laser beam becomes smaller for z > 0 while the average deflection of the laser is not substantially affected. Consequently, the sensitivity takes its maximum for z   >   0.
Applsci 10 04970 g006
Figure 7. (a) Pixel intensity of particle image I(ρ) as a function of radial distance ρ from the center in the range of probe heights between z = −1.0 μm to 1.0 μm. ρ is given in the pixel unit (5.1 × 10⁻⁸ m/pix) and the intensities averaged in angular directions are shown. Upper figures show microscope image of probe particles (melamine 2a = 1 µm) imbedded in agarose gel (0.5 wt%). Colors used for the outline of the microscopic image correspond to the particle height of each curves in the graph. (b) ΔI (the difference of pixel intensities at ρ = 4 and 22) as a function of the probe height. The definition of ΔI is shown by using the vertical solid line and the dotted line in Figure 7a. Blue circles correspond to the data taken in the setup (1) which is the condition used to obtain data shown in (a). Red triangles were obtained in the setup (2) after shifting the focus of the microscopic image by moving the position of the video camera while the radial distances of ΔI was fixed (ρ = 4 and 22). Upper schematic illustrations show charge-coupled device (CCD) camera setup (1) and (2) together with the microscope images of the probe at z = 0.
Applsci 10 04970 g007
Figure 8. (a) I(ρ) in living HeLa cells measured while controlling the feedback in x and y directions. Height dependence of microscope images were recorded while quickly scanning w/o z feedback. Results are shown similar to those in Figure 7a. (b) Δ I as a function of particle height. Δ I was determined from I(ρ = 3 pix) and I(ρ = 17 pix), as shown by the vertical solid lines in (a). Linear region is 0.5 µm < z < 1 µm. (c) Another height dependence of Δ I that was determined by I(ρ = 7 pix) and I(ρ = 30 pix), as shown by the broken lines in (a). Linear region is shifted to −0.4 µm < z < 1 µm.
Applsci 10 04970 g008
Figure 9. Height dependence of LI sensitivity in HeLa cells. Red circles show experimental results. The focus of microscope image was changed at z = 1.5 µm by moving the CCD camera position because of the reason explained in Figure 7b and in the corresponding text. Open diamonds show numerical results based on Lorenz-Mie theory. Solid curve indicates the eye guide generated by the Smoothing Spline interpolation (Igor Pro, Wavemetrics, Lake Oswego, OR, USA). Error bars represent standard deviations of the mean in z 1.4 µm (N = 3).
Applsci 10 04970 g009