Article

Finite Element Study of the Effect of Internal Cracks on Surface Profile Change due to Low Loading of Turbine Blade

1
Graduate School of Natural Science and Technology, Okayama University, 3-1-1, Tsushimanaka, Kita-ku, Okayama 700-8530, Japan
2
Shimadzu Corporation, 1 Nishinokyo Kuwabara-cho, Nakagyo-ku, Kyoto 604-8511, Japan
*
Author to whom correspondence should be addressed.
Appl. Sci. 2020, 10(14), 4883; https://doi.org/10.3390/app10144883
Submission received: 13 June 2020 / Revised: 9 July 2020 / Accepted: 14 July 2020 / Published: 16 July 2020

Abstract

:
Turbine blades for thermal power plants are exposed to severe environments, making it necessary to ensure safety against damage, such as crack formation. A previous method detected internal cracks by applying a small load to a target member. Changes in the surface properties of the material were detected before and after the load using a digital holographic microscope and a digital height correlation method. In this study, this technique was applied in combination with finite element analysis using a 2D and 3D model simulating the turbine blades. Analysis clarified that the change in the surface properties under a small load varied according to the presence or absence of a crack, and elucidated the strain distribution that caused the difference in the change. In addition, analyses of the 2D model considering the material anisotropy and thermal barrier coating were conducted. The difference in the change in the surface properties and strain distribution according to the presence or absence of cracks was elucidated. The difference in the change in the top surface height distribution of the materials with and without a crack was directly proportional to the crack length. As the value was large with respect to the vertical resolution of 0.2 nm of the digital holographic microscope, the change could be detected by the microscope.

1. Introduction

Thermal power generation using gas turbines is expected to expand in the long term as a clean and economical power generation method. Gas turbines are a type of internal combustion engine. They are thermal engines that obtain power from the combustion of gases by expanding high-temperature gas obtained by burning petroleum, natural gas, or other fuels to rotate the turbine. At present, the improvement in the thermal efficiency of various high-temperature equipment in power plants is required to further improve performance. In order to achieve high efficiency, it is essential to increase the temperature of the combustion gas and the turbine inlet temperature. It is therefore necessary to design the turbine blades for high temperatures. A cooling passage can be formed inside the turbine blade, which is then cooled by passing a cooling medium, such as air or steam, through this cooling passage, thereby ensuring the sufficient heat resistance of the blade. This technology contributes the most to such requirements for high temperature resistance. A typical blade cooling structure is the pin fin cooling system [1,2]. This system performs convection cooling, impingement cooling, and film cooling inside the moving blade, and enables the cooling air to flow out of the blade. In addition, the mainstream method of lowering the surface temperature of the turbine blade is applied in thermal barrier coatings (TBCs), which not only lowers the surface temperature but also improves thermal fatigue characteristics. Therefore, ceramics are coated on the gas turbine surface using the electron-beam physical vapor deposition (EB-PVD) method proposed by Bose et al. [3]. However, there are concerns about damage and deterioration due to an increase in the thermal load applied to the TBC, and the improvement of durability is an issue. Therefore, in recent years, in addition to TBC, transpiration cooling of the turbine has been considered as an effective method for improving the durability of the turbine blades by using a porous material to form them. Arai [4] developed a porous ceramic coating (P-TBC) through which cooling air could pass. P-TBC has a thermal conductivity as low as 50% of a conventional TBC, and it has been shown that its adhesion strength is almost the same.
During the operation of the power plant, the turbine blades are subjected to high centrifugal loads due to the rotation of the rotor, flexural loads due to the working fluid, and vibration loads. These occur under the severe condition of a high temperature, hence cracks may develop in the cooling passage. Because of this reason, power plants regularly conduct non-destructive inspections, such as ultrasonic inspection tests and radiation transmission tests based on Japanese industrial standards [5] to detect turbine defects. Additionally, the cooling structure is checked, and the remaining life of the turbine is determined. Yoshioka et al. [6] proposed a prediction technique based on metallographic image analysis and a life assessment technique using damage trend analysis. These were based on statistical parameters of information from regular inspections of gas turbines where surface damage and material deterioration were prominent. In order to extend the inspection interval and increase the operation rate by accurately diagnosing the remaining life of the turbine, it is necessary to improve the precision of the inspection method to detect cracks generated in turbine blades in power plants.
To meet this requirement, one of the authors has proposed a new flaw detection method using digital holographic microscopy (DHM). This method can quickly obtain a nanometer-order height distribution over a wide area of 1 mm2 on the material surface and in an atmospheric environment [7,8,9]. Digital holographic microscopes can acquire 3D images of a sample surface in real time with a high resolution by using holograms. The vertical resolution of these is excellent at 0.2 nm, and the fine behavior of the material surface can be captured. In this method, a small load is applied to the target member, and the internal defect is detected based on the displacement of the member surface before and after the application of the load. This can be realized by combining DHM and digital height correlation method (DHCM), which identifies the same region before and after deformation, by referring to the patterns of the ultra-fine irregularities on the material surface. In this study, finite element (FE) analysis was performed on the new method using a model simulating a turbine blade to investigate the possibility of detecting cracks. Two-dimensional models were used to investigate the possibility of detecting cracks in cases where anisotropic materials or coating-treated materials are used for the turbine blade. A 3D model was used to investigate the possibility of detecting cracks by each trace line with DHM. Section 2 and Section 3 describe the FE analysis conditions and analysis results, respectively.

2. Finite Element Analysis

FE analysis was performed using three types of 2D models and a 3D model for the turbine blade. The nonlinear FE program ADINA 9.3.4 (ADINA R&D, Inc., Watertown, MA, USA) was used for the FE analysis.
Figure 1 shows the form and dimensions of the 2D analysis model. Figure 1a shows Model 2D and Model 2D-Anisotropy, and Figure 1b shows Model 2D-TBC. Table 1 shows the material properties of the four models. As shown in Table 1, the material properties of Model 2D and Model 2D-Anisotropy are different. These were determined based on the material properties of the Ni-based superalloy NCF625 (isotropic material) and a Ni-based directionally solidified (DS) alloy (anisotropic material), respectively. As these Ni-based superalloys have excellent high-temperature strength, they are widely used as materials for gas turbine blades [10,11,12]. The Ni-based DS alloy is a material with a controlled crystal orientation and grain growth direction (hence anisotropic [12]), and has high strength at high temperatures. Therefore, in order to investigate the effect of anisotropy on the deformation behavior of the turbine blade, analysis was performed using Model 2D-Anisotropy. For Model 2D-TBC, the authors considered a heat-resistant coating (bond coat layer and top coat layer). The material properties of the bond coat and top coat were determined with reference to the ceramic coating [13]. The materials of the bond coat and the top coat were CoNiCrAlY alloy and yttria-stabilized zirconia, respectively. In this study, we focused on the materials that may be used in the actual turbine blade. A plane strain condition was used for the 2D models. The actual turbine blade is large in the depth direction. Therefore, the plane strain condition can be more suitable than the plane stress condition. Figure 2 shows the form and dimensions of the 3D analysis model. The material properties of the 3D model were determined based on the Ni-based superalloy NCF625 (isotropic material). The load values in the case of the 2D and 3D models are 1916 N. The load range is determined by the following conditions. The lower limit of the load should provide a large enough displacement difference for DHM to be distinguishable, and the higher limit of the load should limit the elastic deformation regime. If a several millimeter-sized crack can be detected in the actual turbine blade, the crack detection method can be practically useful. Based on the ideal, the size and depth of the crack were determined.
Figure 3 shows the elements of Model 2D and Model 3D. Table 2 shows the number of nodes and number of elements in each model. In order to determine the element size, FE analysis was performed with a simple shape before analyzing the actual model, and the analysis values of the stress distribution near the crack were compared with theoretical values. To conduct the FE analysis calculation with high accuracy and efficiency, two types of elements were used for the models. A square eight-node element was used to model the element near the crack tip, and square four-node elements were used for other areas. The weight of the beam was not considered in the analysis because we focused on the difference of the deformation before and after the loading. There is no contact element in the FE analysis. In the FE analysis of all models, there is no contact on the crack surfaces because the crack opens due to the load. In the crack detection method, a load is applied to the actual turbine blade to open the presumed crack. By loading in such direction, the deformation can become larger and the crack detection can become easier.

3. Results and Discussion

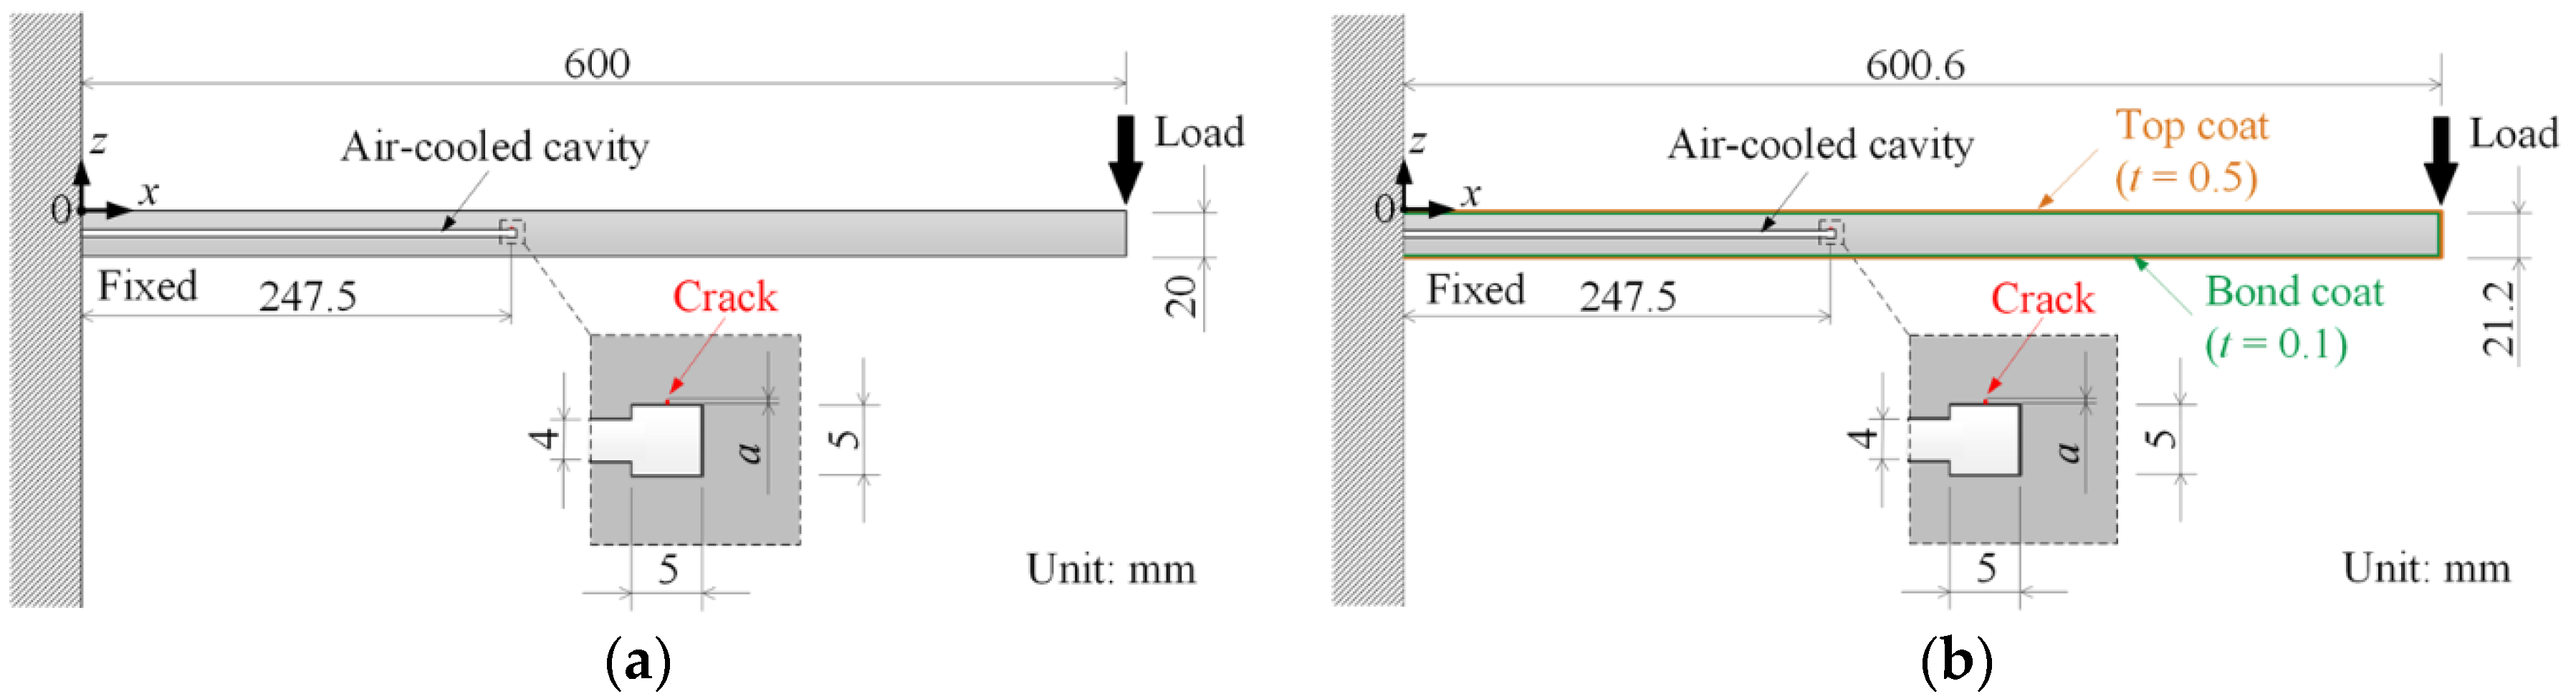
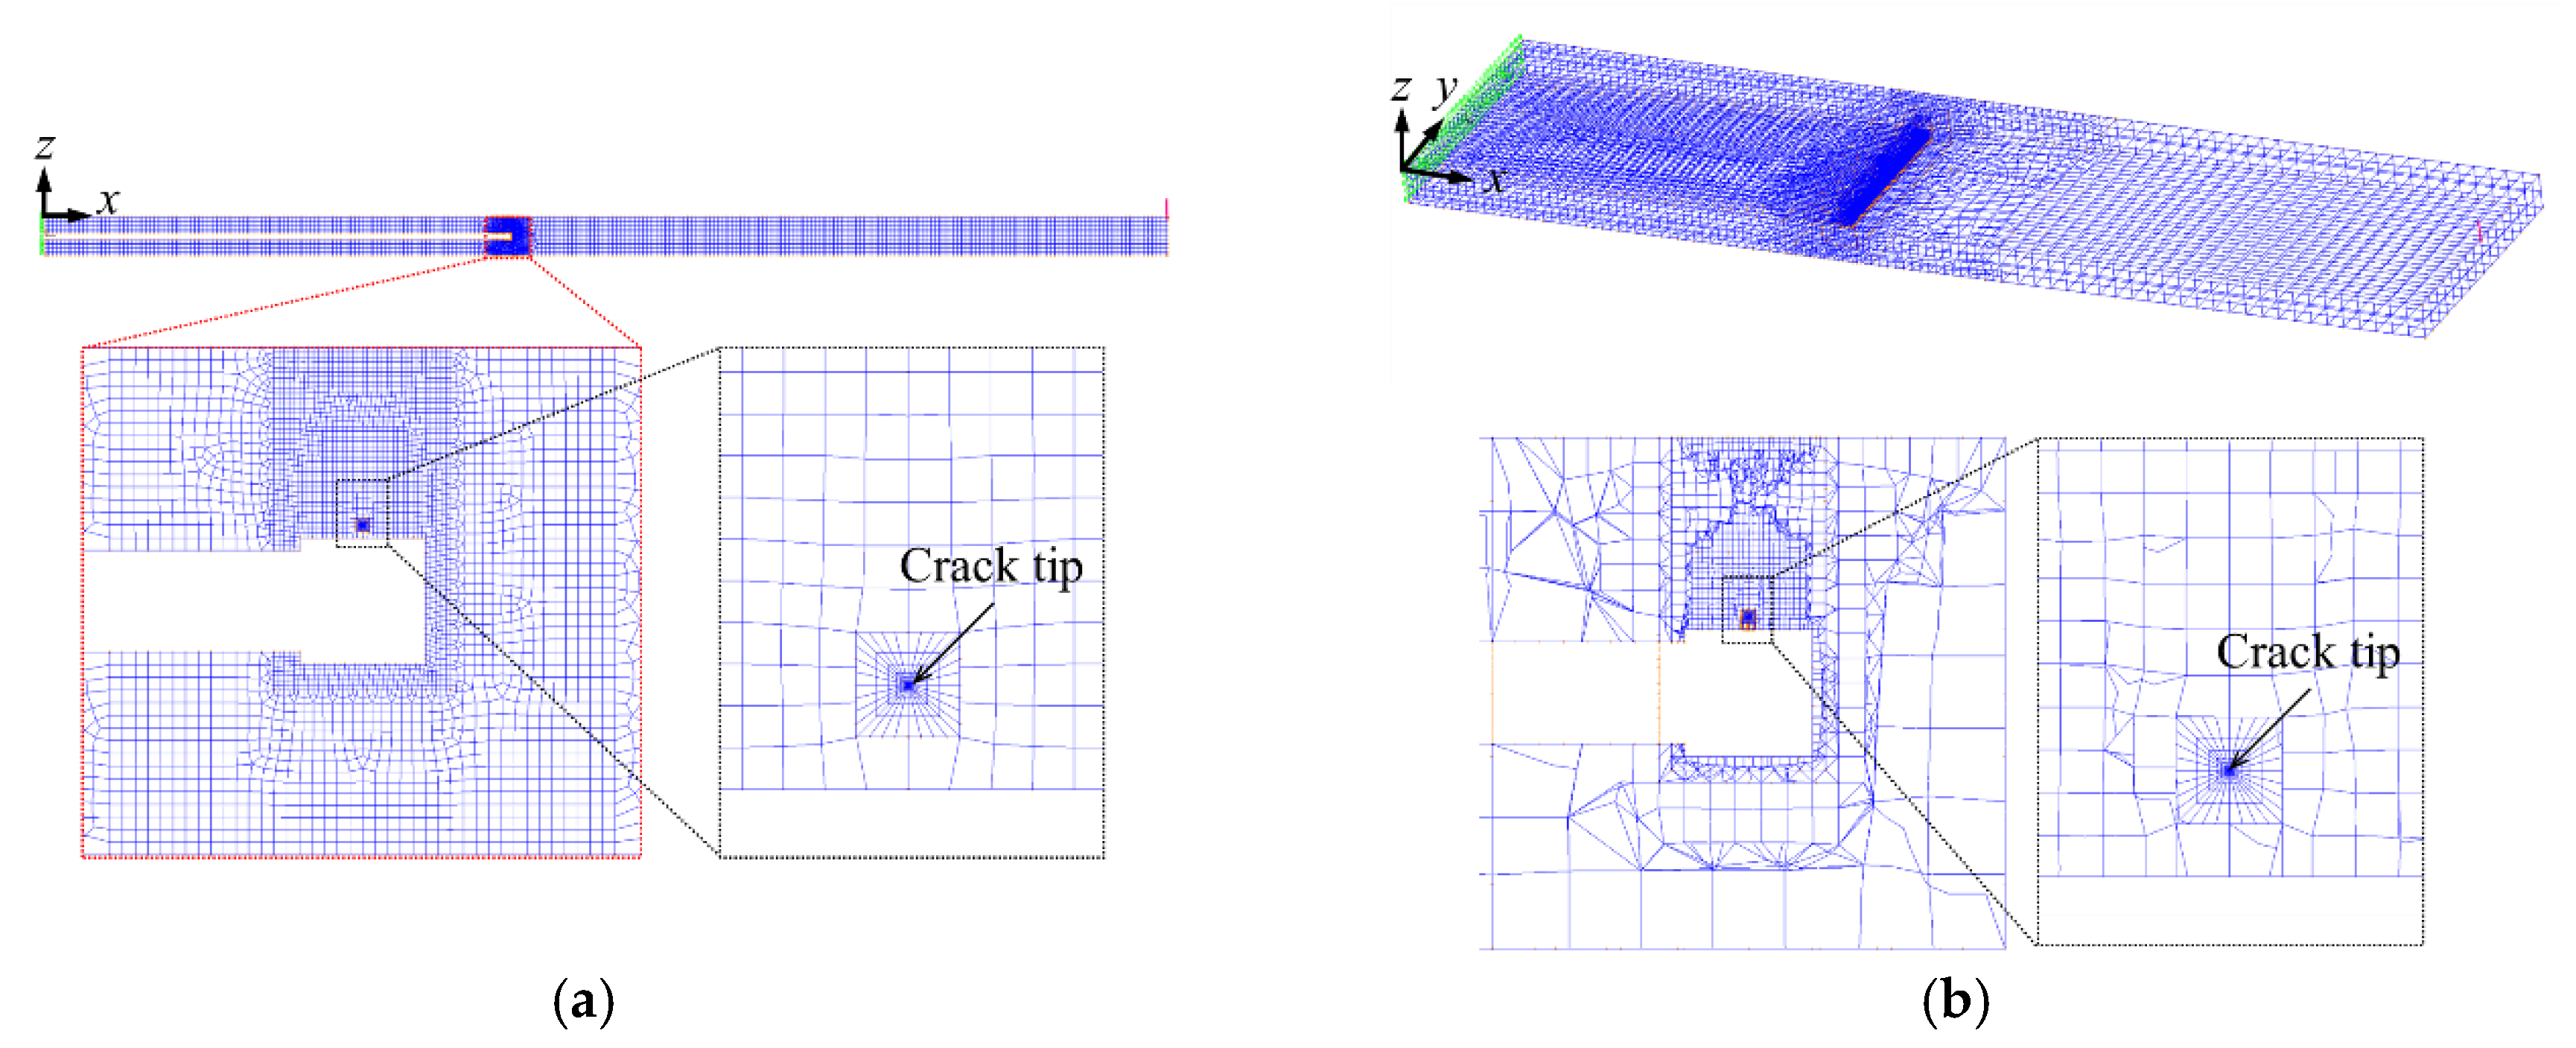
3.1. Two-Dimensional Models

3.1.1. Model 2D

Figure 4 shows the z-direction displacement of the surface of Model 2D. Macroscopically, no difference is observed between the four types of test specimens. Therefore, in order to reveal the influence of the existence and size of the crack on displacement in the z-direction, the difference in the z-direction displacement of the models with and without a crack is shown, as illustrated by Figure 5. In addition, it is found that the difference increases as the crack grows. Furthermore, it is found that there is a sharp change in the inclination near the position where x = 247.5 mm, where the crack is introduced. These height distribution differences are in the order of several microns to several tens of microns, which are sufficiently large with respect to the vertical DHM resolution of 0.2 nm. Therefore, it may be possible to detect cracks by ascertaining this change by DHM.
The effects of internal cracks on the difference in the change of the top surface height are discussed based on the results of stress and strain analysis. First, regarding the stress around the crack, it is required to determine the dominant stress among the normal stress (σx), which causes Mode I type deformation, and the shear stress (τxz), which leads to Mode II type deformation. Figure 6 shows the distribution of each stress above the cooling passage for each crack length. As shown in Figure 6a, when there is no crack, it can be observed that the proportion comprising the part with large tensile stress in the x-direction is higher than the stress in the z-direction and shear stress. As shown in Figure 6b–d, due to the introduction of the crack, the region where the tensile stress in the x-direction is 150 MPa or more is found to extend over a broad range compared to the tensile stress and shear stress in the z-direction in the vicinity of the crack tip. The ratio of σx/τxz at the same location near the crack tip in the same model, which roughly corresponds to the ratio of KI/KII, is approximately 2.3–2.4. KI and KII are the stress intensity factors for Model I and Mode II, respectively. From this, Mode I deformation is considered to have a greater effect than Mode II deformation. Additionally, as the crack length increases, the region in which each stress value is large expands. Subsequently, to clarify the influence of stress on the top surface height, Figure 7 shows the strain distribution in the z-direction above the cooling passage at each crack length. It is found that the strain distribution changes significantly around the crack in all the models. Additionally, in the range x = 240–245 mm and 250–255 mm, the compressive strain in the z-direction is found to increase as the crack length increases. This is considered to be the cause of the increase in the difference in change with the increase in the crack length. However, tensile strain in the z-direction is confirmed at the upper part of the crack tip at x = 247.5 mm in Figure 7. This is considered to be the cause of the inclination changing sharply in Figure 5. Additionally, as the crack length increases, the tensile strain at the tip of the crack spreads over a wider region. As described above, the stress distribution and strain distribution of the material under a low load is considered to change depending on the existence and size of the crack in the material. The existence and size of the crack change the cross-section. The cross-section change produces the macroscopic change in strain distribution. Moreover, the crack opens due to loading and the crack opening produces the microscopic change in strain distribution near the crack tip. The changes in macroscopic and microscopic strain distributions lead to the z-displacement change, which is expressed as the difference in the top surface height of the materials with and without a crack.

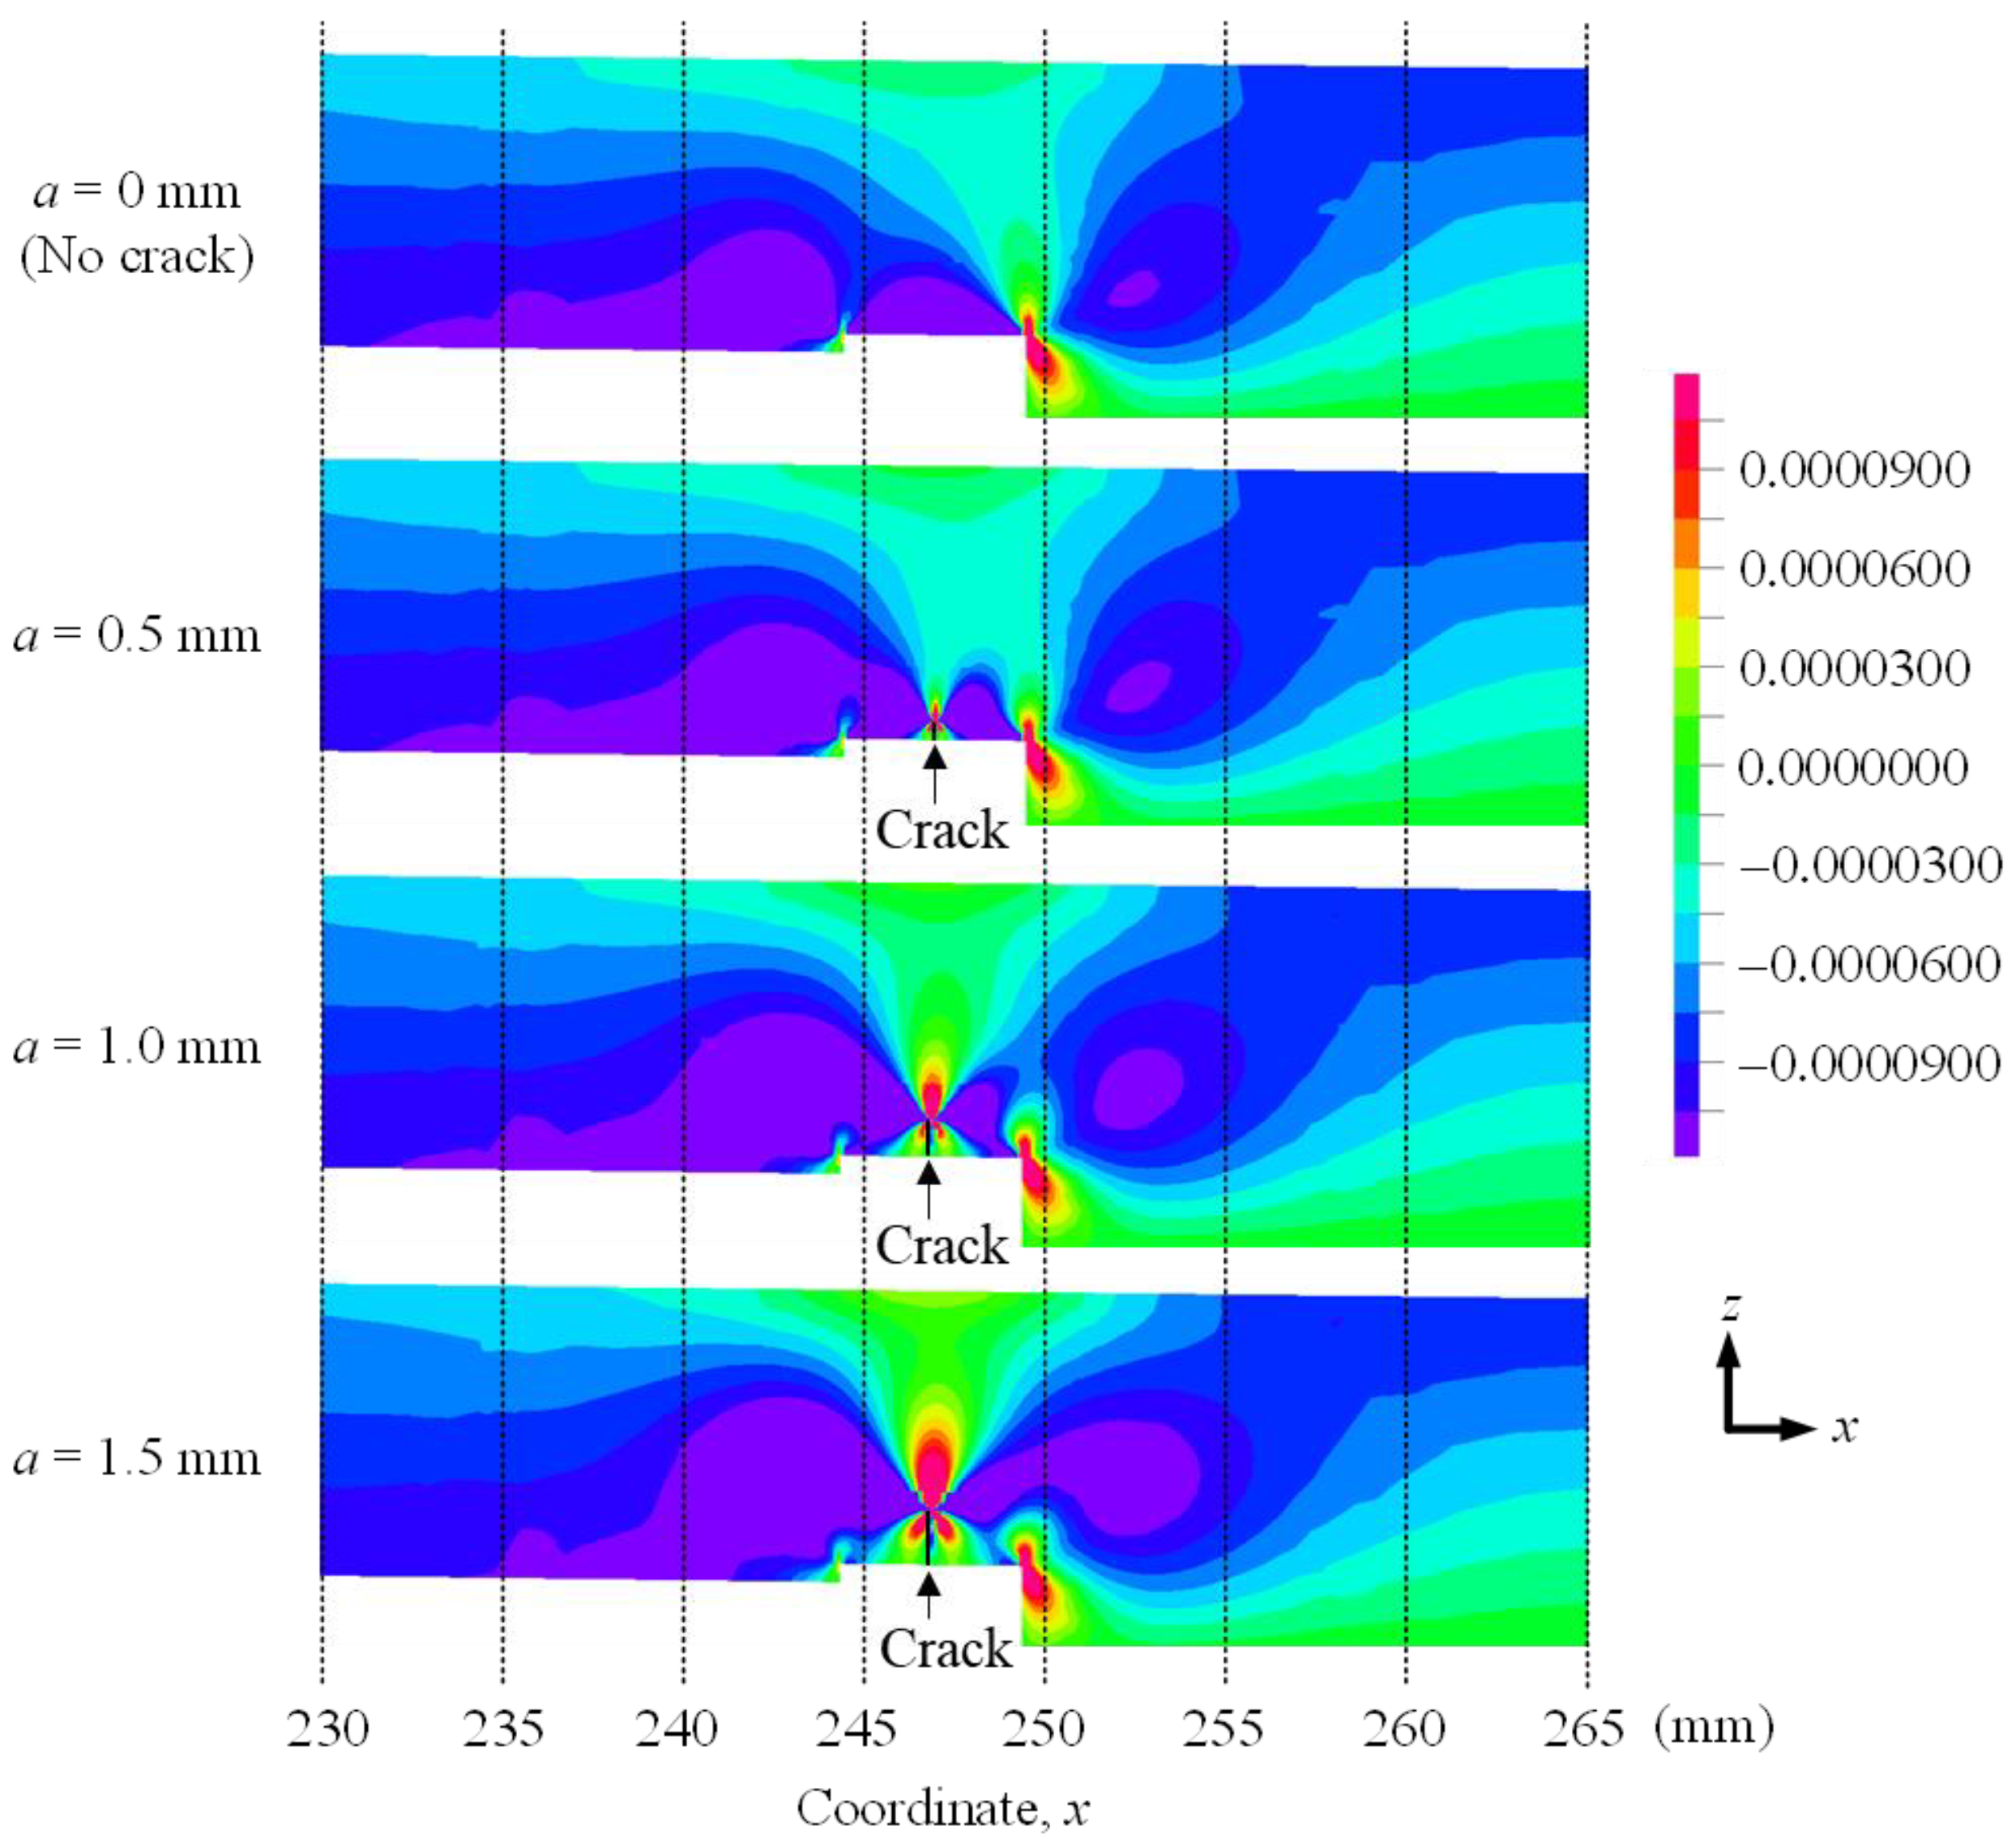
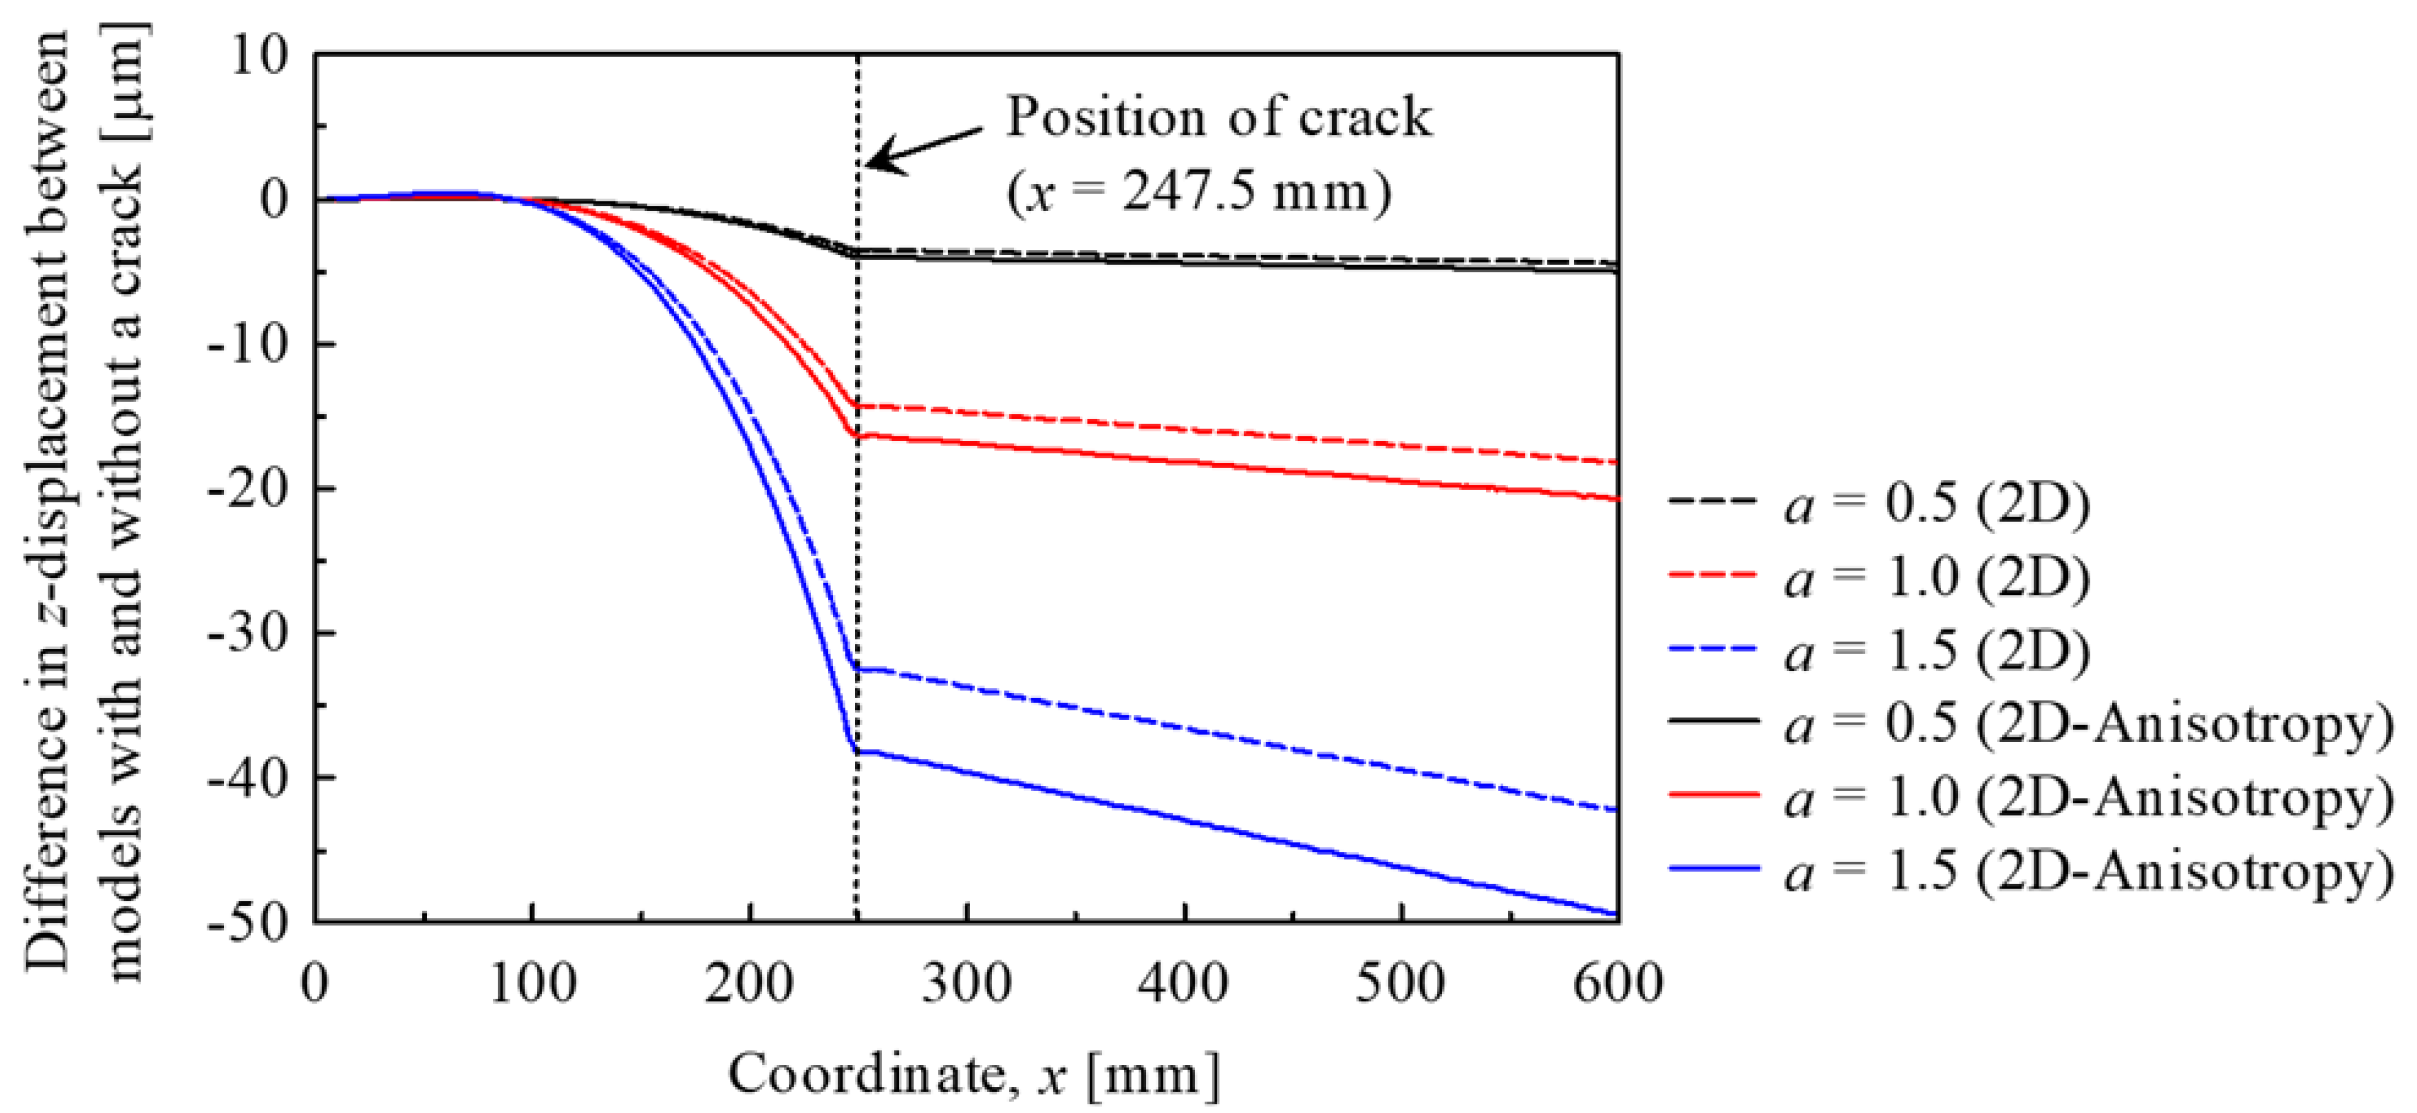
3.1.2. Model 2D-Anisotropy
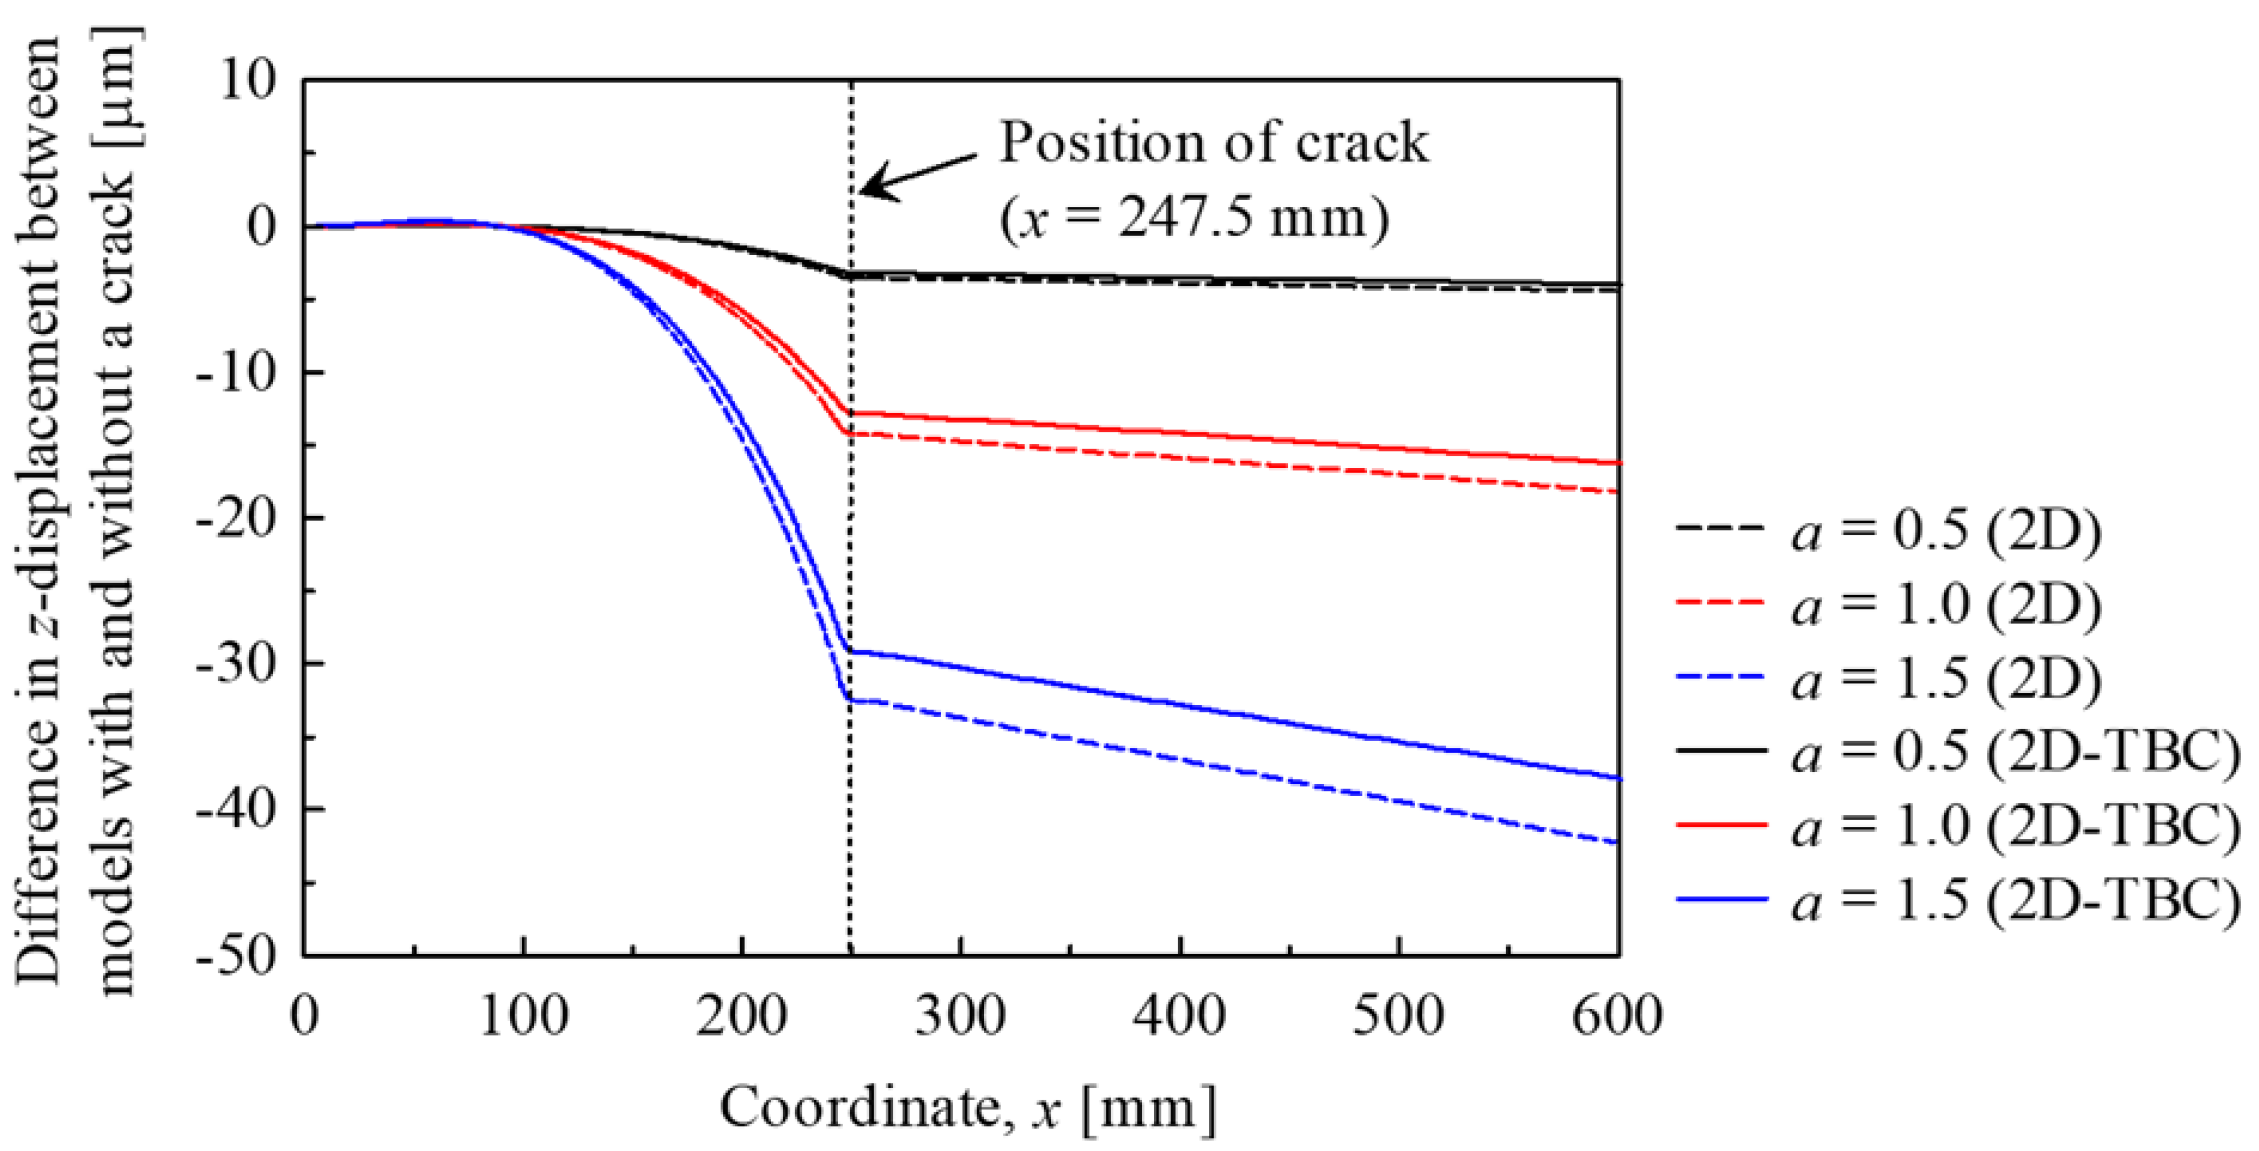
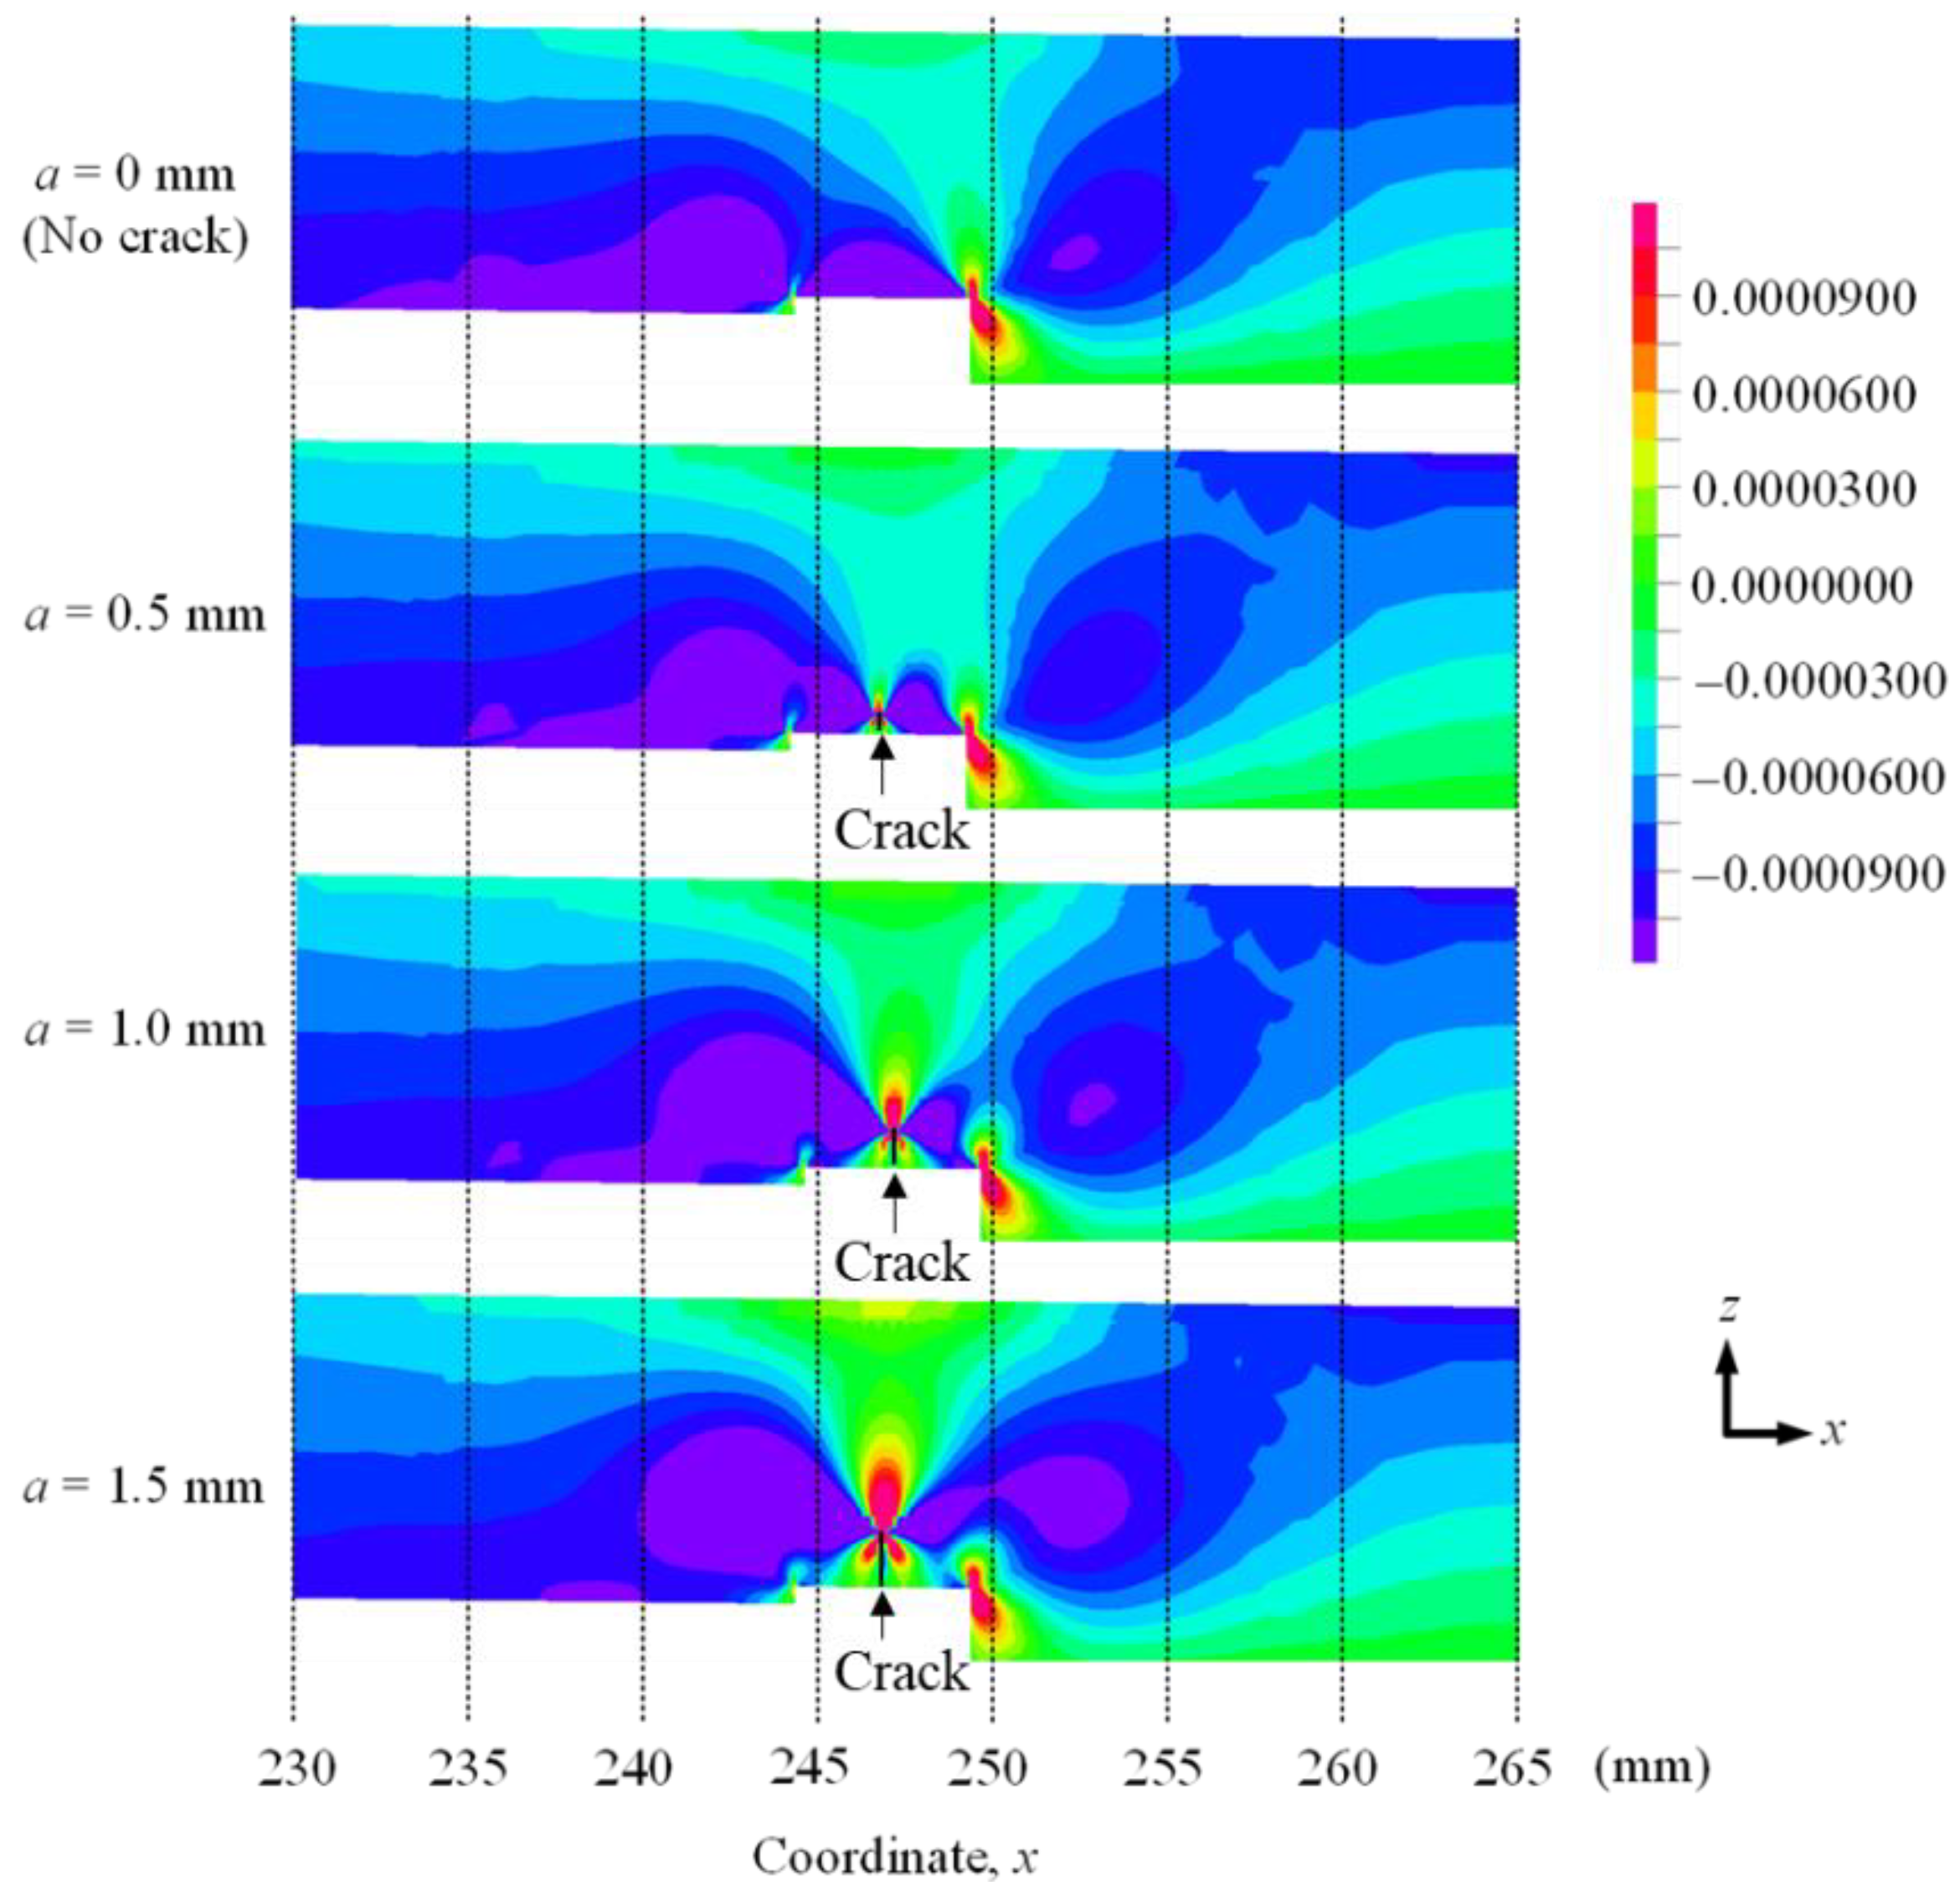
Figure 8 shows the difference in the z-direction displacement of Model 2D-Anisotropy with and without a crack. The observed behavior is the same as that of Model 2D. Therefore, it is considered that cracks can be detected by using the difference in the top surface height of the materials with and without a crack, even in anisotropic materials. In addition, the displacement of Model 2D-Anisotropy is found to be slightly larger than that of Model 2D. This is because, as shown in Figure 9, the compressive strain in the z-direction is larger than that of Model 2D, shown in Figure 7. This may be because the Young’s modulus of Model 2D-Anisotropy is less than that of Model 2D.

3.1.3. Model 2D-TBC

Figure 10 shows the difference in the z-direction displacement of Model-TBC with and without a crack. The observed behavior is the same as that of Model 2D and Model 2D-Anisotropy. Therefore, it is considered that cracks can be detected by using the difference in the top surface height of the materials with and without a crack, even in materials with a heat coating. In addition, the displacement of Model 2D-TBC is found to be slightly less than that of Model 2D. Figure 11 shows the z-direction strain distribution of Model 2D-TBC. It is found that the part where the compressive strain in the z-direction is large is slightly smaller compared to Figure 7. This may be because the applied load was the same as the other models, and the applied stress was reduced by the thickness of the coating.

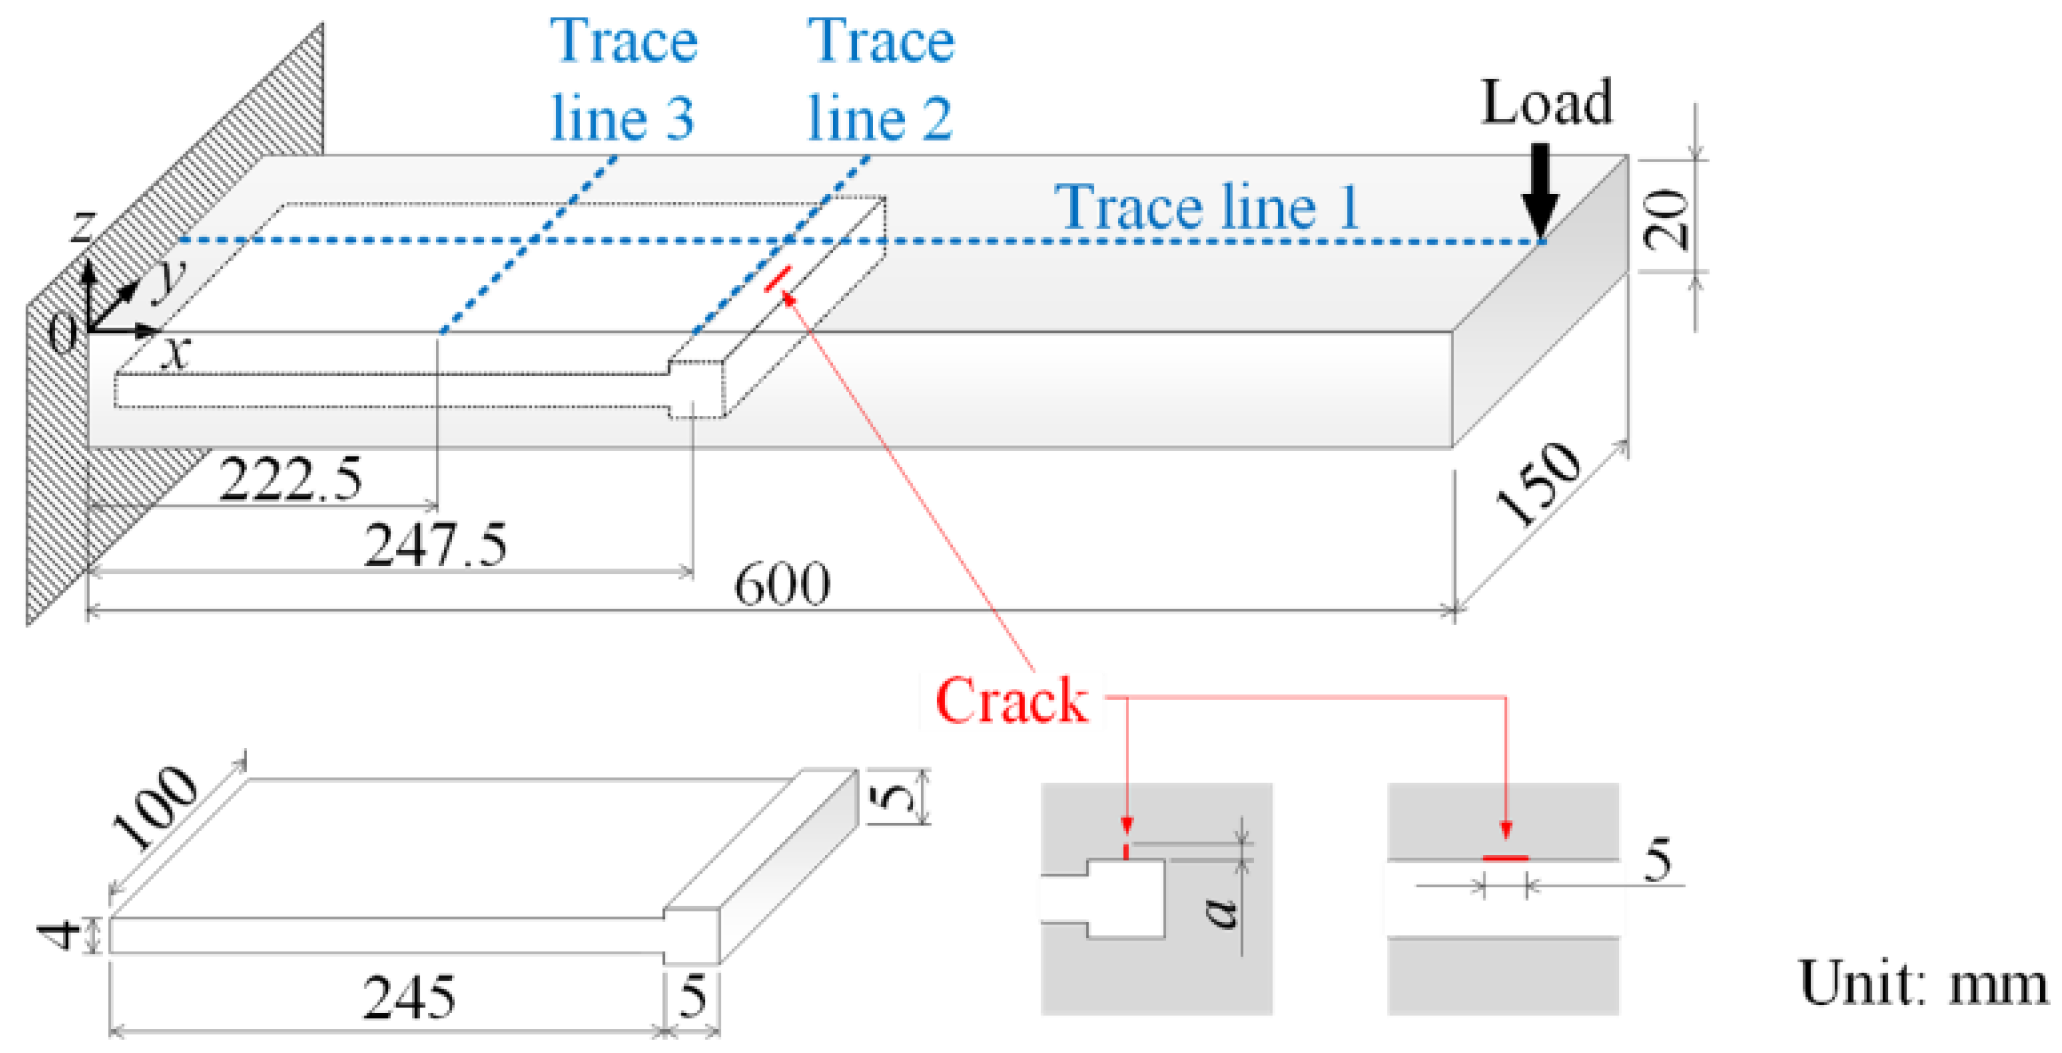
3.2. Three-Dimensional Model

Figure 12 shows the z-direction displacement for trace line 1 of Model 3D. Macroscopically, no difference is observed between the four types of test specimens, the same as for Model 2D. Therefore, in order to reveal the influence of the existence and size of the crack on the z-direction displacement, the difference in the z-direction displacement of a model with and without a crack is shown in Figure 13. It is found that the difference increases as the crack grows. The difference in the z-direction displacement differs from that of the 2D model. In the 3D model, the height rises once at around x = 200 mm, and then decreases. The minimum height is at x = 247.5 mm, which is the location of the crack. Subsequently, it decreases gradually. These height distribution differences are in the order of several nanometers to several tens of nanometers, which are large with respect to the vertical DHM resolution of 0.2 nm. Therefore, it may be possible to detect cracks by ascertaining this change through DHM. The effects of internal cracks on the difference in the change of the top surface height are discussed based on the results of stress and strain analysis. First, similar to the 2D Model, regarding the stress around the crack, it is required to determine the dominant stress among the normal stress (σx), which causes Mode I type deformation, and the shear stress (τxz), which leads to Mode II type deformation. Figure 14 shows the distribution of each stress above the cooling passage for the model with no crack and the models with cracks. The top surface of the model is trace line 1. As shown in Figure 14a, when there is no crack, it can be observed that the proportion comprising the part with a large tensile stress in the x-direction is higher than the stress in the y- and z-directions and the shear stress. As shown in Figure 14b, due to the introduction of the crack, the region where the tensile stress in the x-direction is 40 MPa or more, is found to extend more widely compared to the tensile stress in the y- and z-directions and shear stress in the vicinity of the crack tip. From this, the Mode I deformation is considered to have a greater effect than the Mode II deformation. Next, to clarify the influence of stress on the top surface height, Figure 15 shows the strain distribution in the z-direction above the cooling passage for the model with no crack and the model with a crack. The top surface of the model is trace line 1. The strain distribution in the range x = 230–265 mm is shown. It is found that the strain distribution changes significantly around the crack in the range x = 245–250 mm. Furthermore, at the upper part of the crack tip at x = 247.5 mm in Figure 15, tensile strain in the z-direction is confirmed. In addition, in the range x = 240–245 mm and 250–255 mm, the part with a large compressive strain, which is lower than −0.0001050, in the z-direction of the model with a crack is found to be slightly broader than that in the model without a crack. This is considered to be the reason for the descent in the range x = 240–245 mm and 250–255 mm and the inclination changing sharply in Figure 13.
In addition, the results of trace lines 2 and 3 are shown with the purpose of investigating whether crack detection was possible in the case where a crack generated in the turbine blade was traced in parallel, and in the case where a portion slightly away from the crack was traced in parallel with the crack. Figure 16 shows the z-direction displacement for trace line 2 of Model 3D. The largest displacement in the z-direction in the negative direction exists at x = 75 mm where the crack exists. There is no striking difference in the macro displacement depending on the presence or absence of the crack. Accordingly, Figure 17 shows the difference in displacement in the z-direction between the models with and without a crack. It can be observed that the displacement in the minus direction is large due to the presence of the crack, especially when x is approximately 75 mm in the model with a crack. As the change is in the order of tens of nm, it is considered that the change can be detected by DHM. Figure 18 shows the z-direction displacement for trace line 3 of Model 3D. Similar to the results of trace line 2 shown in Figure 16, the displacement in the z-direction is the largest in the negative direction at x = 75 mm where the crack exists. There is no remarkable difference in the macro displacement according to the presence or absence of a crack. Accordingly, Figure 19 shows the difference in displacement in the z-direction between the models with and without a crack. Due to the crack, the displacement in the negative direction is large at the ends, but the displacement in the positive direction is large at the center. This corresponds to the raised part shown in Figure 13. As the change is in the order of tens of nm, it is considered that the change can be detected by DHM.
As described above, the results of trace lines 1, 2, and 3 indicate that in all cases, i.e., when the trace is perpendicular, parallel to the crack, and slightly away from and parallel to the crack, the difference in displacement in the z-direction varies from nanometers to tens of nanometers according to the presence or absence of a crack of several millimeters. This suggests that DHM can be used to detect cracks in turbine blades.

4. Conclusions

In this study, we conducted FE analysis using 2D and 3D models that simulated turbine blades for the cases where an internal crack detection method using a digital holographic microscope and digital height correlation method were applied to turbine blades. The results acquired are shown below.
(1)
Analysis of the 2D model clarified that the change in the surface properties under a small load differs according to the presence or absence of a crack, and elucidated the strain distribution that caused the difference in the change. In addition, analyses of the 2D models, taking into account the anisotropy of the material and the heat-resistant coating, were conducted. The difference in the change in the surface properties and strain distribution, according to the presence or absence of cracks in these models, was elucidated.
(2)
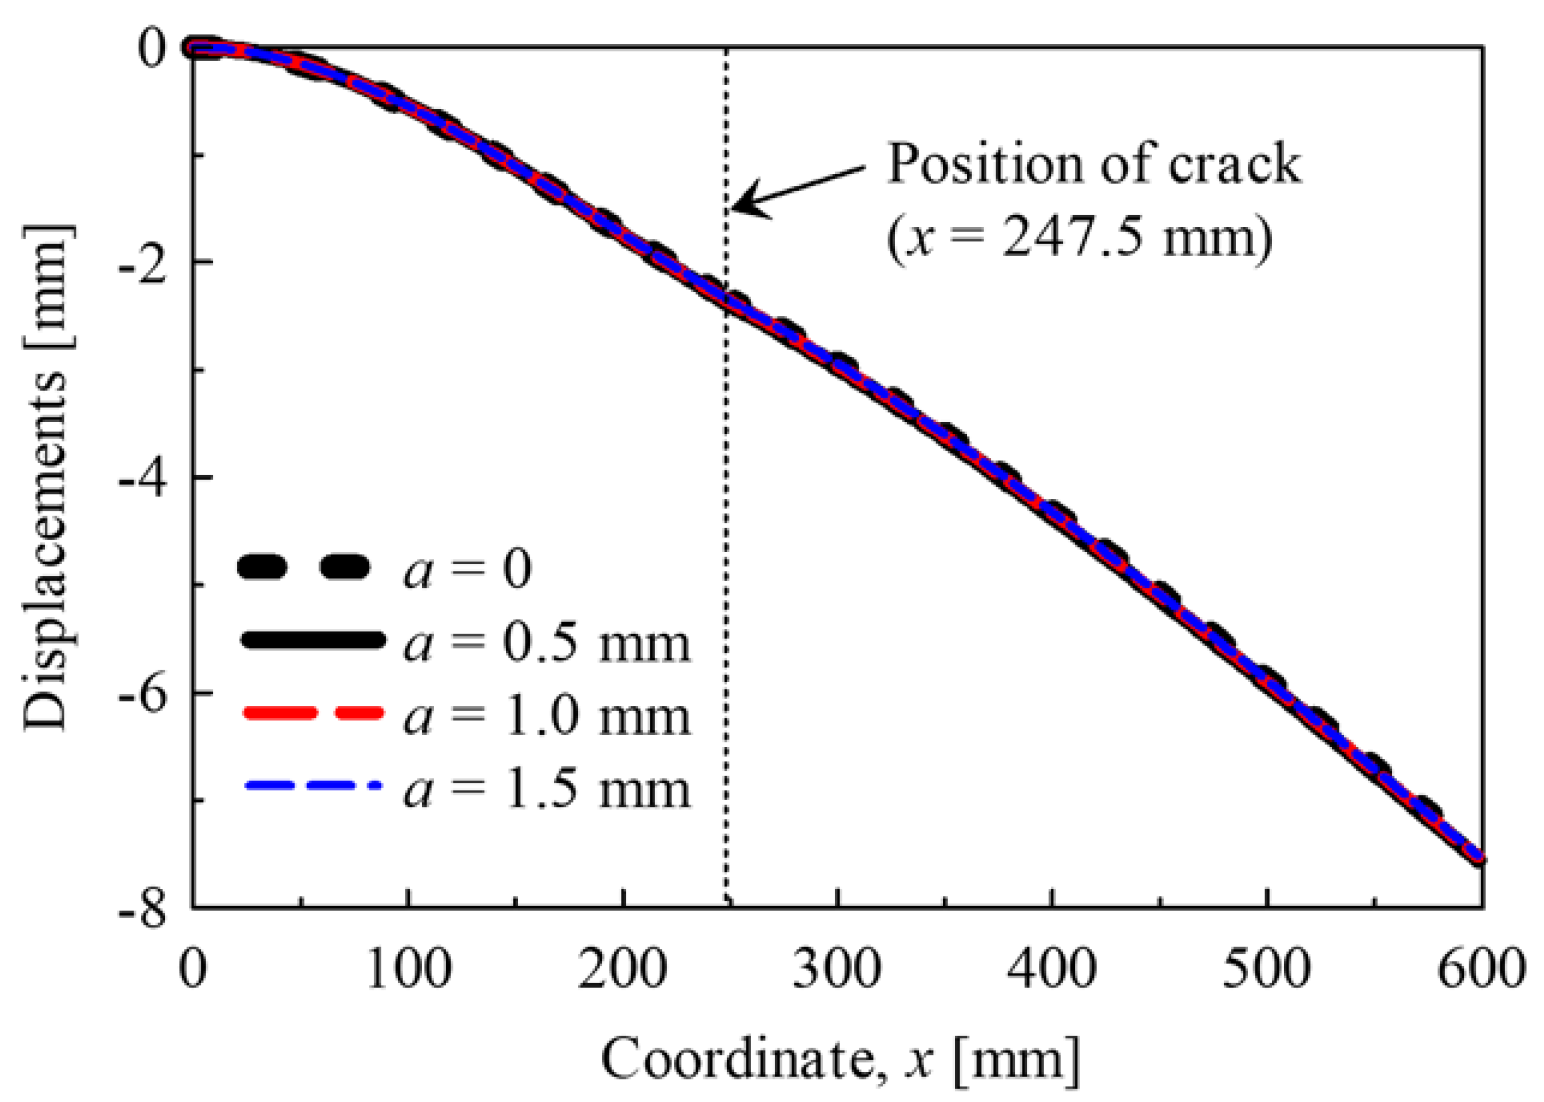
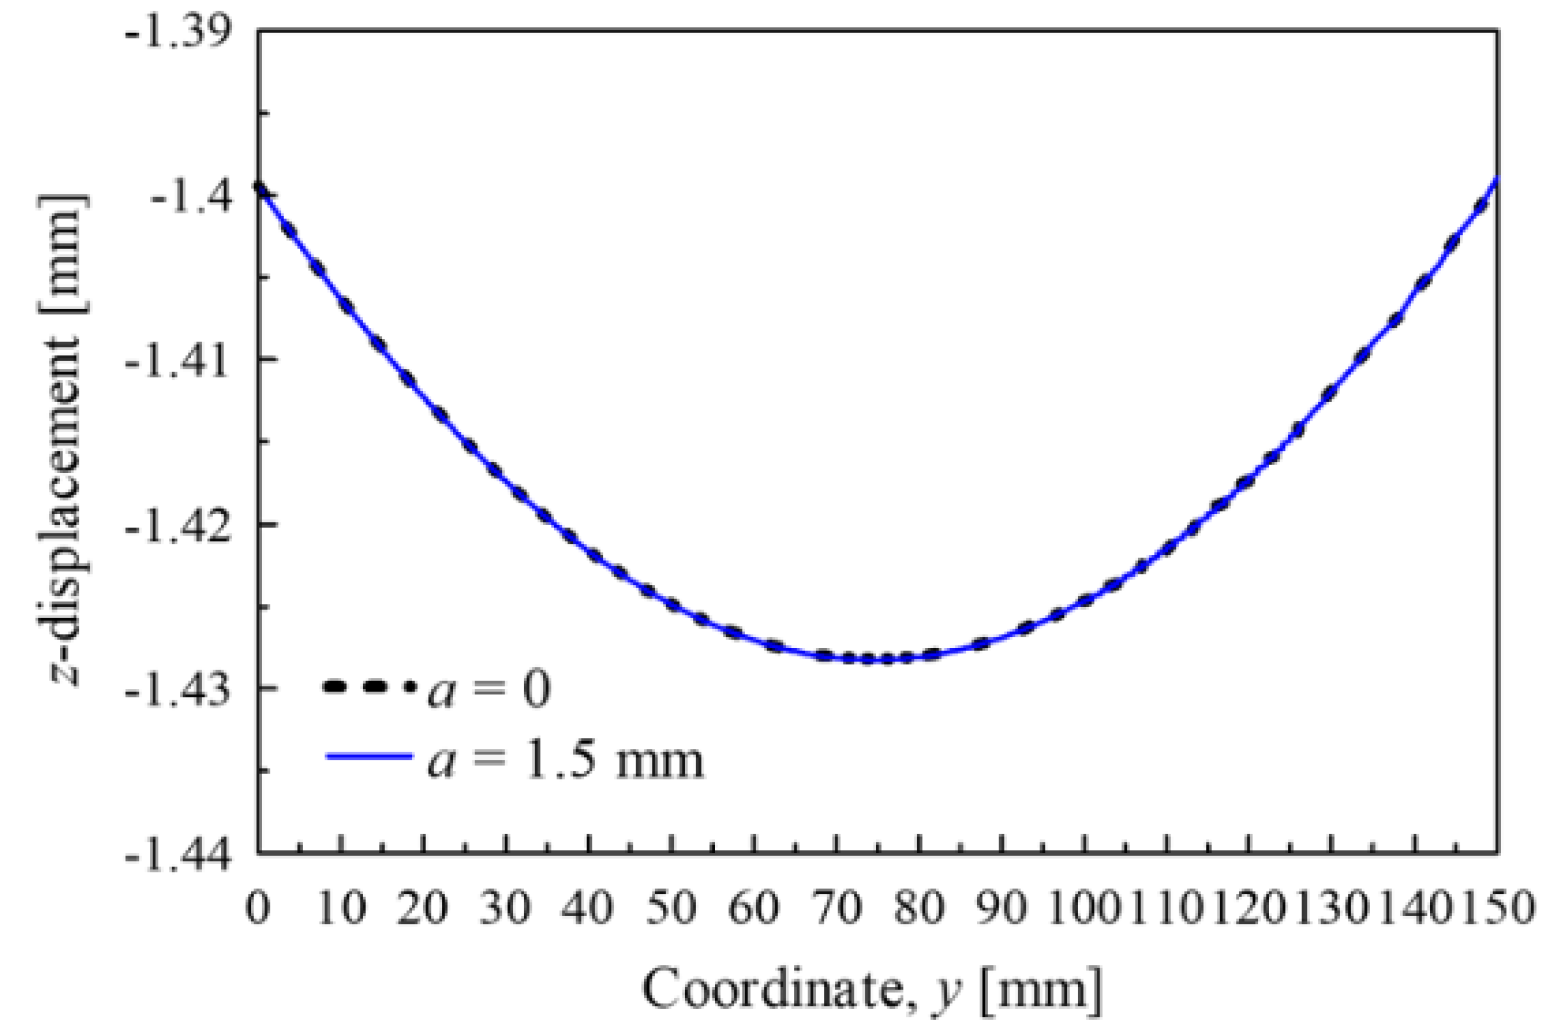
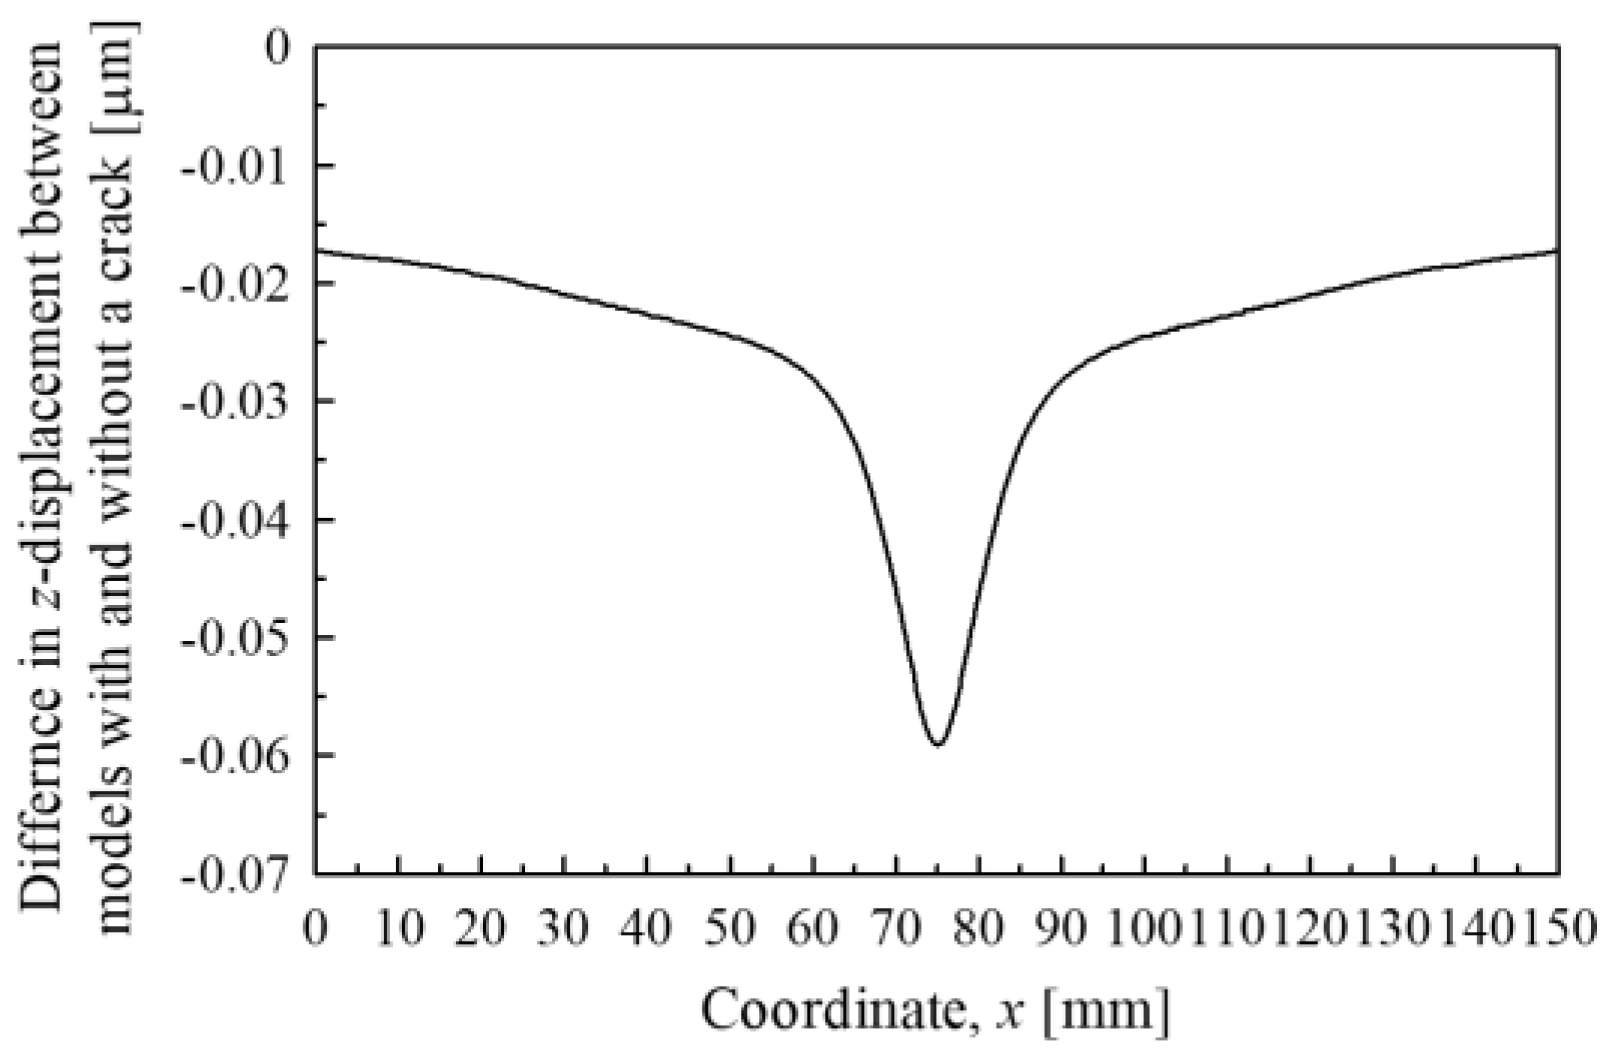
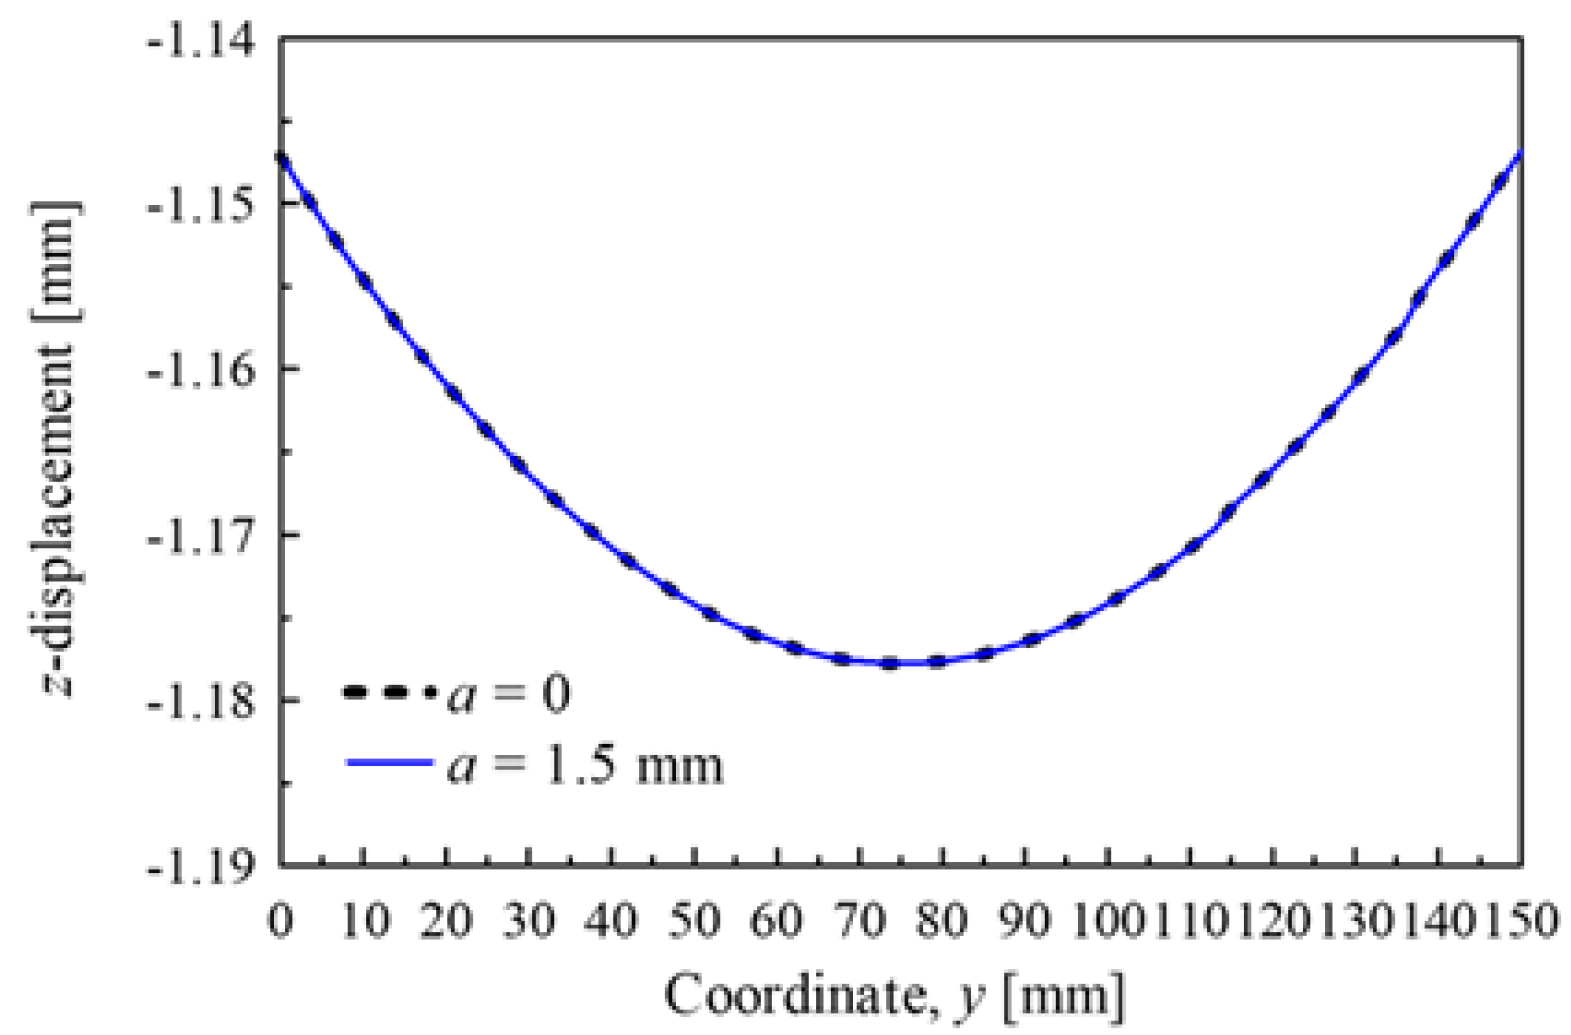
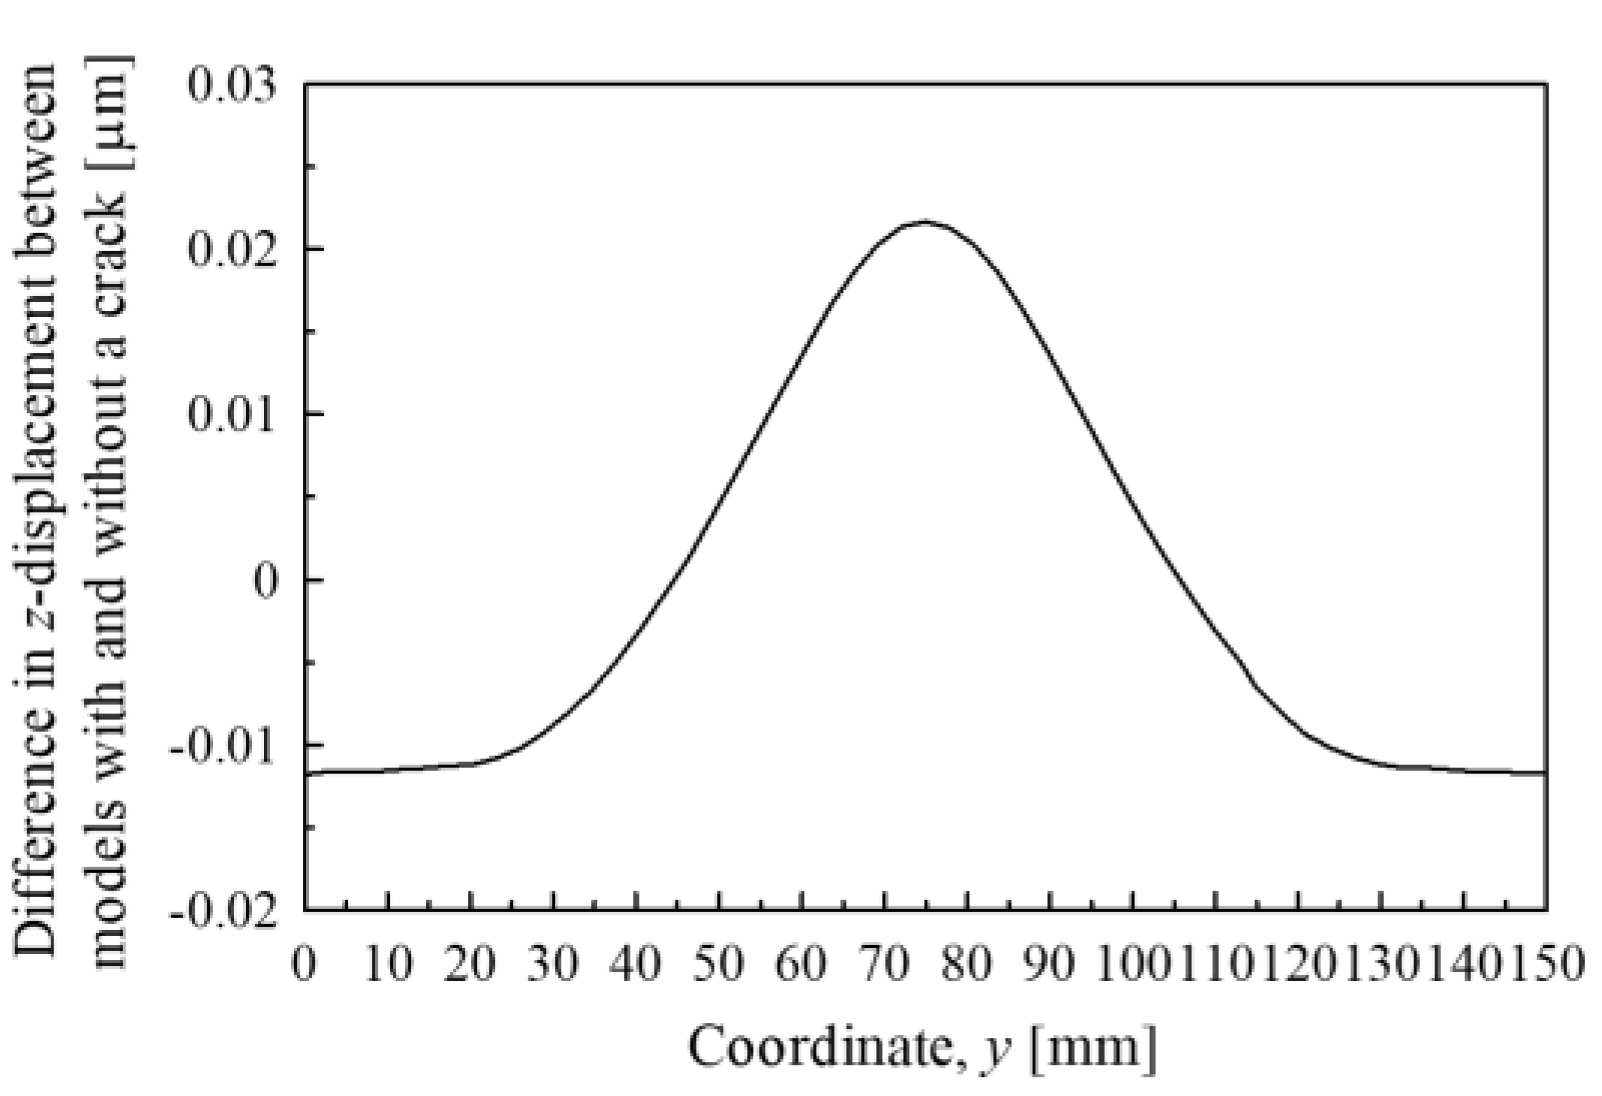
Analysis of the 3D model clarified that the change in the surface properties under a small load differs according to the presence or absence of a crack, and elucidated the strain distribution that caused the difference in the change. In addition, it was found that the longer the crack, the greater the difference in the change in the top surface height distribution compared to the case without a crack. For a crack of approximately several millimeters, the difference in the change in the top surface height distribution is approximately several nanometers to several tens of nanometers, even if the measurement point is at a distance from the crack. As the value is large with respect to the DHM vertical resolution of 0.2 nm, it is clarified that the change can be detected by DHM.

Author Contributions

Conceptualization, N.T.; methodology, H.K., T.U. and N.T.; validation, H.K.; formal analysis, H.K. and J.S.; investigation, H.K. and J.S.; resources, N.T.; data curation, H.K. and J.S.; writing—original draft preparation, H.K. and J.S.; writing—review and editing, N.T. and T.U.; visualization, H.K. and J.S.; supervision, N.T.; project administration, N.T.; funding acquisition, N.T. All authors have read and agreed to the published version of the manuscript.

Funding

This research was funded by JSPS KAKENHI Grant Number JP18H01337.

Conflicts of Interest

The authors declare no conflict of interest.

References

  1. Gupta, S.; Chaube, A.; Verma, P. Review on heat transfer augmentation techniques: Application in gas turbine blade internal cooling. J. Eng. Sci. Technol. Rev. 2012, 5, 57–62. [Google Scholar] [CrossRef]
  2. Effendy, M.; Yao, Y.; Sugati, D.; Tjahjono, T. Numerical study of pin-fin cooling on gas turbine blades. AIP Conf. Proc. 2019, 2114, 060022. [Google Scholar] [CrossRef]
  3. Bose, S.; DeMasi-Marcin, J. Thermal barrier coating experience in gas turbine engines at Pratt & Whitney. J. Therm. Spray Technol. 1997, 6, 99–104. [Google Scholar]
  4. Arai, M.; Suidzu, T. Porous ceramic coating for transpiration cooling of gas turbine blade. J. Therm. Spray Technol. 2013, 22, 690–697. [Google Scholar] [CrossRef] [Green Version]
  5. Japanese Industrial Standards. JIS Z 2300:2009; Japanese Industrial Standards: Tokyo, Japan, 2009. [Google Scholar]
  6. Yoshioka, Y.; Yamashita, A. Degradation/damage measurement and life assessment of high-temperature components III: Heavy-duty and aero gas turbines. J. Soc. Mat. Sci. Jpn. 2009, 58, 649–656. (In Japanese) [Google Scholar] [CrossRef]
  7. Tada, N.; Hamada, S.; Teramae, T.; Yoshino, S.; Suzuki, T. A method of crack detection in the turbine blade using digital holographic microscopy (DHM). In Proceedings of the ASME 2011 Pressure Vessels and Piping Conference 2011, PVP2011-57299, Baltimore, MD, USA, 17–21 July 2011; American Society of Mechanical Engineers (ASME): New York, NY, USA, 2011; pp. 211–216. [Google Scholar]
  8. Tada, N.; Uchida, M.; Uenoyama, Y. Non-destructive crack detection by nanometric change in surface profile using digital holographic microscope. In Proceedings of the ASME 2012 Pressure Vessels and Piping Conference 2012, PVP2012-78425, Toronto, ON, Canada, 15–19 July 2012; American Society of Mechanical Engineers (ASME): New York, NY, USA, 2012; pp. 251–257. [Google Scholar]
  9. Tada, N.; Uchida, M.; Matsukawa, Y. Non-destructive detection of crack in HDPE plate by nanometric change in surface profile. In Proceedings of the ASME 2013 Pressure Vessels and Piping Conference 2013, PVP2013-97732, V005T10A012, Paris, France, 14–18 July 2013; American Society of Mechanical Engineers (ASME): New York, NY, USA, 2013. [Google Scholar]
  10. Seth, B.B. Superalloys: The utility gas turbine perspective. In Proceedings of the 9th International Symposium on Superalloys, Champion, PA, USA, 17–21 September 2000; The Minerals, Metals & Materials Society: Warrendale, PA, USA, 2000. [Google Scholar]
  11. Caron, P.; Khan, T. Evolution of Ni-based superalloys for single crystal gas turbine blade application. Aerosp. Sci. Technol. 1999, 3, 513–523. [Google Scholar] [CrossRef]
  12. Xu, Q.; Yang, C.; Zhang, H.; Yan, X.; Tang, N.; Liu, B. Multiscale modeling and simulation of directional solidification process of Ni-based superalloy turbine blade casting. Metals 2018, 8, 632. [Google Scholar] [CrossRef] [Green Version]
  13. Arai, M.; Shimizu, Y.; Suidzu, T. On damage process of ceramic thermal barrier coatings subjected to high-temperature tensile loading. Trans. JSME 2015, 81, 825. (In Japanese) [Google Scholar]
Figure 1. Shape and dimensions of the two-dimensional models: (a) Model 2D and Model 2D-Anisotropy; (b) Model 2D-Thermal barrier coating (TBC).
Applsci 10 04883 g001
Figure 2. Shape and dimensions of the three-dimensional model.
Applsci 10 04883 g002
Figure 3. Mesh of the finite element (FE) models: (a) Model 2D, a = 0.5 mm; (b) Model 3D, a = 0.5 mm.
Applsci 10 04883 g003
Figure 4. The z-displacement of the upper surface of Model 2D. The z-displacement implies the change in the z-direction due to loading.
Applsci 10 04883 g004
Figure 5. The difference in the z-displacement between the models with and without a crack.
Applsci 10 04883 g005
Figure 6. The stress σx, σy, and shear stress τxz distribution above the cooling passage of Model 2D, a = 0, 0.5, 1.0, 1.5 mm. (a) a = 0 mm (No crack); (b) a = 0.5 mm; (c) a = 1.0 mm; (d) a = 1.5 mm.
Applsci 10 04883 g006
Figure 7. The strain distribution (εz) of Model 2D, a = 0, 0.5, 1.0, 1.5 mm.
Applsci 10 04883 g007
Figure 8. The difference in the z-displacement between the models with and without a crack of Model 2D-Anisotropy.
Applsci 10 04883 g008
Figure 9. The strain distribution (εz) of Model 2D-Anisotropy, a = 0, 0.5, 1.0, 1.5 mm.
Applsci 10 04883 g009
Figure 10. The difference in the z-displacement between the models with and without a crack of Model 2D-TBC.
Applsci 10 04883 g010
Figure 11. The strain distribution (εz) of Model 2D-TBC, a = 0, 0.5, 1.0, 1.5 mm.
Applsci 10 04883 g011
Figure 12. The z-displacement of the surface of Model 3D along trace line 1. The z-displacement implies the change in z-direction due to loading.
Applsci 10 04883 g012
Figure 13. The difference in the z-displacement between the models with and without a crack of Model 3D along trace line 1.
Applsci 10 04883 g013
Figure 14. The stress σx, σy, σz, and shear stress τxz distribution above the cooling passage of Model 3D, a = 0, 1.5 mm. (a) a = 0 mm (No crack); (b) a = 1.5 mm.
Applsci 10 04883 g014
Figure 15. The strain distribution (εz) of Model 3D, a = 0, 1.5 mm.
Applsci 10 04883 g015
Figure 16. The z-displacement of the surface of Model 3D along trace line 2. The z-displacement implies the change in z-direction due to loading.
Applsci 10 04883 g016
Figure 17. The difference in the z-displacement between the models with and without a crack of Model 3D along trace line 2.
Applsci 10 04883 g017
Figure 18. The z-displacement of the surface of Model 3D along trace line 3. The z-displacement implies the change in z-direction due to loading.
Applsci 10 04883 g018
Figure 19. The difference in the z-displacement between the models with and without a crack of Model 3D along trace line 3.
Applsci 10 04883 g019
Table 1. Material properties of the four types of models.
ModelYoung’s Modulus, E [GPa]Poisson’s Ratio, ν
Model 2D2070.3
Model 2D-AnisotropyEx = 125.5, Ez = 168.7, Gxy = 133.9, Gzy = 64.5νxz = 0.333, νzx = 0.447
Model 2D-Thermal barrier coating (TBC)207 (base material), 200 (bond coat), 40 (top coat)0.3 (base material), 0.3 (bond coat), 0.3 (top coat)
Model 3D2070.3
Table 2. Total number of nodes and elements of models.
ModelCrack Size, a (mm)Total Number of NodesTotal Number of Elements
Model 2D0.580446479
1.076006403
1.580436479
Model 2D-Anisotropy0.580446479
1.080576491
1.576836359
Model 2D-TBC0.520,18114,559
1.020,19514,571
1.520,18114,559
Model 3D0.5318,023189,422
1.0158,950151,767
1.5318,118189,891

