Abstract
This paper presents a method for modeling of pneumatic bias tire axisymmetric deformation. A previously developed model of all-steel radial tire was expanded to include the non-linear stress–strain relationship for textile cord and its thermal shrinkage. Variable cord density and cord angle in the cord-rubber bias tire composite are the major challenges in pneumatic tire modeling. The variabilities result from the tire formation process, and they were taken into account in the model. Mechanical properties of the composite were described using a technique of orthotropic reinforcement overlaying onto isotropic rubber elements, treated as a hyperelastic incompressible material. Due to large displacements, the non-linear problem was solved using total Lagrangian formulation. The model uses MSC.Marc code with implemented user subroutines, allowing for the description of the tire specific properties. The efficiency of the model was verified in the simulation of mounting and inflation of an actual bias truck tire. The shrinkage negligence effect on cord forces and on displacements was examined. A method of investigating the influence of variation of cord angle in green body plies on tire apparent lateral stiffness was proposed. The created model is stabile, ensuring convergent solutions even with large deformations. Inflated tire sizes predicted by the model are consistent with the actual tire sizes. The distinguishing feature of the developed model from other ones is the exact determination of the cord angles in a vulcanized tire and the possibility of simulation with the tire mounting on the rim and with cord thermal shrinkage taken into account. The model may be an effective tool in bias tire design.
1. Introduction
Nowadays, the vast majority of vehicles are equipped with radial tires, but they have not pushed bias tires out of the market. The latter are used mainly in all-terrain vehicles as well as agricultural and heavy-duty machines. Often, these are tires of large sizes. They are still utilized since they provide several benefits, including high sidewall resistance to mechanical damage, good performance on uneven ground surfaces, silent-running operation, good tread, self-cleaning properties, single-phase tire building connected with a simple design, and prices lower than radial tires. High demand for bias tires for vehicles is present in countries with a high percentage of unpaved roads [1]. The majority of leading tire producers design and manufacture bias tires (Goodyear: bias ply tire, Continental: crossply tire).
It must be noted that many experienced bias tire designers are leaving their occupation and retiring, and their successors need tools to aid their design work. Thus, actions aimed at improving the already existing tools and creating new tools facilitating bias tire design are well-founded.
Tire designing is an extremely difficult and complex task, arising from the fact that a pneumatic tire is a complex, heterogeneous, and anisotropic structure made of rubber, rubberized cord fabric (cord), and wire. The most important tire load-bearing members are bead wires made of wire coils, ensuring contact connection between the tire and the wheel rim, and body ply made of one or several cord layers, whose ends (edges) are fixed in beads through wrapping around bead wires. In a non-inflated state, a tire is quite a flaccid/flexible structure, and when inflated, it stiffens and may carry external loads. Thus, pneumatic tire mechanics is fully non-linear, i.e., physically, geometrically, and with respect to boundary conditions. Deformation analysis of tire and strength of its elements is always a major computational challenge.
The subject of pneumatic tire deformation modeling was discussed as early as the 1950s. Back then, Hofferberth [2] and Biderman [3] proposed a mathematical description of a tire’s netting model in which rubber influence on tire deformation is disregarded. Even the simplest task of determining an inflated tire inner profile with the use of a simple netting model cannot be solved with an analytical approach. Differential equation describing this profile features no solution in elementary functions set [4]. Thus, in the past, in the tire designing process, there was the need to use atlases containing profiles for tires being in equilibrium [5]. Due to high labor consumption and the low accuracy of such actions, along with an increase in the availability of electronic digital machines, various algorithms were created to support this process with computers. In [6], based on the tire netting model, an automation method of determining bias and radial tire profiles was presented, and the entire set of computational tools, verified in the industry and successfully used in tire designing process, was described in [7].
Nowadays, calculation software based on the tire netting model is used in tire industry only for the initial tire profile design. Exact and reliable tire design verification is conducted with the use of the pneumatic tire finite element model. Since Dunn and Zorowski [8], being some of the pioneers, applied the finite element method (FEM) for pneumatic bias aircraft tire deformation modeling, many tire models were worked out based on this method. The complexity of the problem of aircraft tire deformation modeling is well presented in the paper [9]. Due to the radial tire application universality, many publications describing tire computational models dwell upon radial constructions, and papers on bias tires are scarce, e.g., [10,11,12,13,14].
In the paper [15], proprietary FEM software is presented for the analysis of pneumatic tire axisymmetric models aimed at supporting the design of all-steel radial tires. Many subroutines of this software have been included in the commercial MSC.Marc software (Ver. 2001, MSC.Software Corporation, Santa Ana, CA, USA, 2001) [16] as user subroutines. Robust solver and effective contact procedures, available in MSC.Marc, together with user subroutines created the possibility of advanced analyses of tire deformation. A technique based on overlaying finite elements characterizing reinforcement (cords) onto elements representing rubber [17], which ensured very stable numerical solutions, was utilized in the modeling [14,18].
This model was developed so that specific characteristics of textile cord used in bias tire building could be taken into account, i.e., non-linearity of the stress–strain relationship and thermal shrinkage. Such a model was used for the axisymmetric analysis of bias truck tire deformation caused by inflation pressure.
In the paper, specific characteristics of a cord-rubber tire composite resulting from the tire formation process are highlighted. The influence of thermal cord shrinkage onto the alteration of tire configuration when removed from the vulcanization mold was taken into account, and mounting on the rim was simulated. Friction contact between tire beads and wheel rim was considered. Profiles of a tire mounted on the rim and inflated as well as forces in body ply cords were determined. Displacements of two tire characteristic points and cord forces in the first body ply were compared with and without the effect of shrinkage. The possibility of analyzing the influence of cord angle in body plies arranged on the tire building drum onto the tire apparent lateral stiffness was presented.
2. Description of Bias Tire Model
For analysis of pneumatic bias tire mounting on the rim and its inflation, the axisymmetric finite element model was employed. The analysis was based on the tire meridional cross-section with a plane containing the tire axis of revolution, also referred to as the tire profile (Figure 1).
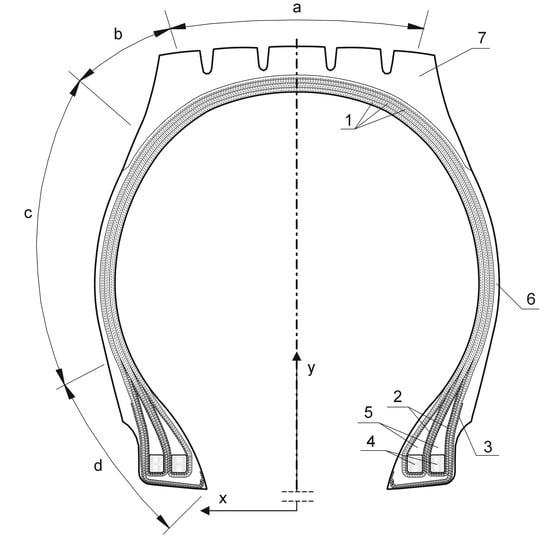
Figure 1.
Meridional bias truck tire profile. a—crown, b—shoulder, c—sidewall, d—bead; 1—3 × ± θ doubled body plies, 2—flipper strips, 3—chafer, 4—bead wires, 5—bead fillers, 6—sidewall, 7—tread.
The tire profile is subject to discretization with axisymmetric finite elements. Each finite element node has two degrees of freedom—axial x and radial y displacement—but in each Gaussian point of the element, in the coordinate system x, y, ϕ (ϕ—angular coordinate, measured around the tire rotation axis), there are three normal stresses and one shear stress. When analyzing tire deformation, large displacements occur, thus a non-linear mechanics problem was considered with total Lagrangian formulation [19]. Therefore, for description of deformation and stresses, the energetically conjugate Green-Lagrange strain tensor and the second Piola-Kirchhoff stress tensor were used. Their components are invariant against the rigid body motion. As an initial configuration, a tire profile in vulcanization mold was assumed immediately following the end of the vulcanization process, as, in this condition, the tire geometry is uniquely determined.
The cord-rubber composite used in pneumatic tire building is a specific one owing to two main reasons.
- The rubber ply, reinforced with cords, is characterized by a high degree of anisotropy. The composite matrix, i.e., rubber, is a hyperelastic material, and the cord has high tensile stiffness. By assuming the quotient of initial, tangent Young moduli for cord and rubber as composite anisotropy indicators, it amounts to ca. 640 for a nylon-rubber combination and ca. 6000 for a steel-rubber combination. For typical composites with a rigid matrix, this indicator amounts to 20–70 (glass/graphite-epoxy resin).
- In the tire forming stages, bead wires are moved towards the tire symmetry plane, and the body ply takes toroidal shape. As a result, the cord density and the cord angle (with exception of radial tire body ply) with the toroid parallel lines in a tire profile location become the function of the location distance to the tire rotation axis (Figure 2).
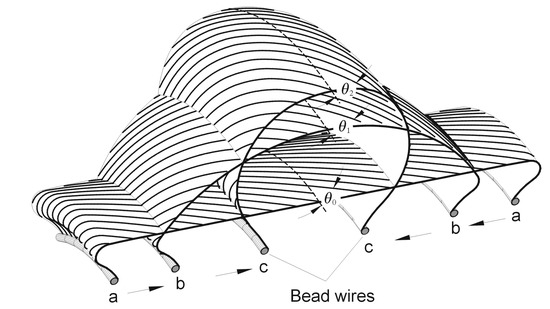 Figure 2. Changes in cords angle and density in a ply during tire forming stages: a—initial on the tire building drum, b—intermediate, c—final (θ2 < θ1 < θ0).
In the layer arranged on the tire building drum, the cord density epdm0 (ends per decimeter) and the cord angles θ0 to drum surface meridians are constant. As a result of “lifting” of the layer from the building drum to the profile in the mold, the values of these two parameters vary along the profile of the cord ply. The lowest cord density epdm is in the tire crown area, and the highest is in the vicinity of bead wire. Similar variability can be observed for the cord angle θ in the layer of formed tire (Figure 3).
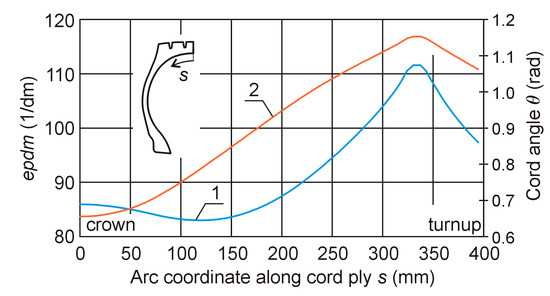
Figure 3.
Cord parameter variations along body ply in a bias tire; 1—cord ends per decimeter (epdm), 2—cord angle θ.
Equations for effective material constants of cord-rubber composite ply, considered as transversely isotropic, two-dimensional continuums, can be found in the literature, e.g., in [20]. However, due to the first characteristic feature given for such a composite, using material constants defined this way in the tire computational model results in lack of convergence of the solution that is searched for. Thus, in tire analysis, overlaying reinforcement elements onto rubber elements is commonly used. The elements have the same nodes and occupy the same geometrical space, but the materials have distinctly described stress–strain relationships. As in the paper [17], here, the determination of reinforcement material constants was adopted from the Halpin-Tsai equations, with the assumption of a very small value of Young modulus for rubber. The rubber elements were assigned the characteristics of a hyperelastic and incompressible neo-Hookean material. It was assumed that bead wire material is isotropic and linear elastic with high elasticity limit. The reinforcement area was discretized with quadrilateral, four-noded axisymmetric elements, and the rubber area was discretized with incompressible Herrmann elements with the same number of corner nodes. The latter had the fifth node with one degree of freedom, defining the hydrostatic pressure mean value.
The textile cord used for bias tire building is usually made of a polyamide (nylon). It is compliant in tension, and the curve of tensile stress–strain is non-linear (Figure 4, curve 1). The example graph shows mean strain values obtained experimentally for five samples of polyamide body ply cord with a measurement base length of 500 mm. Taking into account the non-linear characteristic of textile cord, the computational model accounted for the variability of its stiffness modulus in function of strain (Figure 4, curve 2). This curve was obtained by differentiation of the analytical form of curve 1. The initial value of the stiffness modulus used in textile cord bias tire was 2232 MPa. Then, with the increase in strain, it dropped to 1272 MPa, and later it increased monotonically to almost 3565 MPa with a strain of 7.5%.
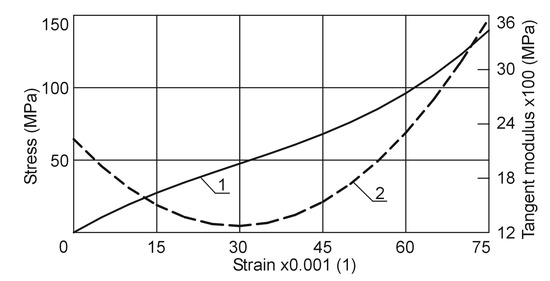
Figure 4.
Tensile stress–strain for polyamide 1400dtex/3 cord; 1—tensile test, 2—tangential stiffness modulus.
Due to the negative coefficient of textile cord thermal expansion, when a tire is taken out of a mold, the cord is subject to shrinkage, and the tire changes its shape [21]. Therefore, before the mounting simulation, and with the use of a user subroutine, stress induced by cord shrinkage was applied, and a tire profile was obtained, which was shrunk compared with the form in the vulcanization mold. Once the tire was mounted on the rim in the simulation process, the tire loading was applied incrementally in the form of internal follower pressure, and subsequent system equilibriums were iteratively determined.
A major issue in bias tire computational model creation is caused by variable cord density and variable cord angle in a ply. The literature describes the use of reverse engineering methods to determine those parameters that are based on actual tire scanning [22,23,24,25]. Although this method requires laborious measurements, in the case of lack or inaccessibility of data for raw plies set on the tire building drum, it is the only way to obtain such parameters. For this paper, a more effective method of determining composite parameters in a vulcanized tire was used based on the reference to known and constant values of these parameters in ply set on the tire building drum (Table 1) and with the use of the so-called pantographing rule [2]. The cord-rubber ply stiffness matrix was then arranged with global coordinates x, y, ϕ, in which the FEM equation system was created and resolved. For this purpose, adequate transformations of the stiffness matrix were performed for the ply described in the system of its principal axes of orthotropy [26]. The calculations were executed with user subroutine coupled to the code of MSC.Marc. Similarly, to determine the forces in ply cords with the use of the user subroutine, the cord-rubber composite strain was calculated in the direction of the reinforcement cords.

Table 1.
Geometric and mechanical properties of bias tire reinforcement.
3. Results and Discussion
The described tire computational model was used to simulate the process of mounting on the rim and of inflating an actual 11.00-20 bias truck tire with nominal internal pressure of pn = 725 kPa. The tire load-bearing members were: double bead wires, six nylon body plies (1400dtex/3), and reinforcement strips of bead fillers. In the area of beads that came into contact with rims, there were reinforcement plies known as chafers. All tire plies were made of textile cord. The ends of the first two body plies were fixed with the innermost bead wire, while the next two were held by the outer bead wire, and the ends of the two remaining ones—the outermost—reached the bead nose (Figure 1). Due to a large number of thin body plies, neighboring plies with angles of ± θ were connected in the model, thus one finite element had the thickness of two joined plies. Effective material parameters for plies connected in such a way were calculated with a user subroutine. There were seven types of rubber compounds in the tire (cord layers rubber, tread, undertread, sidewall, bead filler, bead strip, protective strip). Their mechanical properties were described with a neo-Hookean material model, and the material constants necessary for calculations were determined based on tensile tests of adequate samples, as described in [18]. The C10 parameter of the neo-Hookean material determined for these subsequent rubbers had the values (MPa) of 0.63, 0.603, 0.72, 0.484, 2.12, 1.23 and 1.83, respectively.
A starting point for tire deformation analysis was the discretized area of tire profile in a mold, right after the vulcanization process (Figure 5, item 1). The axial displacements of the nodes located in the tire profile plane of symmetry were blocked, whereas contact was defined between the outermost bead nodes and the rim. The mesh created for half the tire profile consisted of 600 finite elements and 421 nodes. All axisymmetric, isoparametric arbitrary quadrilateral elements used bilinear interpolation functions. The mesh consisted of 372 Herrmann elements with the properties of incompressible rubber materials, 208 orthotropic elements, and 20 isotropic elements. The orthotropic elements were overlaid on incompressible elements to model the properties of cord-rubber composite. Due to discretization error, the finite element mesh affected the accuracy of the obtained calculation results. In this case, the basic mesh was tested by generating a more dense one and comparing the results obtained using both meshes. Dense mesh was obtained by subdividing each element of the basic mesh into four elements. The results of the comparison were as follows: 4.0% and 2.3% for radial and axial displacement of points located at the tire crown and on the sidewall, respectively, and 3.2% for the maximum value of the cord tensile force. In each case, the values obtained for the basic mesh were smaller than for the dense one. The basic mesh was considered sufficient for the analyses carried out here.
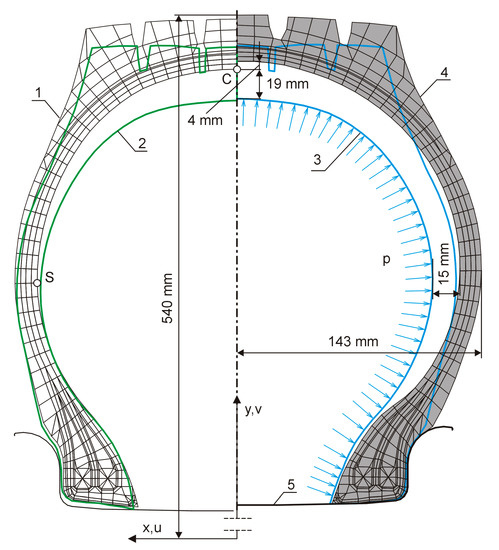
Figure 5.
Bias truck tire; 1—profile in mold and finite element mesh, 2—outside the mold (shrunk), 3—profile after mounting on rim, 4—inflated up to pn; 5—rim.
When the rubber was being vulcanized, the tire polyamide cord was heated and showed a tendency to shrink, which was restrained in this state by a diaphragm pressing the tire to mold walls. Tensile forces were generated in cords. When the vulcanization process was finished and the tire was removed from the mold, the cords were able to shorten owing to the compliance of the surrounding rubber. The tire radically changed its shape (Figure 5, item 2), especially within its crown area, which moved radially towards tire rotation axis. It was assumed that, in the tire, the shrinkage of polyamide cords amounted to 5%. The shrunk tire profile was determined by applying self-equilibrated initial stresses in cords equivalent with this shrinkage. The calculation of cord shrinkage stress and its transformation from principal axes of orthotropy for cord-rubber ply into an x, y, ϕ coordinate system was performed with the user subroutine.
The stage of mounting the tire on the rim was carried out in ten increments through concurrent displacement of the rim in the axial and the radial directions against the position, which was consistent with the actual rim dimensions of 8.0–20 assumed for this tire. At this stage, small values of internal pressure were also applied (0.001pn per increment) to provide for the correct setting of the bead on the rim. A non-deformable rim exerted contact forces on the bead. Forces tangential to the contact surface were calculated according to the Coulomb’s law of friction. The rubber–steel friction coefficient was assumed at 0.6. The profile of a tire mounted on the rim is presented in Figure 5, item 3.
The simulation of tire inflation was divided into stages: (1) ten pressure increments, 0.01pn each, when there was considerable tire profile alteration resulting from the “lifting” of a shrunk tire; (2) nine increments, 0.01pn each, when the tire had already reached an adequate initial stiffness. The inflated tire profile is shown in Figure 5, item 4, together with the displacement of internal profile C and S characteristic points, i.e., the tire crown point and sidewall point. The shown profiles indicate the occurrence of large displacements in a tire subject to internal pressure. Axial displacement of the point located on sidewall was of the order of its thickness.
Displacements of the said C and S points but referenced to the tire profile in the mold amounted to 4 mm and 13 mm, respectively. The external diameter of the inflated tire and its width, as obtained from the model, amounted to 1080 mm and 286 mm, respectively. The diameter value was consistent with the catalog requirements for this tire, and the width difference was −1.7%. This shows that the tire profile in the mold was designed correctly, and the model correctly predicted the overall dimensions of the actual tire. It must be noted that this tire—once manufactured in a series—was correctly designed and fulfilled all requirements stipulated in the European Tyre and Rim Technical Organisation (ETRTO) documents.
Figure 6 presents the chart of body ply cord forces in the function of arc coordinate measured along the profile from the tire crown towards the beads.
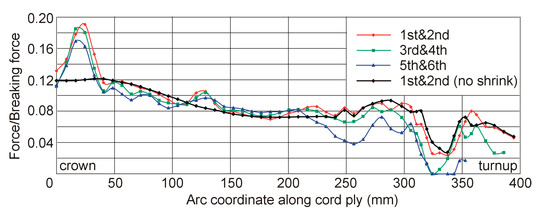
Figure 6.
Cord tensile forces in all body plies and in two inner body plies with shrinkage neglected.
In the case of tire inflation analysis and neglecting cord shrinkage, quite a mild fluctuation in body ply cord forces from the tire crown to the bead wire area was observed, which was consistent with the results obtained on the tire netting model (cf. [27] (p. 84, Figure 71a)). When considering the stresses generated by cord shrinkage, considerable variations in cord forces were observed. In particular, in the tire crown, there was almost a 60% increase in force value in the first and the second ply cords. It should be assumed that a certain influence on this increase was contributed by the first groove in the tire tread. The highest values of forces were obtained for innermost plies (first and second) cords, as this was where the internal pressure was applied, and these values decreased for plies located more outwards in the tire, which was consistent with the principles of deformable body mechanics.
Although the impact of thermal shrinkage on the maximum force values in body ply cords was high, the final displacements of inner tire profile control points (C and S) were less dependent on whether the shrinkage was or was not taken into account (Figure 7). The differences were 15% and 3.5%, respectively. It must be stressed that the control point S was located at the sidewall and, as a result of tire inflation, it moved axially towards the symmetry plane. Finally, the tire width mounted on the rim and inflated was lower than its width in the vulcanization mold.
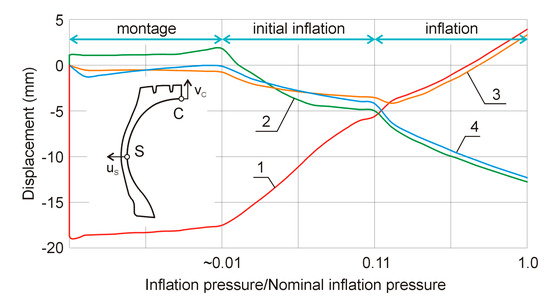
Figure 7.
Displacement variation of C and S points located on inner profile of vulcanized tire in mold versus relative inflation pressure; 1—vC, 2—uS, and 3—vC, 4—uS for shrinkage neglected.
The stable finite element tire model makes it possible to obtain many usable results. Figure 8a presents a map of equivalent Cauchy stresses occurring only in purely rubber elements. The highest values of these stresses could be observed in the vertical bead–rim contact area. Large values also existed in the bead in the flipper strip ends zone and may have caused accelerated fatigue degradation of the material. In turn, the distribution of the maximum principal strain within the tire profile area (Figure 8b) can be important information in assessing the risk of tire components separation. Large deviations of the vectors from the course of layers indicated the occurrence of high values of shear strains and therefore the existence of high shear stresses in these zones of inflated tire.
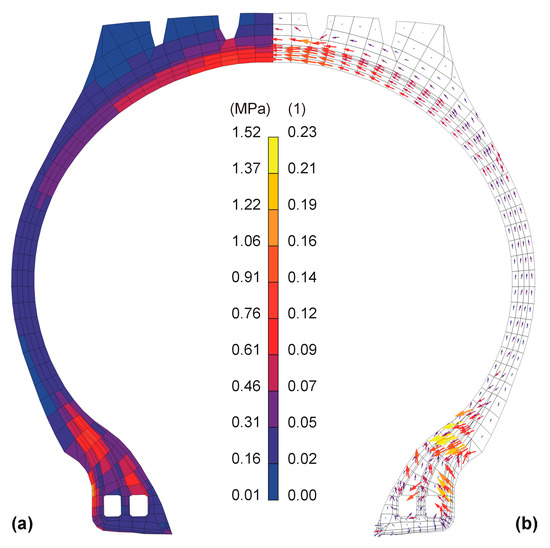
Figure 8.
Inflated tire; (a) map of equivalent Cauchy stress in rubber, (b) distribution of the maximum principal strain in rubber.
For lateral tire stiffness analysis, a three-dimensional model should be created. Elaboration of such a model is quite a challenge both in terms of the modeling and the required intensity of calculations [26]. Thus, a method of determining apparent lateral stiffness with the use of an axisymmetric tire model was proposed. For this purpose, the deformable flat surface was moved towards the model along the y axis. The contact of this plane with the inflated tire tread produced radial displacement of tread nodes towards the tire rotation axis (Figure 9). Due to the axisymmetry of the tire model, the tire deformation was consistent with the result obtained by placing a tire in a cylinder of decreasing diameter. When the cylinder radius was reduced by an assumed value of 25 mm, it was displaced axially by 30 mm (Figure 9, item 4), and the resultant friction forces generated in tread nodes with the tread remaining with contact with the cylinder were being written. The graph for these forces for a few cord angle values θ0 in the function of tire tread axial displacement are presented in Figure 10, items 1–4. On this basis, the tire apparent lateral stiffness was determined as a derivative of the force with respect to tread axial displacement (Figure 10, items 1’–4’). The apparent lateral stiffness of the analyzed tire indicated the greatest sensitivity to angle θ0 variations for small tread axial displacement (up to 5 mm). By defining the correlation between the tire apparent lateral stiffness and the actual stiffness (e.g., obtained from measurements), it was possible to predict tire lateral stiffness based on an axisymmetric model, i.e., with low costs.
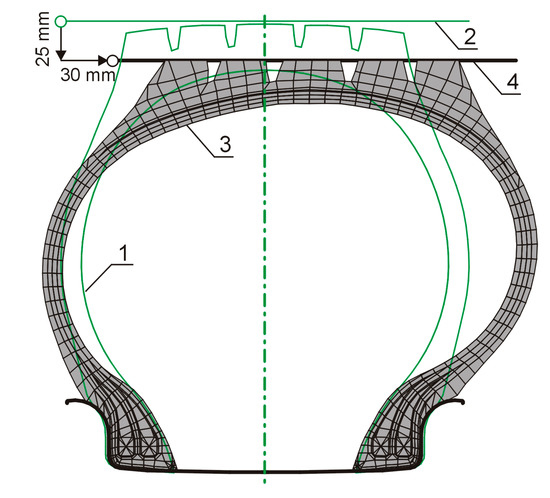
Figure 9.
Procedure for determining of tire apparent lateral stiffness: 1—initial profile of inflated tire; 2—contacting plane at the initial position; 3—deformed profile; 4—contacting plane final position.
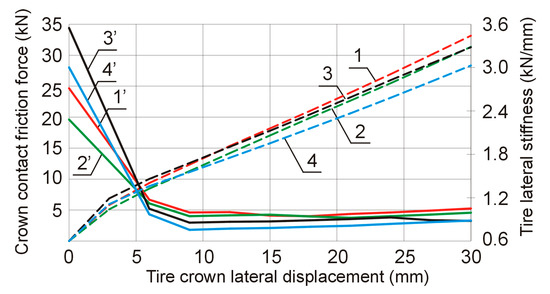
Figure 10.
Crown contact friction force and tire apparent lateral stiffness (numbers with ʼ) for some cord angles on drum q0 (rad); 1—1.1, 2—1.06, 3—1.03, 4—1.00.
4. Conclusions
The cord-rubber tire composite plies, as opposed to typical composite materials, have specific characteristics resulting from the method of tire forming. Variable cord density and its angle must be taken into account in tire computational models. This causes a great difficulty in deformation analysis of such objects, as it requires a correct description of variations in these parameters along the tire profile and creating user subroutines, which execute the description within the computer code.
The textile cord, which is the most commonly used in the construction of pneumatic bias tires, features non-linear stress–strain characteristics. Thus, in the analysis of a tire, it is necessary to use tangential modulus varying together with the deformation. Moreover, due to the negative thermal expansion coefficient of such a cord, a tire removed from a vulcanization mold changes its shape under the influence of cord shrinkage forces. It is necessary to take the thermal shrinkage into account, as this has a considerable influence on force values in body ply cord when the tire is inflated. The low influence of the shrinkage on the final axial displacement of a point located on tire sidewall and a 15% influence on the displacement of the point placed at crown were observed.
The finite element model makes it possible to predict many tire parameters and greatly extends the possibilities of the classic netting model, taking into account not only the cord plies but also the rubber. Moreover, due to the consideration for the contact between the tire beads and the rim, it is possible to perform a realistic simulation of tire mounting on the rim. The model credibility may be evidenced by the fact that, in the case of an actual bias tire simulation, the overall sizes of an inflated tire obtained with the use of the model were practically consistent with the sizes on an actual tire.
The model enables, for example, determination of such a vulcanization mold shape, thus the ready tire after inflating attains the required sizes. The selection of mold shape is made in a virtual space at the design stage and thus at the stage of low costs. This does not require, as was the case with the previously utilized trial and error method, a time-consuming mold preparation to manufacture prototype tires. From the tire designer’s point of view, the model provides considerable support in the difficult design work, making it possible to obtain valuable results, e.g., inflated tire profile, forces in tire load-bearing members and, thus, an evaluation of its strength. It may serve as a virtual prototyping tool.
The presented method for determination of tire apparent lateral stiffness may be used in a comparative analysis of different variants of the same tire model but with various design parameters (e.g., number of plies, epdm, cord angle, etc.).
It was shown that, when textile cord specific characteristics were taken into account in the previously created radial tire model, the modified and extended model was effective in bias tire deformation analysis.
Funding
This research received no external funding.
Conflicts of Interest
The authors declare no conflict of interest.
References
- JK Tyre & Industries Ltd., Truck/Bus Bias Tyres. Available online: https://www.jktyre.com/tbbtyre.aspx# (accessed on 27 May 2020).
- Hofferberth, W. Zur Festigkeit des Luftreifens. Kautsch. u. Gummi 1956, 9, 225–231. [Google Scholar]
- Biderman, V.L. Raschet formy profilya i napryazheniy v elementakh pnevmaticheskoy shiny, nagruzhennoy vnutrennim davleniyem; Goskhimizdat: Moscow, Russia, 1957. [Google Scholar]
- Day, R.B.; Gehman, S.D. Theory for the meridian section of inflated cord tires. Rubber Chem. Technol. 1963, 36, 11–27. [Google Scholar] [CrossRef]
- Biderman, V.L.; Bukhin, B.L.; Nikolaev, I.K.; Smetankina, R.N. Atlas nomogramm ravnovesnykh konfiguratsiy pnevmaticheskikh shin; Khimiya: Moskva, 1967. [Google Scholar]
- Pelc, J.; Petz, E. Computer aid in inner tire profile design. Polimery 1988, 33, 381–383. [Google Scholar] [CrossRef]
- Pelc, J.; Petz, E. Pneumatic Tyre Designing by CAD/CAE Technique. Polimery 1994, 39, 11–12. [Google Scholar] [CrossRef]
- Dunn, S.E.; Zorowski, C.F. A Study of Internal Stresses in Statically Deformed Pneumatic Tires; U.S. National Bureau of Standards: Washington, DC, USA, 1970. [Google Scholar]
- Behroozi, M.; Olatunbosun, O.A.; Ding, W. Finite element analysis of aircraft tyre—Effect of model complexity on tyre performance characteristics. Mater. Des. 2012, 35, 810–819. [Google Scholar] [CrossRef]
- DeEskinazi, J.; Ridha, R.A. Finite element analysis of giant earthmover tires. Rubber Chem. Technol. 1982, 55, 1044–1054. [Google Scholar] [CrossRef]
- Watanabe, Y.; Kaldjian, M.J. Modeling and analysis of bias-ply motocycle tires. Comput. Struct. 1983, 17, 653–658. [Google Scholar] [CrossRef][Green Version]
- Ghoreishy, M.H.R. Finite Element Analysis of a 6.45-14 Bias Tire under Contact Load. Iran. Polym. J. 2001, 10, 45–52. [Google Scholar]
- Thein, C.K.; Tan, H.M.; Limn, C.H. Numerical modelling and experimental inflation validation of a bias two-wheel tire. J. Eng. Sci. Technol. 2016, 11, 70–81. [Google Scholar]
- Pelc, J. Burst Test Simulation for bias Truck Tire. Kautsch. Gummi Kunstst. 2019, 72, 53–57. [Google Scholar]
- Pelc, J. Numerical aspects of a pneumatic tyre model analysis. Tech. Sci. 2009, 12, 190–203. [Google Scholar] [CrossRef]
- Nonlinear Finite Element Analysis of Elastomers; Whitepaper; MSC.Software Corporation: Santa Ana, CA, USA, 2010.
- Pelc, J. Static three-dimensional modelling of pneumatic tyres using the technique of element overlaying. Proc. Inst. Mech. Eng. Part D J. Automob. Eng. 2002, 216, 709–716. [Google Scholar] [CrossRef]
- Pelc, J. Simulation of Burst Test for all-Steel pneumatic Truck Tire. KGK-Kautsch. Gummi Kunstst. 2013, 66, 47–51. [Google Scholar]
- Bathe, K.J. Finite Element Procedures in Engineering Analysis; Prentice-Hall: Englewood Cliffs, NJ, USA, 1982. [Google Scholar]
- Halpin, J.C. Effects of Environmental Factors on Composite Materials; Technical Report; AFML-TR 67-423; Air Force Materials Lab: Wright-Patterson AFB, OH, USA, 1969. [Google Scholar]
- Ridha, R.A. Analysis of tire mold design. Tire Sci. Technol. 1974, 2, 195–210. [Google Scholar] [CrossRef]
- Małachowski, J. Numerical study of tires behaviour. J. KONES 2007, 14, 377–384. [Google Scholar]
- Kondé, A.K.; Rosu, I.; Lebon, F.; Brardo, O.; Devésa, B. On the modeling of aircraft tire. Aerosp. Sci. Technol. 2013, 27, 67–75. [Google Scholar] [CrossRef]
- Rosu, I.; Elias-Birembaux, H.L.; Lebon, F. Finite Element Modeling of an Aircraft Tire Rolling on a Steel Drum: Experimental Investigations and Numerical Simulations. Appl. Sci. 2018, 8, 593–609. [Google Scholar] [CrossRef]
- Arif, N.; Rosu, I.; Elias-Birembaux, H.L.; Lebon, F. Characterization and Simulation of a Bush Plane Tire. Lubricants 2019, 7, 107. [Google Scholar] [CrossRef]
- Pelc, J. Towards realistic simulation of deformations and stresses in pneumatic tyres. Appl. Math. Modell. 2007, 31, 530–540. [Google Scholar] [CrossRef]
- Biederman, V.L.; Guslitzer, R.L.; Zakharov, S.P.; Seleznev, I.I. Avtomobil’nye shiny (Automobile Tires); Goskhimizdat: Moscow, Russia, 1963. [Google Scholar]
© 2020 by the author. Licensee MDPI, Basel, Switzerland. This article is an open access article distributed under the terms and conditions of the Creative Commons Attribution (CC BY) license (http://creativecommons.org/licenses/by/4.0/).