Article

Examining the Effects of Introducing and Combining Electric-Arc Furnace Slag and Ceramic Waste in a Single Self-Consolidating, High-Strength Concrete Mix

by
Sayed Mohamad Soleimani
*,
Abdel Rahman Alaqqad
,
Adel Jumaah
and
Abdulaziz Majeed
Department of Civil Engineering, Australian College of Kuwait, P.O. Box 1411, Safat 13015, Kuwait
*
Author to whom correspondence should be addressed.
Appl. Sci. 2020, 10(14), 4844; https://doi.org/10.3390/app10144844
Submission received: 12 April 2020 / Revised: 29 April 2020 / Accepted: 6 May 2020 / Published: 15 July 2020
(This article belongs to the Section Civil Engineering)

Abstract

:
The purpose of this paper is to examine the effects of introducing waste materials sourced from factories in Kuwait as partial replacements of conventional concrete materials. Rejected ceramic products and unused electric-arc furnace slag were treated and partially replaced portions of coarse and fine aggregates, and the possibility of partially replacing cement was also examined. Initial results showed that all aggregate sizes can be replaced with either of the waste materials without compromising the concrete’s rheological properties or compressive strength. Additionally, pulverized ceramic powder was shown to improve the compressive strength of mortar cube samples. Finally, the two waste materials were combined in hybrid mixes that aimed to have the highest utilization of waste materials while maintaining (if not improving) the properties of a previously established benchmark self-consolidating concrete (SCC) mix. The results of this study show that waste materials sourced from landfills in Kuwait can be repurposed to replace portions of conventional construction materials in a self-consolidating, high-performance concrete mix with significantly better mechanical properties and higher compressive strength than that shown by a benchmark mix.

1. Introduction

As overall consideration for the environment gains traction in Kuwait, attention is being turned to some local factories that generate large amounts of waste. Some of Kuwait’s significant industries include structural steel production plants as well as the ceramics production industry. Stringent quality control standards during the manufacturing process and the brittle nature of final ceramic products mean that the ceramics industry generates lots of waste [1,2]. While rejected ‘green ceramics’ can be pulverized and reintroduced into the production cycle, rejected glazed ceramics cannot be easily recycled and are therefore discarded in landfills across the country. The structural steel plants in Kuwait produce electric-arc furnace slag (EAFS) as opposed to blast furnace slag (BFS); this by-product is made by reducing iron ore and recycling waste steel in electric-arc furnaces, which are the standard across the country. The generated EAFS is discarded as it has no use in Kuwait, but it is known to be durable in its use as an aggregate in the production of pavements [3], which is due to the fact that it is harder and approximately 20% to 25% denser than BFS [4]. Standard performance concrete containing crushed ceramic products to partially replace aggregates show similar rheological properties when compared to a typical concrete mix [5,6,7]. The introduction of ceramic waste products to replace coarse and fine aggregates has been shown to improve the rheological and hardened properties of a standard performance concrete [8,9]. Meanwhile, studies have shown that it is possible to use EAFS to partially replace aggregates in a self-consolidating, high-performance concrete mix, but also noted that its use would result in a reduction of slump and an increase in the viscosity of the SCC mix [10]. However, the use of EAFS has shown to increase the compressive strength, elastic modulus, and also improves the durability of a standard concrete mix made with conventional rounded aggregates [11]. This could be explained by the porosity and roughness of the surface of the EAFS aggregates compared to regular aggregates, which allows for better interaction between the cement paste and the aggregates [11,12]. Self-consolidating concrete (SCC) is a subset of high-performance concrete (HPC) that has a very high workability which allows it to flow considerably easier than standard performance concrete [13]. This makes SCC less susceptible to segregation and can be poured on site easier than standard performance concrete using less labor [14]. Seeing as the effects of introducing each of the additives to either conventional or high-performance concrete mix has already been documented, the aim of this study is to examine the viability of partially replacing conventional concrete materials with locally-sourced EAFS and repurposed ceramic products in a self-consolidating, high-performance concrete mix, and how it would affect its properties. The results of this would, in turn, be used to find a suitable hybrid mix containing an optimal amount of each of the replacement materials. Introducing these local waste materials into a self-consolidating, high-performance concrete will help minimize the amount of waste that goes to landfill in the State of Kuwait and can bring down the cost of construction. Repurposing wastes generated from local industries to serve as construction materials is one of the ways to make the construction process ‘greener’ and will aid the country in finding a way forward to becoming a more sustainable community, which is in line with its desire to meet the United Nations Sustainable Development Goals (UN SDGs) by the year 2035, particularly SDG 11: Sustainable Cities and Communities, which is to “make cities and human settlements inclusive, safe, resilient and sustainable” [15].

2. Materials and Methods

2.1. Selection of Quality Control Tests

As stated in the Introduction, SCC is defined by its high workability as compared to conventional concrete. SCC is defined by having specific rheological properties, which can be verified by the following ASTM and British Standard quality control tests:

2.1.1. Fresh SCC Quality Control Tests

The following quality control tests were chosen to be performed on the fresh SCC samples. Photographs of the testing procedure are shown in Figure 1.
(1)
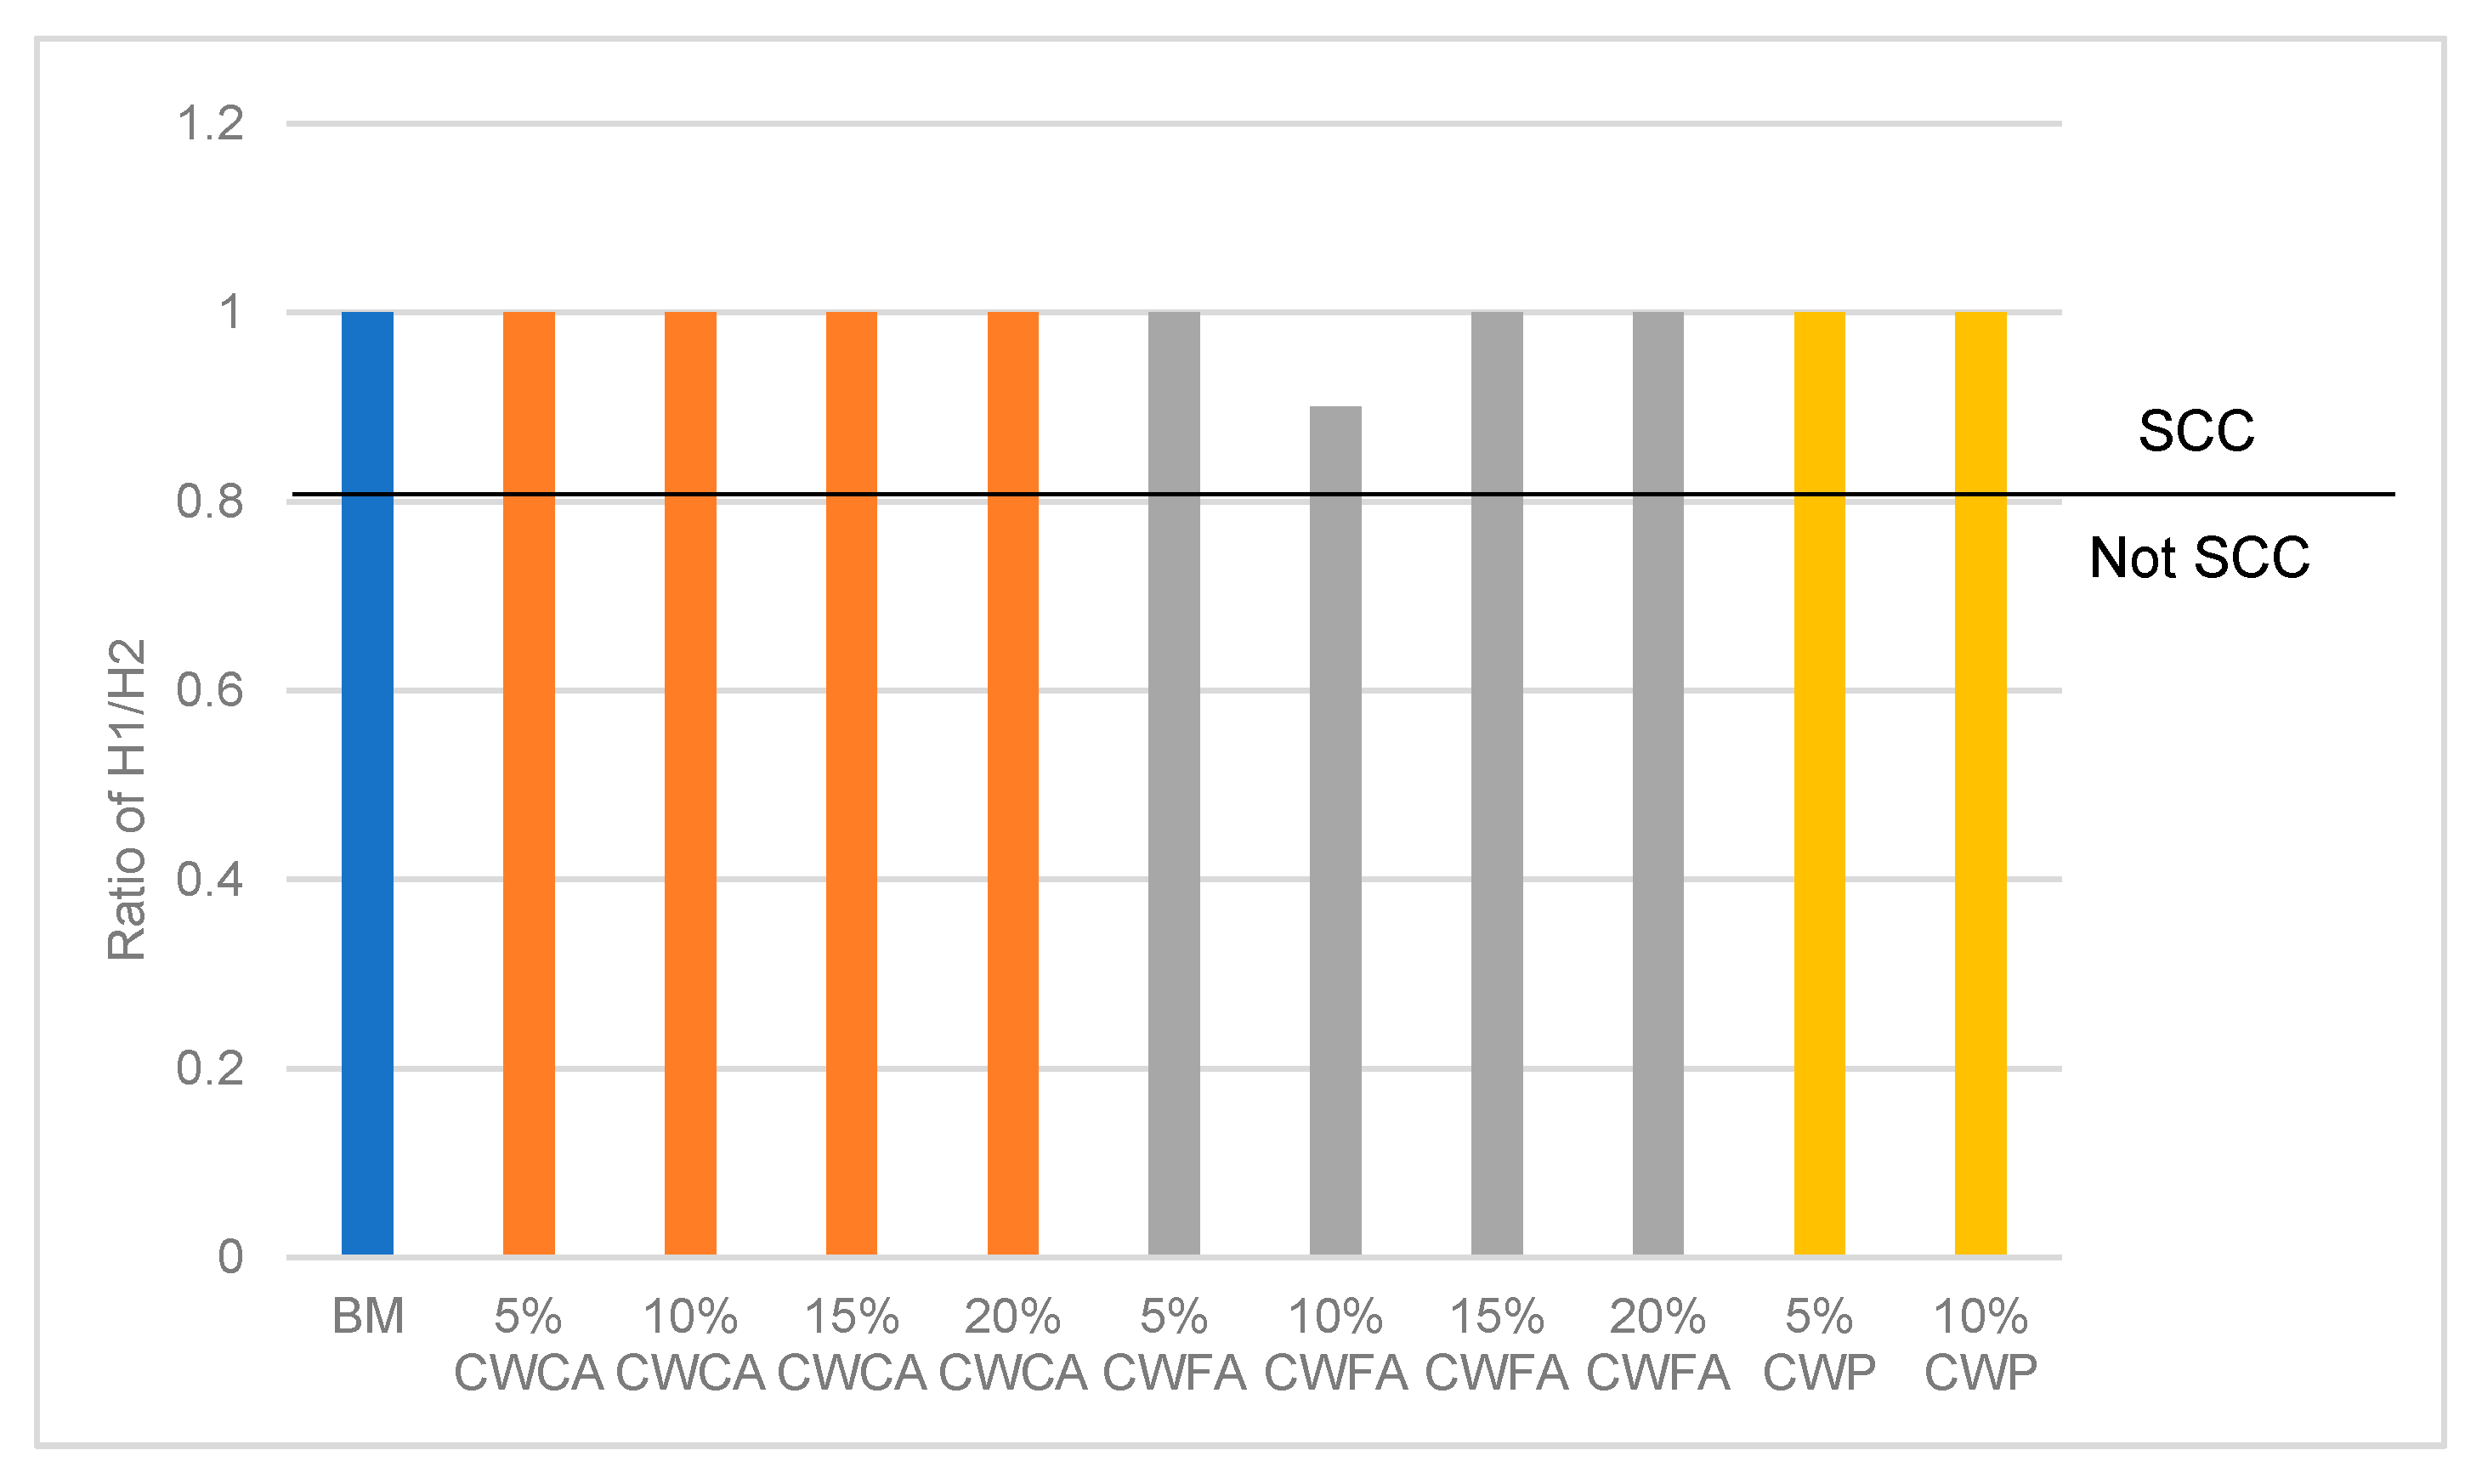
L-Box Test: This test demonstrates the SCC’s flowability through tight sections and restricted reinforcement arrangements. For a sample of concrete to be considered SCC, the ratio H2/H1 (with H2 being measured at the end of the open channel and H1 being measured at the vertical hopper) should preferably be 1.0. However, the standard allows for a minimum ratio of 0.8 [16].
(2)
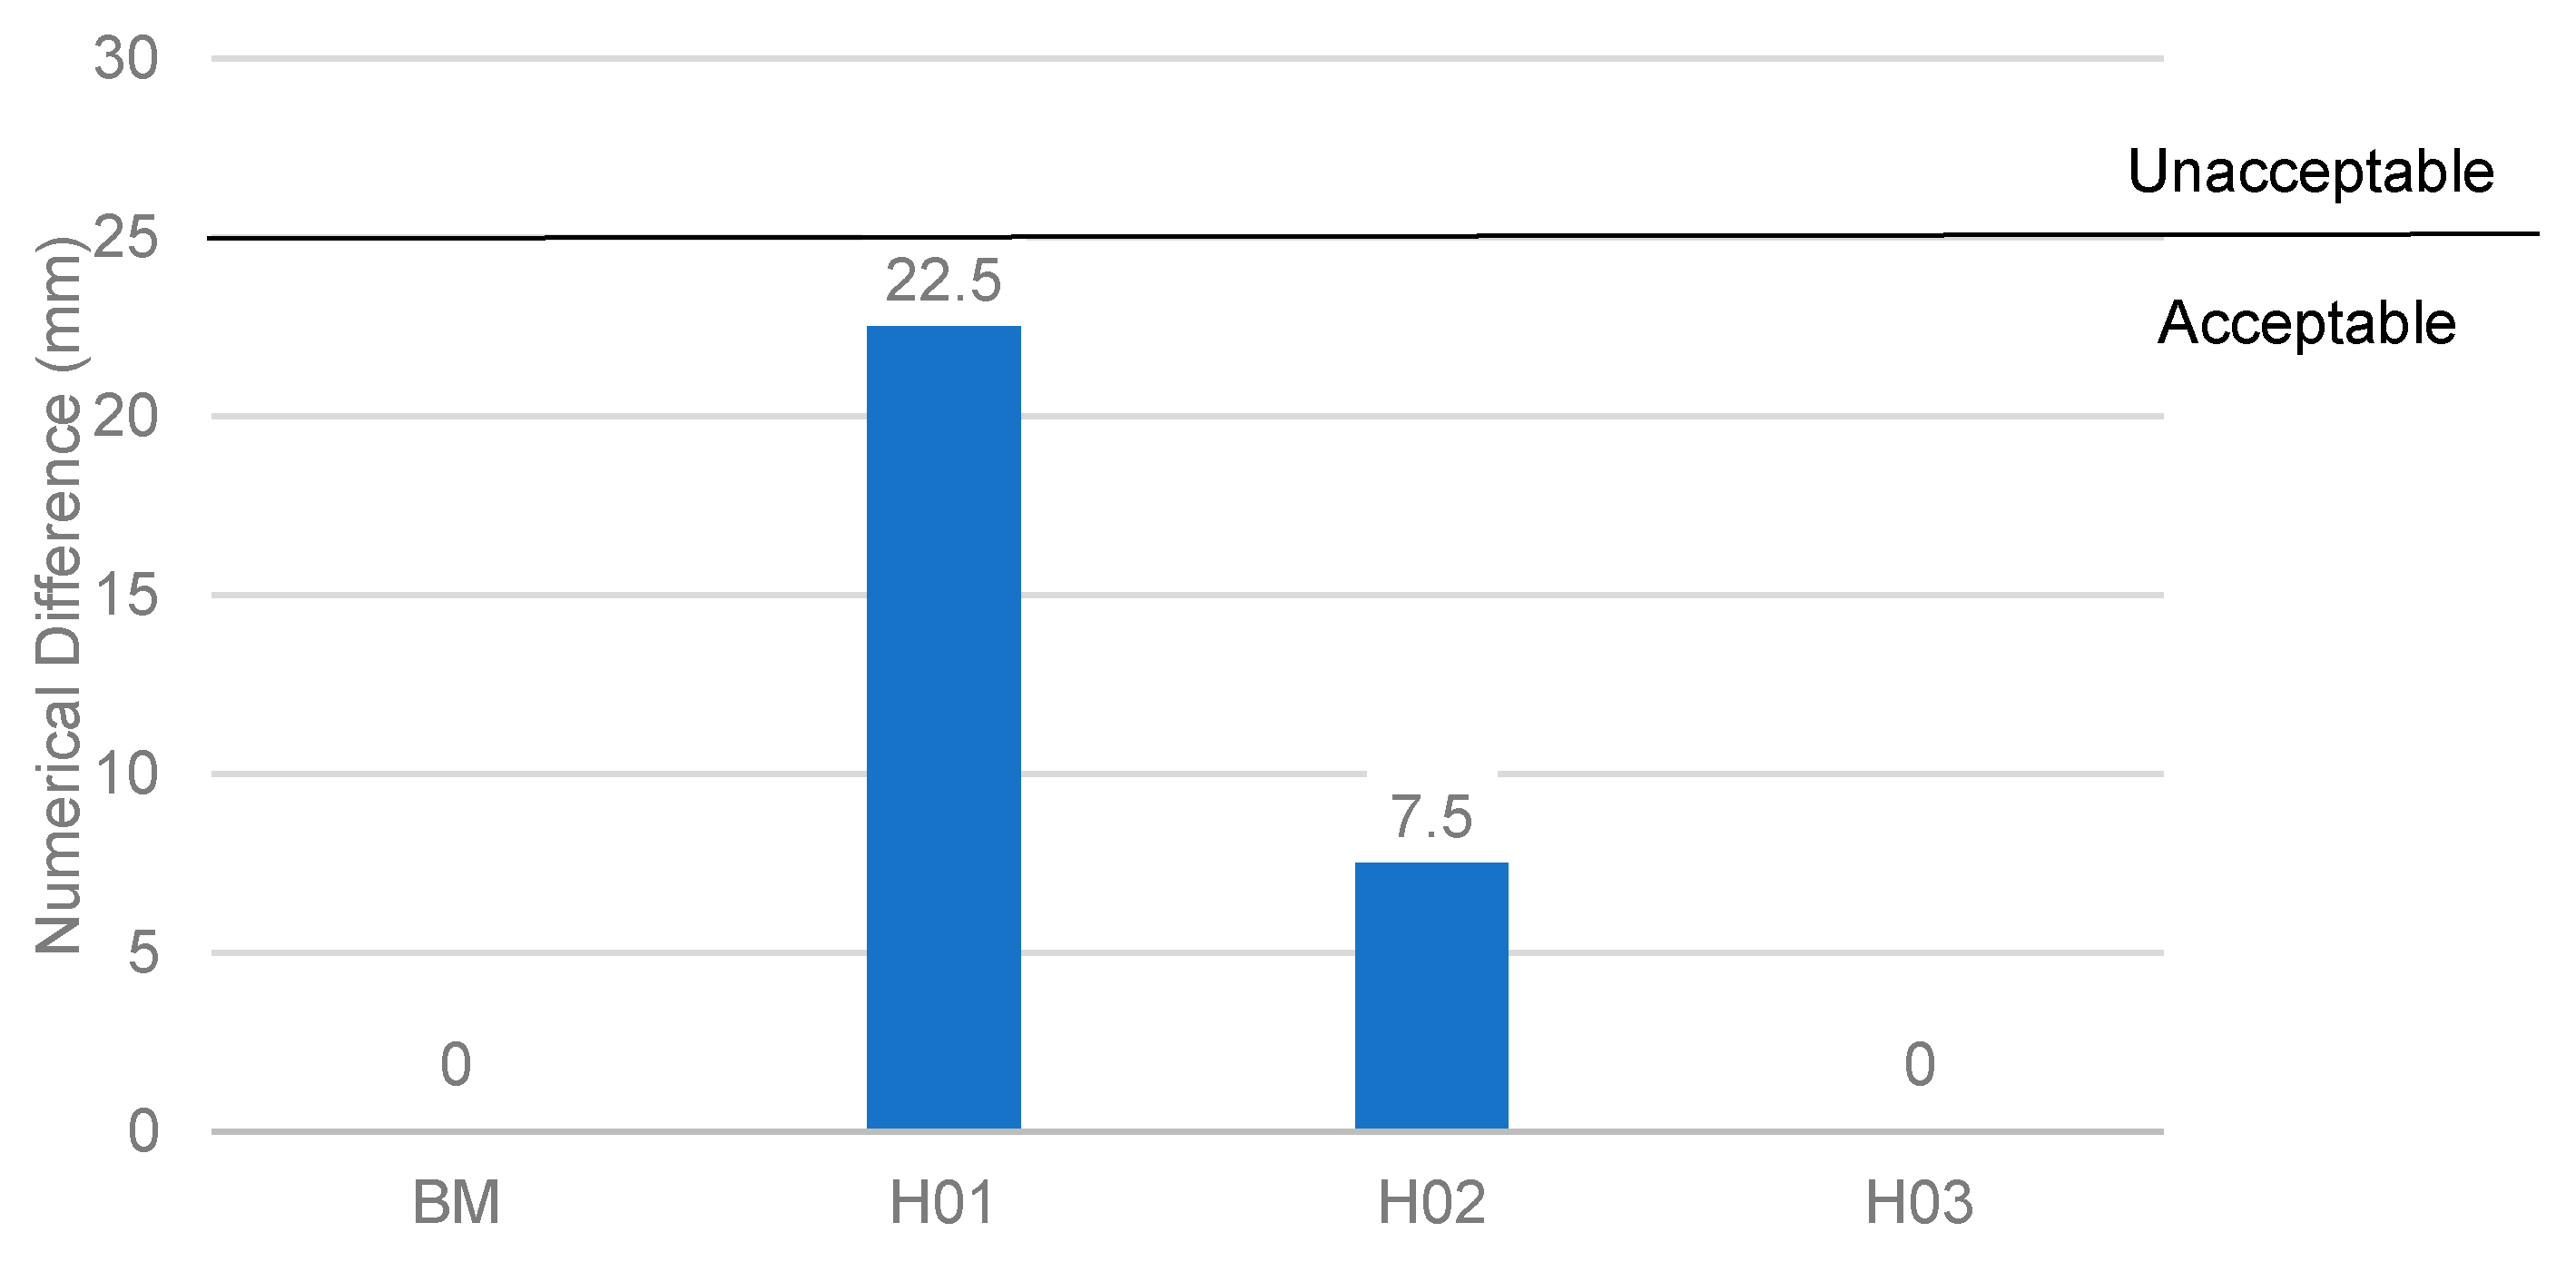
J-Ring Test: This test demonstrates the SCC’s flowability around reinforcements. This test also gives an indication of its workability and exposure to segregation. SCC is defined as having an average slump flow diameter of at least 500 mm, which was used as a cutoff to determine whether the sample of concrete is SCC or not. A difference of 25 mm between the J-Ring flow and slump flow test results is acceptable [17].
(3)
V-Funnel Test: This test was used to get an idea of the SCC’s viscosity. The SCC’s viscosity was measured immediately after placing it in the V-Funnel and after leaving it in the V-Funnel for 5 min. The timings of the two iterations are then compared [18].

2.1.2. Measurement of Compressive Strength

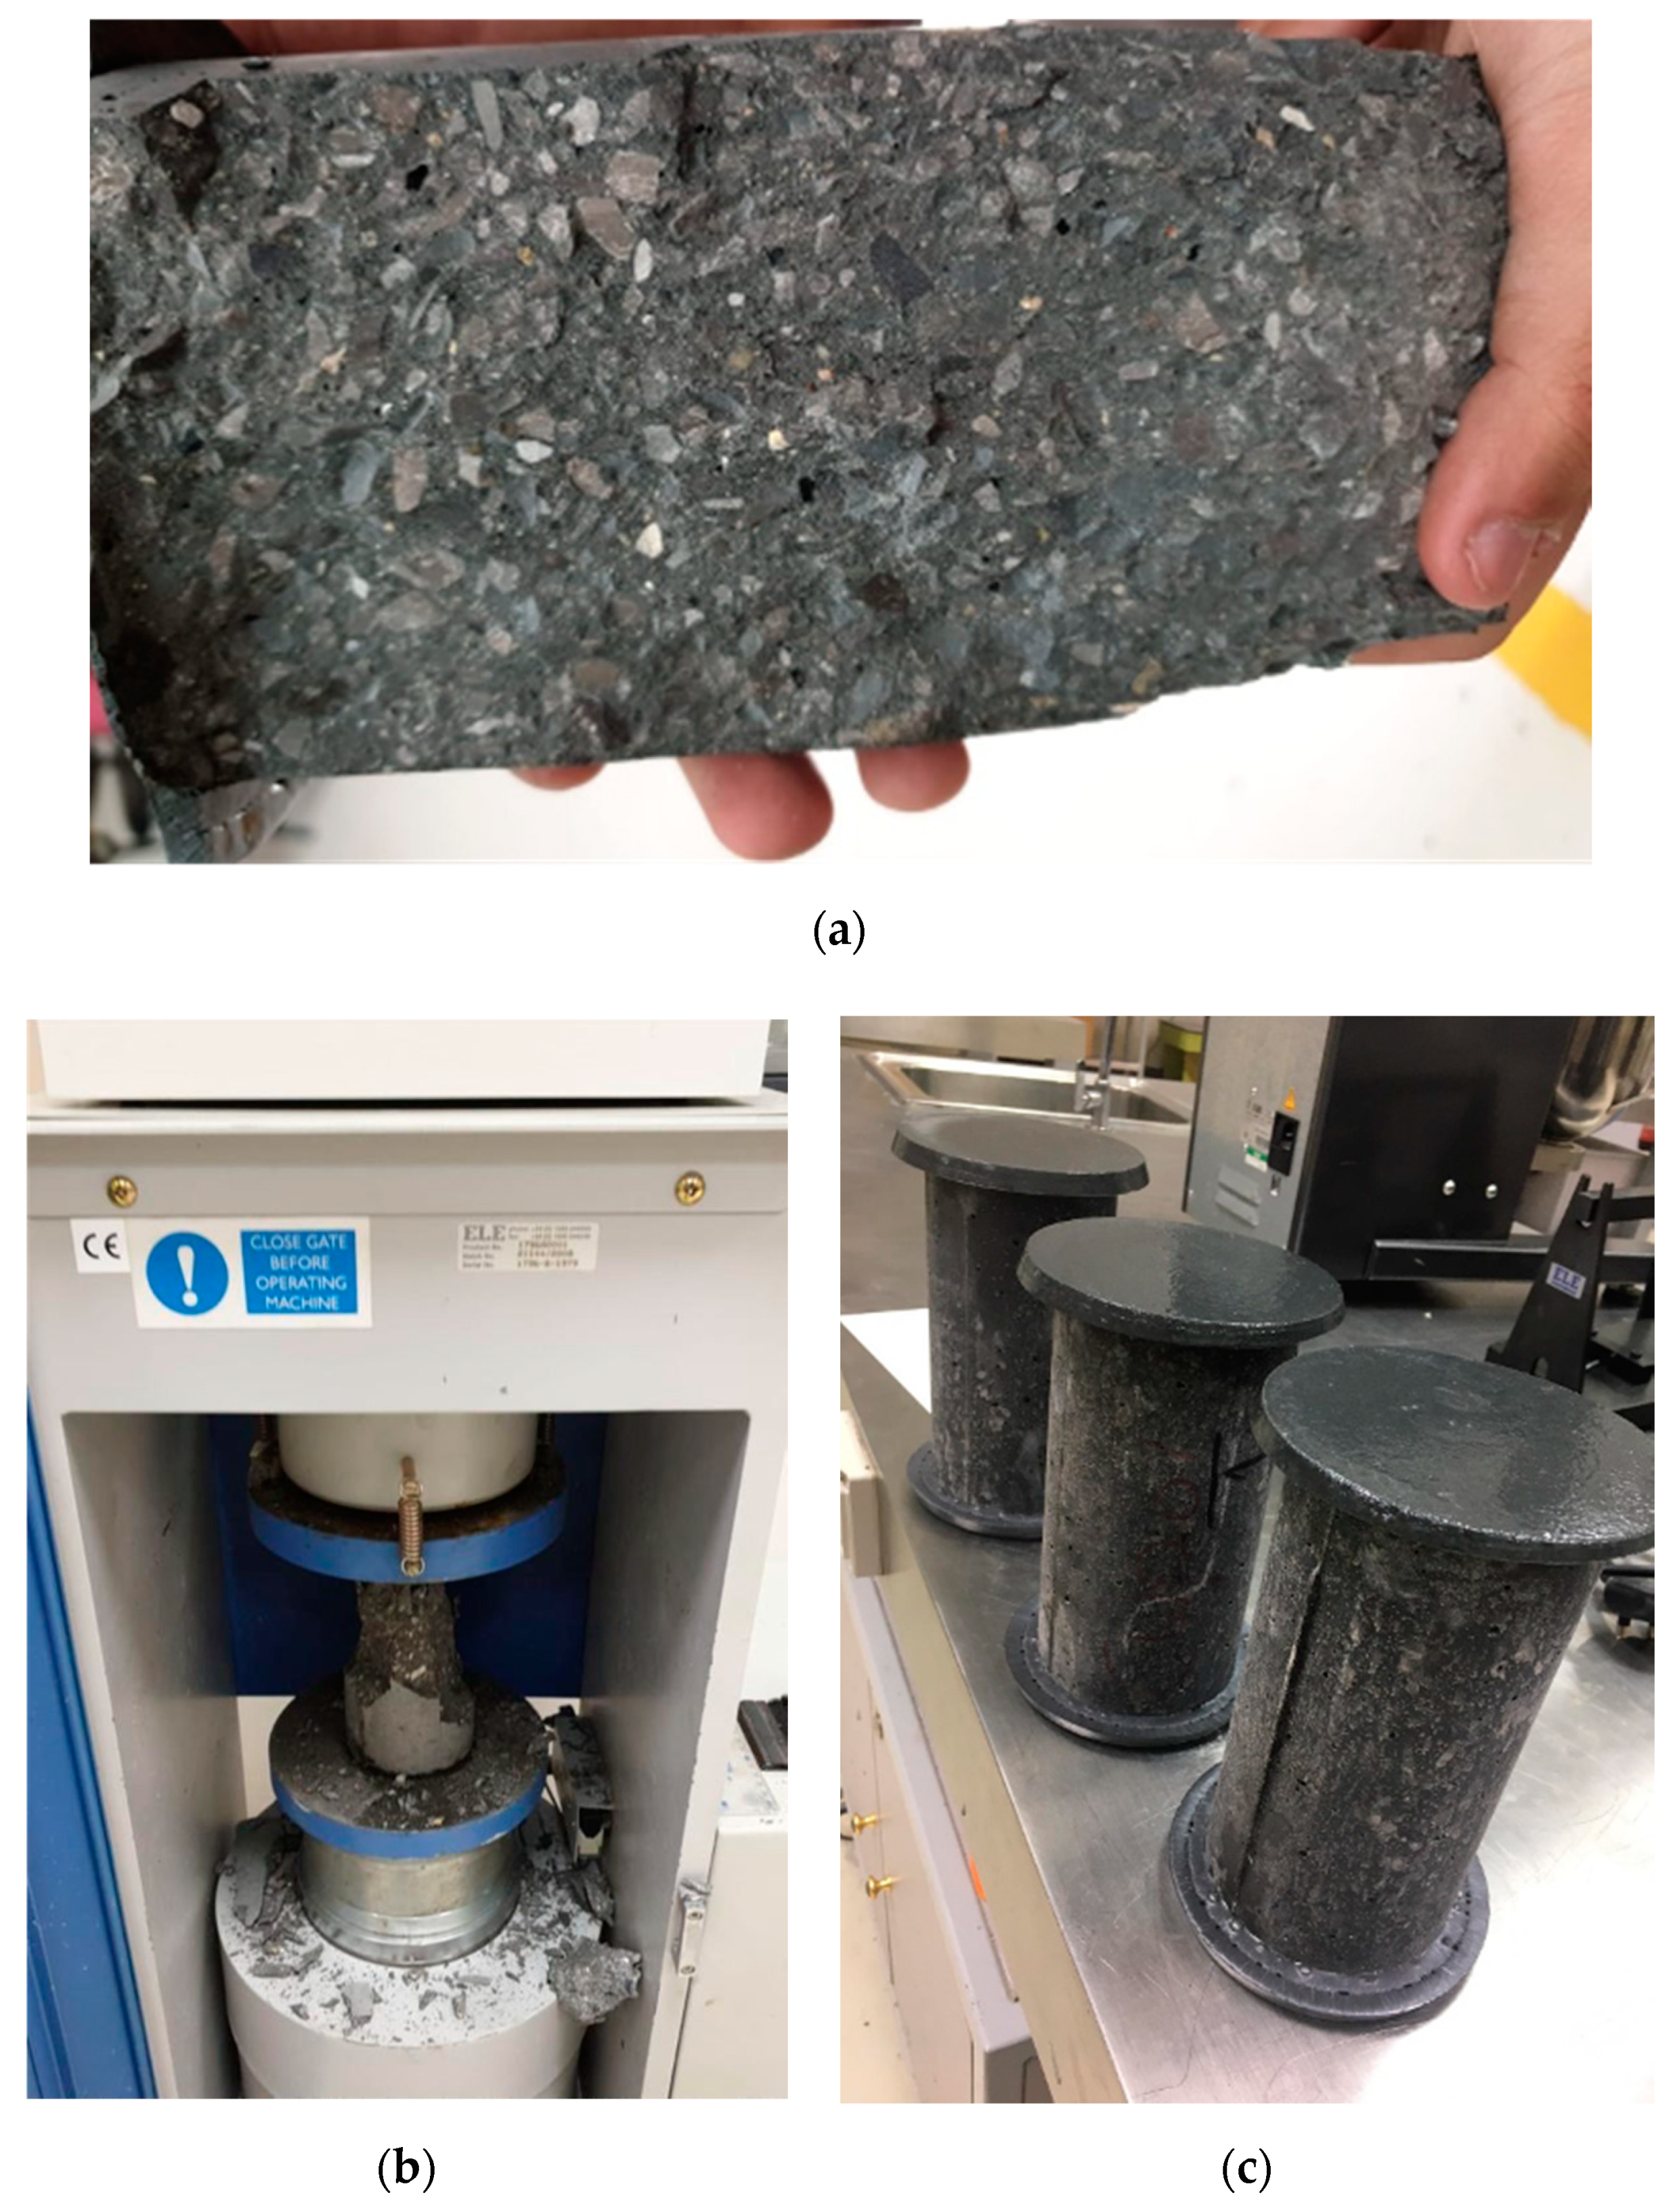
After the fresh concrete tests, cylindrical samples with a diameter of 100 mm and a nominal height of 200 mm were cast and cured in an insulated water tank for a period of time ranging between 3 and 56 days. A total of 224 samples spread over 16 batches were cast and tested for the purposes of this study. After curing, the hardened concrete’s compressive strength was tested using appropriately sized steel caps lined with neoprene pads (for when the strength of the concrete is less than 80 MPa) [19], and using sulfur capping (for when the strength of the concrete is more than or equal to 80 MPa) [20]. Photographs of the testing procedure are shown in Figure 2.

2.2. Use of Ceramic Waste

A local sanitary wares production facility provided the waste glazed ceramics used in this study. The ceramics were used to prepare three replacement products: ceramic waste coarse aggregate (CWCA) to partially replace 4.75 mm aggregates, ceramic waste fine aggregate (CWFA) to partially replace sand, as well as ceramic waste powder (CWP) to partially replace cement. Large pieces of ceramics were spun in a Los Angeles (LA) Abrasion apparatus with 12 steel balls for repetitions of 1000 revolutions. The resulting product was sieved through a series of standard sieves with diameters ranging from 9.5 mm to 0.075 mm to obtain the replacement products. Ceramic aggregates passing the 9.5 mm sieve and retained on the 4.75 mm sieve was classified as CWCA. All ceramic aggregates passing the 4.75 mm sieve and retained on any sieve up to and including the 0.075 mm sieve was classified as CWFA. Finally, ceramic aggregates passing the 0.075 mm sieve was classified as CWP. The effect of each ceramic additive was investigated individually prior to their use in the hybrid mixes to get a clear idea of how each of the additives affected the SCC’s behavior. The physical properties of the CWCA, CWFA, and CWP used in the study are shown in Table 1. The bulk densities, specific gravities, and absorption of CWCA were obtained in accordance with ASTM C127 [21]. The absorption of CWFA and CWP were obtained in accordance with ASTM C128 [22]. The fineness of CWP was obtained in accordance with ASTM C184 [23].

2.3. Use of EAFS

A portion of the 9.5 mm aggregates used in the study were replaced with similarly sized EAFS. The EAFS was sourced from a local structural steel production facility and sieved using a standard 9.5 mm sieve to obtain the aggregates. The physical properties of the EAFS used in the study are shown in Table 2. The bulk densities, specific gravities, and absorption of EAFS were obtained in accordance with ASTM C127 [21].

2.4. Benchmark SCC Mix

The study then proceeded to determine a suitable high-strength SCC with a target compressive strength of 90 MPa to be used as a benchmark. This would be used as a reference to document the effects of each of the additives on the rheological properties and compressive strength of the SCC. The conventional concrete raw materials used in this study include: Type I ordinary Portland cement, washed and oven-dried sand, oven-dried angular aggregates with nominal sizes of 9.5 mm and 4.75 mm, class F fly ash, and silica fume that complies with the requirements set out in ASTM C1240 [24]. Initially, the effect of each additive was investigated separately at various doses. The results were then analyzed to find the optimal dose of each additive to be used in the development of the hybrid mixes. The mix design used to produce the benchmark SCC mix is shown in Table 3. The water/cement was computed by dividing the quantity of water by the quantity of cement shown in the table, whereas the water/binder ratio includes all binders used in the mix (cement, silica fume, and fly ash). It is worth noting that the water/cement and water/binder ratios shown in the table are those obtained from the mix design and are therefore theoretical.

3. Results and Discussion

3.1. Effects of Ceramic Additives

3.1.1. Rheological Properties

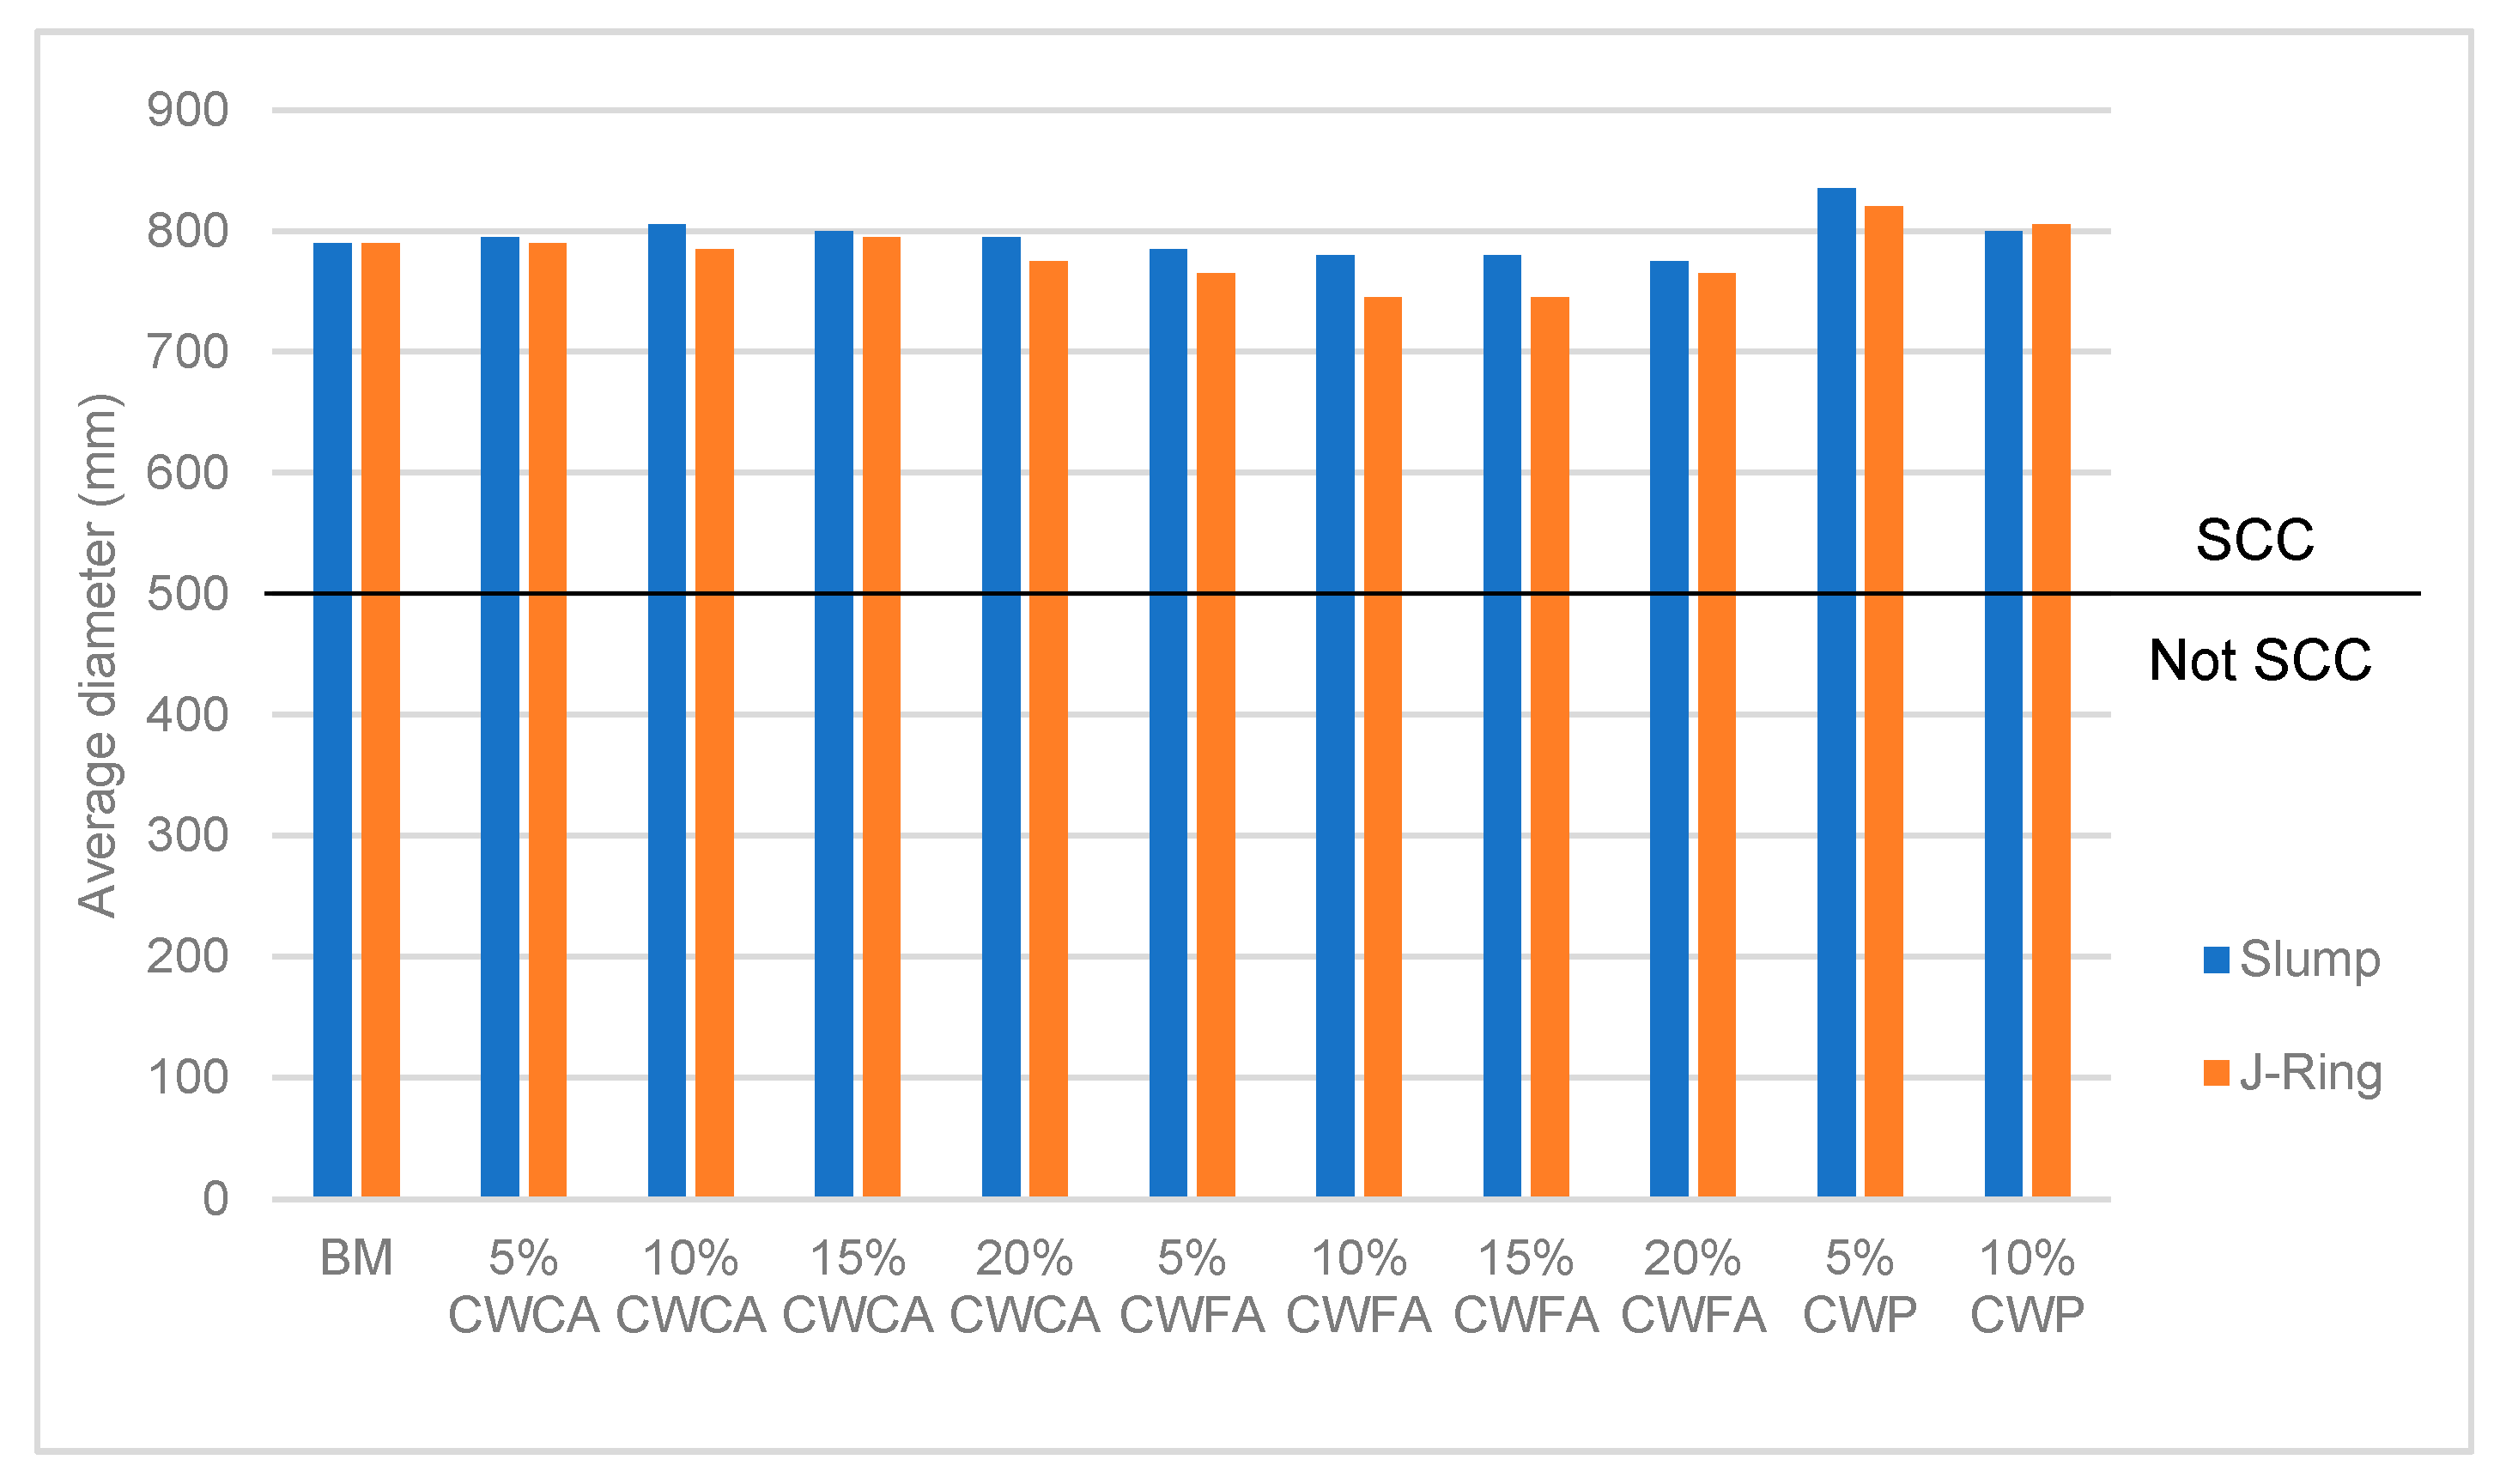
The average diameters for the J-Ring flow and slump flow for samples containing varying doses of each ceramic additive are shown in Figure 3. As shown in the figure, introducing the additives showed no adverse effects on the flowability of the mix nor does it subject it to segregation, which initially means that all trials containing ceramic additives can be considered. However, ASTM C1621 [15] also states that the numerical difference between the average diameters obtained from the two tests must not exceed 25 mm. Figure 4 shows the numerical difference between the J-Ring flow and slump flow for each of the ceramic additives. The results of the J-Ring flow and slump flow show that the introduction of 10% and 15% CWFA restricts the flowability of the SCC to the point where its results are considered unacceptable. All other doses of ceramic additives, however, met both requirements as stated in ASTM C1621 and therefore are considered successful.
Figure 5 shows the ratio of H2/H1 for samples containing different doses of each ceramic additive. As shown in the figure, introducing the additives had no adverse effects on the flow-ability of the SCC. All samples of SCC met the requirement to have a minimum H2/H1 ratio of 0.8 as specified in BS EN 12350-10 [16]. Additionally, most samples had ideal flow-ability as their H2/H1 ratio was 1.0. This, along with the J-Ring test results, show that the introduction of ceramic additives to a benchmark SCC mix generally does not undermine its rheological properties.
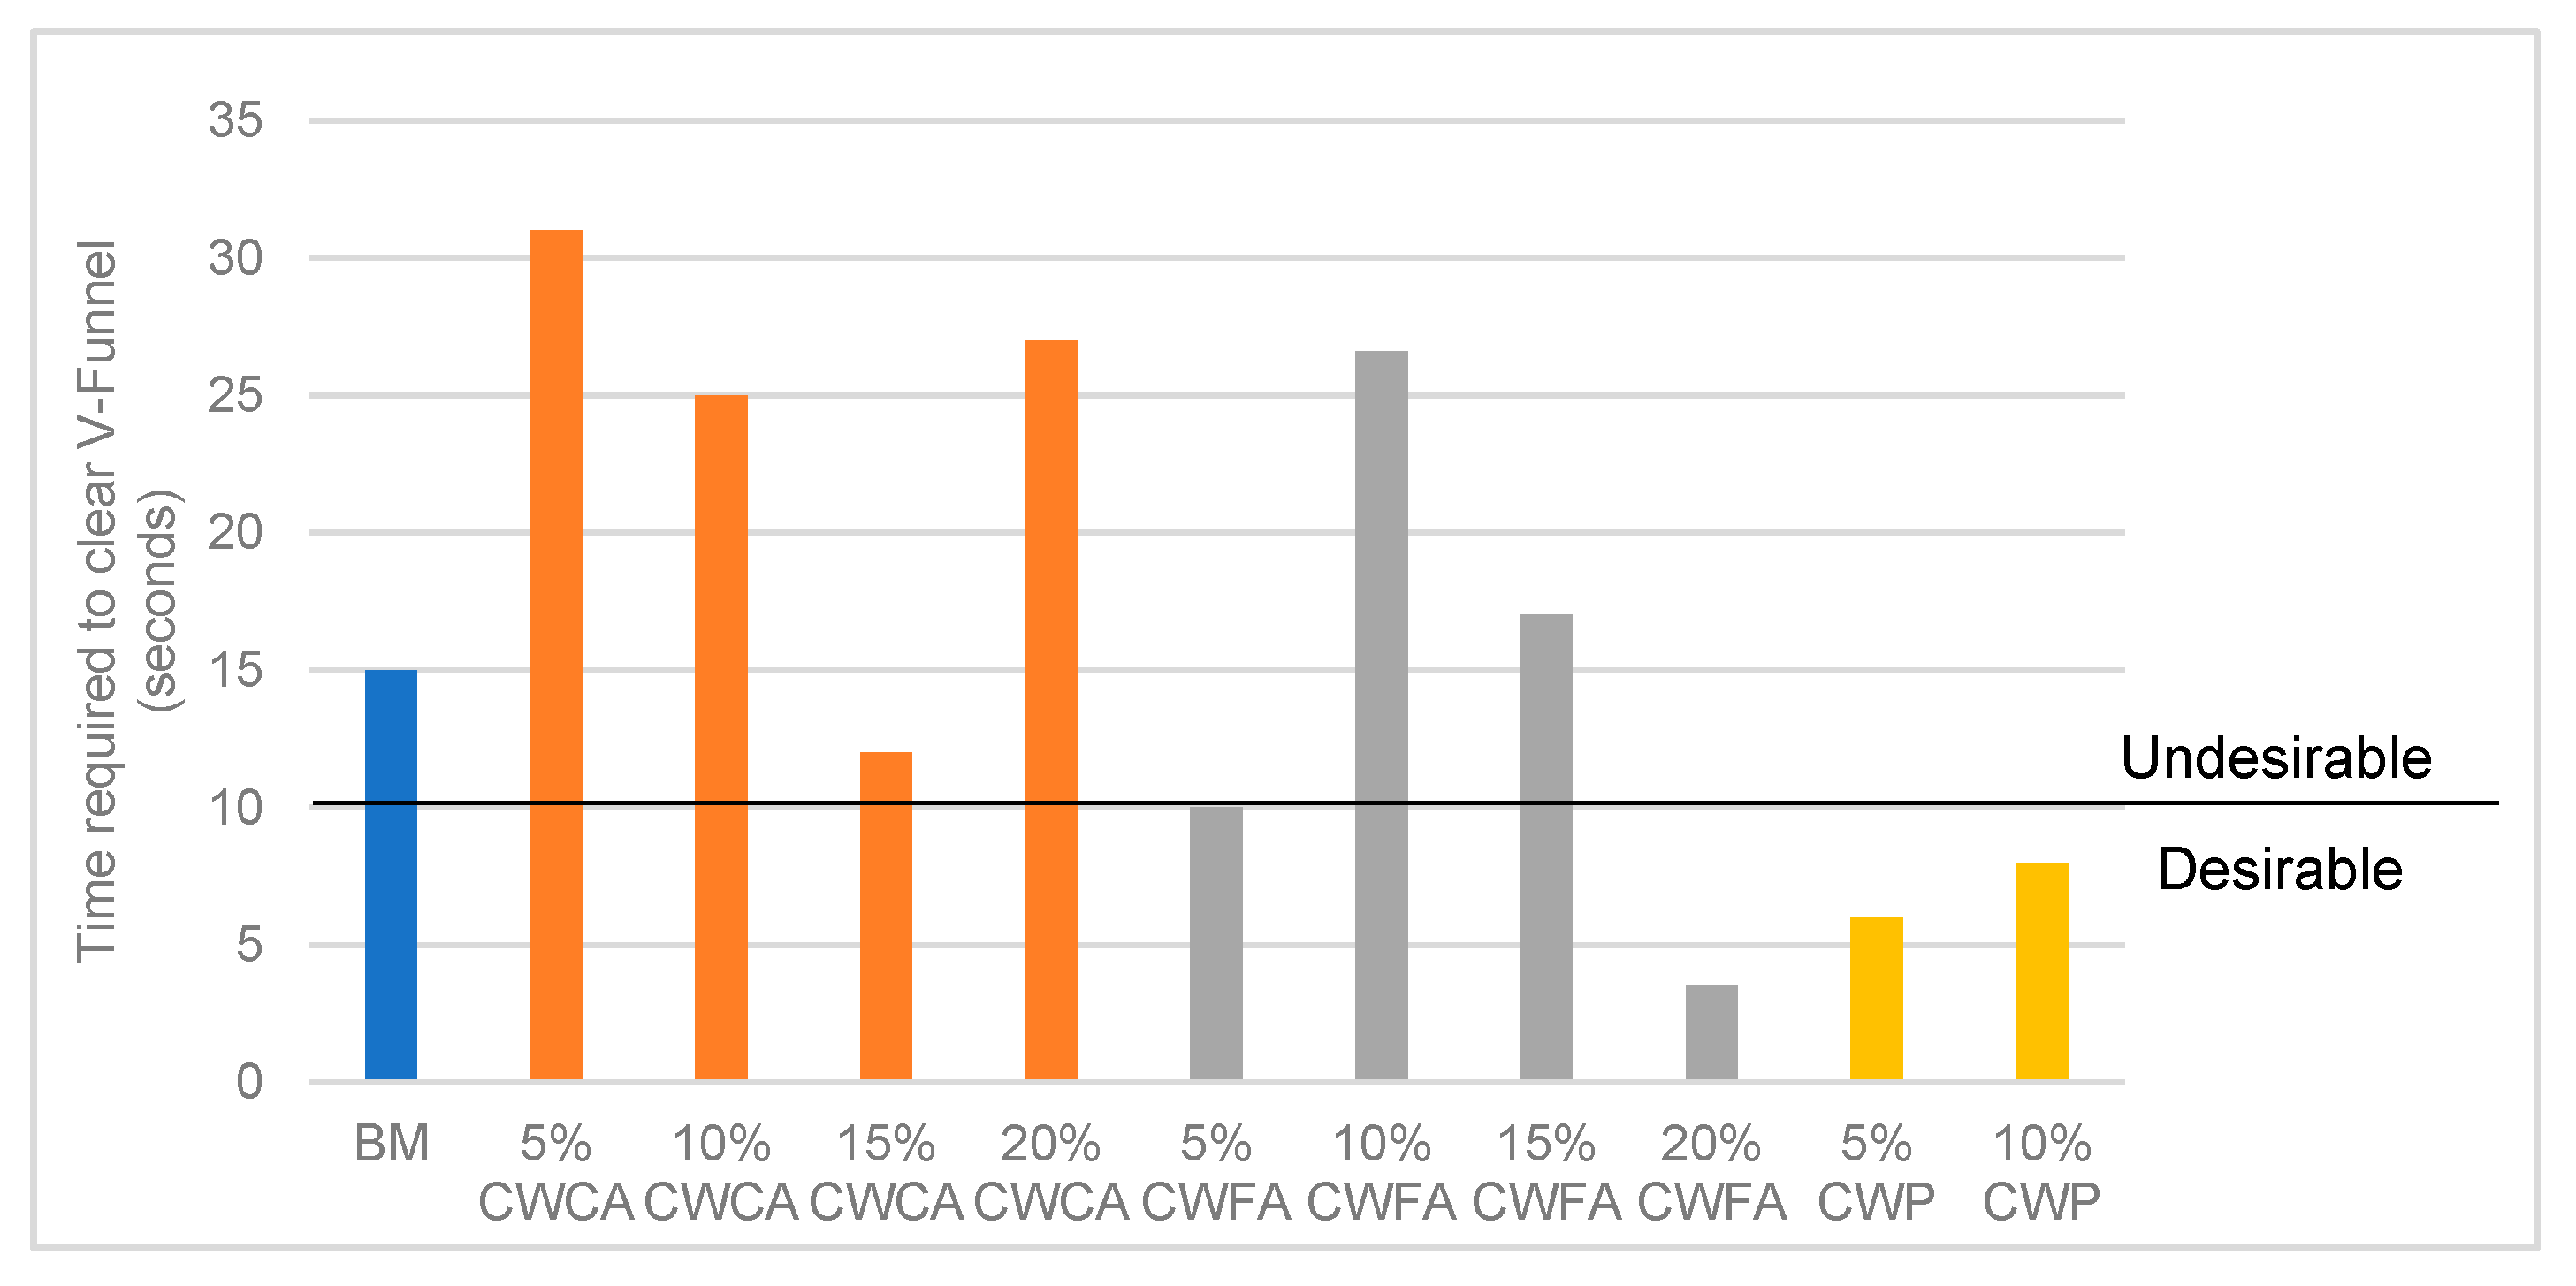
Figure 6 shows the time it takes for samples containing different doses of each ceramic additive to pass through a V-Funnel as stated in BS EN 12350-9 [18]. It is worth noting that the benchmark SCC mix initially had undesirable viscosity; the viscosity of the mix is not considered to be a major issue as it is not a key determinant of SCC. It can be inferred that the introduction of CWCA to partially replace 4.75 mm aggregates increases the viscosity of the benchmark SCC mix, which is shown in the figure by the increased time taken for the SCC to pass through the V-Funnel; the result for 15% CWCA replacement can be considered anomalous as it does not follow the general trend shown by the CWCA-replaced SCC. Introducing CWFA at lower and higher ranges to partially replace sand improved the benchmark SCC mix’s viscosity and made it meet the criteria for desirable workability as per the standard. Finally, the introduction of CWP to the mix significantly improved the viscosity of the benchmark SCC mix, making them fall well beneath the cut-off set by the standard.

3.1.2. Compressive Strength

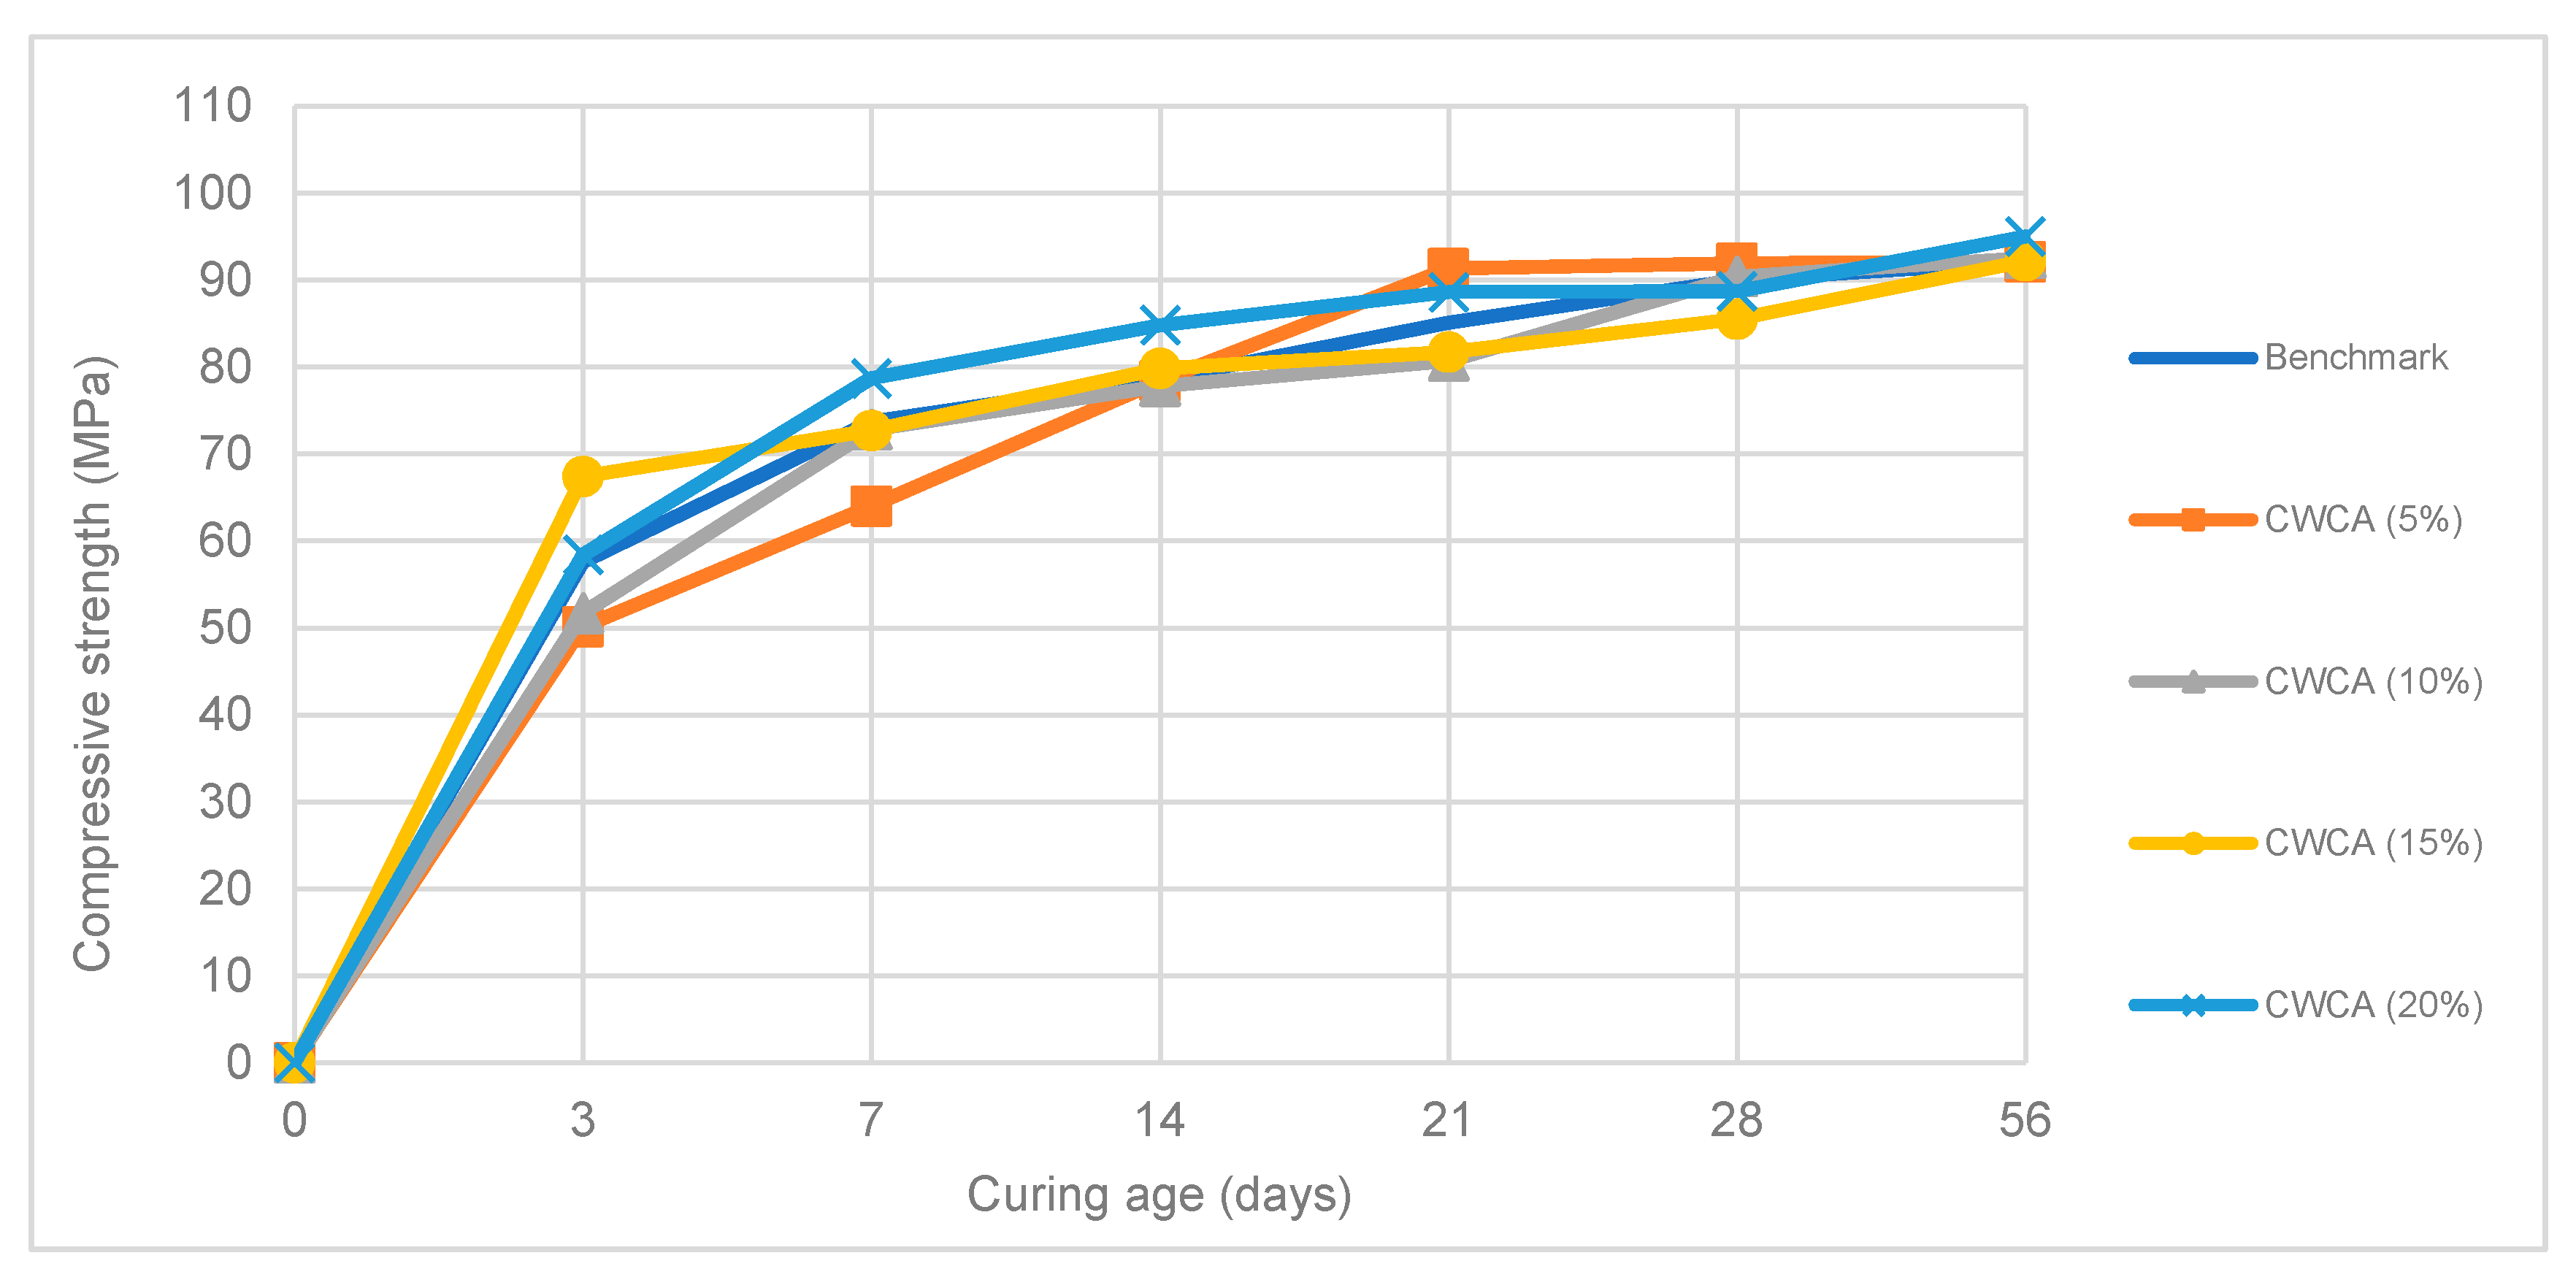
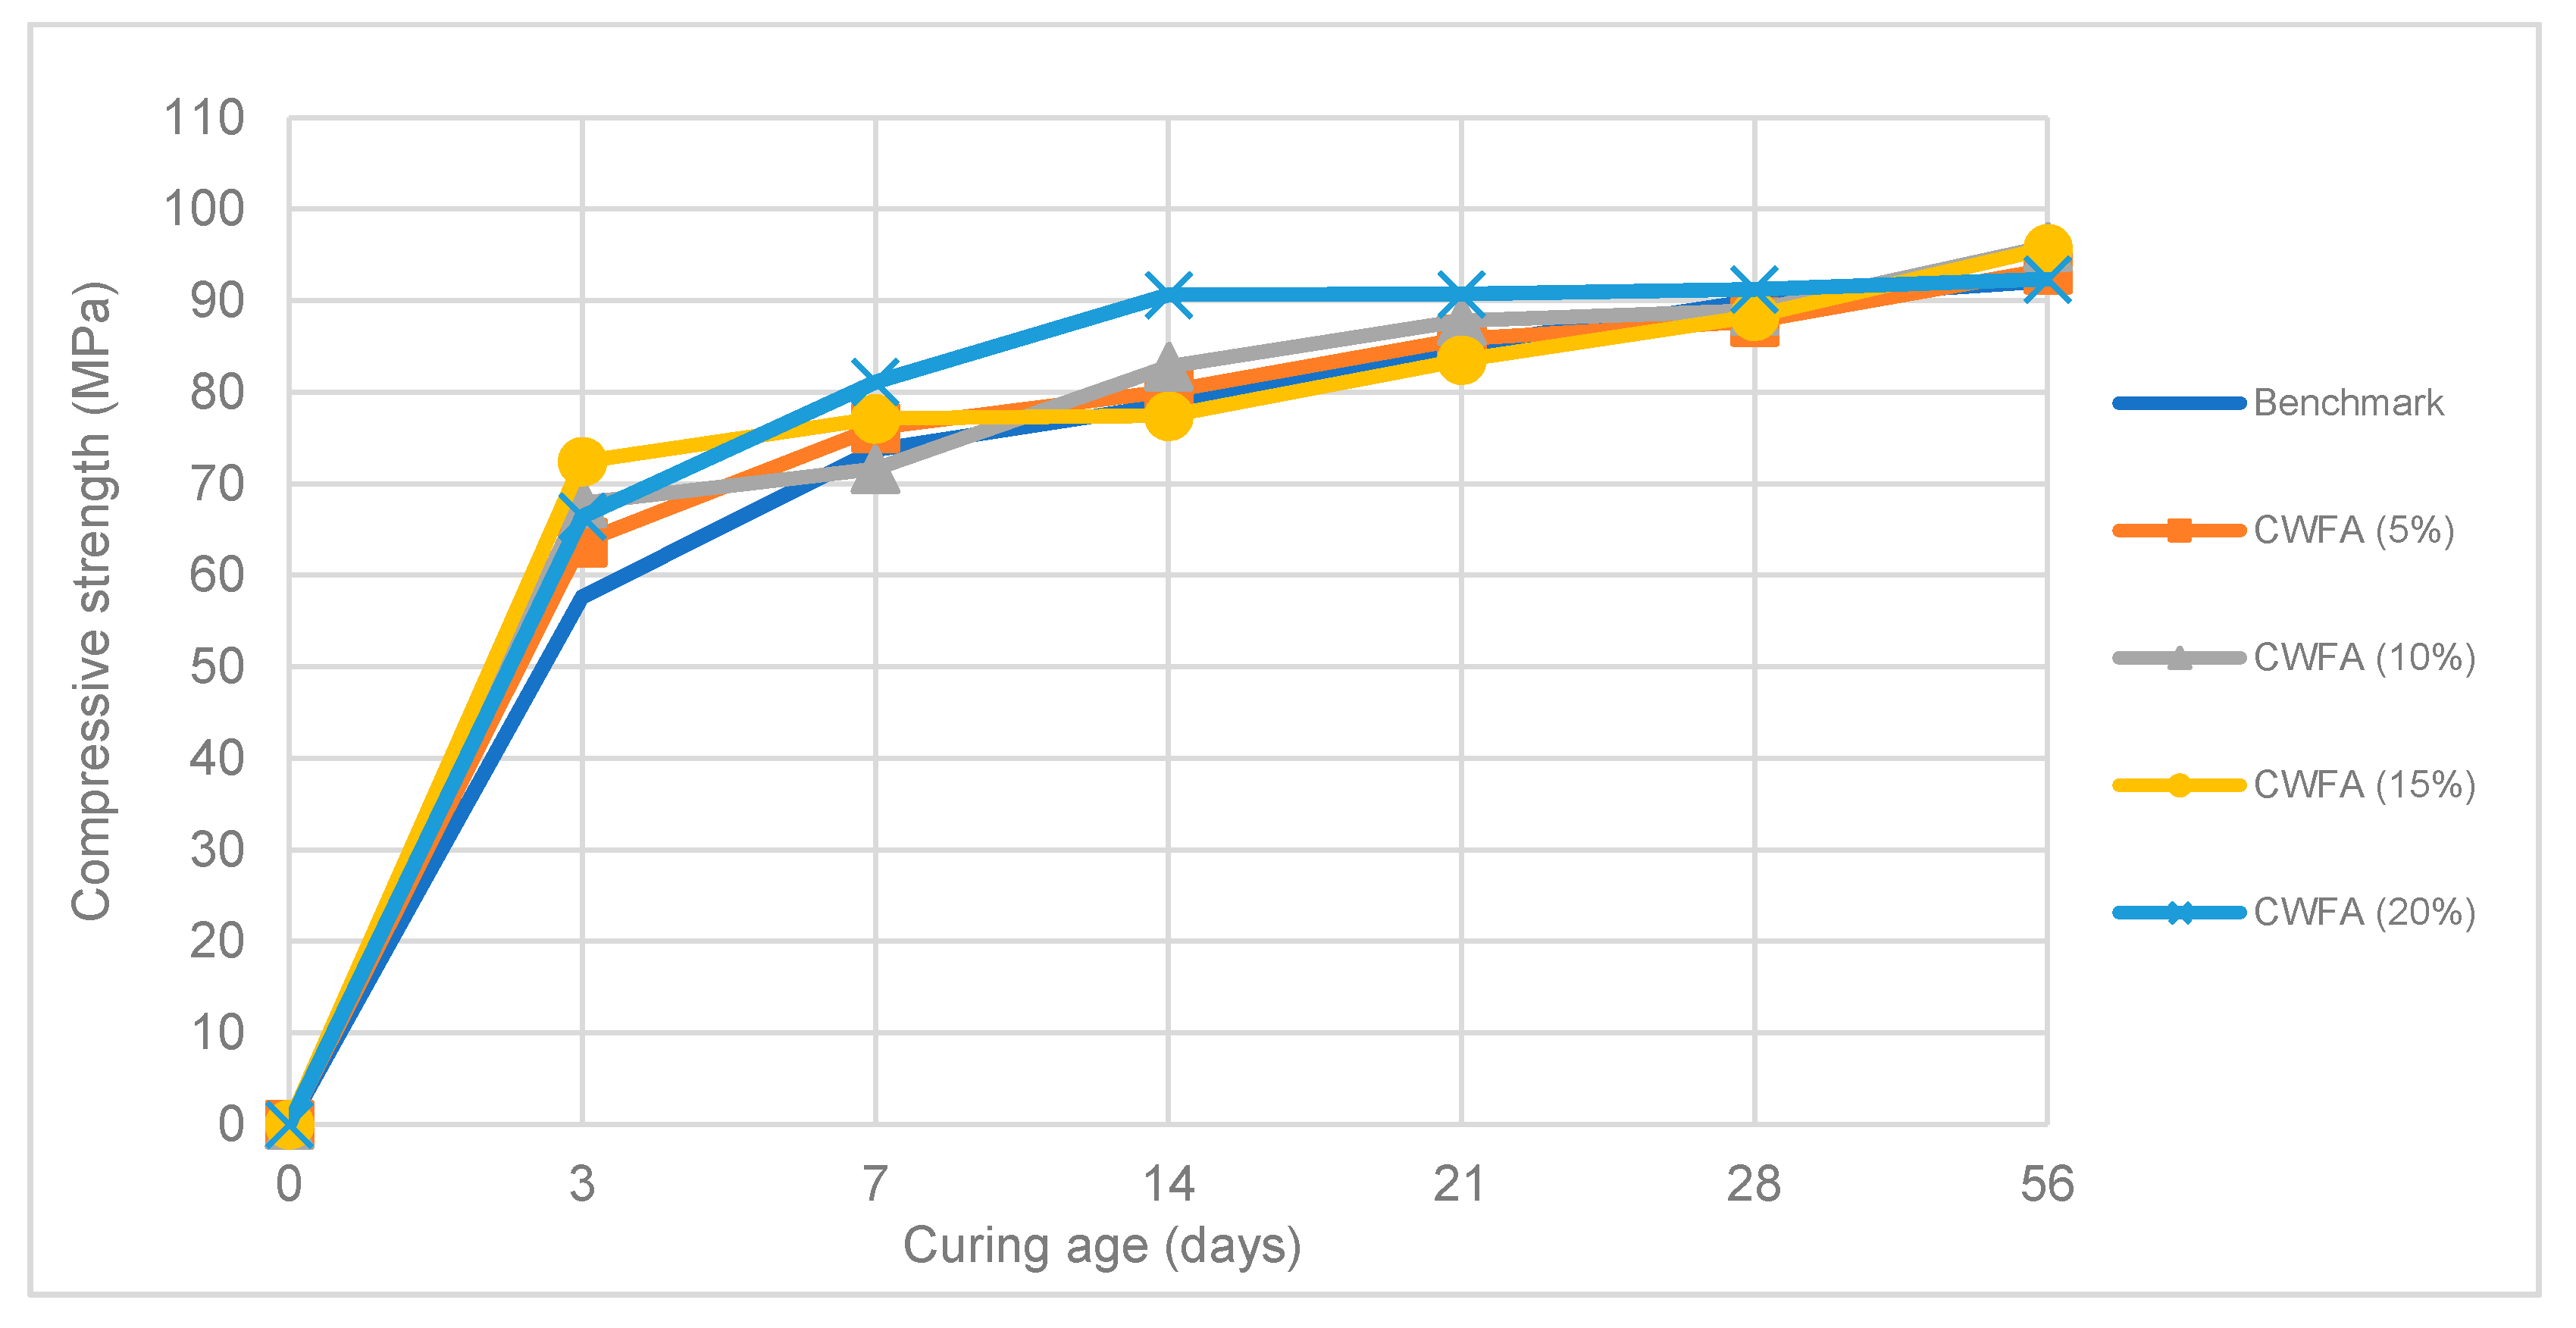
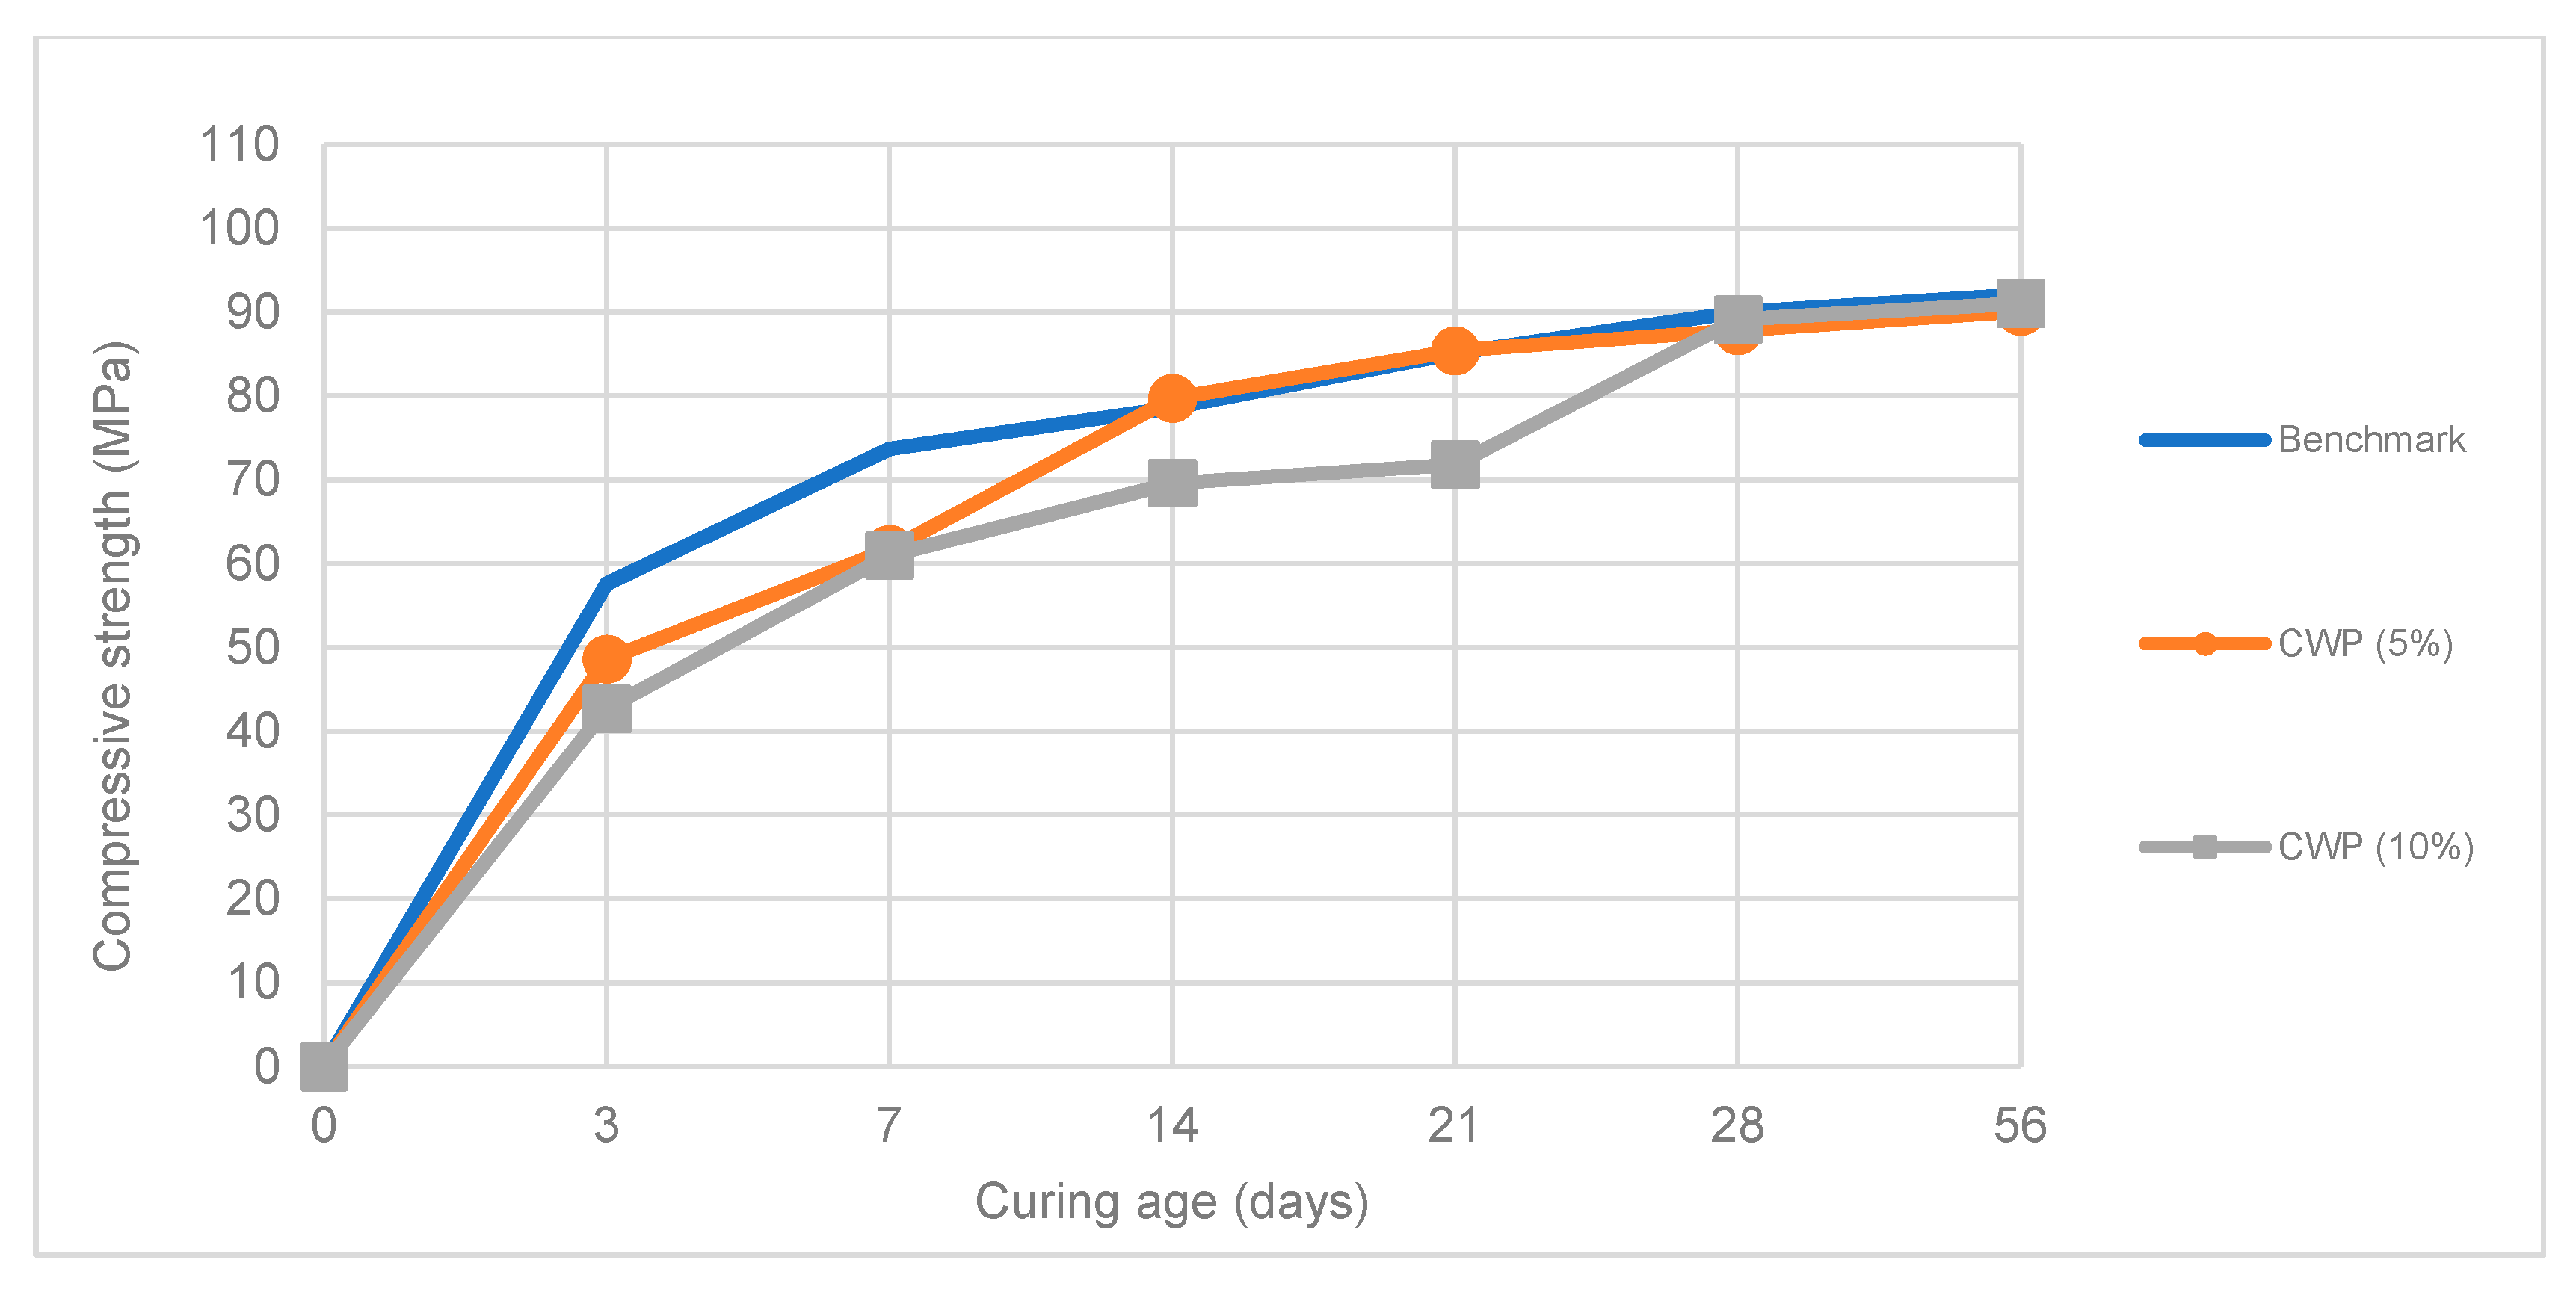
Figure 7, Figure 8 and Figure 9 show the variation of compressive strength of SCC samples containing various ceramic additives with time. Multiple samples were tested at different intervals ranging between 3 and 56 days, with the average compressive strength being reported.
Figure 7 shows how the compressive strength of SCC samples containing various doses of CWCA varied with curing age. As shown in the figure, introducing CWCA at low doses (5% and 10%) had a negative impact on the compressive strength at 3 days compared to the benchmark SCC mix. By examining the slope of the trendline for 5% CWCA, we see that the SCC continued to gain strength at a consistent rate up until the 21-day mark, after which the rate of strength gain plateaued with no significant strength gain up to the 56-day mark. All other trials exhibited similar rates of strength gain compared to the benchmark SCC mix. All trials had similar 56-day compressive strengths, ranging between 92–95 MPa, noting that the benchmark SCC mix had a 56-day compressive strength of 92.1 MPa. For the benchmark mix, the compressive strength results had a maximum standard deviation of 2.82 MPa and had a maximum variance coefficient of 3.13%, whereas the CWCA mixes had a maximum standard deviation of 6.70 MPa and a maximum variance coefficient of 7.41%.
Figure 8 shows the variation of compressive strength of SCC samples containing various doses of CWFA. As shown in the figure, introducing CWFA at any dose initially improved the compressive strength measured at 3 days, when compared to the benchmark SCC mix. By examining the slope of the trendline for 20% CWFA, we see that the SCC gained strength at a much faster rate as compared to the benchmark SCC mix. The same mix gained most of its compressive strength by the 14-day mark, after which the rate of strength gain plateaued with no significant strength gain up to the 56-day mark. All other trials exhibited similar rates of strength gain compared to the benchmark SCC mix. All trials had similar 56-day compressive strengths, ranging between 92–96 MPa. The CWFA mixes had a maximum standard deviation of 4.32 MPa and a maximum variance coefficient of 4.92%.
The compressive strength of SCC samples containing various doses of CWP is shown in Figure 9. As shown in the figure, introducing CWP at any dose initially had a negative effect on the compressive strength measured at 3 days, when compared to the benchmark SCC mix. 5% CWP began to match the benchmark SCC’s performance at 14 days, while 10% CWP matched the benchmark SCC at 28 days. Both trials had similar 56-day compressive strengths, ranging between 90–92 MPa. The CWP mixes had a maximum standard deviation of 2.72 MPa and a maximum variance coefficient of 2.99%.
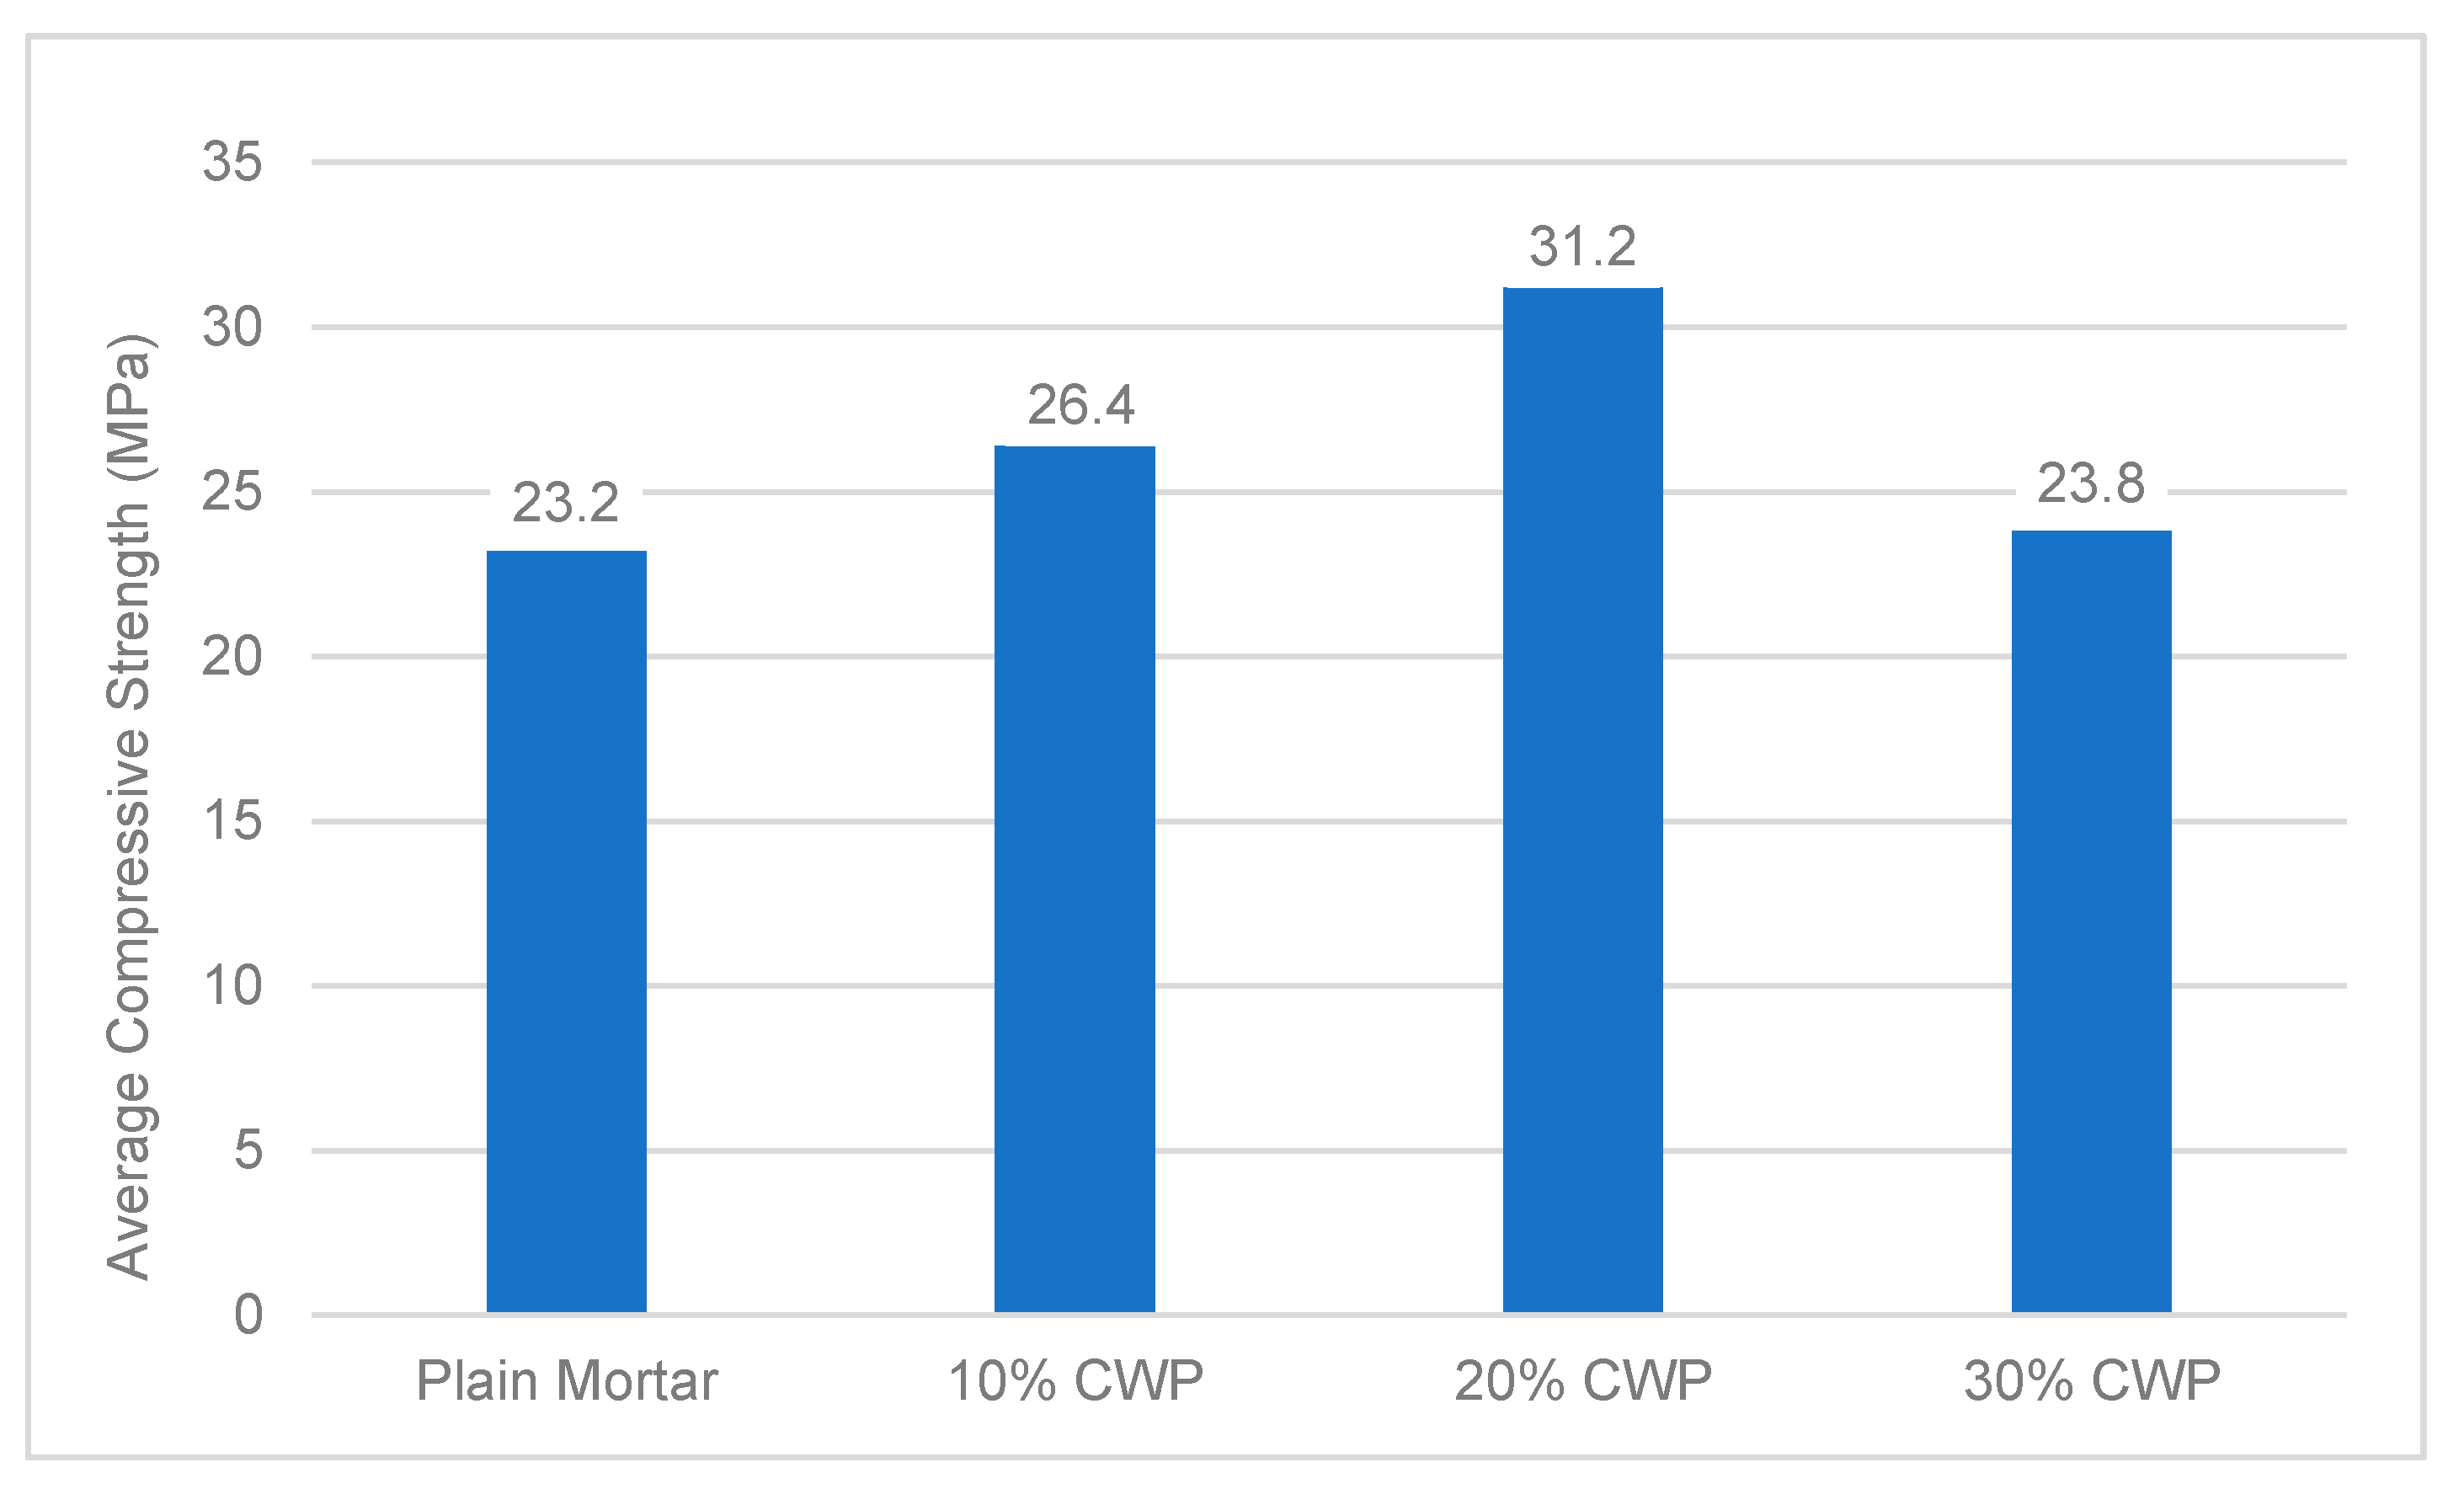
Following the results of the CWP trials, an additional investigation was launched to see whether CWP could be used as a viable replacement of cement. Twelve mortar cubes measuring 50 × 50 × 50 mm were cast in accordance with ASTM C109 [25]. Three cubes were cast as a control sample that contained no CWP, with the remainder divided into three cubes with increments of 10% CWP. Figure 10 shows the variation of the compressive strength of these hydraulic cement cubes when tested at 7 days of age. As shown in the figure, introducing CWP at any dose increased the compressive strength of the mortar cubes when compared to the plain mortar cubes, with 20% CWP exhibiting the largest compressive strength (31.2 MPa). The results of this test show that CWP is a viable replacement of cement in the preparation of mortar cubes, and that the compressive strength of the SCC mix can be improved if introduced at an appropriate dose.

3.2. Effects of EAFS

3.2.1. Rheological Properties

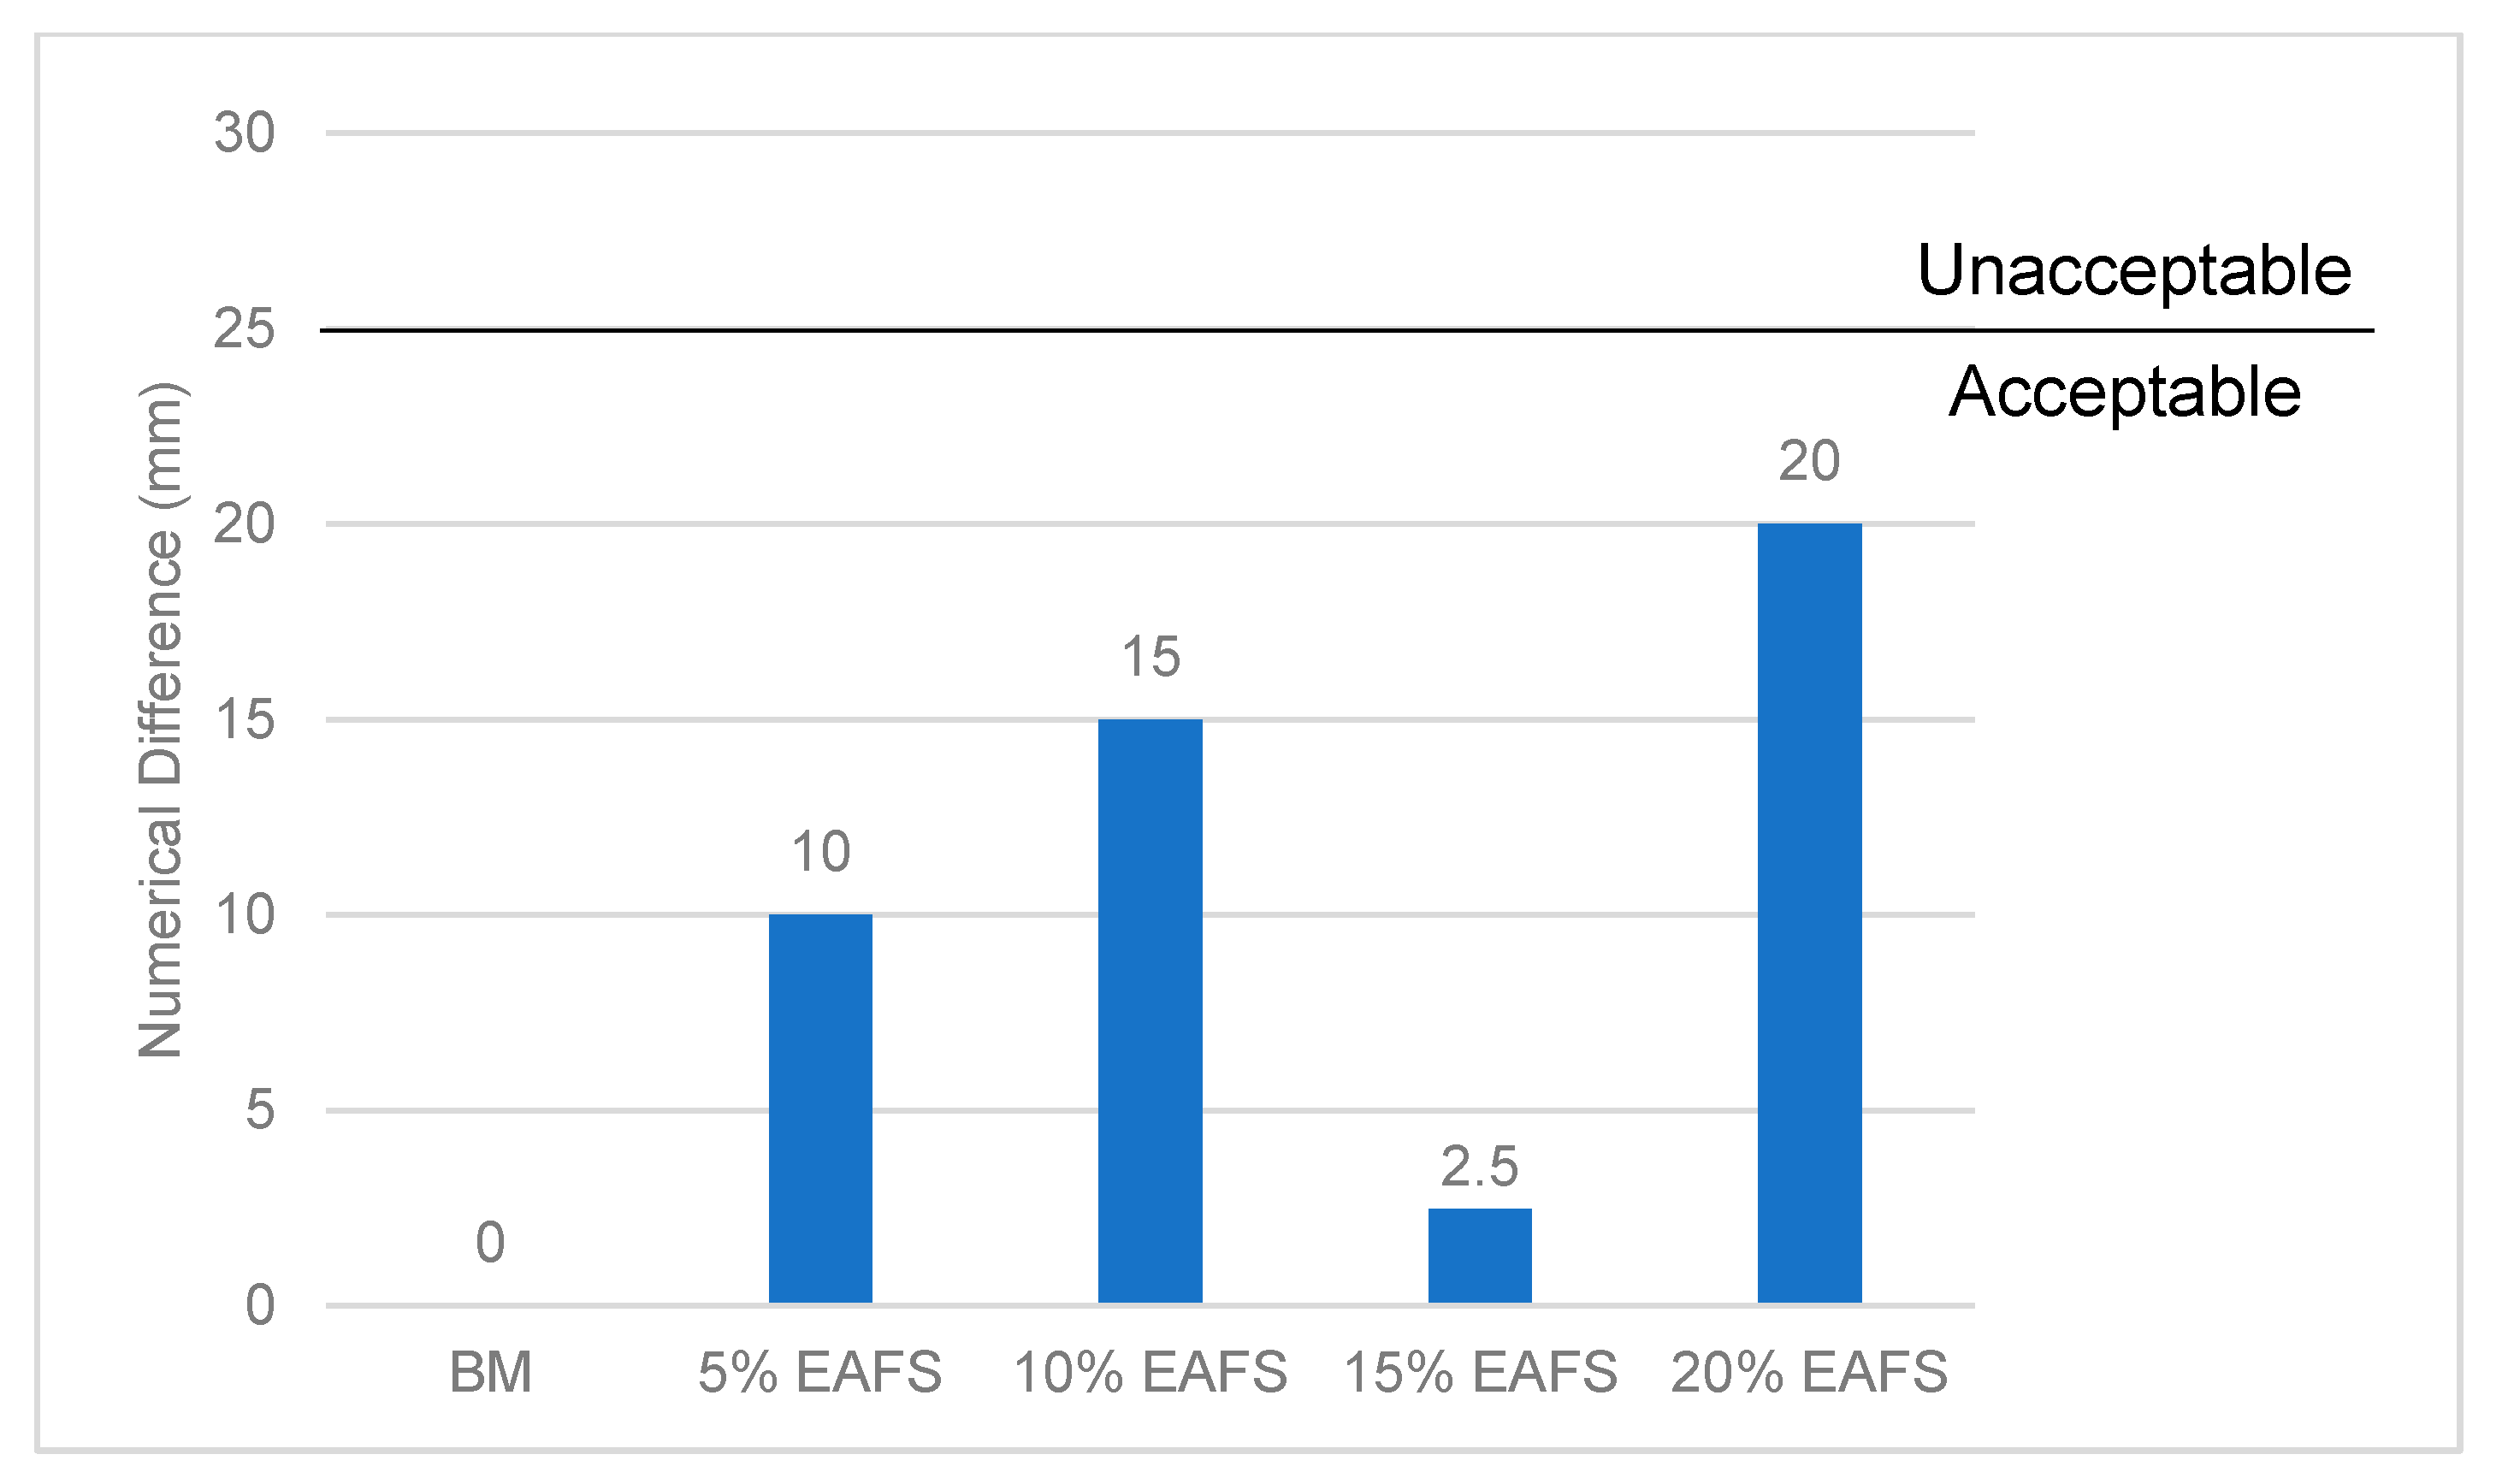
The average diameters for the J-Ring flow and slump flow for samples containing varying doses of EAFS are shown in Figure 11. As shown in the figure, introducing EAFS showed no adverse effects on the flow-ability of the SCC, which means that it will not be subject to any significant segregation. All trials containing EAFS can be considered. Figure 12 shows the numerical difference between the J-Ring flow and slump flow for each of the trials. All doses of EAFS met both requirements of average diameter and numerical difference as stated in ASTM C1621 and are therefore considered successful.
Introducing EAFS had no effect on the flow-ability of the SCC. All samples of SCC had ideal flow-ability as their H2/H1 ratio was 1.0. This, along with the J-Ring test results, show that introducing EAFS to a benchmark SCC mix at these doses does not undermine its rheological properties.
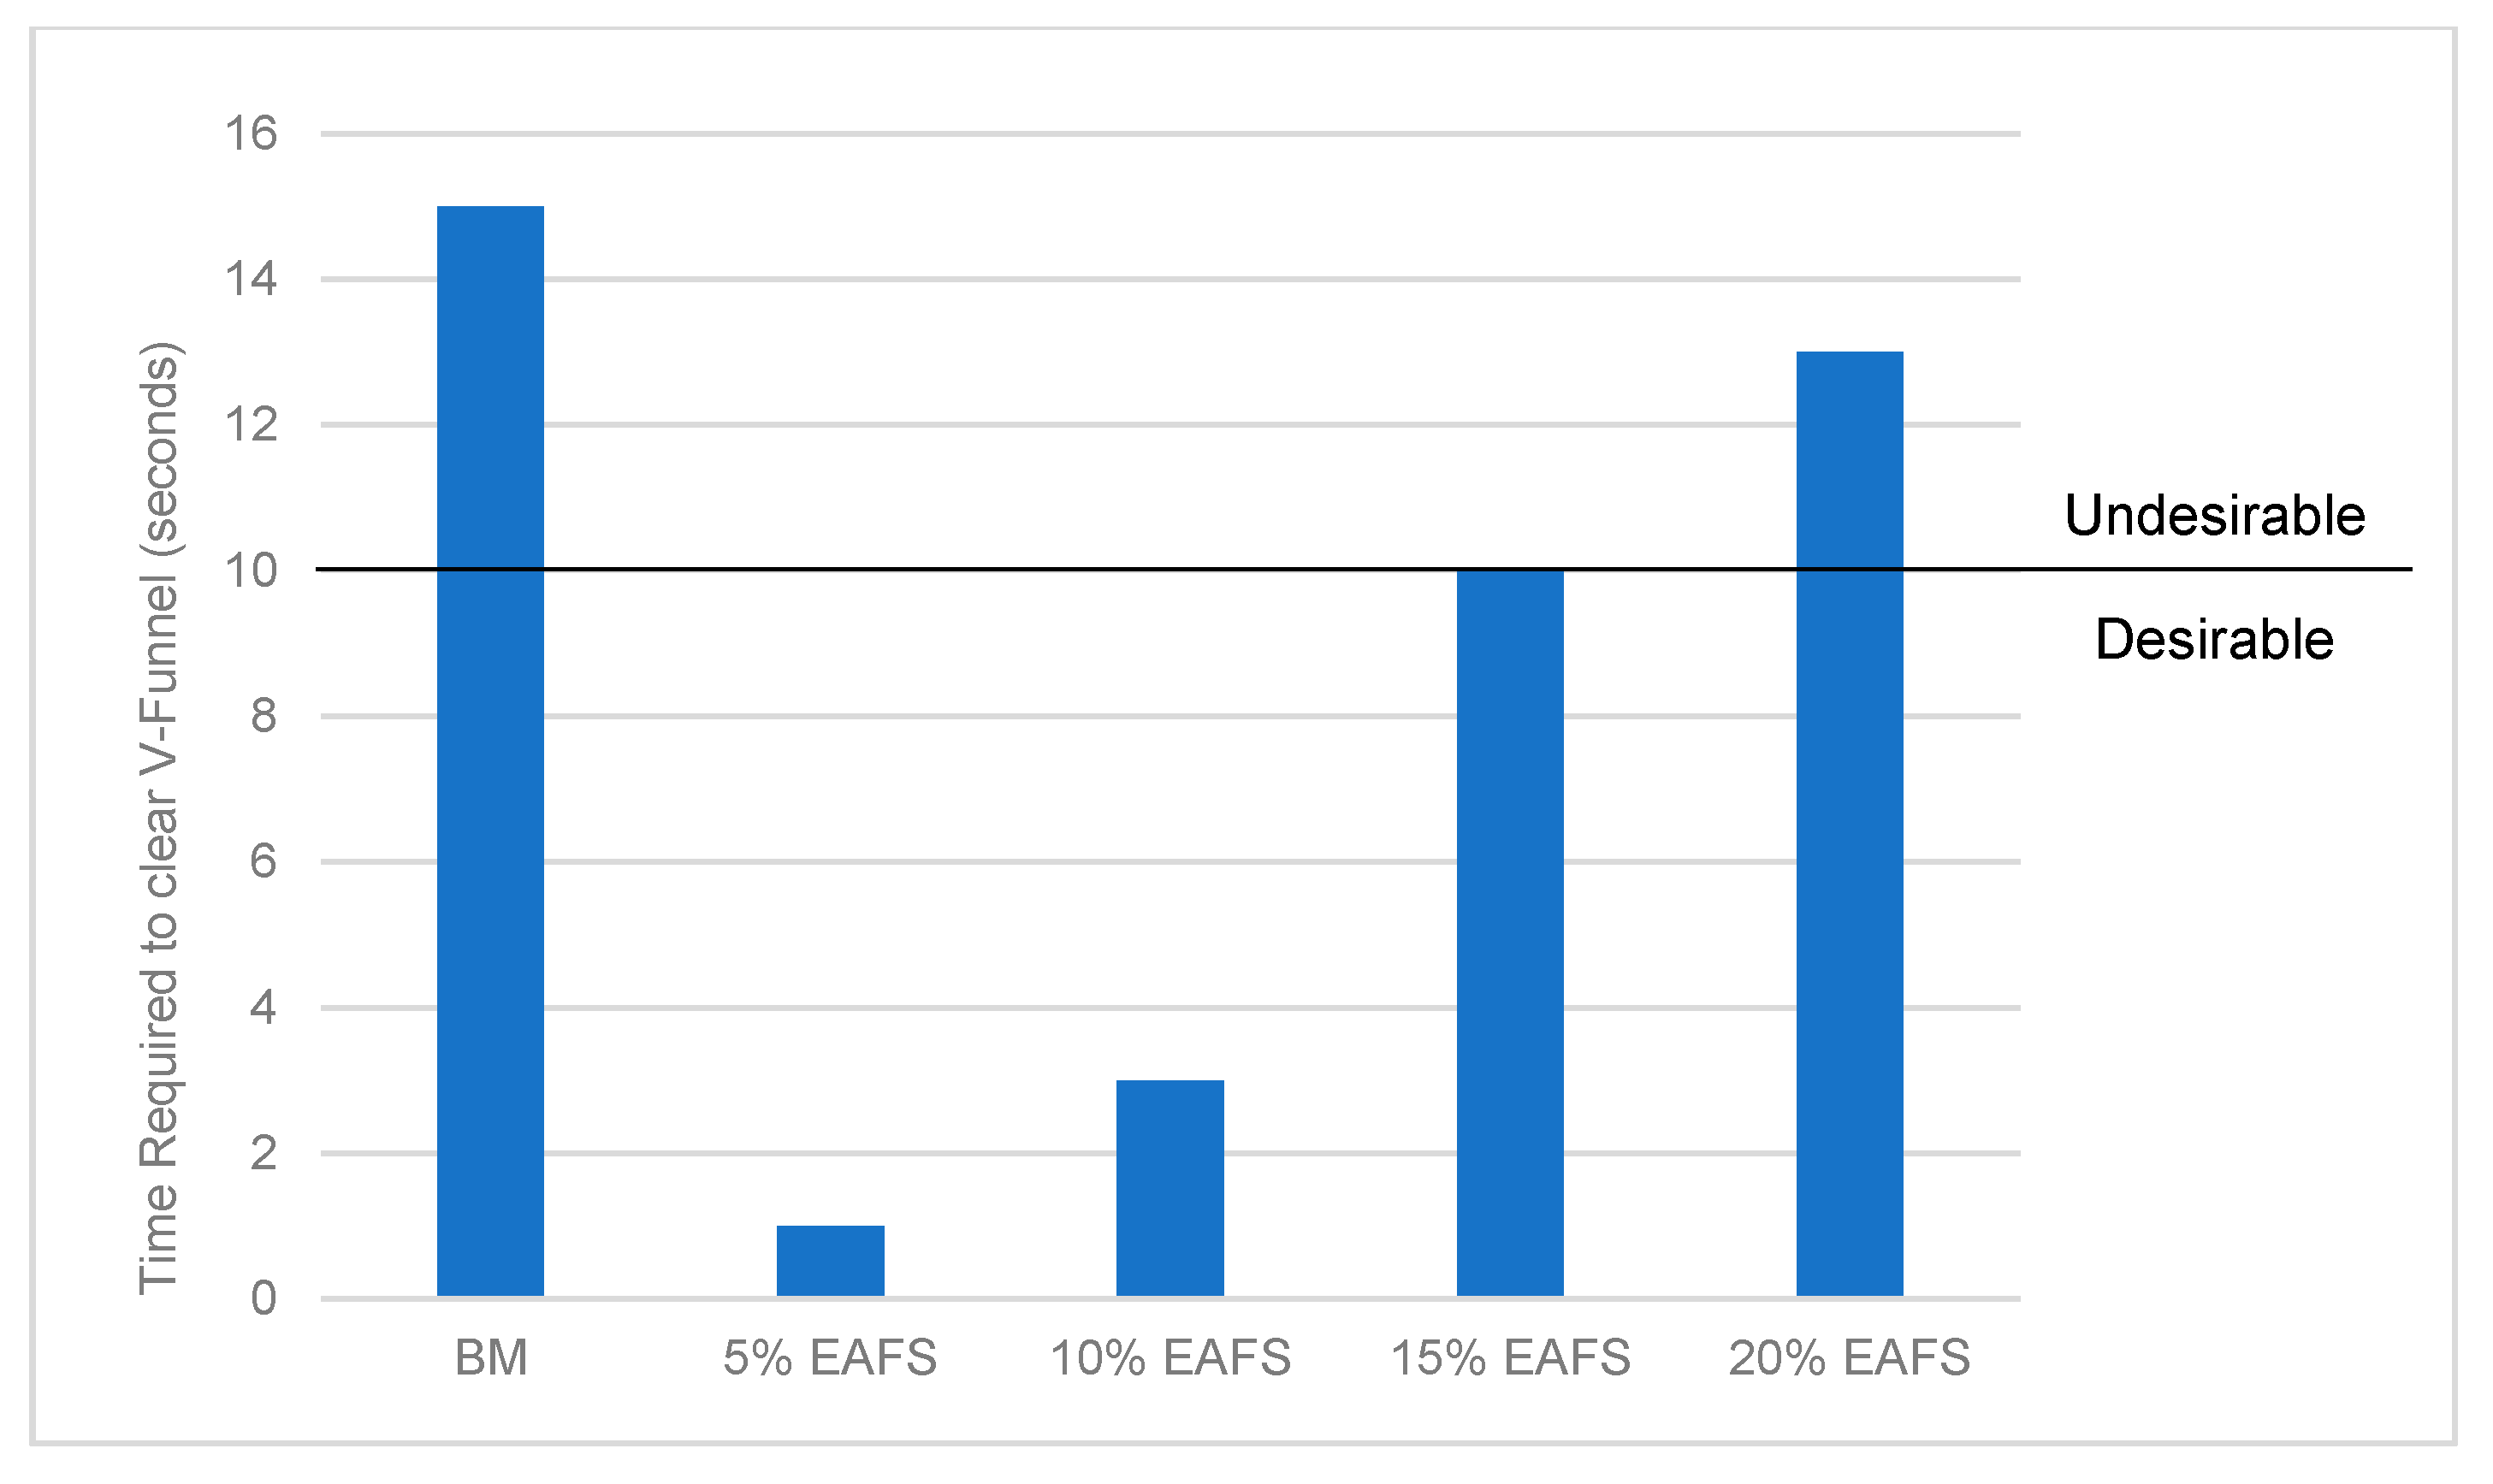
Figure 13 shows the time it takes for samples containing different doses of EAFS to pass through a V-Funnel. It is clear that adding EAFS to a benchmark SCC mix significantly decreases its viscosity. A small dose of EAFS reduced the time required to clear the V-Funnel to 1 s, compared to 15 s for the benchmark SCC mix. All doses up to and including 15% EAFS were at or under the maximum desirable time stated in BS EN 12350-9 [18]. The results from this test shows a strong correlation between the EAFS content in a sample of SCC and its viscosity. The results of the 5, 10, and 15% replacements stand at odds with the findings of another study, which stated that the incorporation of EAFS would significantly increase the viscosity of the SCC mix [10].

3.2.2. Compressive Strength

The following figures show the variation of compressive strength of SCC samples containing EAFS with time. Multiple samples were tested at different intervals ranging between 3 and 56 days, with the average compressive strength being reported.
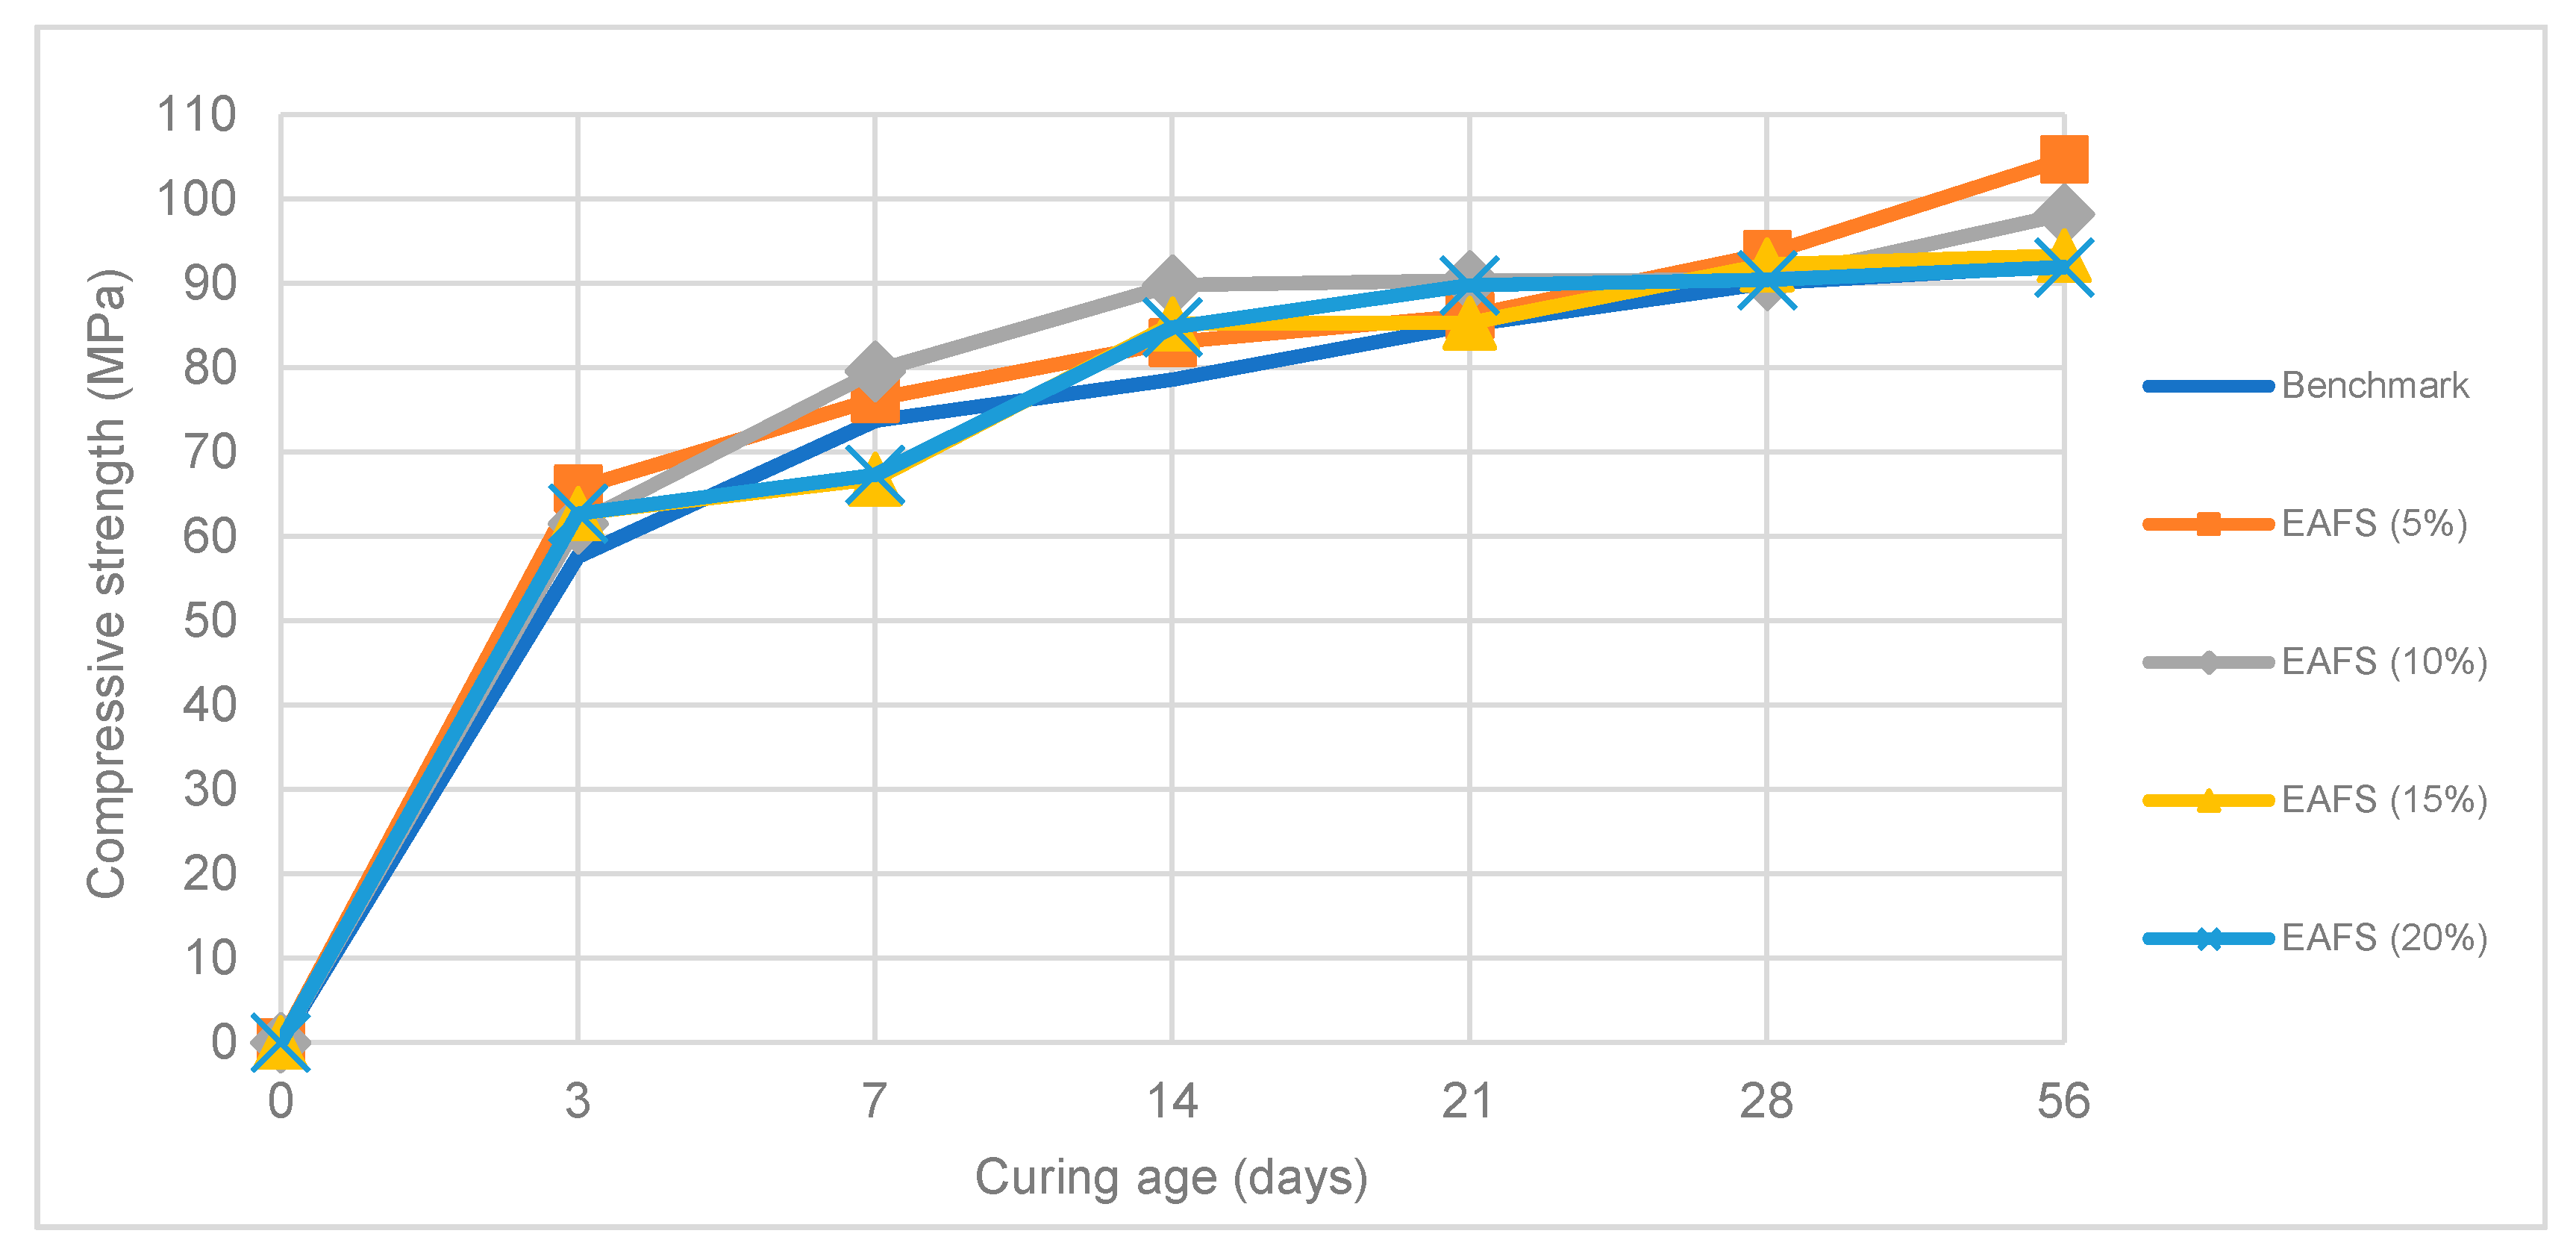
Figure 14 shows how the compressive strength of SCC samples containing various doses of EAFS varies with curing age. As shown in the figure, the introduction of EAFS at low doses (5% and 10%) into the benchmark SCC mix improves the compressive strength of the SCC at any age, and increased its 56-day compressive strength considerably from 92.1 MPa to 104.7 MPa and 98.2 MPa, respectively. The introduction of EAFS at higher doses (15% and 20%) showed almost identical compressive strength results to each other with minor variations; both doses initially had a slower strength gain rate compared to the benchmark SCC mix. The EAFS mixes had a maximum standard deviation of 2.70 MPa and a maximum variance coefficient of 2.75%.

3.3. Development of Hybrid Mixes

With the results of each individual additive at hand, hybrid SCC mixes using optimum doses of CWCA, CWFA, CWP, and EAFS were developed. In total, three hybrid mixes were put forward and tested for their rheological properties as well as their compressive strength. The testing matrix showing the content of the hybrid mixes is shown in Table 4.

3.3.1. Rheological Properties

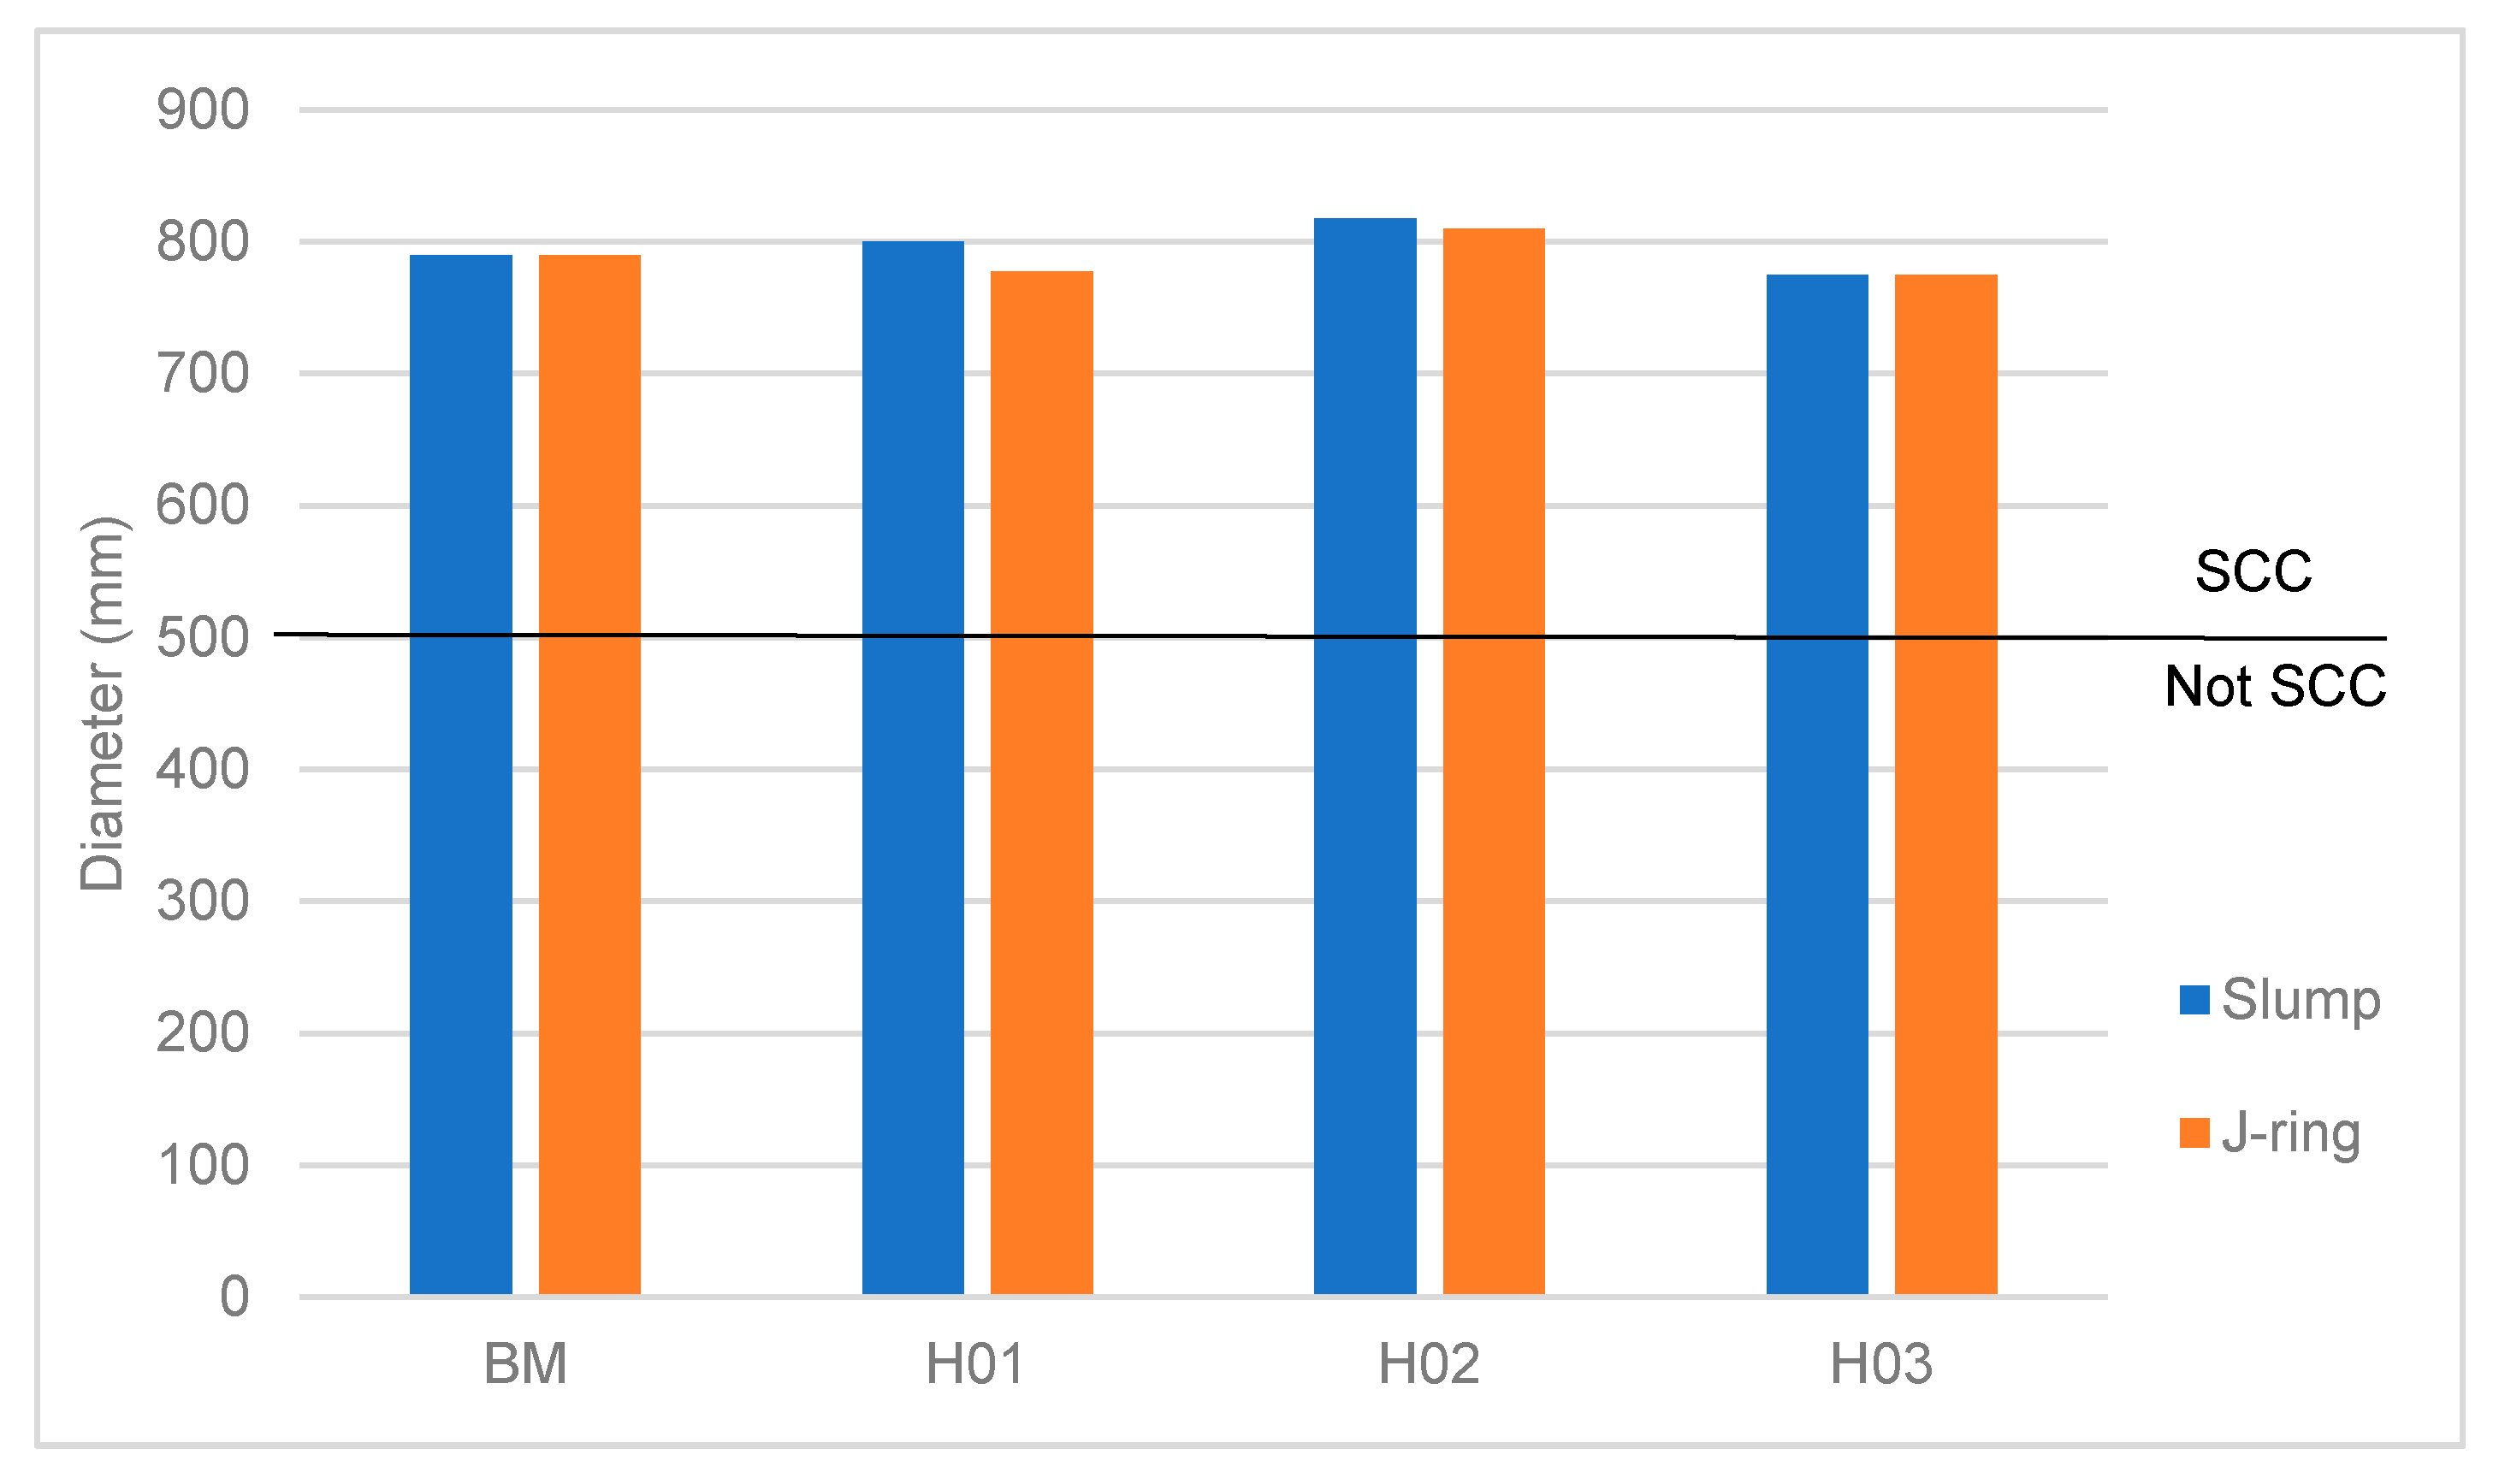
Figure 15 shows the average diameter for the J-Ring flow and slump flow for the hybrid mixes. As shown in the figure, all hybrid mixes had the minimum diameter to be initially considered SCC. Figure 16 shows the numerical difference between the J-Ring flow and slump flow for each trial. All hybrid mixes met both requirements of average diameter and numerical difference as stated in ASTM C162.
The hybrid mixes had no effect on the flow-ability of the SCC. All samples of SCC had ideal flow-ability as their H2/H1 ratio was 1.0. This, along with the J-Ring test results, show that the hybridization of the benchmark mix in all hybrid mixes was done correctly, as the benchmark SCC’s fresh properties were not compromised.
Figure 17 shows the time it takes for the hybrid SCC samples to pass through a V-Funnel. It is clear that all hybrid mixes reduced the viscosity of the SCC, which is shown in the significant drop in time required to clear the V-Funnel. H02 had the best results (6 s) whereas H01 and H03 had similar results (8 s). All hybrid samples showed desirable viscosity.

3.3.2. Compressive Strength

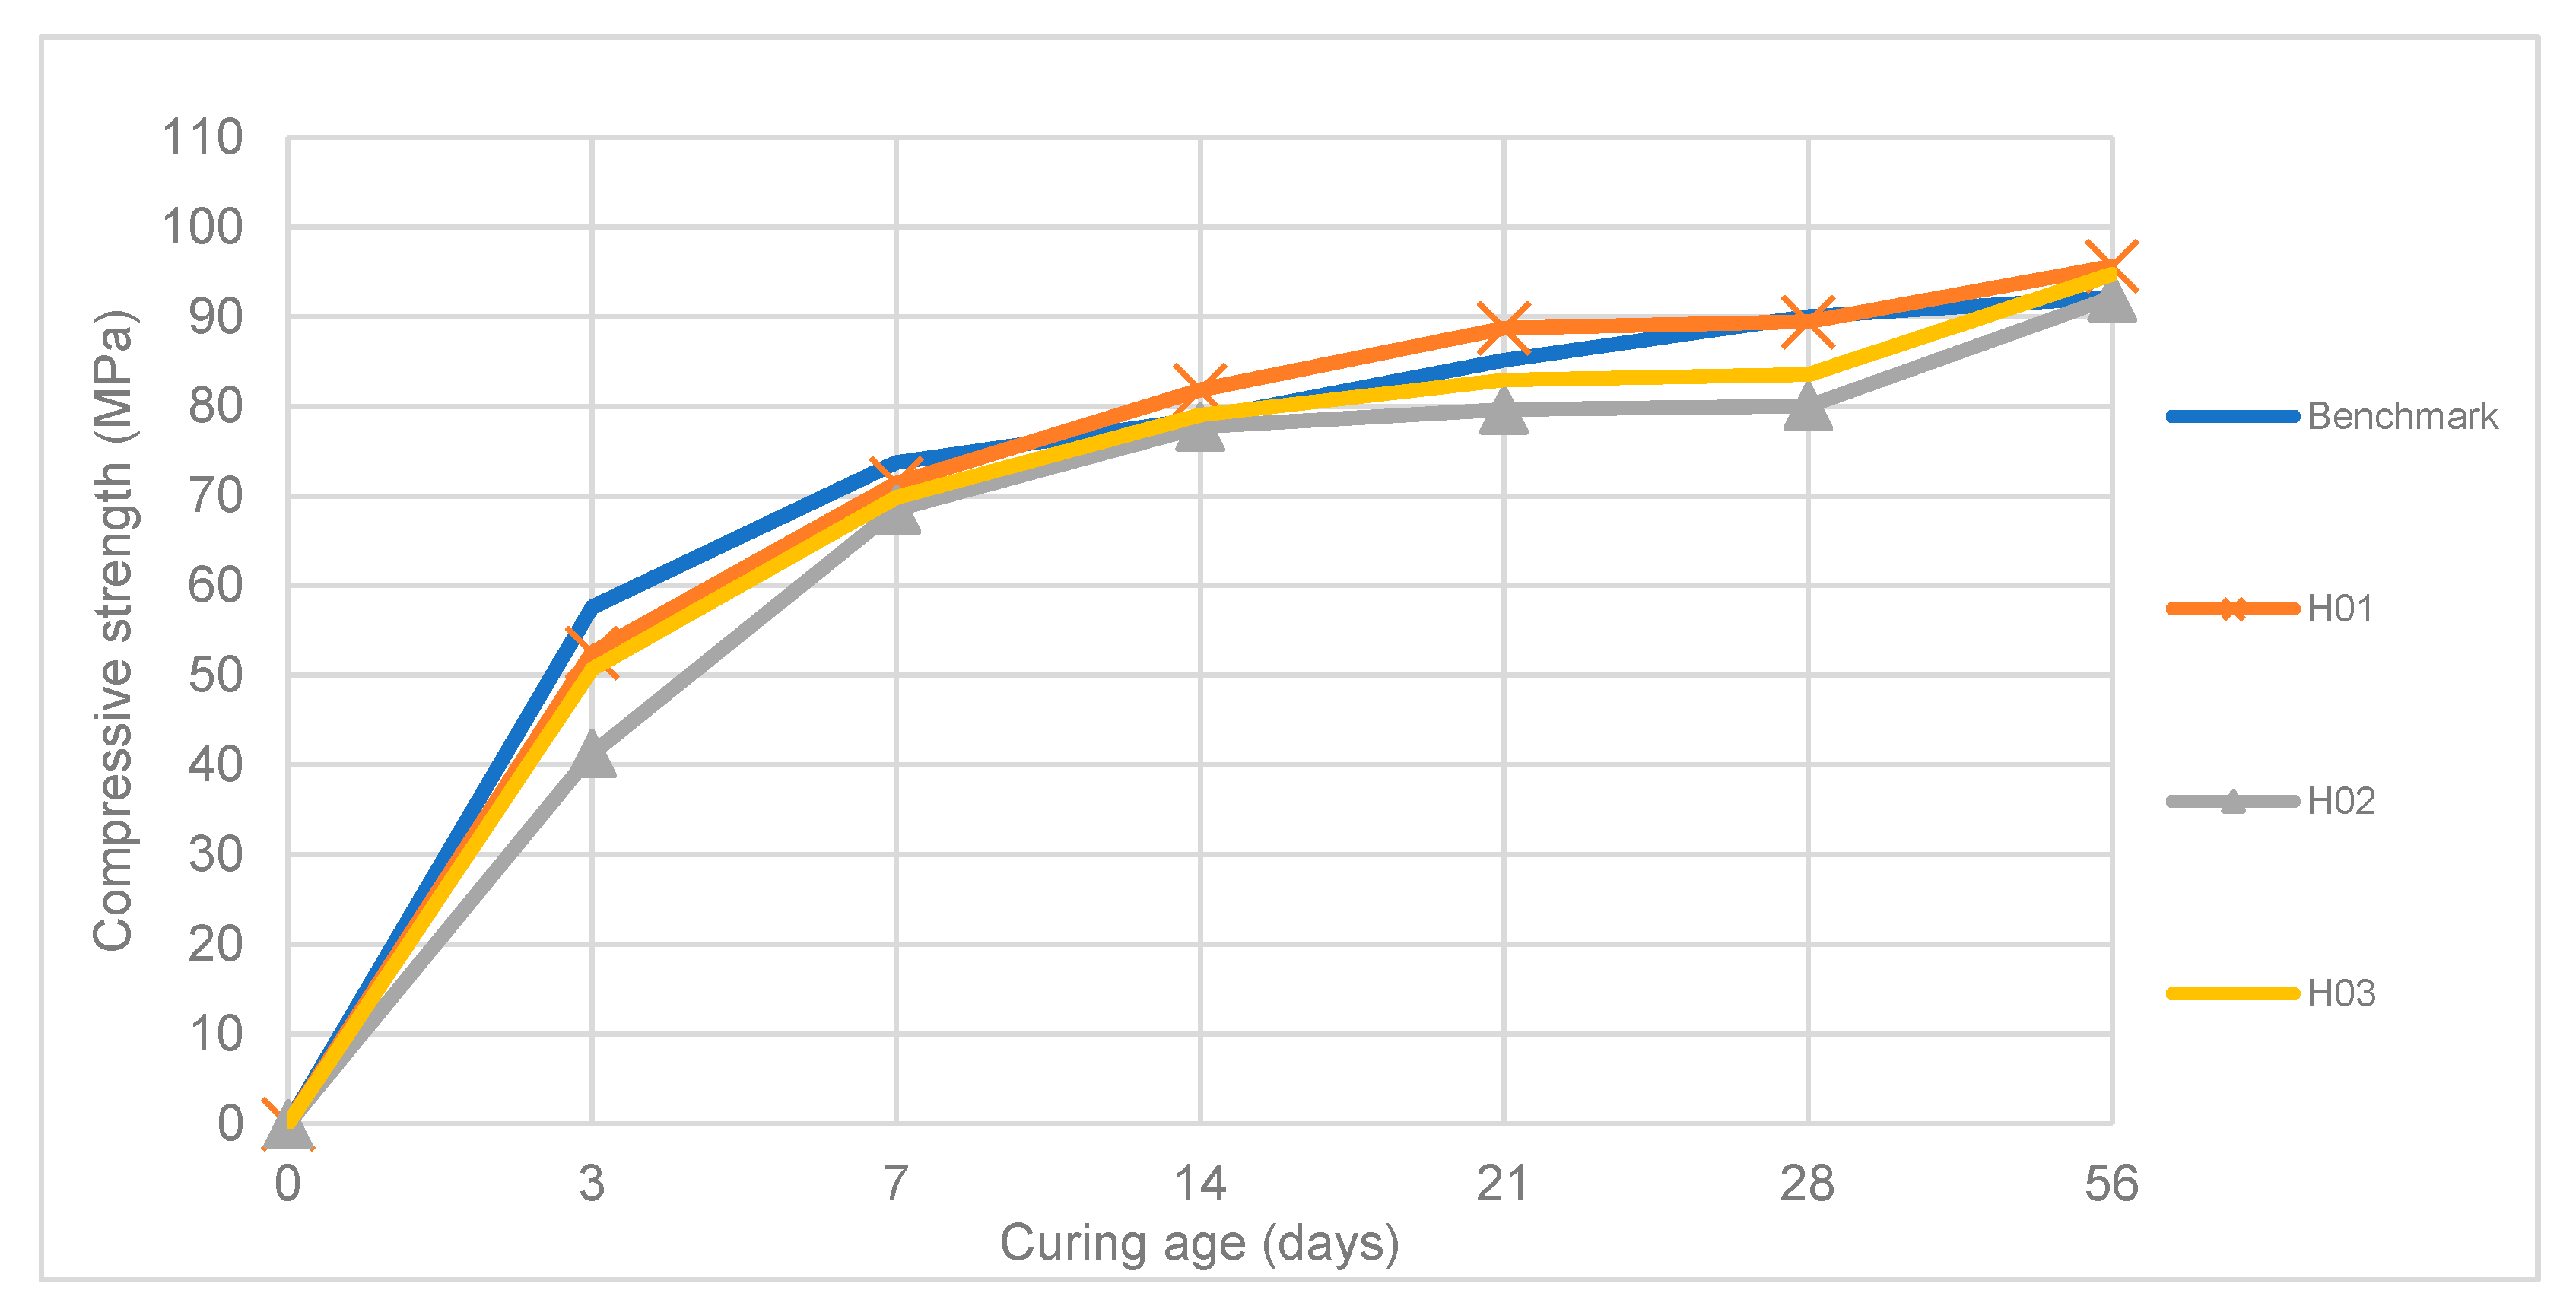
The variation of the hybrid SCC samples’ compressive strength with curing age is shown in Figure 18. Multiple samples were tested at different intervals ranging between 3 and 56 days, with the average compressive strength being reported. At 3 and 7 days of curing, the hybrid mixes had a lower compressive strength compared to the benchmark SCC mix. Afterwards, H01 began to overtake the benchmark SCC mix and continued to do so until 56 days. Meanwhile, H02 and H03 exhibited similar trends (compressive strength and rate of strength gain) to each other. H02 met the benchmark SCC mix’s final compressive strength while H01 and H03 exceeded it, with the final compressive strengths being 95.6, 92.1, and 94.7 MPa for H01, H02, and H03, respectively. The hybrid mixes had a maximum standard deviation of 4.20 MPa and a maximum variance coefficient of 5.25%.

4. Conclusions

Upon close examination of the results of this study, it is clear that waste materials from Kuwait can be repurposed to yield viable construction materials that can replace conventional construction materials to produce high-strength SCC concrete. CWCA was found to be a viable replacement of 4.75 mm used in a benchmark SCC concrete, though its introduction may have subjected the SCC to a slight increase in risk of segregation and viscosity. CWFA used at either a high (20%) or low (5%) dose was shown to greatly improve the SCC’s viscosity to make it more desirable. The CWP investigations were useful, showing that its introduction had no negative impact on the SCC’s rheological properties. However, it was found that CWP’s introduction at low doses (5% and 10%) can negatively impact the SCC’s compressive strength but its introduction at higher doses (20% and 30%) as a replacement of cement in mortar cubes shows that it can match and exceed the control sample, indicating its feasibility as a sustainable cement replacement. Introducing EAFS to a benchmark SCC mix at the doses put forward in this study had no adverse effects on its rheological properties or its compressive strength whatsoever. The findings for SCC with EAFS stand in disagreement with the outcomes of previous studies. Based on these results, three hybrid mixes were devised using optimum doses of each replacement material, and it was shown that a high-strength SCC concrete can be produced using these waste materials as a partial replacement of conventional materials that can at least match a benchmark SCC concrete mix’s properties, if not improve them.

Author Contributions

Conceptualization, S.M.S.; methodology, S.M.S., A.R.A., A.J. and A.M.; formal analysis, S.M.S., and A.R.A.; investigation, A.J. and A.M.; resources, S.M.S. and A.R.A.; writing—original draft preparation, A.R.A.; writing—review and editing, A.R.A. and S.M.S.; supervision, S.M.S.; project administration, A.R.A.; funding acquisition, S.M.S. All authors have read and agreed to the published version of the manuscript.

Funding

This project was funded “partially” by Kuwait Foundation for the Advancement of Sciences under project code: PN18-15EV-01.

Acknowledgments

The authors would like to acknowledge Tahir Afrasiab, Ali Behbehani, Najem Al-Matroud, and Sarah Al-Muhanna for their contributions and hard work and dedication while preparing the concrete mixes for this study. The authors would also like to express their gratitude to United Steel Industrial Company for providing their waste electric-arc furnace slag and to Gulf Shores Company for Sanitary Wares and Construction Building Materials for providing their waste glazed ceramics for use in this project. The authors are grateful to Combined Group Contracting Co. for providing the team with the concrete materials and to Sika for providing the team with the superplasticizer used in the study.

Conflicts of Interest

The authors declare no conflict of interest.

References

  1. Medina, C.; De Rojas, M.S.; Frías, M.; De Rojas, M.I.S. Reuse of sanitary ceramic wastes as coarse aggregate in eco-efficient concretes. Cem. Concr. Compos. 2012, 34, 48–54. [Google Scholar] [CrossRef]
  2. Halicka, A.; Ogrodnik, P.; Zegardlo, B. Using ceramic sanitary ware waste as concrete aggregate. Constr. Build. Mater. 2013, 48, 295–305. [Google Scholar] [CrossRef]
  3. Skaf, M.; Manso, J.; Aragón, A.; Fuente-Alonso, J.A.; Ortega-López, V. EAF slag in asphalt mixes: A brief review of its possible re-use. Resour. Conserv. Recycl. 2017, 120, 176–185. [Google Scholar] [CrossRef]
  4. Australasian (Iron & Steel) Slag Association. Electric Arc Furnace Slag. Available online: http://www.asa-inc.org.au/products/electric-arc-furnace-slag (accessed on 31 July 2019).
  5. Valdés, A.J.; Martínez, C.M.; Guerra-Romero, M.I.; García, B.L.; Del Pozo, J.M.; Vegas, A.T. Re-use of construction and demolition residues and industrial wastes for the elaboration or recycled eco-efficient concretes. Span. J. Agric. Res. 2010, 8, 25. [Google Scholar] [CrossRef]
  6. Anderson, D.J.; Smith, S.T.; Au, F.T. Mechanical properties of concrete utilising waste ceramic as coarse aggregate. Constr. Build. Mater. 2016, 117, 20–28. [Google Scholar] [CrossRef]
  7. Senthamarai, R.; Manoharan, P.D. Concrete with ceramic waste aggregate. Cem. Concr. Compos. 2005, 27, 910–913. [Google Scholar] [CrossRef]
  8. Dhir, R.K.; de Brito, J.; Silva, R.V.; Lye, C.Q. Woodhead Publishing Series in Civil and Structural Engineering. In Sustainable Construction Materials: Recycled Aggregates; Woodhead Publishing: Kidlington, UK, 2019. [Google Scholar] [CrossRef]
  9. Arulsivanantham, P.; Gokulan, R. A Review on Self Compacting Concrete. Int. J. ChemTech Res. 2017, 10–11, 62–68. Available online: http://sphinxsai.com/2017/ch_vol10_no11/1/(62-68)V10N11CT.pdf (accessed on 10 October 2019).
  10. Sosa, I.; Thomas, C.; Polanco, J.A.; Setién, J.; Tamayo, P. High Performance Self-Compacting Concrete with Electric Arc Furnace Slag Aggregate and Cupola Slag Powder. Appl. Sci. 2020, 10, 773. [Google Scholar] [CrossRef] [Green Version]
  11. Tamayo, P.; Pacheco, J.; Thomas, C.; De Brito, J.; Rico, J. Mechanical and durability properties of concrete with coarse recycled aggregate produced with electric arc furnace slag concrete. Appl. Sci. 2020, 10, 216. [Google Scholar] [CrossRef] [Green Version]
  12. Abu-Eishah, S.I.; El-Dieb, A.S.; Bedir, M.S. Performance of concrete mixtures made with electric arc furnace (EAF) steel slag aggregate produced in the Arabian Gulf region. Constr. Build. Mater. 2012, 34, 249–256. [Google Scholar] [CrossRef]
  13. Awoyera, P.O.; Ndambuki, J.M.; Akinmusuru, J.O.; Omole, D. Characterization of ceramic waste aggregate concrete. HBRC J. 2018, 14, 282–287. [Google Scholar] [CrossRef] [Green Version]
  14. De Schutter, G.; Bartos, P.; Domone, P.; Gibbs, J.; Gibbs, R. Self-Compacting Concrete; CRC Press: Caithness, UK; Taylor & Francis Group: Boca Roton, FL, USA, 2008; pp. 3–11. ISBN 978-1904445-30-2. [Google Scholar]
  15. Goal 11: Sustainable Development Knowledge Platform. 2020. Sustainabledevelopment.Un.Org. Available online: https://sustainabledevelopment.un.org/sdg11 (accessed on 2 January 2020).
  16. British Standards Institution. BS EN 12350-10:2010: Testing Fresh Concrete. Self-Compacting Concrete. L Box Test. 1998. Available online: http://www.standardsuk.com (accessed on 31 July 2019).
  17. ASTM C1621/C1621M-17. Standard Test Method for Passing Ability of Self-Consolidating Concrete by J-Ring; ASTM International: West Conshohocken, PA, USA, 2017. [Google Scholar] [CrossRef]
  18. British Standards Institution. BS EN 12350-9:2010: Testing Fresh Concrete. Self-Compacting Concrete. V Funnel Test. 1998. Available online: http://www.standardsuk.com (accessed on 31 July 2019).
  19. ASTM C1231/C1231M-15. Standard Practice for Use of Unbonded Caps in Determination of Compressive Strength of Hardened Cylindrical Concrete Specimens; ASTM International: West Conshohocken, PA, USA, 2015. [Google Scholar] [CrossRef]
  20. ASTM C617/C617M-15. Standard Practice for Capping Cylindrical Concrete Specimens; ASTM International: West Conshohocken, PA, USA, 2015. [Google Scholar] [CrossRef]
  21. ASTM C127/C127M-15. Standard Test Method for Relative Density (Specific Gravity) and Absorption of Coarse Aggregate; ASTM International: West Conshohocken, PA, USA, 2015. [Google Scholar] [CrossRef]
  22. ASTM C128/C128M-15. Standard Test Method for Relative Density (Specific Gravity) and Absorption of Fine Aggregate; ASTM International: West Conshohocken, PA, USA, 2015. [Google Scholar] [CrossRef]
  23. ASTM C184-94e1. Standard Test Method for Fineness of Hydraulic Cement by the 150-μm (No. 100) and 75-μm (No. 200) Sieves; ASTM International: West Conshohocken, PA, USA, 1994. [Google Scholar] [CrossRef]
  24. ASTM C1240-20. Standard Specification for Silica Fume Used in Cementitious Mixtures; ASTM International: West Conshohocken, PA, USA, 2020. [Google Scholar] [CrossRef]
  25. ASTM C109/C109M-16a. Standard Test Method for Compressive Strength of Hydraulic Cement Mortars (Using 2-in. or [50-mm] Cube Specimens); ASTM International: West Conshohocken, PA, USA, 2016. [Google Scholar] [CrossRef]
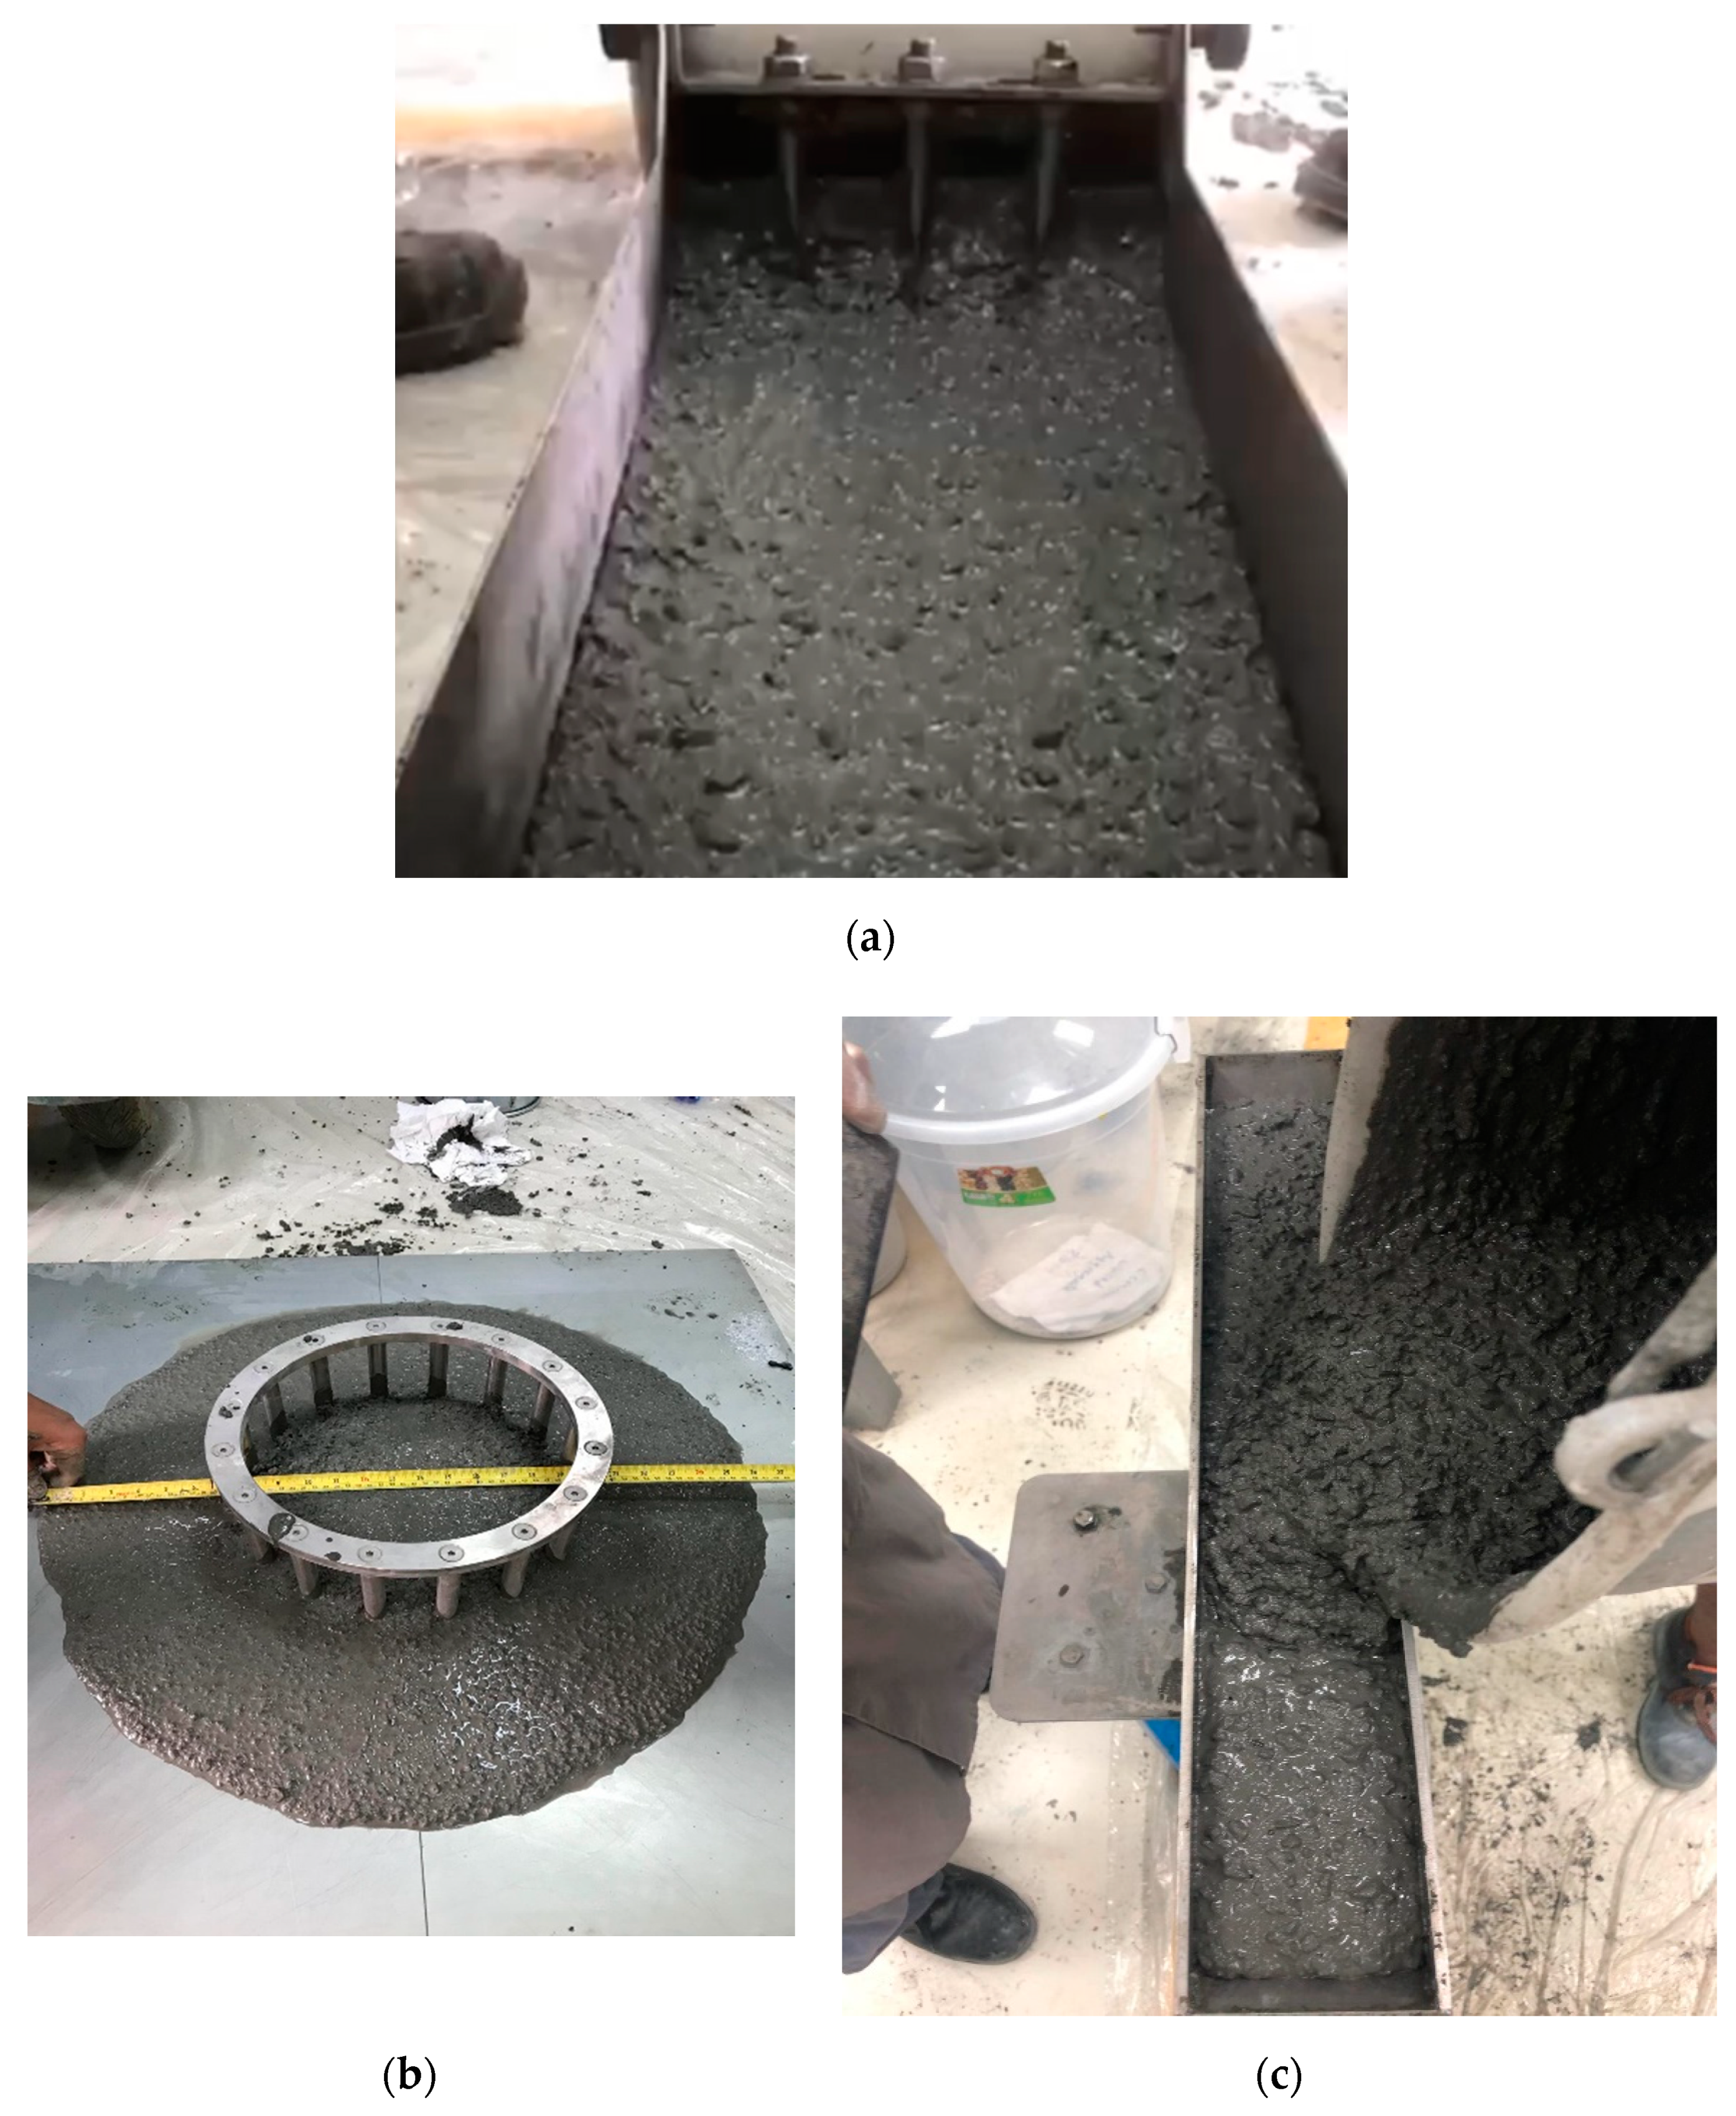
Figure 1. Photographs showing the tests performed on fresh self-consolidating concrete (SCC) samples: (a) Fresh SCC flowing through the L-Box; (b) Measuring the fresh SCC’s spread during the J-Ring test; (c) Filling the V-Funnel to measure viscosity.
Applsci 10 04844 g001
Figure 2. Photographs showing the tests performed on hardened SCC samples: (a) Tested SCC samples; (b) Sample being tested for its compressive strength; (c) Sulfur-capped samples ready to be tested.
Applsci 10 04844 g002
Figure 3. Results of the J-Ring flow and slump flow for SCC samples containing varying doses of ceramic waste coarse aggregate (CWCA), ceramic waste fine aggregate (CWFA), and ceramic waste powder (CWP).
Applsci 10 04844 g003
Figure 4. Numerical difference of the J-Ring flow and slump flow for SCC samples containing varying doses of CWCA, CWFA, and CWP.
Applsci 10 04844 g004
Figure 5. Ratio of H2/H1 obtained from the L-Box Test results for SCC samples containing varying dosages of CWCA, CWFA, and CWP.
Applsci 10 04844 g005
Figure 6. The time taken for SCC samples containing varying doses of CWCA, CWFA, and CWP to pass through a V-Funnel.
Applsci 10 04844 g006
Figure 7. Compressive strength variation of samples containing various doses of CWCA.
Applsci 10 04844 g007
Figure 8. Compressive strength variation of samples containing various doses of CWFA.
Applsci 10 04844 g008
Figure 9. Compressive strength variation of samples containing various doses of CWP.
Applsci 10 04844 g009
Figure 10. Variation of compressive strength of hydraulic cement for samples containing various dosages of CWP compared to a plain mortar mix.
Applsci 10 04844 g010
Figure 11. Results of the J-Ring flow and slump flow for SCC samples containing varying doses of EAFS.
Applsci 10 04844 g011
Figure 12. Numerical difference of the J-Ring flow and slump flow for SCC samples containing varying doses of EAFS.
Applsci 10 04844 g012
Figure 13. The time taken for SCC samples containing varying doses of EAFS to pass through a V-Funnel.
Applsci 10 04844 g013
Figure 14. Variation of compressive strength for samples containing various dosages of EAFS compared to the benchmark SCC mix.
Applsci 10 04844 g014
Figure 15. Results of the J-Ring flow and slump flow for hybrid SCC samples.
Applsci 10 04844 g015
Figure 16. Numerical difference of the J-Ring flow and slump flow for hybrid SCC samples.
Applsci 10 04844 g016
Figure 17. The time taken for hybrid SCC samples to pass through a V-Funnel.
Applsci 10 04844 g017
Figure 18. Compressive strength variation of hybrid SCC samples.
Applsci 10 04844 g018
Table 1. Physical properties of ceramic additives.
SymbolPropertyValue
CWCA
ρ looseBulk Density – Loose (kg/m3)1295
ρ compactedBulk Density – Compacted (kg/m3)1434
Gs apparentSpecific Gravity – Apparent2.401
Gs SSDSpecific Gravity – SSD2.421
Gs bulkSpecific Gravity – Bulk2.450
-Water Absorption (%wt)0.84
CWFA
-Water Absorption (%wt)1.17
CWP
-Water Absorption (%wt)0.08
FFineness (%)100
Table 2. Physical properties of Self-consolidating concrete (EAFS).
SymbolPropertyValue
ρ looseBulk Density – Loose (kg/m3)1750
ρ compactedBulk Density – Compacted (kg/m3)1902
Gs apparentSpecific Gravity – Apparent3.502
Gs SSDSpecific Gravity – SSD3.550
Gs bulkSpecific Gravity – Bulk3.629
-Water Absorption (%wt)0.853
Table 3. Mix design proportions of benchmark SCC Mix.
MaterialQuantity
Cement (kg/m3)550
Sand (kg/m3)600
Coarse aggregates – 9.5 mm (kg/m3)360
Coarse aggregates – 4.75 mm (kg/m3)720
Water (kg/m3)169
Silica fume (kg/m3)40
Fly ash (kg/m3)60
SIKA® ViscoCrete®-5070 (l)2.2
Water/cement ratio0.26
Water/binder ratio0.32
Table 4. Testing matrix for the hybrid mixes used in the study.
Replacement Material *Hybrid mix 1 (H01)Hybrid mix 2 (H02)Hybrid mix 3 (H03)
CWCA (replacing 4.75 mm CA)0100
CWFA (replacing sand)1000
CWP (replacing cement)005
EAFS (replacing 9.5 mm CA)5105
* Values cited are the percentage replacement of conventional concrete materials shown in parentheses.