Abstract
A zero-drift, mid–wave infrared (MWIR) thermometer constructed using a chopper stabilised operational amplifier (op-amp) was compared against an identical thermometer that utilised a precision op-amp. The chopper stabilised op-amp resulted in a zero-drift infrared radiation thermometer (IRT) with approximately 75% lower offset voltage, 50% lower voltage noise and less susceptibility to perturbation by external sources. This was in comparison to the precision op-amp IRT when blanked by a cover at ambient temperature. Significantly, the zero-drift IRT demonstrated improved linearity for the measurement of target temperatures between 20 °C and 70 °C compared to the precision IRT. This eases the IRT calibration procedure, leading to improvement in the tolerance of the temperature measurement of such low target temperatures. The zero-drift IRT was demonstrated to measure a target temperature of 40 °C with a reduction in the root mean square (RMS) noise from 5 K to 1 K compared to the precision IRT.
1. Introduction
Non-contact temperature measurements, acquired from processes using infrared radiation thermometers (IRTs), afford advantages over contact temperature measurements. These include amelioration of the susceptibility of thermocouple wires to degradation from exposure to the measurement conditions and the effects of contact upon the measurand and object [1,2]. Thermocouples afford a wide range of temperature measurements, typically having the capability of continuous measurement from zero to many hundreds of degrees Celsius [1]; a capability that would need to be replicated by IRT based thermocouple replacements. IRTs that use mid-wave infrared (MWIR) detectors can be deployed in various applications that need the capability to measure lower temperatures, for example, measurement of temperatures below 100 °C. Mercury Cadmium Telluride (MCT) photon detectors have been used in low-temperature IRTs but require thermoelectric cooling to reduce their dark current and Johnson noise, whilst increasing their photosensitivity to enable the measurement to be acquired [3]. Cooling a photon detector increases the cost and size of IRTs, making their usage undesirable, particularly within size-constrained instrumentation [4]. Thermal detectors, such as thermopiles, can measure over this spectral range, however, they suffer from slow response time and low sensitivity compared to photon detectors [1]. Thermal detectors require high gain amplification to achieve output voltages that can be measured with benchtop instrumentation and can only represent, accurately, signals that change slowly, as demonstrated by Moisello et al. [5]. Both MCT and thermal detector technologies incur drift that increases the measurement uncertainty and introduces non-linearity. Variation of voltage offset with IRT ambient temperature is of particular concern when using uncooled detectors [6]. A mechanical chopper, or shutter, can be used to overcome drift within IRTs to improve their stability [7,8] but at the expense of increasing the overall instrument cost and size. In addition, IRTs incorporating mechanical chopping also need detectors with lower shunt capacitance. This enables them to keep up with the chopper which, presumably, is higher frequency than any measurement expected of the IRT.
Typically, IRTs that use photodiodes also utilise a transimpedance amplifier (TIA) to provide a measurable voltage from the photocurrent generated. MWIR photodiodes generate small magnitude photocurrents when exposed to low radiant flux, which requires a high transimpedance to generate a measurable signal from the TIA. This dictates the need for op-amps with low noise and input voltage offset to be used in the TIA to afford the measurement of low temperatures with low uncertainty. Manufacturers offer ‘precision’ op-amps that have low magnitudes of input voltage offset, input current bias, noise and temperature-induced zero offset drift. Precision op-amps are often used in amplifier circuits to achieve precision measurements from low magnitude signals [9,10,11]. Similarly, low magnitude voltages to those arising from MWIR photodiodes but arising from physiological, micro-electro-mechanical-systems (MEMS) sensors and thermal detectors, have been demonstrated to be measurable using high gain amplifiers that had low noise and offset [5,12,13,14,15,16].
An additional consideration is how the variation of the ambient temperature can lead to drift in the output voltage of typical TIA circuits used in IRTs, causing non–linearity in the IRT response and increased measurement uncertainty, which needs to be mitigated to allow low magnitude currents and voltages to be measured accurately [4,17,18]. These limitations in IRT characteristics have constrained the capability of MWIR thermometers to achieve low-temperature measurements with low uncertainties when using uncooled detectors, even with the use of a precision op-amp.
A particular type of op-amp that offers improved performance over a precision op-amp is the chopper stabilised or zero-drift, op-amp. Typically, chopper stabilised op-amps incur very low input offset voltage, achieving an order of magnitude lower offset voltage than precision op-amps. Equally, the temperature-related drift in this offset voltage is typically three orders of magnitude lower for chopper-stabilised op-amps compared to precision op-amps. Both precision and chopper-stabilised op-amps afford sufficiently low noise magnitude to enable small signals to be amplified to measurable magnitudes with signal-to-noise ratios greater than unity [9,10,19,20]. Chopper-stabilised op-amps modulate the input voltage with a square wave carrier signal and demodulate the resulting signal to isolate the output voltage from low-frequency noise [20]. This modulation and demodulation occur within the op-amp’s integrated circuit, using transistor switches to afford kilohertz modulation frequencies. This modulation method results, ultimately, in the very low offset voltage and offset voltage drift of the chopper stabilised op-amp output voltage [20,21,22].
Chopper-stabilised op-amps have been used for the measurement of signals within various applications, including signals from physiological potential sensors, micro-electro-mechanical systems (MEMS) gas measurement sensors and thermopiles in presence detectors. Moisello et al., Butti et al., Kim et al., Wang et al. and Han et al. have demonstrated the application of chopper stabilised amplifiers to the acquisition of measurements from sensors having low output signal magnitudes [5,13,14,15,23]. Butti et al. and Lee et al. have further demonstrated the suitability of applying chopper stabilised op-amps to the amplification of signals from low signal sensors with elevated impedance to achieve measurements with low noise and offset [23,24]. Chopper-stabilised op-amps have been demonstrated to be capable of amplifying weak sensor output voltages, of the order of microvolts, with sufficient signal to noise ratio to enable extraction of measurements [5,12,13,15,25,26]. Given the benefit provided by chopper stabilised op-amps for such applications, it would be reasonable to expect them to also offer benefits within an IRT incorporating an uncooled MWIR photodiode. Use of a chopper stabilised op-amp within such an IRT could enable the measurement of lower minimum temperatures, associated with low magnitude photocurrents generated and voltages amplified from them, without compromising the IRT response time, sensitivity, measurement uncertainty or range of the temperature measurement.
A fibreoptic coupled MWIR thermometer is presented that comprised a bootstrapped Indium Arsenide Antimony (InAsSb) photodiode connected to a novel TIA circuit that utilised a chopper stabilised op-amp. The usage of a chopper-stabilised op-amp within the TIA should afford lower input voltage offset, noise and offset voltage drift than an equivalent IRT using a precision op-amp, thereby affording lower minimum temperatures to be measured. The noise and offset voltage of the resulting ‘zero-drift’ IRT was compared to a similar MWIR thermometer comprising an identical circuit, except that the TIA used a precision op-amp. The comparison between the IRTs was used to infer whether the advantages expected from the chopper stabilised op-amp IRT was demonstrable in laboratory-based measurements. Performing analyses without any lens optics, both with and without the fibreoptic in place, enabled a direct comparison of the IRTs to be undertaken, without the uncertainties associated with optical alignment. In this work, we measure the temperature of calibrated blackbody sources in units of degree Celsius, °C. However, for subsequent analysis of instrument noise performance and resolution, we differentiate performance from a position within the temperature scale by using the different unit of kelvin, K, where 1 K = 1 °C.
2. Materials and Methods
Two IRTs were configured in order to directly compare and contrast a zero-drift IRT against a precision IRT. The InAsSb photodiode used within each IRT was an uncooled Hamamatsu P13243-011MA (Hamamatsu Photonics, Hertfordshire, UK), with a quoted specific detectivity (D*) and peak responsivity values of 1 × 109 cm∙Hz½/W and 4.5 mA/W, respectively. No additional filter was placed in front of the detector, ensuring a broadband response defined by the detector spectral sensitivity. Each IRT comprised an identical TIA circuit, except for the type of op-amp used. A Linear Technologies LTC2050 chopper stabilised op-amp (Linear Technologies, Milpitas, CA, USA) and a Linear Technologies LT1012 precision op-amp (Linear Technologies, Milpitas, CA, USA) were used for the zero-drift and precision IRTs, respectively. The TIA feedback network resistance and capacitance were 10 MΩ and 10 pF, leading to an RC time constant of 100 μs. This provided a faster response time than could be achieved by thermocouples or thermal detector based IRTs, whilst still providing sufficient low-pass filtering. The circuits were not shielded, therefore, enabling some degree of electromagnetic coupling (EMC) related pickup to affect both IRTs to similar extents.
2.1. Comparison of IRTs Measuring Steady-State Temperature
Comparisons were undertaken to determine the capabilities of the IRTs to maintain a nominal zero value when the IRTs were blanked by a cover at ambient temperature and a steady-state value when the photodiodes were exposed to a source at an arbitrary steady-state temperature. The IRTs were exposed to radiant sources with no optical configuration, other than the intrinsic window of the photodiodes. This, therefore, ensured a fair and direct comparison between the IRTs without the usual uncertainties associated with optical alignment, including aligning both IRTs to the target source at the same time. The IRTs were positioned at the same arbitrary distance of 150 mm from the radiant source and adjacent to the aperture centreline. The IRTs, therefore, measured the same radiant source concurrently and from adjacent positions, thereby ensuring that no difference arose from systematic errors associated with the experimental configuration. The TIA output voltages were recorded on a pair of Keysight Technologies 34465A digital multi-meters (DMMs) (Keysight Technologies Malaysia, Penang, Malaysia) with identical configurations to measure and store data. Measurements were recorded at 1 min intervals for three consecutive durations of 100 h each. The data sets were concatenated to provide contiguous IRT output voltage measurements over a total duration of 300 h. The configuration of the blackbody source and photodiodes is illustrated in Figure 1.
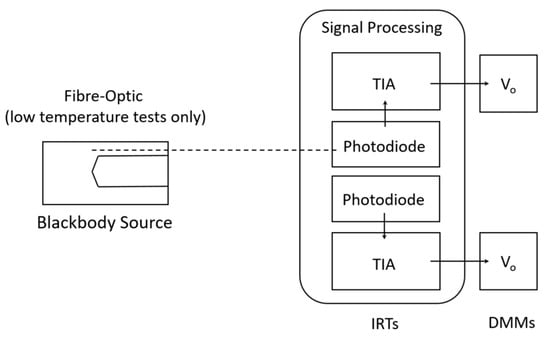
Figure 1.
Schematic diagram illustrating configuration used to test the two infrared radiation thermometers (IRTs) concurrently.
The output voltages measured from the IRTs under the zero signal conditions were interpreted as resulting from the total of the offset voltage and noise of the op-amps only. The source was changed from providing a zero signal condition to both of the IRTs receiving blackbody radiation from an Ametek Land Instruments Landcal P1200B blackbody source (Ametek Land Instruments, Dronfield, UK), set at an arbitrary and constant temperature of 700 °C. The noise power on the output voltage was represented by the variance around the mean in both zero signal and steady-state signal tests. It was not critical that identical conditions were achieved for each IRT because small differences between the mean output voltages would not influence the variances. The excess kurtosis values of the measurements were evaluated to indicate whether the distributions had extensive or restricted tails and to indicate how much extremal values affected the variances.
2.2. Characterisation of IRTs over Low-Temperature Ranges
The output voltages of the IRTs were characterised as a function of the temperature of an Ametek Land Instruments, Landcal P80P blackbody source (Ametek Land Instruments, Dronfield, UK). The blackbody source temperature was calibrated prior to characterisation of the IRTs, using an Isothermal Technology Limited, milliK precision thermometer (Isothermal Technology, Southport, UK) and transfer standard Platinum Resistance Thermometer (Isothermal Technology, Southport, UK), which was calibrated at manufacture by an accredited, primary temperature calibration laboratory.
A 150 mm length of 600 μm core diameter, ZBLAN fluoride glass fibreoptic coupled blackbody radiation from the calibration thermowell in the blackbody source to the IRTs. The fibreoptic had a numerical aperture of 0.20, transmitting radiation between 0.2 μm and 4.5 μm in wavelength. The depth to diameter ratio of the calibration thermowell and the exposed tip of the fibre exceeded 5:1, which afforded high relative emissivity approaching blackbody conditions [27,28].
The IRT output voltages were measured and recorded using a DMM. The temperature set point of the blackbody source was increased in 10 °C increments between 20 °C and 70 °C and the IRT output voltages characterised against this sequence of temperatures. The IRT output voltages at each source temperature were recorded at intervals of 1 s for a duration of ten minutes per measurement. The configuration of the equipment for undertaking IRT characterisation was the same as presented in Figure 1, except that the fibreoptic was inserted into the blackbody source thermowell and coupled the blackbody radiation onto the photodiode.
The mean and standard deviation of the output voltages recorded from the IRTs were evaluated to abstract values that were representative of each temperature and the noise. The root mean square (RMS) noise for each IRT was calculated from the characterisation measurements.
The Wien approximation of Planck’s law enabled evaluation of the ratio between radiances arising from two temperatures to be compared. This leads to the expectation of a linear relationship between the natural logarithm of the IRT output voltage, ln(Vo) and the inverse of the absolute temperature of the source object, 1/T. The limiting effective wavelength, which is a monochromatic wavelength abstraction of the IRT response at different temperatures over a broad wavelength range [29], was calculated from the gradient of the relationship between ln(Vo) and 1/T. The practical calibrations of the IRTs were used to determine interpolation curves, according to the method of Sakuma and Hattori [30]. RMS noise was evaluated from the calibration data to provide an IRT noise measurement in terms of the equivalent temperature resolution in K.
These measurements tested the capability of the IRTs to measure low temperatures likely to be encountered on industrial processes [31] and provided practical calibrations of the IRTs through the temperature range 20 °C to 70 °C.
3. Results and Discussion
3.1. Comparison of the Capabilities of the IRTs to Maintain ‘Zero’ and Steady-State Output Voltages
The capability of the IRTs to maintain steady-state output was determined based upon the variability of output voltage measurements recorded under two separate measurement conditions, as shown in Figure 2. These measurements were performed with (a) the IRTs blanked with a cover at ambient temperature and (b) the IRTs sighted on the blackbody source radiating at an arbitrary steady-state temperature of 700 °C.
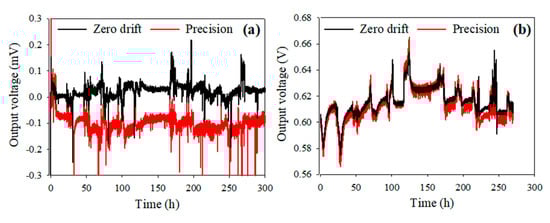
Figure 2.
IRT output voltage comparison with (a) IRTs blanked by the cover at ambient temperature and (b) IRTs sighted upon blackbody source radiating at 700 °C.
The variances for the zero-drift IRT can be seen to be smaller than the variances incurred by the precision IRT; these variances were calculated to be 8.6 × 10⁻⁴ (mV)2 and 19.1 × 10⁻⁴ (mV)2, respectively, therefore representing over 50% reduction in voltage noise. It was also evident by inspection of Figure 2a that the zero-drift IRT maintained the nominal ‘zero’ output voltage closer to zero millivolts than the precision IRT. The mean output voltages were +0.024 mV and −0.10 mV, respectively, therefore representing a 75% reduction in offset voltage. The precision IRT incurred a larger magnitude drift from zero-than the zero-drift IRT; the drift and cycling incurred by the precision op-amp IRT mostly occurred within the range −0.05 mV to −0.10 mV during the blanking tests. In comparison, the zero-drift IRT incurred variations mostly between 0.00 mV and +0.05 mV. Both IRTs demonstrated some larger excursions that occurred randomly during the tests, although the precision IRT incurred more excursions than the zero-drift IRT. It is believed that these excursions were caused by external interference sources, suggesting that the zero-drift IRT was more robust against EMC related pickup. Both IRTs demonstrated larger magnitude changes in the output voltage than the noise incurred around the mean values. These had similar magnitudes and occurred concurrently during the steady-state 700 °C set-point temperature tests, as illustrated by inspection of Figure 2b. The similarity of magnitude and occurrence of these output voltage changes for both IRTs implied that the cause was common. The upwards and downwards trend observed in the output voltage of both IRTs is believed to be due to the red-shift in the cut-off wavelength of the photodiodes. This shift occurs due to drift in the ambient temperature, which is identical for each IRT.
3.2. Statistics Describing the Distributions of Measurements
Sample tests demonstrated that the measurements acquired from the two IRTs at the zero signal and 700 °C conditions arose from independent systems. Therefore, any differences between the mean values, variances and excess kurtosis values calculated were interpreted as arising from the different op-amps used to configure the TIAs.
The mean, variance and excess kurtosis values calculated for the IRT output voltage measurements under the two measurement conditions are presented in Table 1.

Table 1.
Mean, variance and excess kurtosis values of precision and zero-drift IRTs.
Variances incurred by the measurements using the zero-drift IRT were factors of 0.46 and 0.71 smaller than the variances incurred by the precision IRT, for the zero-and steady-state temperature measurements, respectively. The high excess kurtosis values demonstrated that extremal values within the measurements explained much of the variances calculated whilst the IRTs were blanked and, less so, when sighted at the 700 °C blackbody. The ratio of excess kurtosis values indicated that the precision IRT was subject to more extreme variations from its mean value than the zero-drift IRT.
The similarity of variance and excess kurtosis values evaluated for the IRTs measuring 700 °C steady-state temperature, indicated that the two configurations would work similarly well for the measurement of higher temperature sources. The zero-drift IRT did still achieve lower variance than the precision IRT but the difference between the IRTs was not as marked with these higher intensity signals. The zero-drift IRT would be expected to afford lower minimum resolvable temperature measurement, owing to the lower noise and offset, whilst achieving a similar maximum temperature measurable to the precision IRT.
From the zero-signal measurement variances, the noise equivalent power (NEP) within each configuration was calculated to be 1.63 × 10⁻¹¹ W/√Hz and 2.43 × 10⁻¹¹ W/√Hz for the zero-drift IRT and precision IRT, respectively. These NEP figures provide an assessment of the minimum detectable power within each IRT, combining both the photodiode and amplifier circuitry.
3.3. Characterisation of IRTs against a Blackbody Source at Low Temperatures
Mean output voltages for the zero-drift IRT and precision IRT, as functions of blackbody source temperature, are presented in Figure 3a. The standard deviations of the measurements are represented by error bars.
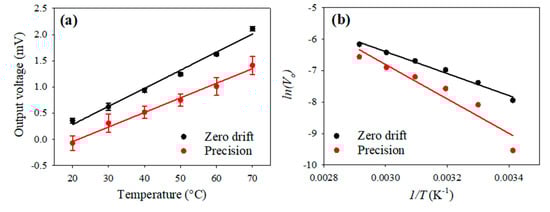
Figure 3.
(a) Output voltage as a function of blackbody temperature for zero-drift and precision IRTs. (b) ln(Vo) as a function of 1/T for zero-drift and precision IRTs.
The zero-drift IRT measured 0.35 mV at 20 °C, increasing to 2.1 mV at 70 °C, whilst the precision IRT increased from −0.072 mV to 1.4 mV over the same temperature range. Whilst both IRTs demonstrated the ability to resolve changes of target temperature over this measurement range, the standard deviation of the zero-drift IRT measurement was clearly lower across the full measurement range. The mean measurement tolerance of the zero-drift IRT output voltage over the temperature range measured was calculated to be 5.8%, whilst that of the precision IRT was 21.4%. These results reflect what was observed in Figure 2 and Table 1; the zero-drift IRT provides a more sensitive and less noisy measurement.
Whilst the output voltage measurement variation reflected the capability of the thermometers to measure a stable signal, the overall measurement uncertainty included the capability to interpolate the temperature between known calibration points and the calibration tolerance of the equipment used. A more complete estimate of overall measurement uncertainties between 40 °C and 70 °C is presented in the following tables and analysis, thereby affording a more comprehensive understanding of the measurement tolerance of the two versions of the IRTs.
The uncertainty budget for single measurements has been estimated, based upon the individual contributions from the equipment used in calibration and measurement and from the measurements acquired using each IRT. The individual uncertainty contributions considered in the estimate, which arose from the calibration equipment and measurements, are presented in Table 2 and Table 3, respectively expressed in terms of absolute temperature and percentage of voltage.
Table 2.
Contributions of calibration uncertainties to overall measurement uncertainty (k = 2).
Table 3.
Contributions of measurement uncertainties to overall measurement uncertainty (k = 2).
The largest individual contributions to the uncertainty arose from the stochastic variability in the IRT voltage measurements and the error arising from the interpolation used to convert between the voltage and temperature. The uncertainties that arose from the calibration equipment can be neglected without detriment, therefore we can simplify the uncertainty estimation by evaluating only the variability of the measurements and interpolation errors, presented in Table 3. The overall uncertainties of the IRT measurements, on this basis, varied from 2.5 K at 40 °C to 2.9 K at 70 °C for the zero-drift IRT and 11.7 K at 40 °C and 6.0 K at 70 °C for the precision IRT.
To assess the linearity of the two IRTs, Figure 3b shows ln(Vo) as a function of 1/T. The zero-drift IRT adhered to the linear relationship expected between ln(Vo) and 1/T better than the precision IRT, highlighting an additional benefit of the zero-drift IRT; it eases the calibration procedure. The limiting effective wavelengths for the IRTs were calculated to be 4.12 μm and 3.71 μm for the zero-drift and precision IRTs, respectively.
Practical calibrations of the IRTs were used to determine interpolation curves. There was good agreement between the measured and modelled output voltages for the zero-drift IRT at each temperature within the range, with only the lowest temperature having a deviation that exceeded 10% of the measured voltage. The precision IRT afforded reasonable agreement, with larger deviations between modelled and measured output voltages than recorded for the zero-drift IRT. The difference between modelled and measured voltages for the precision IRT was 47.5% at 20 °C, reducing to circa 30% for temperatures above 40 °C. RMS noise was calculated from the calibrations for each IRT. The RMS noise of the zero-drift IRT was evaluated to be 3.5 K at 20 °C, reducing to less than 1.0 K for temperatures above 40 °C. The RMS noise of the precision IRT was evaluated to be 14.7 K at 20 °C, reducing to 5.0 K for temperatures above 40 °C.
The results have demonstrated that the use of a chopper stabilised op-amp within the TIA circuit of a zero-drift IRT improves the quality of the temperature measurement for target objects at ambient room temperature and above. The zero-drift IRT incurred lower RMS noise compared to an equivalent precision op-amp based IRT. The zero-drift IRT performance could be improved further by deploying a higher value of transimpedance resistor within the feedback loop to achieve higher ‘gain’. This would enable lower magnitude photocurrents to be amplified to measurable output voltages. In addition, further investigation of different chopper stabilised op-amp variants could be performed to establish the lower noise performance possible for the zero-drift IRT. By combining this with further instrumentation optimisation, such as additional filtering and averaging, a zero-drift IRT could be developed for measuring temperatures from artefacts such as Lithium ion cells, warm fluids or body temperature. Such an IRT should offer greater stability and be more robust against ambient temperature variations compared with an IRT that used a precision op-amp and could be achieved without photodetector cooling or optical chopping.
4. Conclusions
A fibreoptic coupled zero-drift IRT comprising a chopper stabilised op-amp was shown to offer improved performance compared to a precision IRT containing a precision op-amp. The zero-drift IRT was shown to offer improved linearity for the measurement of lower target temperatures compared to the precision IRT. This offered significant advantages over the precision IRT for the measurement of such temperatures; it eased the IRT calibration procedure and improved the tolerance of the temperature measurement.
When blanked by a cover at ambient temperature, the zero-drift IRT achieved approximately 75% reduction in offset voltage, 50% reduction in the output voltage noise and less susceptibility to perturbation by external sources. This enabled the measurement of lower target temperatures with lower IRT noise; the calibrated RMS noise for the measurement of a 40 °C blackbody source temperature reduced from 5 K to 1 K with thee use of the zero-drift IRT.
The temperature measurement uncertainties of the IRTs between 40 °C and 70 °C, over which range the low-temperature calibrations were compared, were evaluated to vary between 2.5 K and 2.9 K for the zero-drift IRT and 11.7 K and 6.0 K for the precision IRT. The mean uncertainties across the full range of temperature measurements demonstrated that the zero-drift IRT achieved lower measurement uncertainty than the precision IRT.
Author Contributions
Conceptualization, A.D.H., M.J.H. and J.R.W.; methodology, A.D.H. and M.J.H.; validation, A.D.H.; formal analysis, A.D.H. and M.J.H.; investigation, A.D.H.; resources, J.R.W.; data curation, A.D.H.; writing—original draft preparation, A.D.H. and M.J.H.; writing—review and editing, A.D.H., M.J.H. and J.R.W.; supervision, J.R.W.; project administration, A.D.H.;funding acquisition, J.R.W. All authors have read and agreed to the published version of the manuscript.
Funding
This research was funded by the UK Engineering and Physical Sciences Research Council under doctoral training grant scholarship numbers EP/K503149/1 and EP/L505055/1 and grant number EP/M009106/1 Optimised Manufacturing Through Unique Innovations in Quantitative Thermal Imaging and the APC was funded by EPSRC/UKRI and administered by The University of Sheffield.
Conflicts of Interest
The authors declare no conflicts of interest. The funders had no role in the design of the study; in the collection, analyses or interpretation of data; in the writing of the manuscript, and in the decision to publish the results.
References
- Childs, P.R.N.; Greenwood, J.R.; Long, C.A. Review of temperature measurement. Rev. Sci. Instrum. 2000, 71, 2959–2978. [Google Scholar] [CrossRef]
- Demling, A.; Ousley, D.; Stelley, S. Best practices for deploying thermocouple instruments. AIP Conf. Proc. 2013, 1552, 601–606. [Google Scholar] [CrossRef]
- Martyniuk, P.; Rogalski, A. Terahertz detectors and focal plane arrays. Opto-Electron. Rev. 2013, 21, 239–257. [Google Scholar] [CrossRef]
- Heeley, A.D.; Hobbs, M.J.; Laalej, H.; Willmott, J.R. Miniature uncooled and unchopped fiber optic infrared thermometer for application to cutting tool temperature measurement. Sensors 2018, 18, 3188. [Google Scholar] [CrossRef]
- Moisello, E.; Vaiana, M.; Castagna, M.E.; Bruno, G.; Malcovati, P.; Bonizzoni, E. An integrated thermopile-based sensor with a chopper-stabilized interface circuit for presence detection. Sensors 2019, 19, 3999. [Google Scholar] [CrossRef]
- Makai, J.P.; Makai, T. Enhancement of the low level detection limit of radiometric quality photovoltaic and photoconductive detectors. Metrologia 2005, 42, 266–270. [Google Scholar] [CrossRef]
- Dixon, J. Radiation thermometry. J. Phys. E Sci. Instrum. 1988, 21, 425–436. [Google Scholar] [CrossRef]
- Srivastav, V.; Sharma, R.K.; Bhan, R.K.; Dhar, V.; Venkataraman, V. Exploring novel methods to achieve sensitivity limits for high operating temperature infrared detectors. Infrared Phys. Technol. 2013, 61, 290–298. [Google Scholar] [CrossRef]
- Texas Instruments Inc. AN-1803 Design Considerations for a Transimpedance Amplifier; Texas Instruments Appl. Rep. SNOA515A; Texas Instruments: Dallas, TX, USA, May 2013; pp. 1–6. Available online: http://www.ti.com/lit/an/snoa515a/snoa515a.pdf (accessed on 24 February 2016).
- Orozco, L. Optimizing Precision Photodiode Sensor Circuit Design; Analog Devices Technical Article MS-2624; Analog Devices: Norwood, MA, USA, 2014; pp. 1–5. Available online: https://www.analog.com/media/en/technical-documentation/tech-articles/Optimizing-Precision-Photodiode-Sensor-Circuit-Design-MS-2624.pdf (accessed on 10 April 2017).
- Eppeldauer, G. Chopped radiation measurements with large area Si photodiodes. J. NIST 1998, 103, 153–162. [Google Scholar] [CrossRef][Green Version]
- Portelli, A.J.; Nasuto, S.J. Design and development of non-contact bio-potential electrodes for pervasive health monitoring applications. Biosensors 2017, 7, 2. [Google Scholar] [CrossRef]
- Wang, Y.; Wunderlich, R.; Heinen, S. A micropower analogue front end for wireless ECG system A micropower analogue front end for wireless ECG system. Int. J. Electron. Lett. 2018, 6, 36–47. [Google Scholar] [CrossRef]
- Kim, J.; Kim, H.; Han, K.; You, D.; Heo, H.; Kwon, Y.; Cho, D.D.; Ko, H. Low-noise chopper-stabilized multi-path operational amplifier with nested miller compensation for high-precision sensors. Appl. Sci. 2020, 10, 281. [Google Scholar] [CrossRef]
- Han, K.; Kim, H.; Kim, J.; You, D.; Heo, H.; Kwon, Y.; Lee, J.; Ko, H. A 24.88 nv/√hz wheatstone bridge readout integrated circuit with chopper-stabilized multipath operational amplifier. Appl. Sci. 2020, 10, 399. [Google Scholar] [CrossRef]
- Butti, F.; Bruschi, P.; Dei, M.; Piotto, M. A compact instrumentation amplifier for MEMS thermal sensor interfacing. Analog Integr. Circuits Signal. Process. 2012, 72, 585–594. [Google Scholar] [CrossRef]
- Makai, J.P.; Makai, J.J. Current-to-voltage converter for linearity correction of low shunt resistance photovoltaic detectors. Rev. Sci. Instrum. 1996, 67, 2381–2386. [Google Scholar] [CrossRef]
- Aleksandrov, S.E.; Gavrilov, G.A.; Sotnikova, G.Y. Effect of low-frequency noise on the threshold sensitivity of middle-IR photodetectors in a broad frequency range. Tech. Phys. Lett. 2014, 40, 704–707. [Google Scholar] [CrossRef]
- Horowitz, P.; Hill, W. Table 5.2 Representative Precision Op-amps. In The Art of Electronics, 3th ed.; Cambridge University Press: Cambridge, UK, 2015; p. 302. [Google Scholar]
- Horowitz, P.; Hill, W. Table 5.6 Chopper and Auto-zero Op-amps. In The Art of Electronics, 3th ed.; Cambridge University Press: Cambridge, UK, 2015; p. 335. [Google Scholar]
- Linear Technologies. LT1012A/LT1012-Picoamp Input Current, Microvolt Offset, Low Noise Operational Amplifier Datasheet; LW/TP 1202 1K Rev., B.; Linear Technologies: Milpitas, CA, USA, 1991; pp. 1–20. Available online: https://www.analog.com/media/en/technical-documentation/data-sheets/LT1012.pdf (accessed on 12 June 2017).
- Linear Technologies. LTC2050/LTC2050HV Zero Drift Operational Amplifiers Datasheet; LT0817 Rev., D.; Linear Technologies: Milpitas, CA, USA, 1999; pp. 1–18. Available online: https://www.analog.com/media/en/technical-documentation/data-sheets/LTC2050-2050HV.pdf (accessed on 18 December 2017).
- Butti, F.; Piotto, M.; Bruschi, P. A chopper instrumentation amplifier with input resistance boosting by means of synchronous dynamic element matching. IEEE Trans. Circuits Syst. Regul. Pap. 2017, 64, 753–764. [Google Scholar] [CrossRef]
- Lee, S.; Shin, Y.; Kumar, A.; Kim, K.; Lee, H. Two-Wired Active Spring-Loaded Dry Electrodes for EEG measurements. Sensors 2019, 19, 4572. [Google Scholar] [CrossRef]
- Nebhen, J.; Meillère, S.; Masmoudi, M.; Seguin, J.L.; Barthelemy, H.; Aguir, K. A 250 μw 0.194 nV/rtHz chopper-stabilized instrumentation amplifier for MEMS gas sensor. In Proceedings of the 7th International Conference on Design & Technology of Integrated Systems in Nanoscale Era, Gammarth, Tunisia, 16–18 May 2012; pp. 1–5. [Google Scholar] [CrossRef]
- Zhao, J.; Zhang, S.; Chen, S. A chopper stabilized pre-amplifier for magnetic sensor. In Proceedings of the 2012 International Conference on Industrial Control and Electronics Engineering, Xi’an, China, 23–25 August 2012; pp. 501–504. [Google Scholar] [CrossRef]
- Sparrow, E.M.; Albers, L.U.; Eckert, E.R.G. Thermal radiation characteristics of cylindrical enclosures. J. Heat Transf. 1962, 84, 73–81. [Google Scholar] [CrossRef]
- Vollmer, J. Study of the effective thermal emittance of cylindrical cavities. J. Opt. Soc. Am. 1957, 47, 926–932. [Google Scholar] [CrossRef]
- Saunders, P. General interpolation equations for the calibration of radiation thermometers. Metrologia 1997, 34, 201–210. [Google Scholar] [CrossRef]
- Sakuma, F.; Hattori, S. Establishing a practical temperature standard by using a narrow-band radiation thermometer with a silicon detector. In Temperature: Its Measurement and Control in Science and Industry, Proceedings of the Sixth International Temperature Symposium, Washington, DC, USA, 15–18 March 1982; American Institute of Physics: College Park, MD, USA, 1982; Volume 5, pp. 421–427. [Google Scholar]
- Pfeifer, H. Industrial Furnaces-Status and Research Challenges. Energy Procedia 2017, 120, 28–40. [Google Scholar] [CrossRef]
© 2020 by the authors. Licensee MDPI, Basel, Switzerland. This article is an open access article distributed under the terms and conditions of the Creative Commons Attribution (CC BY) license (http://creativecommons.org/licenses/by/4.0/).