An Effective Prediction Approach for Moisture Content of Tea Leaves Based on Discrete Wavelet Transforms and Bootstrap Soft Shrinkage Algorithm
Abstract
1. Introduction
2. Materials and Methods
2.1. Trial Introduction
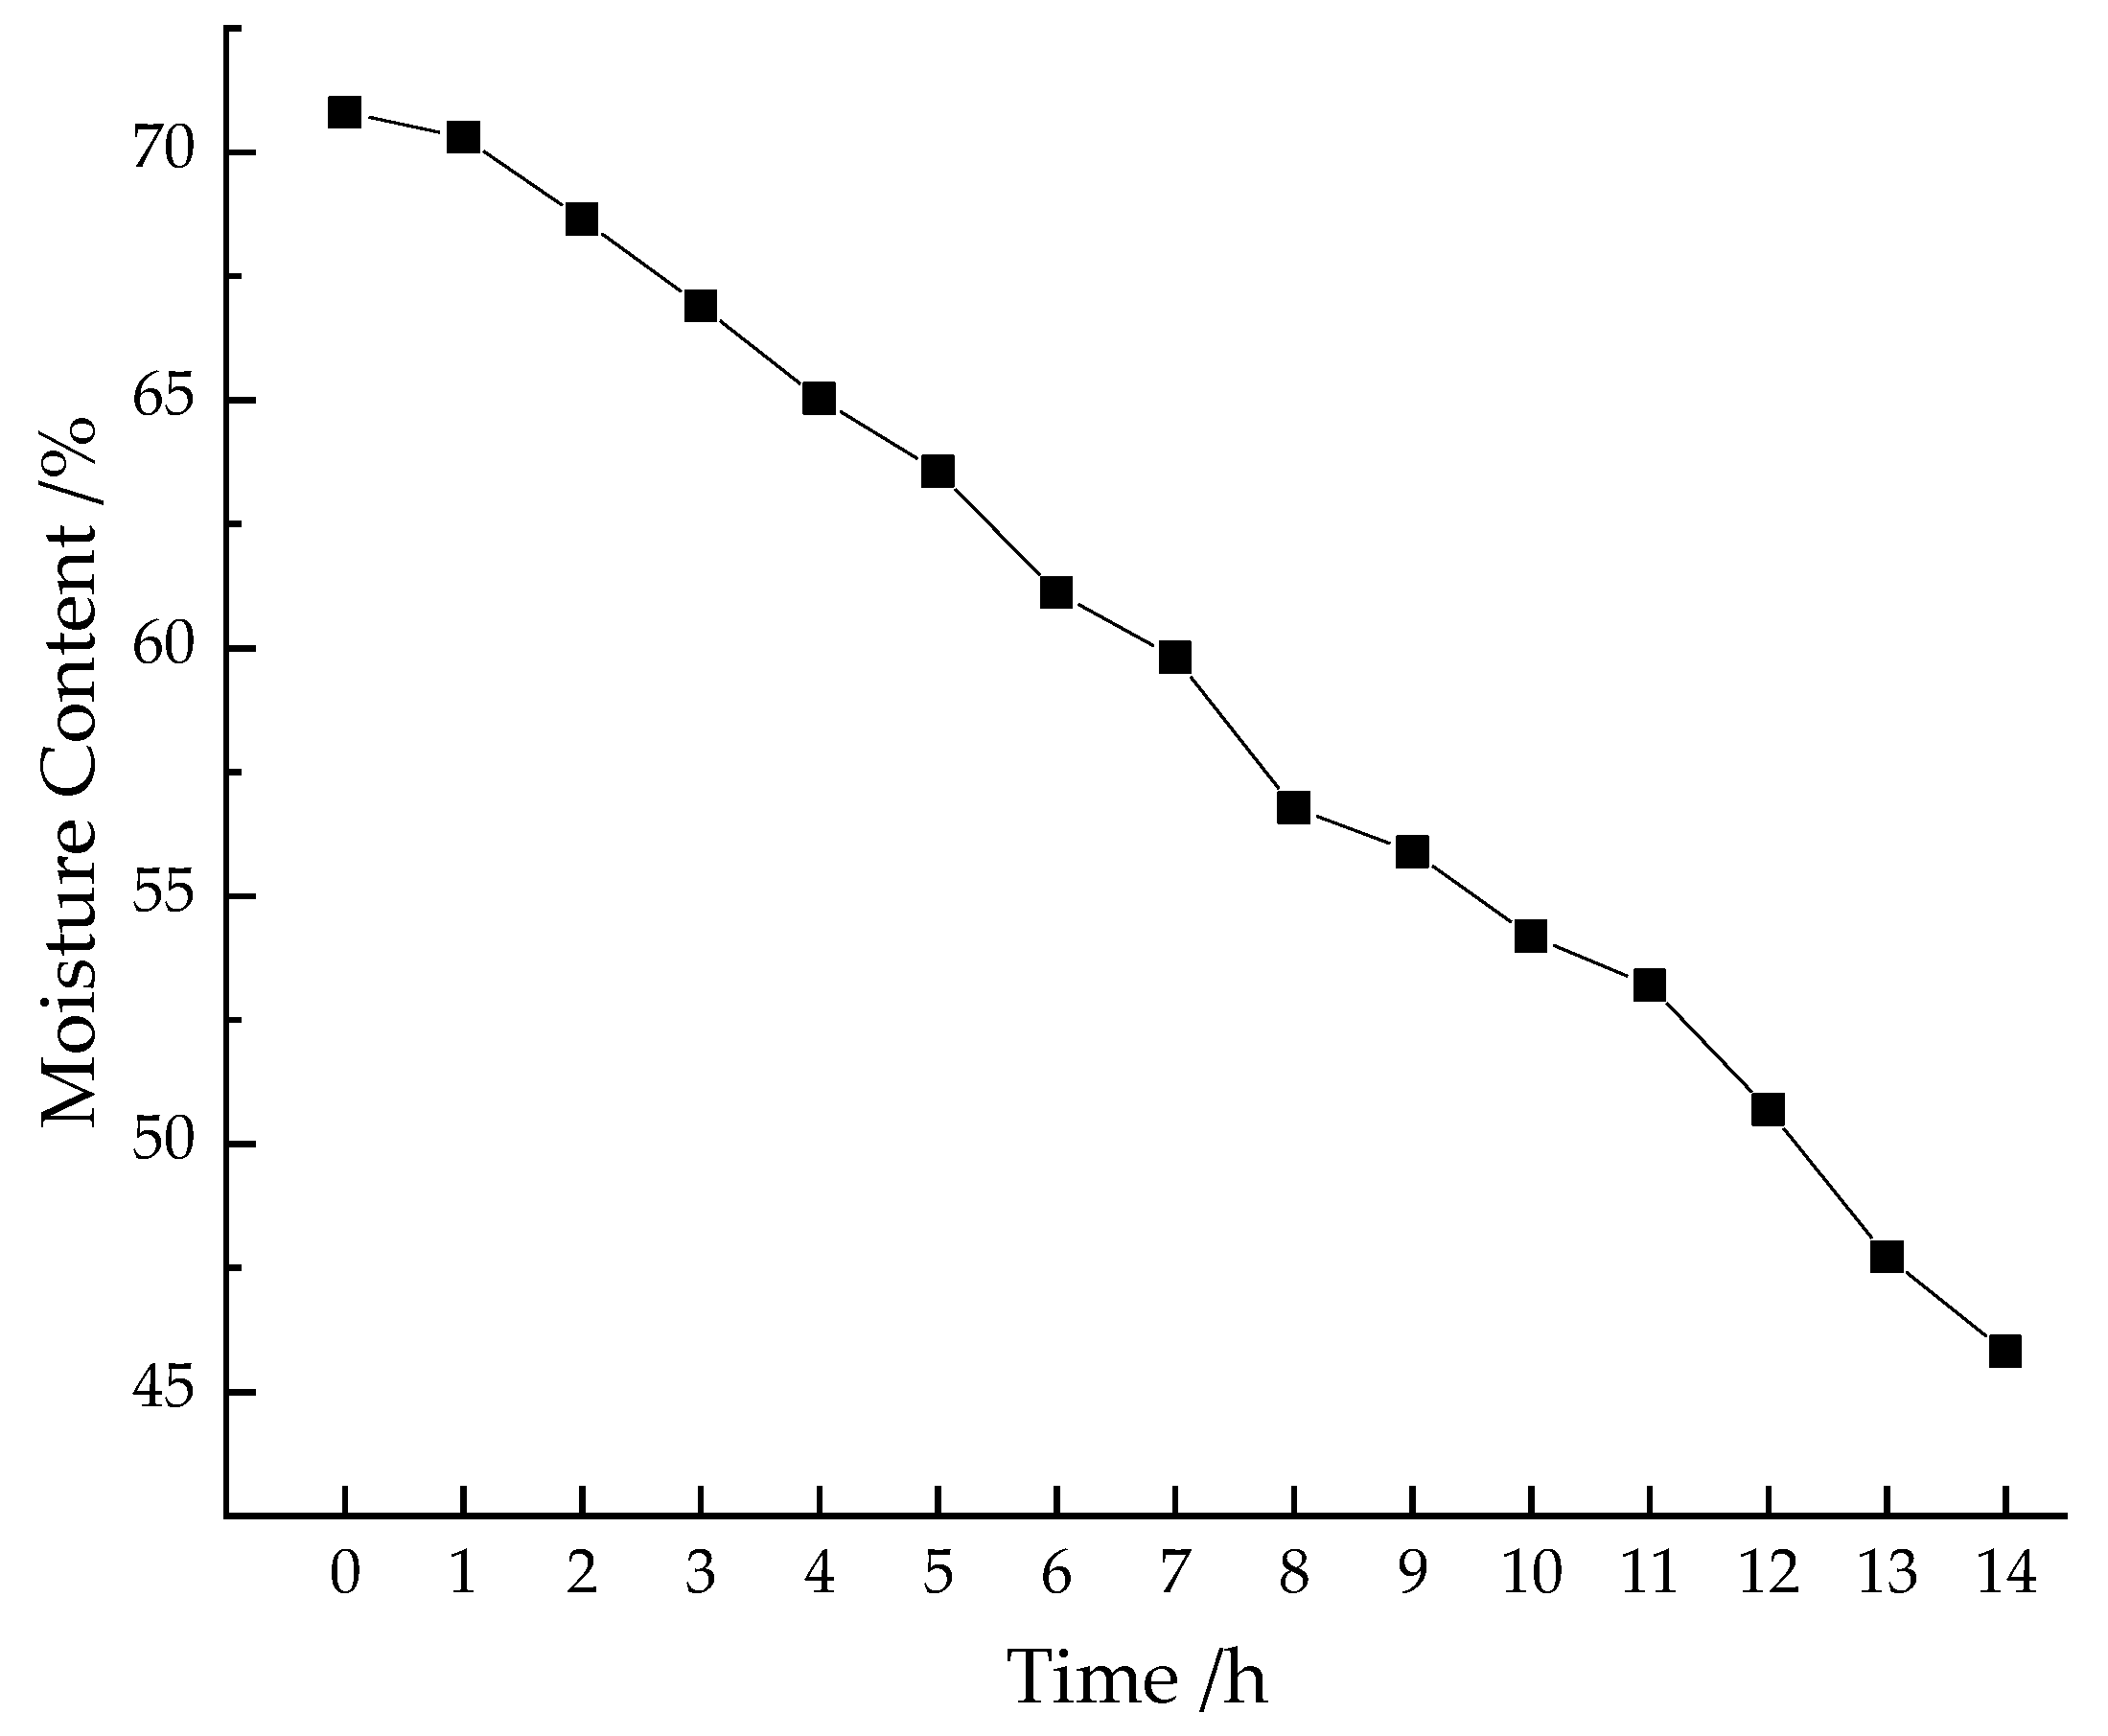
2.2. Moisture Content Acquisition
2.3. Sample Set Partitioning Based on Joint X-Y Distance (SPXY)
2.4. Analysis of PLS Model
2.5. Wavelength Selection Method
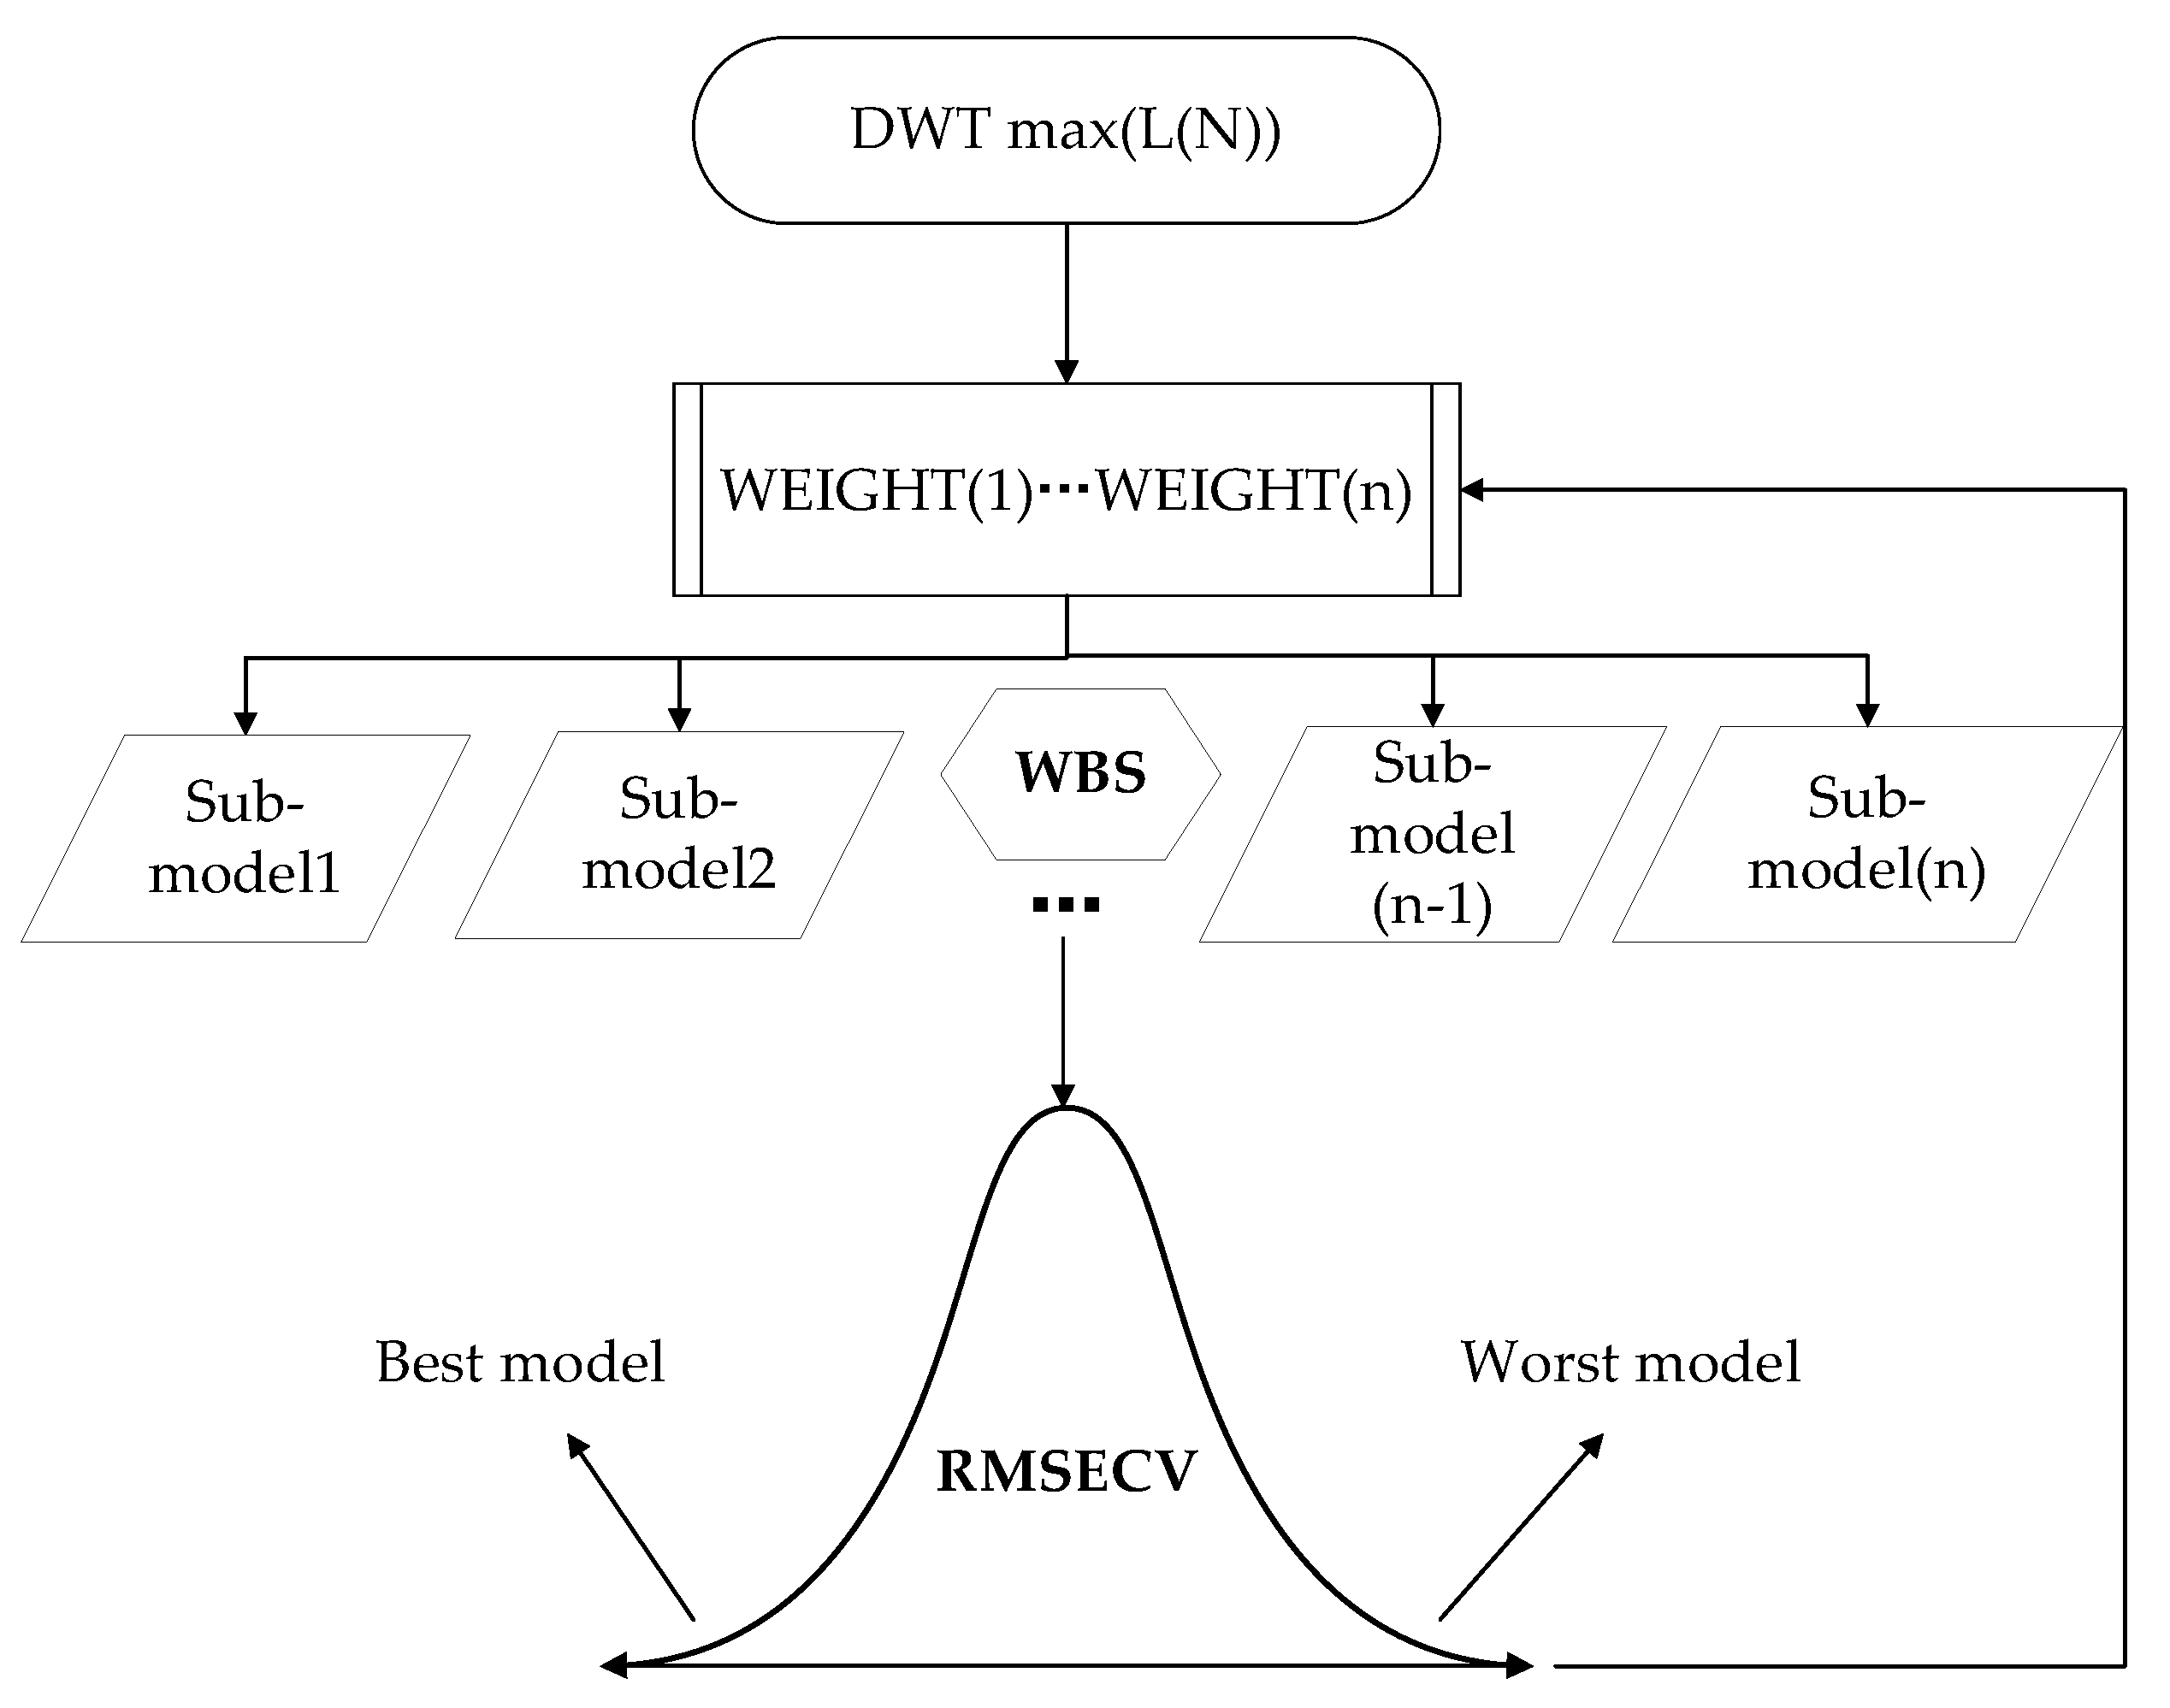
2.5.1. DWT and BOSS Coupling Algorithm
- (1)
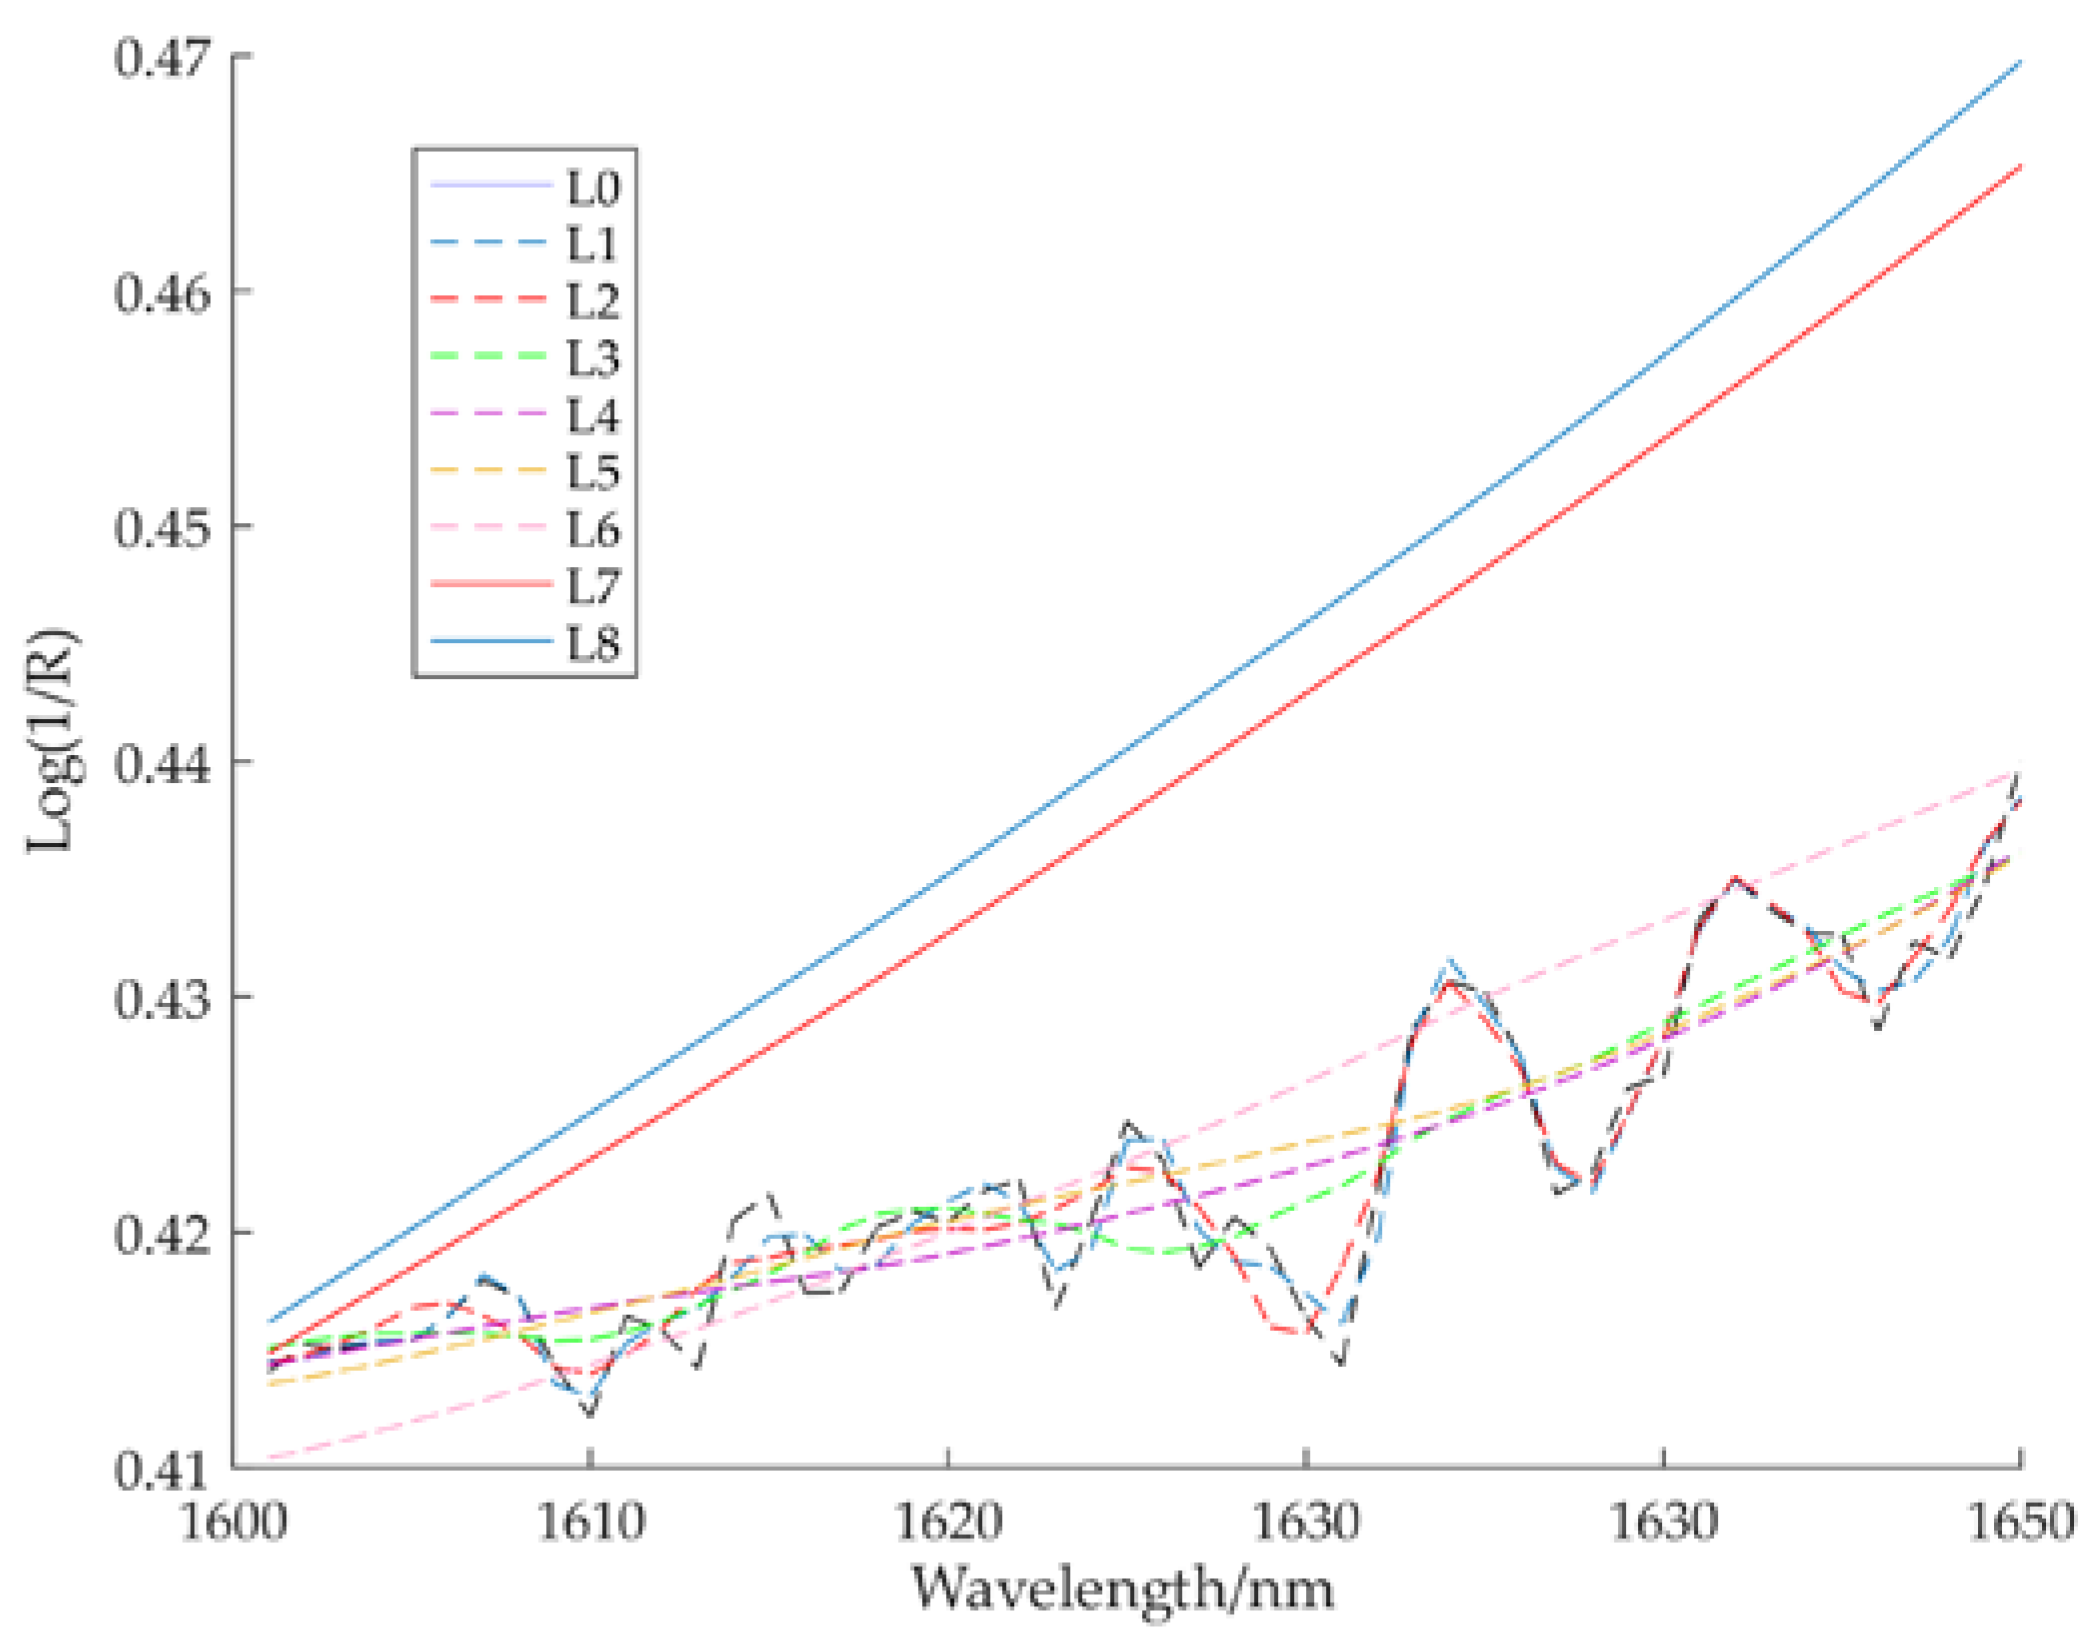
- Obtain the maximum decomposition layer (L(Max)) of the wavelet transform. First observe the trend in the spectra image after decomposition, then according to the order of correlation coefficient to select the maximum number of layers;
- (2)
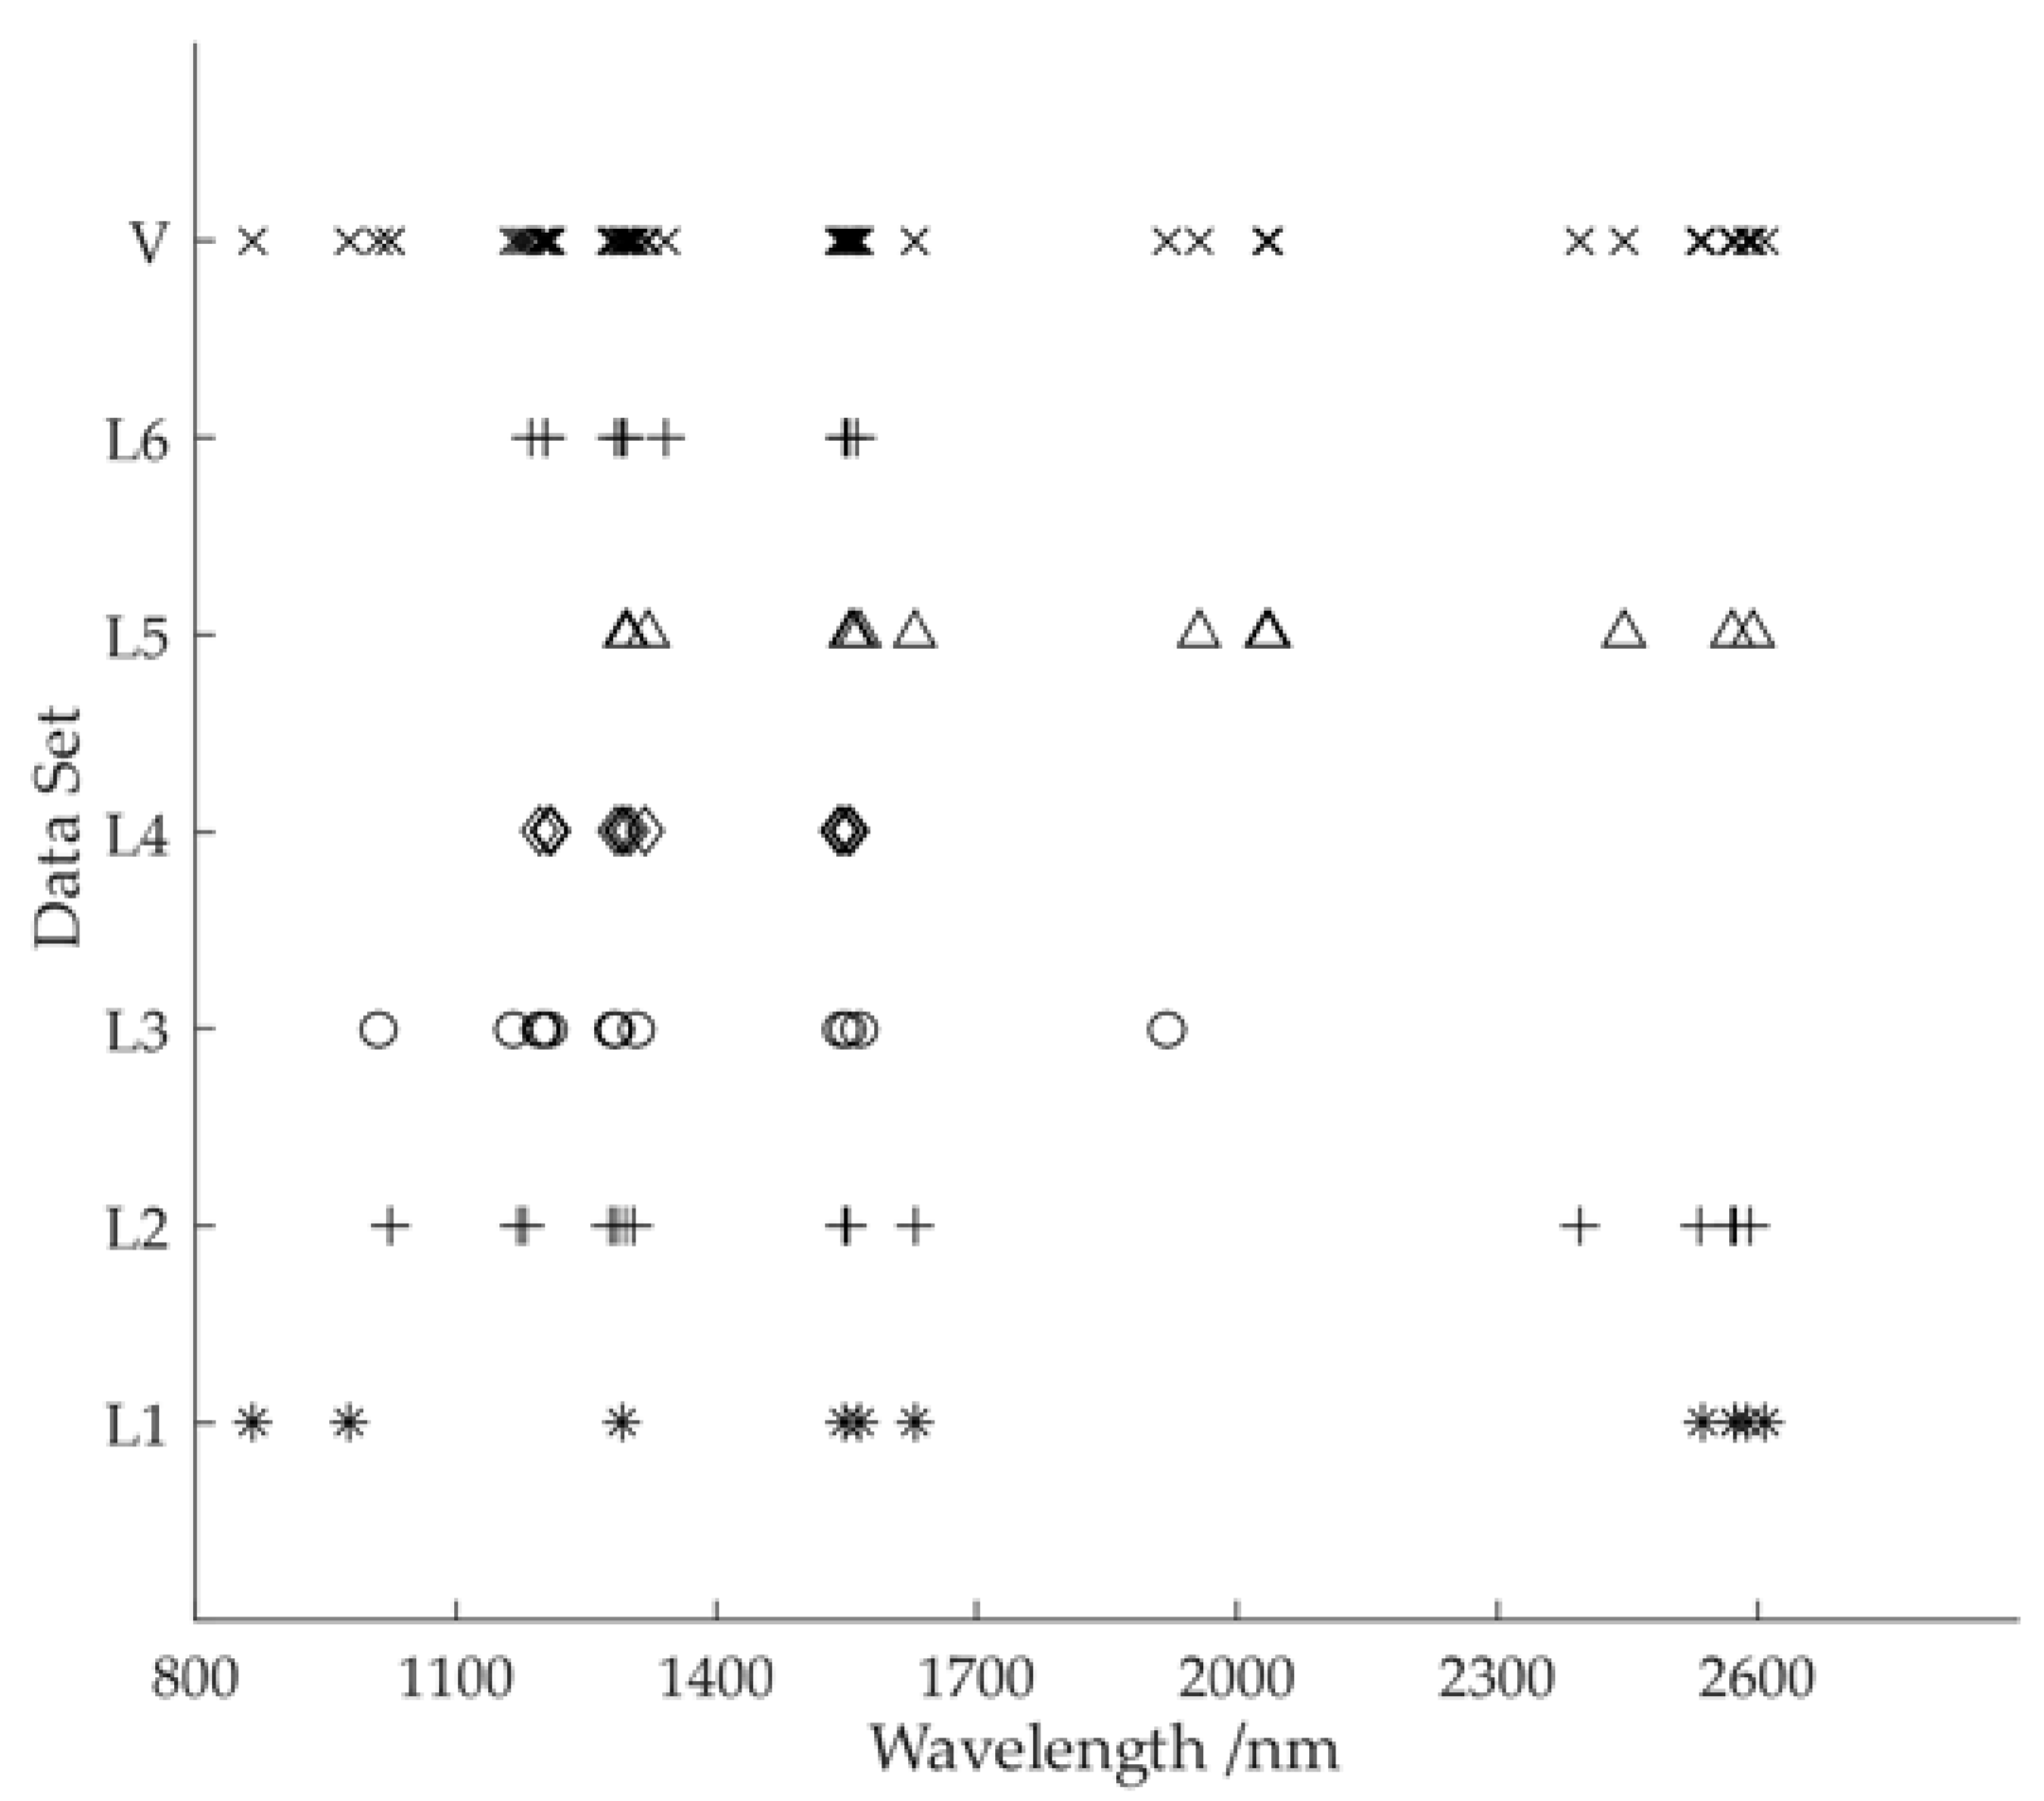
- Use the BOSS algorithm to optimize the effective variables of each spectral data from L1 to L(Max) (L1-L(Max)), and the optimal variables set is obtained by superimposing the preferable variables of L1-L(Max). L1 is defined as the first decomposition layer.
2.5.2. Correlation Coefficient (R)Method
2.5.3. Genetic Algorithm
2.5.4. iPLS
3. Results and Discussion
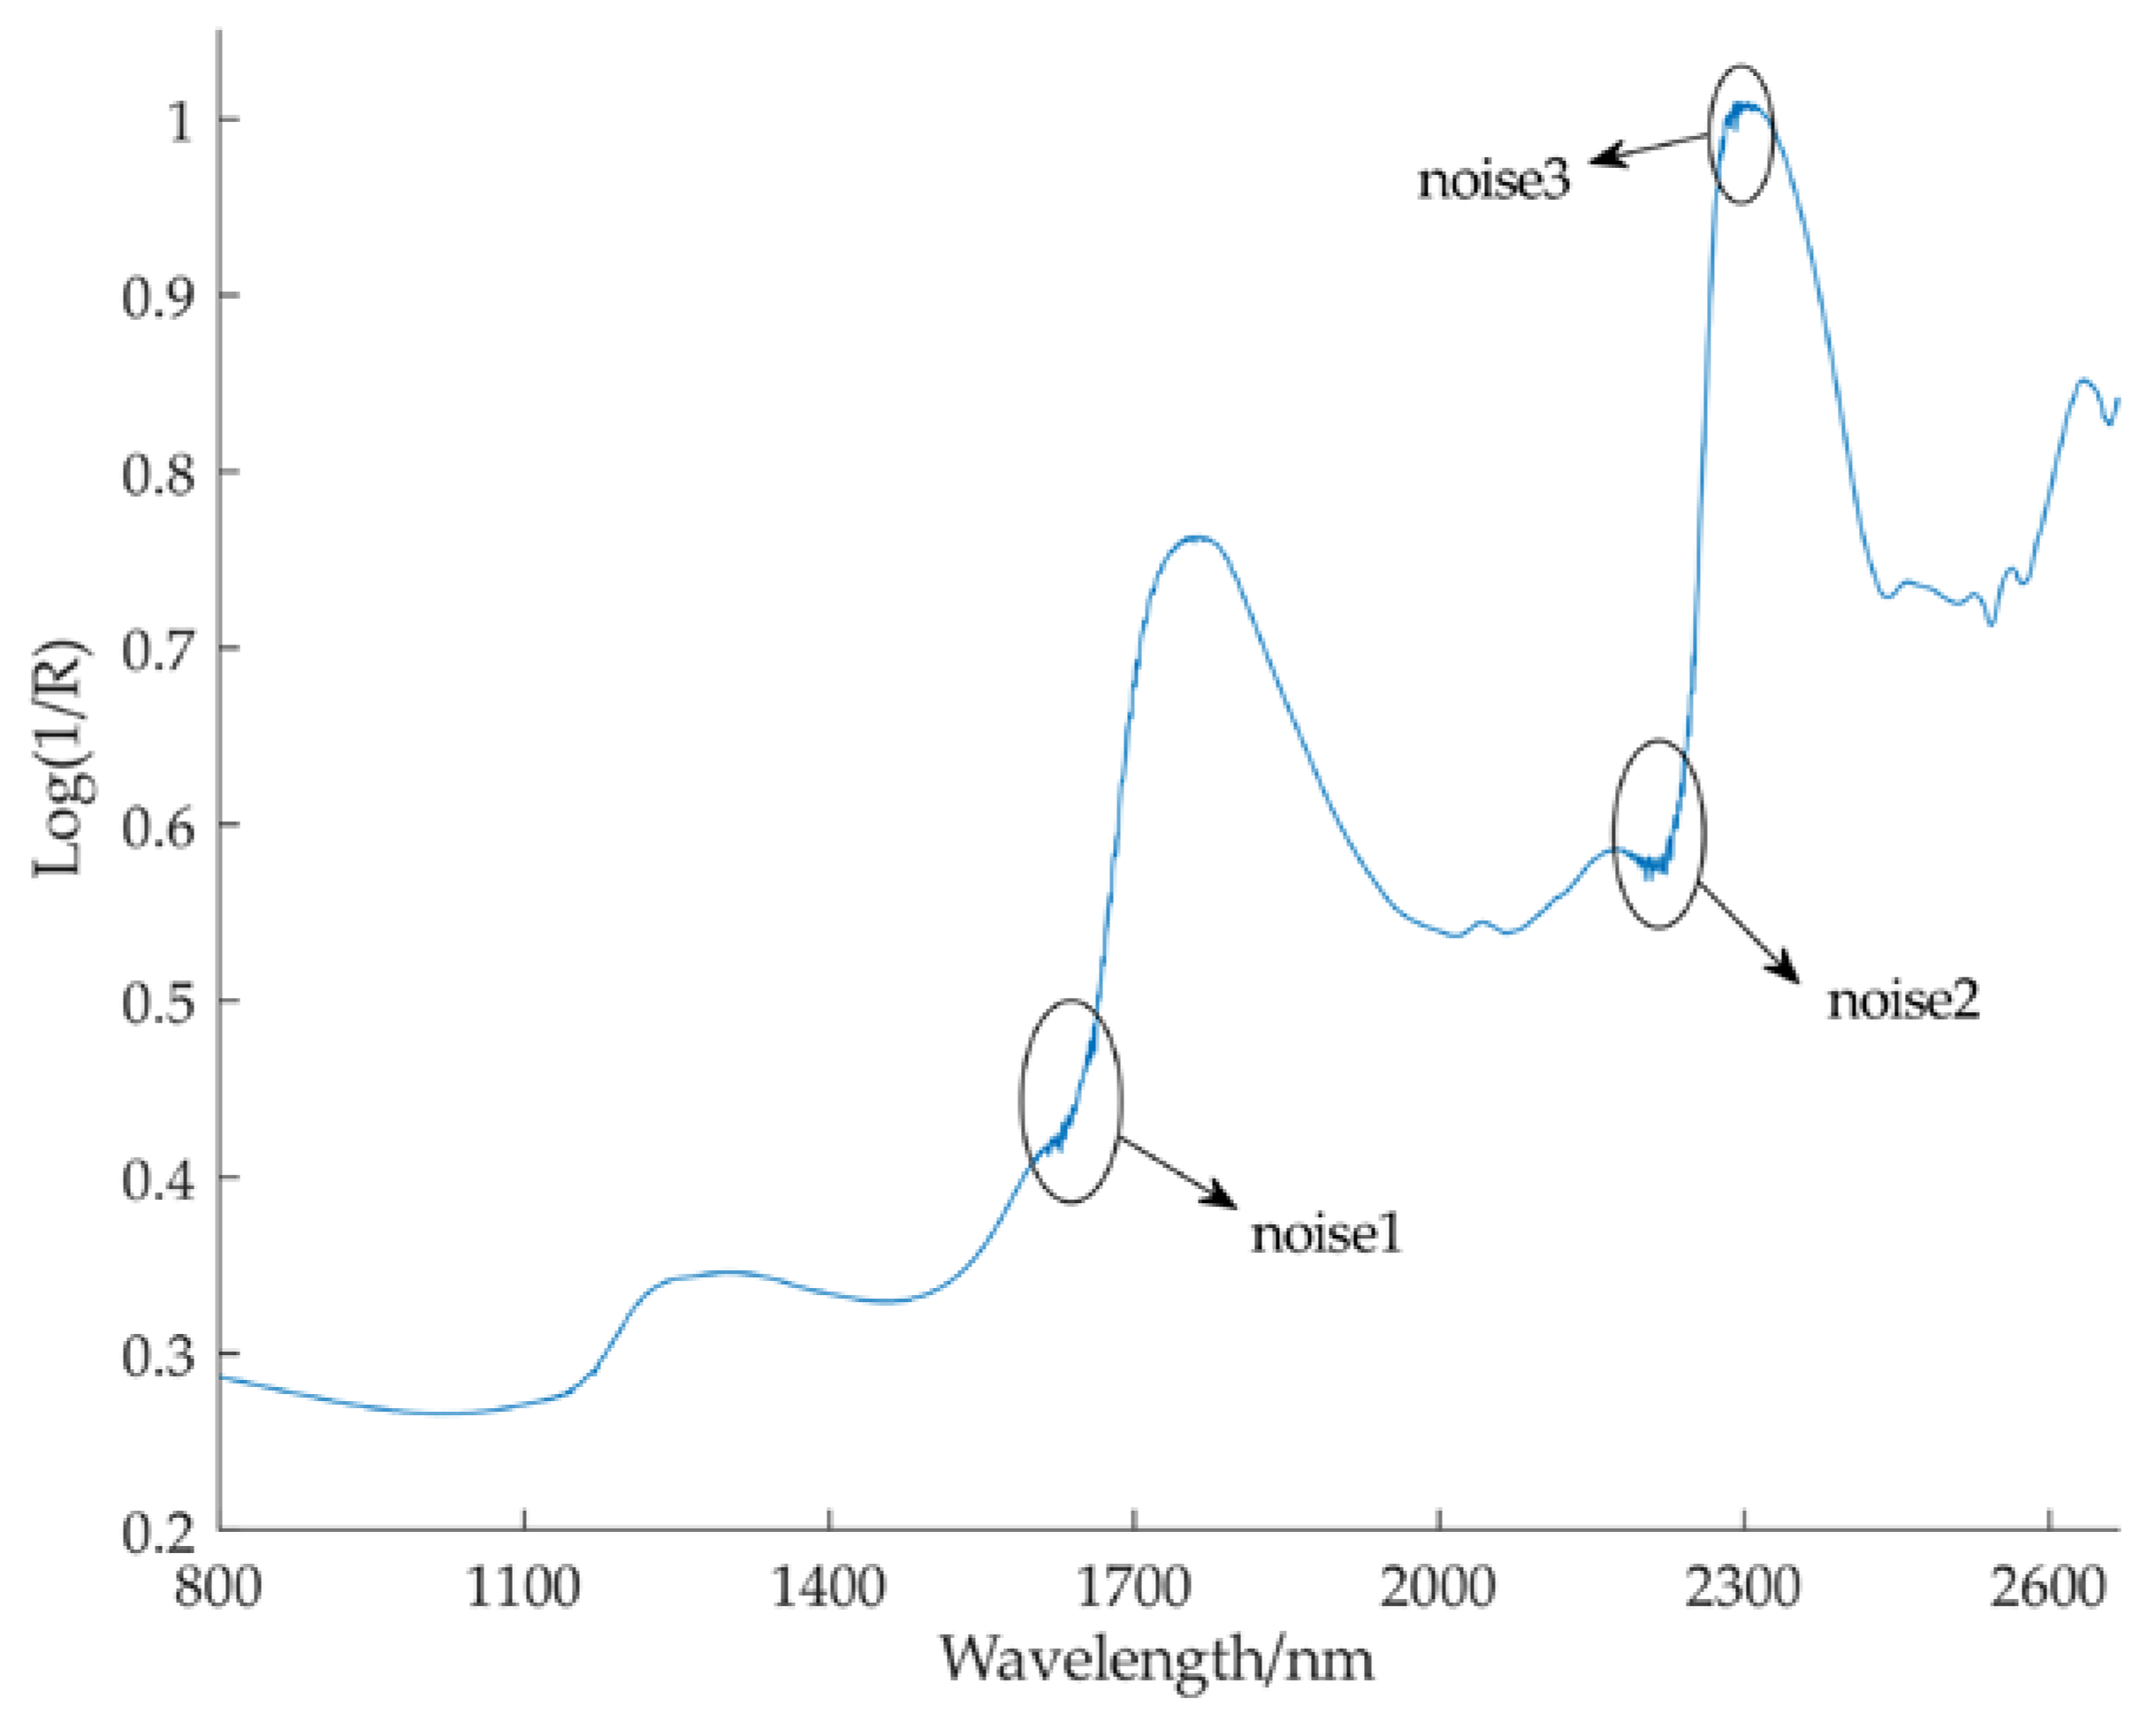
3.1. Wavelet Transform and Maximum Decomposition Layer
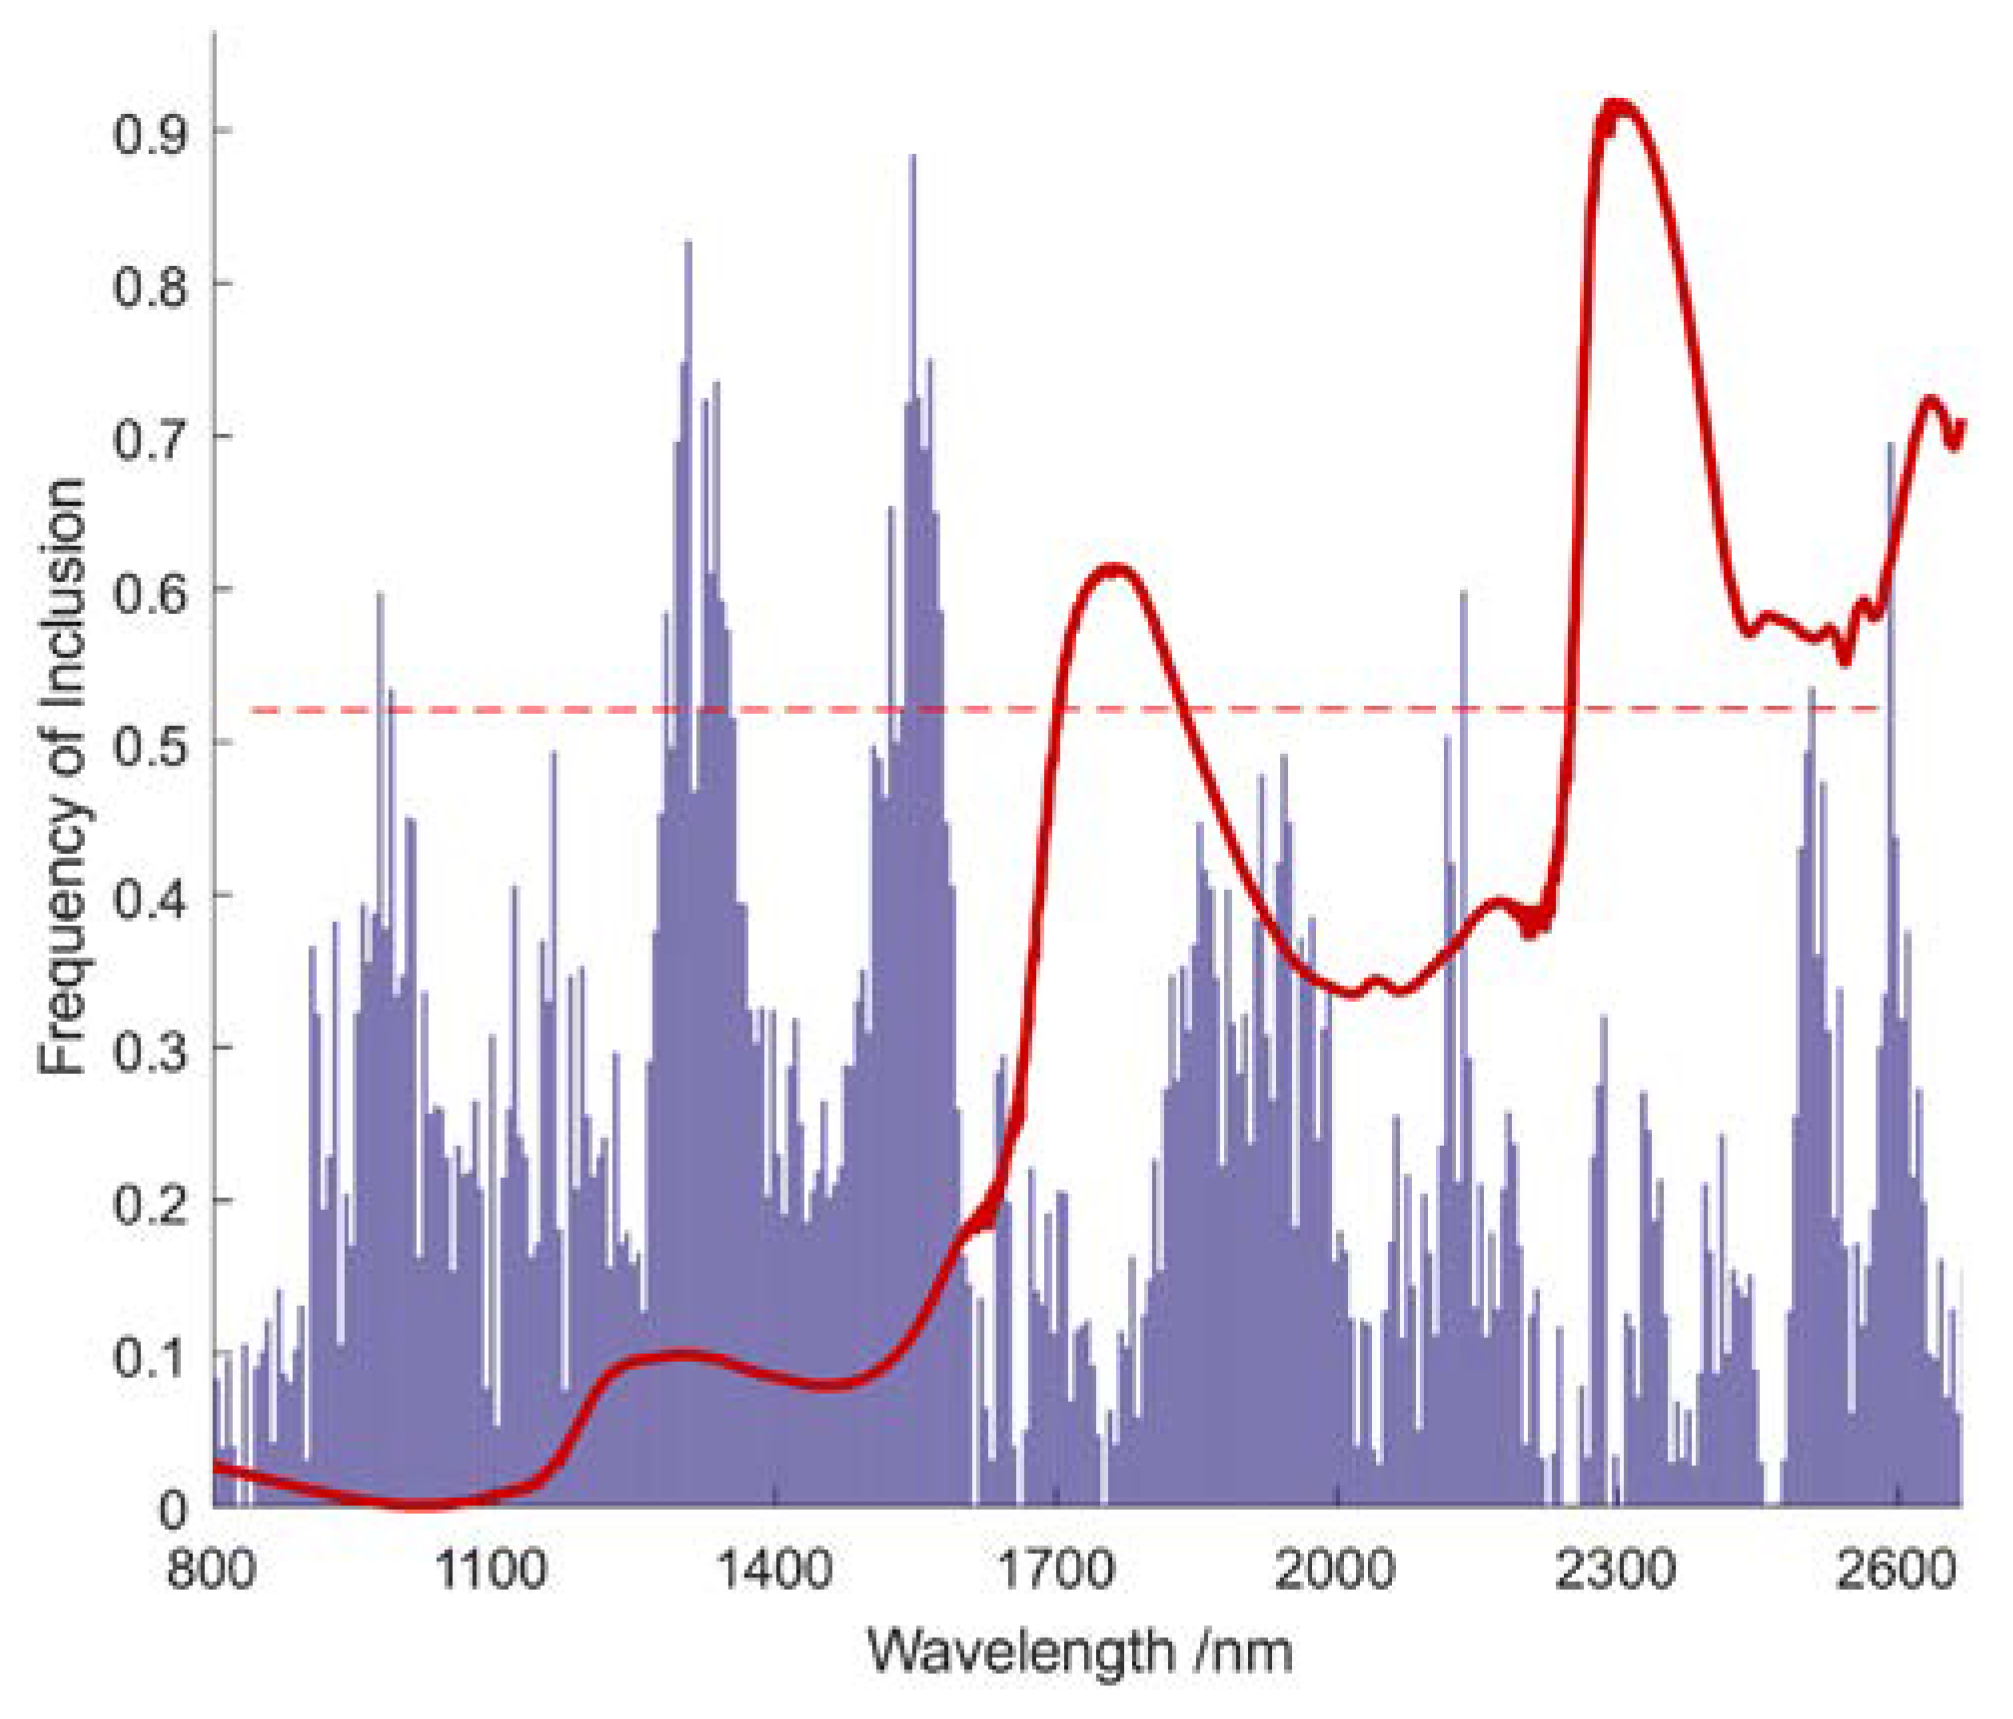
3.2. An Optimal Variable Set Applicable to Moisture Characteristics of Tea Leaves
3.3. Establishment and Verification of the PLS Model Based on an Optimal Variable Set
3.4. Two Classical Methods Introduced to Establish PLS Models
3.4.1. GA-PLS Prediction Model Built for Comparison with the Proposed Model
3.4.2. iPLS Prediction Model Built for Comparison with the Proposed Model
4. Conclusions
Author Contributions
Funding
Acknowledgments
Conflicts of Interest
References
- Gilbert, N. Drink tea and be merry. Nature 2019, 566, S9. [Google Scholar]
- Chen, S.X.; Luo, J.L.; Li, P.W. Study on the effect of cleaning technology of fresh tea leaves on the quality of green tea. Trans. Tech. Publ. Ltd. 2020, 984, 160–167. [Google Scholar] [CrossRef]
- Caliskan, G.; Dirim, S.N. The effect of different drying processes and the amounts of maltodextrin addition on the powder properties of sumac extract powders. Powder Tech. 2016, 287, 308–314. [Google Scholar] [CrossRef]
- Wang, Y.J.; Li, L.Q.; Shen, S.S.; Liu, Y.; Ning, J.M.; Zhang, Z.Z. Rapid detection of quality index of postharvest fresh tea leaves using hyperspectral imaging. J. Sci. Food Agric. 2020, 10, 2259. [Google Scholar] [CrossRef] [PubMed]
- Pasquini, C. Near infrared spectroscopy: A mature analytical technique with new perspectives e a review. Anal. Chim. Acta 2018, 1026, 8–36. [Google Scholar] [CrossRef] [PubMed]
- Xue, J.; Ye, L.; Li, C.; Zhang, M. Rapid and nondestructive measurement of glucose in a skin tissue phantom by near-infrared spectroscopy. Optik 2018, 170, 30–36. [Google Scholar] [CrossRef]
- Sousa, P.; Soares, A.; Castanho, A.; So, A.; Oliveira, J.; Brites, C. Optimization of rice amylose determination by NIR-spectroscopy using PLS chemometrics algorithms. Food Chem. 2018, 242, 196–204. [Google Scholar]
- Zhang, R.; Li, Z.; Pan, J.; Zhang, R.; Li, Z.; Pan, J. Coupling discrete wavelet packet transformation and local correlation maximization improving prediction accuracy of soil organic carbon based on hyperspectral reflectance. Trans. Chin. Soc. Agric. Eng. 2017, 33, 175–181. [Google Scholar]
- Xie, S.; Xiang, B.; Yu, L.; Deng, H. Tailoring noise frequency spectrum to improve NIR determinations. Talanta 2009, 80, 895–902. [Google Scholar] [CrossRef]
- Morgan, C.L.S.; Waiser, T.H.; Brown, D.J.; Hallmark, C.T. Simulated in situ characterization of soil organic and inorganic carbon with visible near-infrared diffuse reflectance spectroscopy. Geoderma 2009, 151, 249–256. [Google Scholar] [CrossRef]
- Abasi, S.; Minaei, S.; Jamshidi, B.; Fathi, D. Rapid measurement of apple quality parameters using wavelet de-noising transform with Vis/NIR analysis. Sci. Hortic. (Amst.) 2019, 252, 7–13. [Google Scholar] [CrossRef]
- Song, J.; Li, G.; Yang, X. Optimizing genetic algorithm-partial least squares model of soluble solids content in Fukumoto navel orange based on visible-near-infrared transmittance spectroscopy using discrete wavelet transform. J. Sci. Food Agric. 2019, 99, 4898–4903. [Google Scholar] [CrossRef] [PubMed]
- Dun, L.; Chen, C.; Li, J.; Zhao, Y.; Chen, S.; Hou, Z. Research on robustness of support vector regression model base on near infrared spectroscopy of maize and Discrete wavelet transform. J. Henan Inst. Sci. Technol. Sci. Ed. 2017, 45, 43–47. [Google Scholar]
- Guyon, I.; Elisseeff, A. An introduction to variable and feature selection isabelle. J. Mach. Learn. Res. 2003, 3, 1157–1182. [Google Scholar]
- Cai, W.; Li, Y.; Shao, X. A variable selection method based on uninformative variable elimination for multivariate calibration of near-infrared spectra. Chemom. Intell. Lab. Syst. 2008, 90, 188–194. [Google Scholar] [CrossRef]
- Jarvis, R.M.; Goodacre, R. Genome analysis Genetic algorithm optimization for pre-processing and variable selection of spectroscopic data. Bioinformatics 2005, 21, 860–868. [Google Scholar] [CrossRef] [PubMed]
- Degenhardt, F.; Seifert, S.; Szymczak, S. Evaluation of variable selection methods for random forests and omics data sets. Brief. Bioinform. 2017, 20, 1–12. [Google Scholar] [CrossRef] [PubMed]
- Rgaard, L.N.; Saudland, A.; Wagner, J.; Nielsen, J.P.; Unck, L.M.; Engelsen, S.B. Interval partial peast-squares regression (iPLS): A comparative chemometric study with an example from Near-Infrared Spectroscopy. Appl. Spectrosc. 2000, 54, 413–419. [Google Scholar] [CrossRef]
- Jiang, H.; Liu, G.; Mei, C.; Yu, S.; Xiao, X.; Ding, Y. Measurement of process variables in solid-state fermentation of wheat straw using FT-NIR spectroscopy and synergy interval PLS algorithm. Spectrochim. Acta Part A Mol. Biomol. Spectrosc. 2012, 97, 277–283. [Google Scholar] [CrossRef]
- Deng, B.C.; Yun, Y.H.; Cao, D.S.; Yin, Y.L.; Wang, W.T.; Lu, H.M.; Luo, Q.Y.; Liang, Y.Z. A bootstrapping soft shrinkage approach for variable selection in chemical modeling. Anal. Chim. Acta 2016, 908, 63–74. [Google Scholar] [CrossRef]
- Li, H.; Liang, Y.; Xu, Q.; Cao, D. Model population analysis for variable selection. J. Chemom. 2010, 16, 418–423. [Google Scholar] [CrossRef]
- Wang, K.; Du, W.; Long, J. Near-infrared wavelength-selection method based on joint mutual information and weighted bootstrap sampling. IEEE Trans. Ind. Inform. 2020, 3203, 1–10. [Google Scholar] [CrossRef]
- Yan, H.; Song, X.; Tian, K.; Chen, Y. Quantitative determination of additive Chlorantraniliprole in Abamectin preparation: Investigation of bootstrapping soft shrinkage approach by mid-infrared spectroscopy. Spectrochim. Acta Part A Mol. Biomol. Spectrosc. 2017, 191. [Google Scholar] [CrossRef]
- Zhang, Y.; Sun, J.; Li, J.; Wu, X.; Dai, C. Quantitative analysis of cadmium content in tomato leaves based on hyperspectral image and feature selection. Appl. Eng. Agric. Vol. 2018, 34, 789–798. [Google Scholar] [CrossRef]
- Fei, Q.; Li, M.; Wang, B.; Huan, Y.; Feng, G.; Ren, Y. Analysis of cefalexin with NIR spectrometry coupled to artificial neural networks with modified genetic algorithm for wavelength selection. Chemom. Intell. Lab. Syst. 2009, 97, 127–131. [Google Scholar] [CrossRef]
- Friedel, M.; Patz, C.D.; Dietrich, H. Comparison of different measurement techniques and variable selection methods for FT-MIR in wine analysis. Food Chem. 2013, 141, 4200–4207. [Google Scholar] [CrossRef] [PubMed]
- Santos, B.; Fernandes, F.; Neto, G.; Kawakami, R.; Galva, H. NIR spectrometric determination of quality parameters in vegetable oils using i PLS and variable selection. Sci. Direct 2008, 41, 341–348. [Google Scholar]
- Suhandy, D.; Yulia, M.; Ogawa, Y.; Kondo, N. Prediction of L-Ascorbic acid using FTIR-ATR terahertz spectroscopy combined with interval partial least Squares (iPLS) regression *. Eng. Agric. Environ. Food 2013, 6, 111–117. [Google Scholar] [CrossRef]
- Li, X.; Sun, C.; Luo, L.; He, Y. Determination of tea polyphenols content by infrared spectroscopy coupled with iPLS and random frog techniques. Comput. Electron. Agric. 2015, 112, 28–35. [Google Scholar] [CrossRef]
- Jiang, H.; Xu, W.; Chen, Q. Comparison of algorithms for wavelength variables selection from near-infrared (NIR) spectra for quantitative monitoring of yeast (Saccharomyces cerevisiae) cultivations. Spectrochim. Acta Part A Mol. Biomol. Spectrosc. 2019, 214, 366–371. [Google Scholar] [CrossRef]
- Yang, Z.; Xiao, H.; Zhang, L.; Feng, D.; Zhang, F.; Jiang, M.; Sui, Q.; Jia, L. Fast determination of oxides content in cement raw meal using NIR-spectroscopy and backward interval PLS with genetic algorithm. Spectrochim. Acta Part A Mol. Biomol. Spectrosc. 2019, 223, 117327. [Google Scholar] [CrossRef]
- Rizvi, T.S.; Mabood, F.; Ali, L.; Al-Broumi, M.; Al Rabani, H.K.M.; Hussain, J.; Jabeen, F.; Manzoor, S.; Al-Harrasi, A. Application of NIR spectroscopy coupled with PLS regression for quantification of total polyphenol contents from the fruit and aerial parts of citrullus colocynthis. Phytochem. Anal. 2018, 29, 16–22. [Google Scholar] [CrossRef]
- Virginia, E.; Douglas, D.; Fernandes, D.S.; César, M.; De Araújo, U.; Henrique, P.; Dias, G.; Inês, M.; Maciel, S. Simultaneous determination of goat milk adulteration with cow milk and their fat and protein contents using NIR spectroscopy and PLS algorithms. LWT Food Sci. Technol. 2020, 127, 109427. [Google Scholar]
- Ali, L.; Mabood, F.; Rizvi, T.S.; Rehman, N.U.; Arman, M.; Al-shidani, S.; Al-abri, Z.; Hussain, J.; Al-harrasi, A. Total polyphenols quantification in Acridocarpus orientalis and Moringa peregrina by using NIR spectroscopy coupled with PLS regression. Chem. Data Collect. 2018, 13–14, 104–112. [Google Scholar] [CrossRef]
- Galvão, R.K.H.; Araujo, M.C.U.; José, G.E.; Pontes, M.J.C.; Silva, E.C.; Saldanha, T.C.B. A method for calibration and validation subset partitioning. Talanta 2005, 67, 736–740. [Google Scholar] [CrossRef]
- Chemistry, P.A. Partial least-squares regression: A tutorial. Anal. Chim. Acta 1986, 186, 1–17. [Google Scholar]
- Costa, D.d.S.; Mesa, N.F.O.; Freire, M.S.; Ramos, R.P.; Mederos, B.J.T. Development of predictive models for quality and maturation stage attributes of wine grapes using vis-NIR reflectance spectroscopy. Postharvest Biol. Technol. 2019, 150, 166–178. [Google Scholar] [CrossRef]
- Chen, D.; Chen, Z.; Grant, E. Adaptive wavelet transform suppresses background and noise for quantitative analysis by Raman spectrometry. Anal. Bioanal. Chem. 2011, 400, 625–634. [Google Scholar] [CrossRef]
- Walczak, B.; Poppi, R.J.; Noord, O.E.D.; Massart, D.L.; Brussel, V.U.; Brussels, B. Application of wavelet transform to extract the relevant component from spectral data for multivariate calibration. Anal. Chem. 1997, 69, 4317–4323. [Google Scholar]
- Ehrentreich, F. Wavelet transform applications in analytical chemistry. Anal. Bioanal. Chem. 2002, 372, 115–121. [Google Scholar] [CrossRef]


| Variable Set | RMSEC | RMSECV | RMSEP | n_VAR | |||
|---|---|---|---|---|---|---|---|
| L0 | 0.9266 | 0.2713 | 0.8529 | 0.3855 | 0.9085 | 0.2349 | 3112 |
| L1 + BOSS | 0.9326 ± 0.0396 | 0.2588 ± 0.0689 | 0.9336 ± 0.0019 | 0.2581 ± 0.0037 | 0.9412 ± 0.0637 | 0.2355 ± 0.1064 | 9.8333 ± 2.8333 |
| L2 + BOSS | 0.9304 ± 0.0125 | 0.2641 ± 0.0229 | 0.9236 ± 0.0011 | 0.2768 ± 0.0020 | 0.9470 ± 0.0113 | 0.2247 ± 0.0230 | 16 ± 4 |
| L3 + BOSS | 0.9250 ± 0.0120 | 0.2742 ± 0.0213 | 0.9300 ± 0.0011 | 0.2650 ± 0.0021 | 0.9421 ± 0.0055 | 0.2351 ± 0.0110 | 10.5000 ± 3.5000 |
| L4 + BOSS | 0.9380 ± 0.0114 | 0.2494 ± 0.0220 | 0.9289 ± 0.0014 | 0.2672 ± 0.0011 | 0.9431 ± 0.0094 | 0.2328 ± 0.0199 | 14.1000 ± 2.9000 |
| L5 + BOSS | 0.9304 ± 0.0133 | 0.2641 ± 0.0244 | 0.9271 ± 0.0013 | 0.2705 ± 0.0012 | 0.9447 ± 0.0141 | 0.2292 ± 0.0298 | 14.1000 ± 2.9000 |
| L6 + BOSS | 0.9212 ± 0.0026 | 0.2811 ± 0.0047 | 0.9131 ± 0.0010 | 0.2953 ± 0.0017 | 0.9512 ± 0.0021 | 0.2158 ± 0.0047 | 14.9333 ± 2.9333 |
| V | 0.9410 | 0.2404 | 0.9171 | 0.2851 | 0.9513 | 0.2236 | 55 |
| Variable Set | RMSEC | RMSECV | RMSEP | n_VAR | |||
|---|---|---|---|---|---|---|---|
| GA | 0.9318 | 0.2589 | 0.8908 | 0.3287 | 0.9420 | 0.2421 | 870 |
| iPLS | 0.9294 | 0.2617 | 0.9021 | 0.3088 | 0.9232 | 0.2838 | 280 |
| V | 0.9410 | 0.2404 | 0.9171 | 0.2851 | 0.9513 | 0.2236 | 55 |
© 2020 by the authors. Licensee MDPI, Basel, Switzerland. This article is an open access article distributed under the terms and conditions of the Creative Commons Attribution (CC BY) license (http://creativecommons.org/licenses/by/4.0/).
Share and Cite
Zhang, M.; Guo, J.; Ma, C.; Qiu, G.; Ren, J.; Zeng, F.; Lü, E. An Effective Prediction Approach for Moisture Content of Tea Leaves Based on Discrete Wavelet Transforms and Bootstrap Soft Shrinkage Algorithm. Appl. Sci. 2020, 10, 4839. https://doi.org/10.3390/app10144839
Zhang M, Guo J, Ma C, Qiu G, Ren J, Zeng F, Lü E. An Effective Prediction Approach for Moisture Content of Tea Leaves Based on Discrete Wavelet Transforms and Bootstrap Soft Shrinkage Algorithm. Applied Sciences. 2020; 10(14):4839. https://doi.org/10.3390/app10144839
Chicago/Turabian StyleZhang, Min, Jiaming Guo, Chengying Ma, Guangjun Qiu, Junjie Ren, Fanguo Zeng, and Enli Lü. 2020. "An Effective Prediction Approach for Moisture Content of Tea Leaves Based on Discrete Wavelet Transforms and Bootstrap Soft Shrinkage Algorithm" Applied Sciences 10, no. 14: 4839. https://doi.org/10.3390/app10144839
APA StyleZhang, M., Guo, J., Ma, C., Qiu, G., Ren, J., Zeng, F., & Lü, E. (2020). An Effective Prediction Approach for Moisture Content of Tea Leaves Based on Discrete Wavelet Transforms and Bootstrap Soft Shrinkage Algorithm. Applied Sciences, 10(14), 4839. https://doi.org/10.3390/app10144839


