Article

The Synthesis and Effect of Silver Nanoparticles on the Adsorption of Cu2+ from Aqueous Solutions

Department of Chemistry, College of Science, Princess Nourah bint Abdulrahman University, Riyadh 11671, Saudi Arabia
*
Author to whom correspondence should be addressed.
Appl. Sci. 2020, 10(14), 4840; https://doi.org/10.3390/app10144840
Submission received: 30 May 2020 / Revised: 17 June 2020 / Accepted: 13 July 2020 / Published: 14 July 2020
(This article belongs to the Section Chemical and Molecular Sciences)

Abstract

:
The adsorption of Cu2+ ions from an aqueous solution using AgNPs synthesized from Convolvulus arvensis leaf extract was investigated. The characterization of AgNPs was investigated before and after the adsorption of Cu2+ ions via Fourier-transform infrared spectroscopy (FTIR), energy-dispersive X-ray spectroscopy (EDS), and scanning electron microscopy (SEM) analyses. The adsorbent contained various functional groups in addition to the AgNPs, which contributed to the Cu2+ ions adsorption. The silver nanoparticle surface consisted of spherical particles and deep pores, which adsorbed numerous Cu2+ ions. The influences of dosage, pH, and contact time on adsorption of 10 and 50 mg/L Cu2+ at 298 K, and initial Cu2+ concentrations at 298 and 323 K were studied. It was found that the highest percentage of Cu2+ ions adsorbed from an aqueous solution was 98.99%; the aqueous solution had 10 mg/L of Cu2+ ions and 0.2 g of AgNPs, at pH 12 and 298 K. A pseudo-second kinetics model offered the most accurate description of the process of adsorption. The process of Cu2+ adsorption more resembled a Langmuir rather than a Freundlich isotherm model, including chemical and physical mixed adsorption (mixed adsorption) processes, and was exothermic and spontaneous.

1. Introduction

The water contamination resources with heavy metals is a serious problem of environments worldwide. Numerous heavy metals are known to be toxic, dangerous, and non-degradable. Copper is used to manufacture various products, such as metal wires, sheet metals, metal pipes, metal coatings, and fertilizers. It is released into water, where it forms copper compounds or becomes bound to the molecules suspended in the water [1]. Although copper is necessary for human health, it may cause anemia, gastrointestinal damage, and dermatitis if its concentration exceeds the permissible limit. It can also destroy fish and marine plants if it is found in a large amount in sea water [2]. Therefore, copper adsorption from aqueous solutions is of great importance, and to find methods to do this, several technologies have been developed, including adsorption, ion exchange, electrochemical processing, and nanotechnology [3]. Nanotechnology has developed rapidly in various application areas, such as industry, medicine, and water treatment [4].
Researchers are interested in studying water treatment with the use of chemical, physical, and nanotechnological methods. One example of nanomaterials that have been exploited for this purpose is silver nanoparticles (AgNPs) [5]. AgNPs are characterized by their anti-bacterial properties and easy separation. Moreover, they possess catalytic activity and a relatively high adsorption capacity and surface area for their small size [6]. In addition to their use in water and air purification, they are used in biomedical applications, food production, cosmetics, household products, and the clothing industry [7].
Biosynthesis is preferable compared to other methods [8] because it is environmentally friendly, cost effective, and less time-consuming. Biological materials include plant extracts, bacteria, fungi, enzymes, and other substances [9] such as Ganoderma applanatum [10], Staphylococcus aureus, Kocuria rhizophila and Bacillus thuringiensis [11], Phoma [12], and Endophytic fungi [13]. Plant extracts are considered to be the best biological materials because they are abundant and their chemical compositions facilitates the formation of nanoparticles by functioning as reducing agents that reduce silver ions to the silver element. Plant extracts are also inexpensive and quick to prepare compared to microbes that require sterilization conditions and time to produce them [8], and possess active components that improve the effectiveness of nanoparticles [14,15], such as extracts of Artemisia annua and Sida acuta [16], Phoenix dactylifera fruits [3], Eriobotrya japonica (Thunb.) [17], Acalypha hispida [18], and Cassia auriculata [19].
Convolvulus arvensis (field bindweed) is a climbing plant that covers wide areas of building frontages, owing to its aesthetic value. Some types of C. arvensis have medicinal uses, whereas others are highly toxic [20].
This study aimed to synthesize AgNPs from an extract of C. arvensis leaves and to test its effectiveness as an adsorbent material for the treatment of aqueous solutions from dissolved Cu2+ ions. The C. arvensis leaf extract, AgNPs, and Cu2+ were characterized via Fourier-transform infrared spectroscopy (FTIR), energy-dispersive X-ray spectroscopy (EDS) and SEM analysis. The adsorption of Cu2+ by the AgNPs was studied through of the effects of the dosage, pH, adsorption isotherm thermodynamic, and kinetic models.

2. Experimental

2.1. Materials

The chemicals Cu(Cl)2·4H2O (98%) and AgNO3 were purchased from Techno Pharmchem (Delhi, India), HCl (37%), and NaOH (97%) were purchased from Panreac Quimica (Barcelona, Spain).

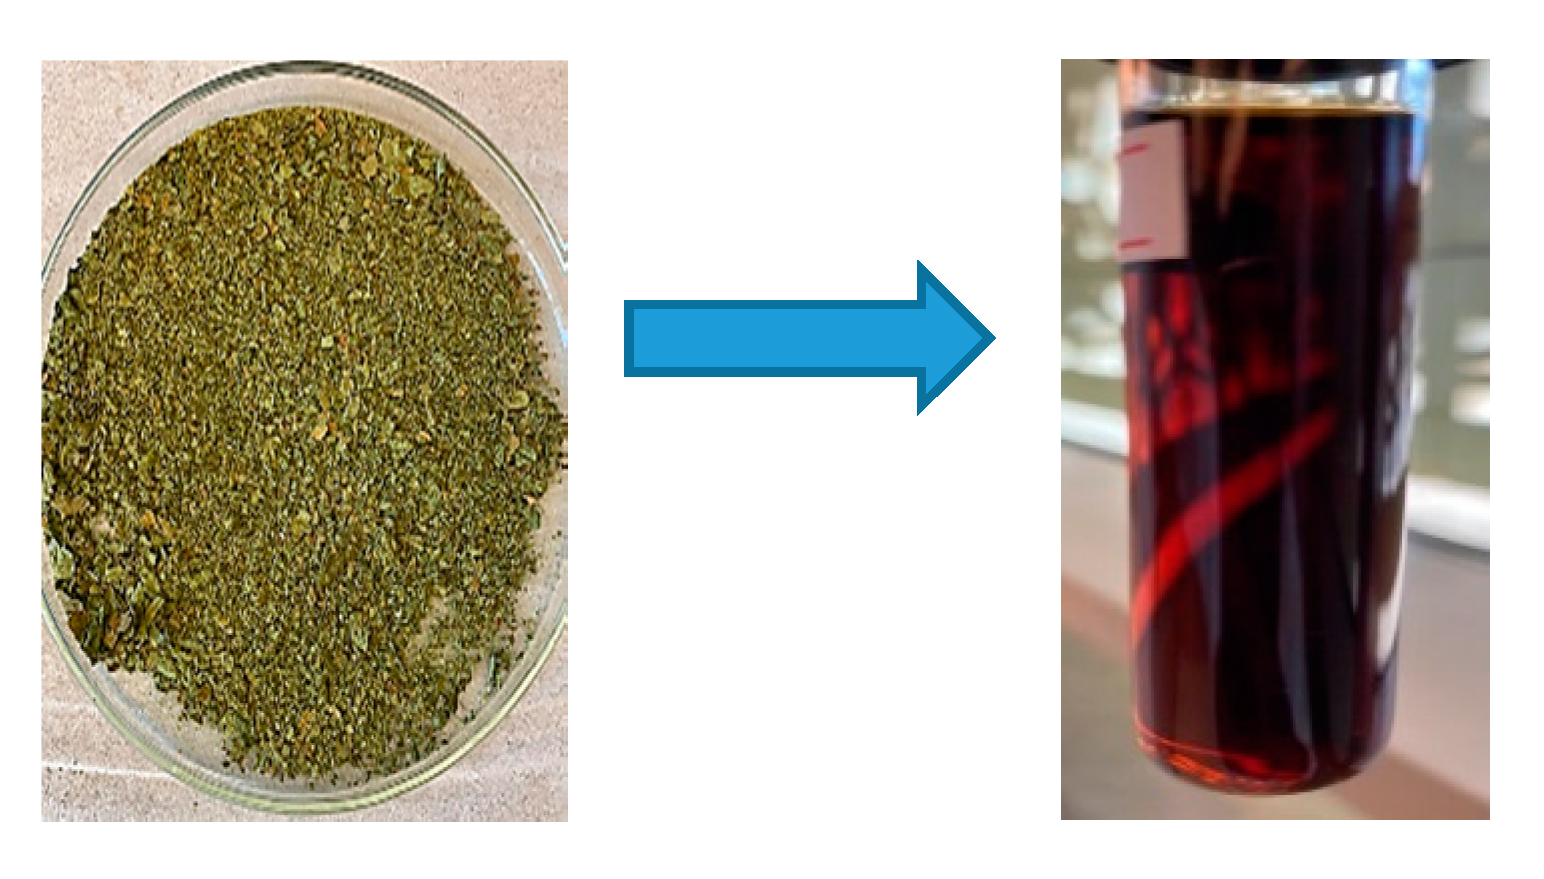
2.2. Preparation of the C. arvensis Leaf Extract

The leaves of a C. arvensis were collected, washed, dried, and cut into small pieces. C. arvensis extract was prepared using distilled water, and the mixture was stirred for 30 min at 60 °C. It was filtered using Whatman No. 1 filter paper (Figure 1) [20].

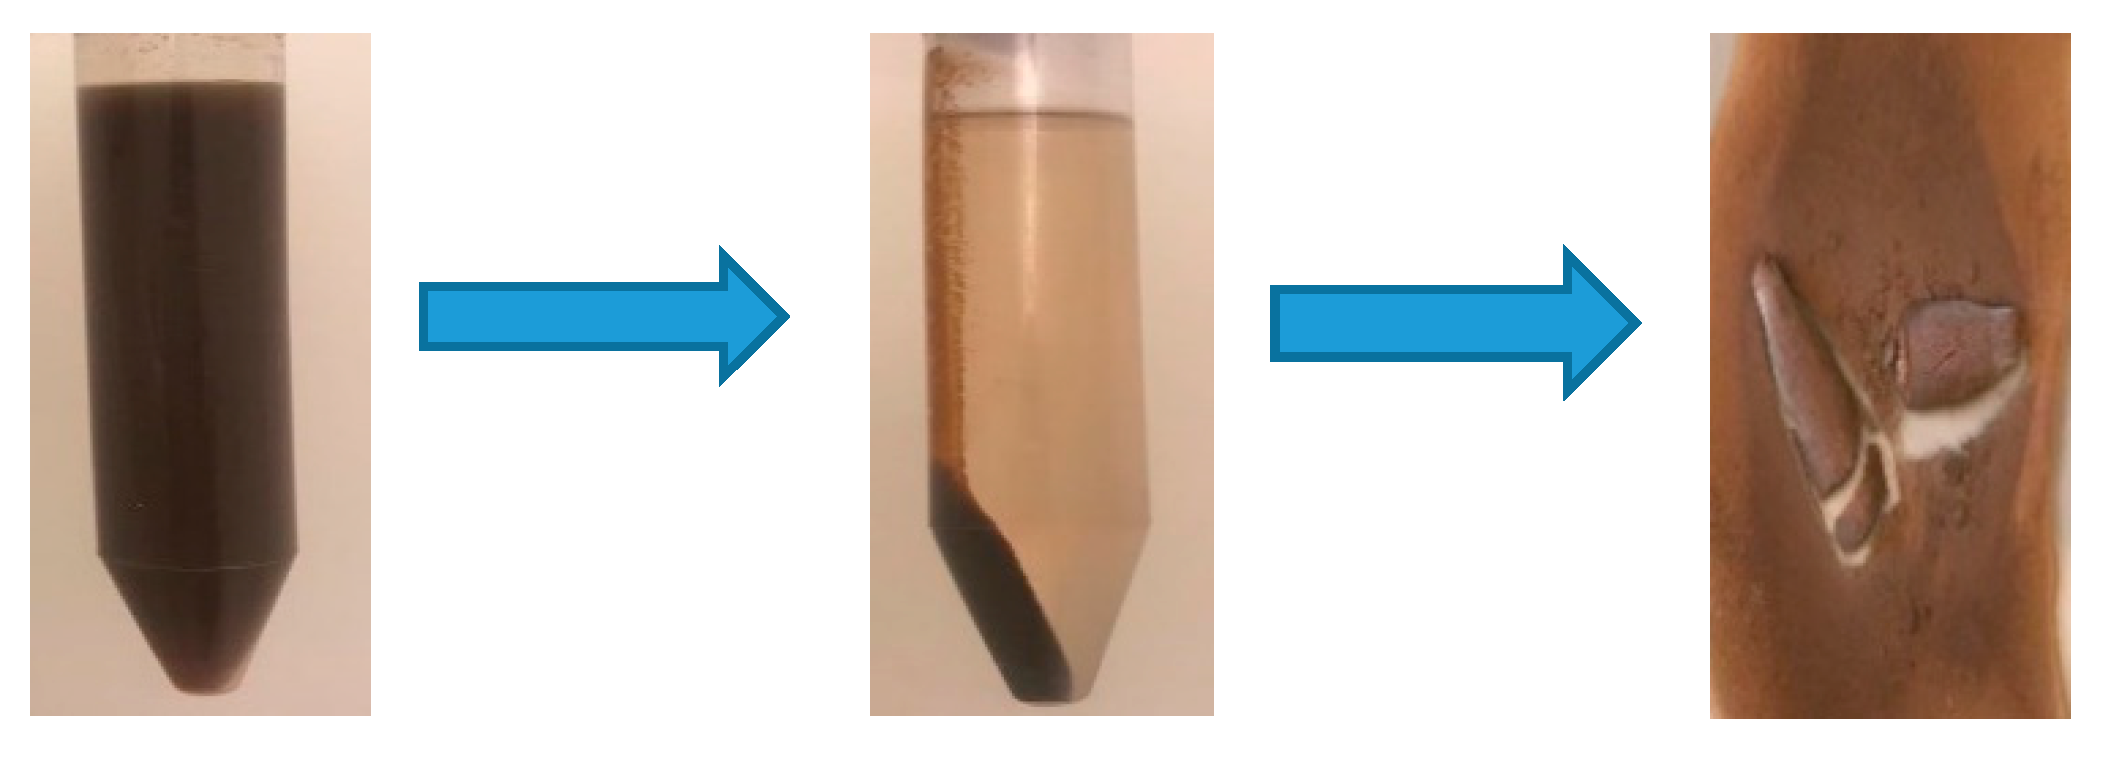
2.3. Synthesis of the AgNPs

For the preparation of AgNPs, a 5 mL of the AgNO3 (1 M) and 10 mL of 1 M NaOH were added to 10 mL of the C. arvensis leaf extract, with continuous stirring for 15 min and heated to 50 °C to ensure the formation of AgNPs was complete and that they were stable. The solution rapidly changed color, indicating the direct formation of silver. The centrifugation was used to separating AgNPs from the solution, then the precipitate was dried and kept for later use (Figure 2).

2.4. Preparation of the Test Solution

The stock solution of Cu2+ (1000 mg/L) was prepared. The stock solution was diluted with distilled water for the initial solutions with two different concentrations (10 and 50 mg/L).
Experiments on the adsorption of Cu2+ from aqueous solutions were conducted at both 10 and 50 mg/L concentrations at 298 K and an initial pH of 7. The effects of the AgNPs dosage (0.05, 0.1, 0.15 and 0.2 g) and the pH (2, 5, 7, 9, 12) using 0.2 g of AgNPs at 298 K, respectively, on the Cu2+ adsorption were investigated. The pH adjustments were adjusted using 1 M of NaOH and 1 M of HCl. The contact time effect on the Cu2+ adsorption was studied for 150 min. The effect of the Cu2+ initial concentration (from 10 to 50 mg/L) on the Cu2+ adsorption using the AgNPs (0.2 g) was studied at an initial pH of 7, and at temperatures of 298 K and 323 K. The mixtures were shaken at 100 rpm for 3 h using an orbital “rotaterm” and a linear shaker, and were then filtered. The concentrations of Cu2+ were determined via plasma mass spectrometry (inductively coupled plasma, ICP).
The amount of the Cu2+ absorbed (qe (mg/g)) was calculated using the following equation:
q e   = ( C 0 C e )   V m ,
where C0 and Ce (mg/L) are the concentrations of initial and equilibrium, respectively, V (L) is the solution volume, and m is the adsorbent mass (g).
The adsorption percentage of Cu2+ (% Ads(Cu2+)) was calculated as follows:
%   A d s ( C u 2 + )   = ( C 0 C e ) C 0   × 100 .
To describe the adsorbent behavior, the models of four kinetic and two adsorption isotherm were used and, to describe the adsorption type, the thermodynamic parameters (ΔG°, ΔH° and ΔS°) were calculated.

2.5. AgNPs Characterization

The FTIR spectra and the surface morphology were investigated for AgNPs. FTIR was performed using a FTIR spectrophotometer (type spectrum 100 FT-IR spectrometer, PerkinElmer, Waltham, MA, USA) over a wavenumber range of 400–4000 cm−1. Energy dispersive spectroscopy (EDS) and SEM were performed using a JSM-6380 LA model scanning electron microscope (JEOL, San Diego, CA, USA) at an accelerating voltage of 0.5–30 kV and a high resolution of 3.0 nm.

3. Results and Discussion

3.1. Characterization of the Adsorbent

Figure 3 presents the functional groups in the AgNPs before and after the adsorption of Cu2+. It was noted that the peaks at 3423, 2925, 1623, 1384, 1321, 1073, 766, 606, and 514 cm−1 were referred to the functional groups in the AgNPs synthesized using the C. arvensis leaf extract. The stretching of the functional groups in the AgNPs were associated with the peaks at 3408, 2918, 1624, 1324, 1000, 782, and 538 cm−1 arising after the Cu2+ adsorption. It was observed that the peaks at 3423 and 3408 cm−1 in the AgNPs spectra before and after the Cu2+ adsorption, respectively, appeared as a result of the stretching of the N–H or O–H groups. The secondary peaks at 2925 and 2918 cm−1 were caused by the stretching of the C–H groups. The band regions at 1623 and 1624 cm−1 were related to the presence of C=O bonds. In addition, after the adsorption of Cu2+ ions, the two absorption peaks that appeared at 1384 and 1321 cm−1 in the AgNPs spectrum agreed to the groups of N=O and N–O, respectively, whereas the peak at 1324 cm−1 was ascribed to the N–O band of the AgNPs [3,4,8,21]. The peaks at 1073 and 1000 cm−1 were due to the N–H, C–N, or C–O groups extending, and the peaks at 766, 782, and 514–538 cm−1 were due to the stretching of the H3CO and C–H groups [14,22].
The above results demonstrate that the presence of the functional groups, including carboxyl, facilitate the adsorption process of Cu2+ via ion exchange. Moreover, the presence of the hydroxyl groups in the adsorbent allows the coordination bonds to form with the Cu2+ ions.
EDS was used to analyze the AgNPs synthesized using the C. arvensis leaf extract before the Cu2+ ions adsorption and after, as displayed in Figure 4a. The figure presents a high-intensity peak in the optical absorption range at 3 keV for the adsorption range of AgNPs, indicating that the C. arvensis leaf extract successfully contributed to the synthesis of AgNPs. The spectrum also identifies C, O, Na, Ca, Cl, and Cd peaks, indicating that the AgNPs contain organic and inorganic compounds [8,21,23]. The EDS spectrum of the AgNPs after the adsorption of Cu2+ (Figure 4b) presented a decrease in the percentages of the Ag, Na, and Cd elements, and the emergence of a Cu2+ peak indicated the adsorption of Cu2+ ions on the AgNPs’ surface [23].
The surface morphology of the AgNPs was performed using a SEM analysis before and after the Cu2+ adsorption. Spherical AgNPs were observed to form with the C. arvensis leaf extract (Figure 5a), which confirmed that the synthetic AgNPs were well crystallized [6,24]. Figure 5b also presents the change in the surface morphology of the AgNPs after the adsorption of Cu2+ ions [22]. Changes in the shapes of the crystals and the pores on the surface were observed, as well as the surface coverage after the adsorption of most Cu2+ ions [22,25].

3.2. Effect of the AgNPs Dosage

The AgNPs’ dosage effect on the adsorption of Cu2+ was studied. As presented in Figure 6a, when the AgNPs’ dosage increased, the Cu2+ adsorption increased. Specifically, the percentage of Cu2+ adsorption increased from 31% to 91% with a 10 mg/L concentration and from 23% to 73% with a 50 mg/L concentration. The increase in the percentage of Cu2+ adsorption was due to the increase in the area of the AgNPs’ surface and the consequent increase in the number of active sites and their availability for ion and electronic exchanges with the Cu2+ ions that were dissolved in the aqueous solutions [25,26].

3.3. Effect of the pH

An aqueous solution’s pH is important in adsorption processes, because pH affects the type of charge of the adsorbent surface, and thus the adsorption ratio of Cu2+ from it. The experiments on the pH effect were conducted at various values of pH between 2 and 12, to evaluate the Cu2+ adsorption from aqueous solutions by the AgNPs. The percentage of the Cu2+ adsorption increased rapidly with the increase in the pH from 2 to 7; subsequently, with the pH increased from 7 to 12, the Cu2+ adsorption increased slightly, as displayed in Figure 6b. The reason for the increase in the percentage of Cu2+ adsorption is due to the increase in the concentration of the OH¯ ions on the AgNPs’ surface, with an increased pH from 2 to12, thus charging the surface with a negative charge, which increased the potential of the Cu2+ adsorption on the AgNPs’ surface. [27]. Moreover, the presence of functional groups in the C. arvensis leaf extract, such as C=O and C–O, enhanced the ionic bonding with Cu2+ ions. Thus, adsorbed amount of the Cu2+ on the AgNPs’ surface increased [15].

3.4. Effect of the Contact Time

The contact time effect, which ranged from 30 to 180 min, on the Cu2+ adsorption by the AgNPs was investigated. Figure 6c shows that the adsorption percentage of Cu2+ increases for both the low and high concentrations (10 and 50 mg/L). The percentage of Cu2+ adsorption increased rapidly during the initial stage (up to 60 min). This is because the active sites on the AgNPs’ surface were available. Subsequently, the adsorption of Cu2+ for both the concentrations decreased as the availability of the active sites for adsorption reduced over time [25].

3.5. Effects of the Cu2+ Concentration at 298 and 323 K

The effect of the initial concentration of Cu2+ ions at 298 and 323 K was studied. Figure 6d shows that the percentage of the Cu2+ adsorption decreased from 91.10% to 80.06% as the concentration increased from 10 to 50 mg/L. This was due to an increased competitive dispersion of the Cu2+ ions in the pores available on the AgNPs’ surface, thus preventing them from reaching the deep pores of the AgNPs [27]. The adsorption of Cu2+ by the AgNPs also decreased with an increasing temperature, from 298 to 323 K (Figure 6d), possibly owing to a decrease in the surface activity, dissolution of the active sites on the adsorbent surface, or bond breakage with the increased temperature [15].

3.6. Kinetic Models

According to the data obtained from investigating the effect of time on the Cu2+ adsorption by AgNPs, different kinetic models were used to understand the Cu2+ adsorption mechanism by AgNPs to identify the rate-limiting step. The pseudo-first-order (PFO), pseudo-second-order (PSO), intraparticle diffusion (IPD), and liquid film diffusion (LFD) kinetic models are expressed as follows [28,29]:
l o g   ( q e q t )   = l o g   q e K 1 t 2.303 ,      
t q t   = 1 K 2 q e 2 + t q e ,    
l n   ( 1 F ) = K l f d   t + C l f d ,    
q t   = K i p d   t 1 / 2 C i p d ,        
where qe and qt represent the adsorption amounts of Cu2+ at equilibrium and at time t, respectively, K1 is the rate constant of the pseudo-first-order reaction, K2 is rate constant of the pseudo-second-order reaction, Kipd is the intraparticle diffusion coefficient, Cipd is a constant that provides information on the thickness of the boundary layer, F is the fractional attainment of equilibrium (F = qt/qe), Klfd is the rate constant of the liquid film diffusion reaction, and Clfd is the constant of the boundary layer.
Figure 7 shows the four kinetic diagrams of the Cu2+ (10 and 50 mg/L) adsorbed by AgNPs. The parameters for the four kinematic models are recorded in Table 1. The experimental data did not agree with the pseudo-first-order model. However, the kinetic data fitted well with the pseudo-second-order model: R2 values were 0.999 with 10 mg/L and 0.984 with 50 mg/L of Cu2+ [30]. The calculated qe values were 0.24 mg/g with 10 mg/L and 2 mg/g with 50 mg/L of Cu2+, which were consistent with the experimental qe values of 0.24 mg/g for 10 mg/L and 2 mg/g for 50 mg/L of Cu2+ [7]. Figure 7 evident that the AgNPs is adsorbed Cu2+ ions in two or more steps. This suggests that the Cu2+ adsorption process involves multiple mechanisms. The first step is the diffusion of Cu2+ on the AgNPs surface, and the next step is the spread of Cu2+ within the pores, to reach the final equilibrium. The correlation coefficients for the adsorption of Cu2+ by the AgNPs based on the liquid film diffusion model (R2) were 0.960 and 0.986 for 10 and 50 mg/L of Cu2+, respectively, indicating that the film diffusion is one of the factors that controls the process of the adsorption of Cu2+ [31].

3.7. Adsorption Isotherm Models

The adsorption isotherm models of Langmuir and Freundlich were used to illustrate the mechanism of Cu2+ adsorption using the AgNPs.
The Langmuir and Freundlich adsorption isotherm models are expressed as follows [32]:
C e q e = 1 K L q m + C e q m ,
R L = 1 1 + K L C 0 ,
l o g   q e = l o g   K F + 1 n   l o g   C e ,
where Ce (mg/L) is the concentration of the adsorbate at equilibrium, qe is the capacity of adsorption at equilibrium, qm is the maximum capacity of adsorption, KL is the constant of Langmuir adsorption at equilibrium, and n is the coefficient of Freundlich at equilibrium.
The Langmuir isotherm hypothesis is valid for a monolayer forming on the adsorbent surface, whereas the Freundlich isotherm is an experimental equation that is applicable to a multilayer adsorption process.
Figure 8, shows that there is a linear relationship between the Ce/qe and Ce and between the log qe and log Ce for the Cu2+ adsorption by the AgNPs. The plots slopes and the correlation coefficients (R2) are recorded in Table 2. The R2 values indicated that the Langmuir imore suitable for the experimental than the Freundlich; moreover, the theoretical maximum adsorption capacity of a monolayer coverage (qm) was shown to be higher than the experimental capacity [33].
The physicochemical constant of dimensional was applied as a factor of separation (RL) to determine whether the adsorption process was favorable, which is expressed in Equation (8) [31]. RL, the separation factor for the adsorption of Cu2+ by the AgNPs, was 0.254 at 298 K and 0.426 at 323 K, indicating a favorable adsorption.
Generally, RL indicates that the isothermal type is favorable (0 < RL < 1), linear (RL = 1), unfavorable (RL > 1), or irreversible (RL = 0).
The values of n to assess the adsorption process suitability were 1.883 at 298 K and 1.807 at 323 K, indicating that the Cu2+ ions adsorption by the AgNPs is favorable [30].
Generally, the value of n is the adsorption intensity: n = 1 indicates the homogeneity of adsorption sites and lack of interaction between occupied sites; when n is between 1 and 10 it indicates a favorable adsorption, and when n < 1 a cooperative adsorption is indicated. From the above results, it was found that the Cu2+ ions adsorption by the AgNPs is a favorable process and that the Cu2+ ions are adsorbed on the AgNPs surface as monolayers and multilayers [15].

3.8. Thermodynamic Models

Thermodynamic investigations are also important approaches to describe the spontaneous processes of the Cu2+ adsorption from aqueous solutions by the AgNPs. Based on the results obtained from studying the effect of the initial Cu2+ concentration on the Cu2+ adsorption by the AgNPs at 298 and 323 K, the Gibbs free energy (ΔG°), the enthalpy (ΔH°), and the entropy (ΔS°), were calculated using the following equations [33,34]:
Δ G ° = R T l n ( K L   M a d s o r b a t e × 10 3 × 55.5 ) ,
l n   ( K 1 K 2 ) = Δ H ° a d s ( 1 T 2 1 T 1   ) ,
Δ G ° a d s = Δ H ° a d s T Δ S ° a d s ,
where M is the molecular weight of the adsorbate, Κ (L/mg) is the equilibrium constant of the experimental, 55.5 (mol/L) is the concentration of water, R is the constant of the universal gas (8.314 mol/K), and T (K) is the solution temperature absolute.
The values of ΔG°, ΔH°, and ΔS° are listed in Table 3. The negative values of ΔG° indicate that the process of Cu2+ ions adsorption by the AgNPs is natural and spontaneous [35], and because these values ranged from −40 to −20 kJ mol−1, it suggests that the adsorption is a mixed type (physicochemical adsorption). Generally, the values of ΔG° of less than −20 kJ mol−1, more than −40 kJ mol−1, and between −40 and −20 kJ mol−1 indicate that the adsorption is physical adsorption, chemical adsorption, and physicochemical adsorption, respectively.
In addition, the negative values of ΔH° indicate that the adsorption is exothermic, and the positive values of ΔS° indicate an increase in the randomness because of the competition of the Cu2+ ions on the active AgNPs’ surface sites [35].

4. Conclusions

The results of FTIR, EDS, and SEM indicated that spherical AgNPs synthesized with C. arvensis leaf extract containing organic and inorganic compounds and used for the adsorption of Cu2+ ions from aqueous solutions. The results demonstrated that the highest efficacy of the AgNPs for adsorbing Cu2+ ions was 98.99% at pH 12 and 298 K. The experimental data agree well with the pseudo-second-order model. The AgNPs adsorbed the Cu2+ ions by diffusion on the AgNPs surface and within the pores, and the film diffusion was one of the processes that controlled the Cu2+ adsorption. The Langmuir model was agreed more with experimental results than the Freundlich model in its explanation of Cu2+ adsorption by AgNPs. The values of qm were determined as 12.09 mg/g at 298 K and 9.98 mg/g at 323 K. The negative ΔG° and ΔH° values and the positive of ΔS° value, confirmed that the process of the Cu2+ ions adsorption on the surface of the AgNPs was a physicochemical adsorption, and both exothermic and spontaneous. The results obtained conclude that AgNPs can be applied for Cu2+ adsorption from aqueous solutions.

Author Contributions

Conceptualization, G.M.A.-S.; Formal analysis, G.M.A.-S.; Investigation, G.M.A.-S.; Methodology, G.M.A.-S.; Project administration, G.M.A.-S.; Resources, N.A.-K.; Supervision, G.M.A.-S.; Writing—review and editing, G.M.A.-S. and N.A.-K. All authors have read and agreed to the published version of the manuscript.

Funding

This research was funded by the Deanship of Scientific Research at Princess Nourah Bint Abdulrahman University, through the Fast-track Research Funding Program.

Conflicts of Interest

The authors declare that there are no conflicts of interest regarding the publication of this article.

References

  1. Mustapha, S.; Shuaib, D.T.; Ndamitso, M.M.; Etsuyankpa, M.B.; Sumaila, A.; Mohammed, U.M.; Nasirudeen, M.B. Adsorption isotherm, kinetic and thermodynamic studies for the removal of Pb(II), Cd(II), Zn(II) and Cu(II) ions from aqueous solutions using Albizia lebbeck pods. Appl. Water Sci. 2019, 9, 142. [Google Scholar] [CrossRef] [Green Version]
  2. Hoslett, J.; Ghazal, H.; Ahmad, D.; Jouhar, H. Removal of copper ions from aqueous solution using low temperature biochar derived from the pyrolysis of municipal solid waste. Sci. Total Environ. 2019, 673, 777–789. [Google Scholar] [CrossRef] [PubMed]
  3. Zafar, S.; Zafar, A. Biosynthesis and Characterization of Silver Nanoparticles Using Phoenix dactylifera Fruits Extract and their In Vitro Antimicrobial and Cytotoxic Effects. Open Biotechnol. J. 2019, 13, 37–46. [Google Scholar] [CrossRef]
  4. Gavamukulya, Y.; Maina, E.N.; Wamunyokoli, F.; Meroka, A.M.; Madivoli, E.S.; El-Shemy, H.A.; Magoma, G. Synthesis and Characterization of Silver Nanoparticles from Ethanolic Extracts of Leaves of Annona muricata: A Green Nanobiotechnology Approach. Biotechnol. J. Int. 2019, 4, 1–18. [Google Scholar] [CrossRef]
  5. Yang, I.; Hou, B.; Wang, J.; Tian, B.; Bi, J.; Wang, N.; Li, X.; Huang, X. Nanomaterials for the Removal of Heavy Metals from Wastewater. Nanomaterials 2019, 9, 424. [Google Scholar] [CrossRef] [PubMed] [Green Version]
  6. Chand, K.; Cao, D.; Fouad, D.; Shah, A.H.; Dayo, A.; Zhu, K.; Lakhan, M.N.; Mehdi, G.; Dong, S. Green synthesis, characterization and photocatalytic application of silver nanoparticles synthesized by various plant extracts. Arab. J. Chem. 2020. [Google Scholar] [CrossRef]
  7. Dila, N.N.; Sadeghi, M. Free radical synthesis of nanosilver/gelatin-poly (acrylic acid) nanocomposite hydrogels employed for antibacterial activity and removal of Cu(II) metal ions. J. Hazard. Mater. 2018, 351, 38–53. [Google Scholar] [CrossRef]
  8. Ahmed, R.H.; Mustafa, D.E. Green synthesis of silver nanoparticles mediated by traditionally used medicinal plants in Sudan. Int. Nano Lett. 2020, 10, 1–14. [Google Scholar] [CrossRef] [Green Version]
  9. Zulfiqar, H.; Zafar, A.; Rasheed, M.N.; Ali, Z.; Mehmood, K.; Mazher, A.; Hasan, M.; Mahmood, N. Synthesis of silver anoparticles using Fagonia cretica and their antimicrobial activities. Nanoscale Adv. 2019, 1, 1707–1713. [Google Scholar] [CrossRef] [Green Version]
  10. Jogaiah, S.; Kurjogi, M.; Abdelrahman, M.; Hanumanthappa, N.; Tran, L.P. Ganoderma applanatum-mediated green synthesis of silver nanoparticles: Structural characterization, and in vitro and in vivo biomedical and agrochemical properties. Arab. J. Chem. 2019, 12, 1108–1120. [Google Scholar] [CrossRef]
  11. Okafor, F.; Janen, A.; Kukhtareva, T.; Edwards, V.; Curley, M. Green Synthesis of Silver Nanoparticles, Their Characterization, Application and Antibacterial Activity. Int. J. Environ. Res. Public Health 2013, 10, 5221–5238. [Google Scholar] [CrossRef] [PubMed] [Green Version]
  12. Gade, A.; Gaikwad, S.; Duran, N.; Rai, M. Screening of different species of Phoma for synthesis of silver nanoparticles. Biotechnol. Appl. Biochem. 2013, 60, 482–493. [Google Scholar] [CrossRef]
  13. Devi, L.S.; Joshi, S.R. Ultrastructures of silver nanoparticles biosynthesized using endophytic fungi. J. Microsc. Ultrastruct. 2015, 3, 29–37. [Google Scholar] [CrossRef] [Green Version]
  14. Dhand, V.; Soumya, L.; Bharadwaj, S.; Chakra, S.; Bhatt, D.; Sreedhar, B. Green synthesis of silver nanoparticles using Coffea arabica seed extract and its antibacterial activity. Mater. Sci. Eng. 2016, 58, 36–43. [Google Scholar] [CrossRef] [PubMed]
  15. Uzunoglu, D.; Gurel, N.; Ozkaya, N.; Ozer, A. The single batch biosorption of copper(II) ions on Sargassum acinarum. Desalin. Water Treat. 2014, 52, 1514–1523. [Google Scholar] [CrossRef]
  16. Johnsona, A.S.; Obota, I.B.; Ukponga, U.S. Green synthesis of silver nanoparticles using Artemisia annua and Sida acuta leaves extract and their antimicrobial, antioxidant and corrosion inhibition potentials. J. Mater. Environ. Sci. 2014, 5, 899–906. [Google Scholar]
  17. Yu, C.; Tang, J.; Liu, X.; Ren, X.; Zhen, M.; Wang, L. Green Biosynthesis of Silver Nanoparticles Using Eriobotrya japonica (Thunb.) Leaf Extract for Reductive Catalysis. Materials 2019, 12, 189. [Google Scholar] [CrossRef] [Green Version]
  18. Sithara, R.; Selvakumar, P.; Arun, C.; Anandan, S.; Sivashanmugam, P. Economical synthesis of silver nanoparticles using leaf extract of Acalypha hispida and its application in the detection of Mn(II) ions. J. Adv. Res. 2017, 8, 561–568. [Google Scholar] [CrossRef]
  19. Bhuvaneswari, T.S.; Thirugnanam, T.; Thirumurugan, V. Phytomediated synthesis of silver nanoparticles using Cassia auriculata L.: Evaluation of antibacterial and antifungal activity. Asian J. Pharm. Pharmacol. 2019, 5, 326–331. [Google Scholar] [CrossRef]
  20. Al-Senani, G.M. Synthesis of ZnO-NPs Using a Convolvulus arvensis Leaf Extract and Proving Its E_ciency as an Inhibitor of Carbon Steel Corrosion. Materials 2020, 13, 890. [Google Scholar] [CrossRef] [Green Version]
  21. Al-Snafi, A.E. The chemical constituents and pharmacological effects of Convolvulus arvensis and Convolvulus scammonia—A review. IOSR J. Pharm. 2016, 6, 64–75. [Google Scholar]
  22. Torres-Caban, R.; Vega-Olivencia, C.A.; Alamo-Nole, L.; Morales-Irizarry, D.; Roman-Velazquez, F.; Mina-Camilde, N. Removal of Copper fromWater by Adsorption with Calcium-Alginate/Spent-Coffee-Grounds Composite Beads. Materials 2019, 12, 395. [Google Scholar] [CrossRef] [PubMed] [Green Version]
  23. Zhang, X.; Shi, X.; Ma, L.; Pang, X.; Li, L. Preparation of Chitosan Stacking Membranes for Adsorption of Copper Ions. Polymers 2019, 11, 1463. [Google Scholar] [CrossRef] [PubMed] [Green Version]
  24. AbuDalo, M.A.; Al-Mheidat, I.R.; Al-Shurafat, A.W.; Grinham, C.; Oyanedel-Craver, V. Synthesis of silver nanoparticles using a modified Tollens’ method in conjunction with phytochemicals and assessment of their antimicrobial activity. PeerJ 2019, 7, e6413. [Google Scholar] [CrossRef] [PubMed] [Green Version]
  25. Bhargava, S.; Uma, V. Rapid extraction of Cu(II) heavy metal from industrial waste water by using silver nanoparticles anchored with novel Schiff bas. Sep. Sci. Technol. 2019, 54, 1182–1193. [Google Scholar] [CrossRef]
  26. Azzama, E.M.S.; Eshaqa, G.; Rabiea, A.M.; Bakra, A.A.; Abd-Elaala, A.A.; El Metwallyb, A.E.; Tawfika, S.M. Preparation and characterization of chitosan-clay nanocomposites forthe removal of Cu(II) from aqueous solution. Int. J. Biol. Macromol. 2016, 89, 507–517. [Google Scholar] [CrossRef]
  27. Benzaoui, T.; Selatnia, A.; Djabali, D. Adsorption of copper (II) ions from aqueous solution using bottom ash of expired drugs incineration. Adsorpt. Sci. Technol. 2018, 36, 114–129. [Google Scholar] [CrossRef]
  28. Al-Senani, G.M.; Al-Kadhi, N.S. Studies on Adsorption of Fluorescein Dye from Aqueous Solutions Using Wild Herbs. Int. J. Anal. Chem. 2020, 1–9. [Google Scholar] [CrossRef]
  29. Al-Senani, G.M.; Al-Fawzan, F.F. Study on Adsorption of Cu and Ba from Aqueous Solutions Using Nanoparticles of Origanum (OR) and Lavandula (LV). Bioinorg. Chem. Appl. 2018, 1–8. [Google Scholar] [CrossRef] [Green Version]
  30. Neto, V.O.S.; Oliveira, A.G.; Teixeira, R.N.P.; Silva, M.A.A.; Freire, P.T.C.; Keukeleire, D.D.; Nascimento, R.F. Use of coconut bagasse as alternative adsorbent for separation of copper(II) ions from aqueous solutions: Isotherms, kinetics, and thermodynamic studies. BioResources 2011, 6, 3376–3395. [Google Scholar]
  31. Aslan, S.; Yildiz, S.; Ozturk, M. Biosorption of Cu2+ and Ni2+ ions from aqueous solutions using waste dried activated sludge biomass. Pol. J. Chem. Technol. 2018, 20, 20–28. [Google Scholar] [CrossRef] [Green Version]
  32. Al-Senani, G.M.; Al-Fawzan, F.F. Adsorption study of heavy metal ions from aqueous solution by nanoparticle of wild herbs. Egypt. J. Aquat. Res. 2018, 44, 187–194. [Google Scholar] [CrossRef]
  33. Anastopoulos, I.; Kyzas, G.Z. Are the thermodynamic parameters correctly estimated in liquid-phase adsorption phenomena? J. Mol. Liq. 2016, 218, 174–185. [Google Scholar] [CrossRef]
  34. Sivaa, S.; Sudharsanb, S.; SayeeKannan, R. Selective Co (II) Removal from Aqueous Media by Immobilizing the Silver Nanoparticles within a Polymer-Matrix through Formaldehyde Cross Linking Agent. RSC Adv. 2015, 5, 23340–23349. [Google Scholar] [CrossRef]
  35. Ksakas, A.; Tanji, K.; El Bali, B.; Taleb, M.; Kherbeche, A. Removal of Cu (II) Ions from Aqueous Solution by Adsorption Using Natural Clays: Kinetic and Thermodynamic Studies. J. Mater. Environ. Sci. 2018, 9, 1075–1085. [Google Scholar]
Figure 1. Convolvulus arvensis leaf extract.
Applsci 10 04840 g001
Figure 2. The synthesis of AgNPs.
Applsci 10 04840 g002
Figure 3. A Fourier-transform infrared spectroscopy (FTIR) analysis of the functional groups in AgNPs before and after Cu2+ was adsorbed.
Applsci 10 04840 g003
Figure 4. Energy-dispersive X-ray spectroscopy (EDS) images of AgNPs (0.2 g) before (a) and after Cu2+ (10 mg/L) was adsorbed (b) for 3 h at 298 K.
Applsci 10 04840 g004
Figure 5. SEM images of AgNPs (0.2 g) before (a) and after Cu2+ (10 mg/L) was adsorbed (b) for 3 h at 298 K.
Applsci 10 04840 g005
Figure 6. Effect of AgNPs’ dose on the adsorption percentage of Cu2+. (a) The effect of pH, (b) the contact time, (c) the Cu2+ concentration and temperature, and (d) the adsorption percentage of Cu2+ by AgNPs (0.2 g).
Applsci 10 04840 g006
Figure 7. Four kinetic model plots (pseudo-first-order (PFO), pseudo-second-order (PSO), intraparticle diffusion (IPD), and liquid film diffusion (LFD)) for the adsorption of Cu2+ by AgNPs (adsorbent dosage, 0.2 g; concentration of Cu2+, 10 and 50 mg/L at pH 7, and 298 K).
Applsci 10 04840 g007
Figure 8. The adsorption isotherm model plots (Langmuir and Freundlich) for the adsorption of Cu2+ on AgNPs (adsorbent dosage, 0.2 g; concentration of Cu2+, 10 and 50 mg/L; pH 7; contact time 3 h, at 298 K).
Applsci 10 04840 g008
Table 1. Parameters of four kinetic models.
Kinetic ModelsAdsorbent
10 mg/L50 mg/L
qe,exp mg/g2.2789.225
Pseudo-First-Order
qe,cal mg/g1.4016.391
K1, min−10.0310.031
R20.9960.945
Pseudo-Second-Order
qe,cal mg/g2.47010.823
K2, g/mg min0.0330.004
R20.9990.984
Intraparticle Diffusion
Step 1
Kipd, mg/g.min1/20.1491.419
C, mg/g0.8982.437
R211
Step 2
Kipd, mg/g.min1/20.0240.074
C, mg/g1.9798.259
R20.9320.975
Liquid Film Diffusion
Klfd, min−10.0310.031
C, mg/g0.4870.368
R20.9960.945
Table 2. Adsorption isotherm parameters.
TemperatureLangmuir ModelFreundlich Model
qmax (mg/g)KL (L/mg)RLR2KF (mg/g) (L/mg)1/nnR2
298 K12.0920.2430.2540.9982.5851.8830.980
323 K9.9800.1350.4260.9961.5171.8070.959
Table 3. Thermodynamic parameters.
ΔG° (kJ/mol)ΔH° (KJ/mol)ΔS° (J/mol K)
298 K323 K
−33.850−32.395−18.80350.493

