Article

Tunable Plasmonic Talbot Effect Based on Graphene Monolayer

1
College of Information, Science and Engineering, Huaqiao University, Xiamen 361021, China
2
Fujian Key Laboratory of Semiconductor Materials and Applications, Xiamen University, Xiamen 361005, China
*
Authors to whom correspondence should be addressed.
Appl. Sci. 2020, 10(14), 4782; https://doi.org/10.3390/app10144782
Submission received: 14 June 2020 / Revised: 3 July 2020 / Accepted: 10 July 2020 / Published: 12 July 2020
(This article belongs to the Special Issue Nano-Photonics Materials and Devices)

Abstract

:
In this article, the plasmonic Talbot effect supported by a graphene monolayer is investigated theoretically when surface plasmon polaritons (SPPs) are excited on the graphene. The Talbot effect distance is studied by varying the chemical potential, wavelength and the period of grating. The Talbot distance increases with the period in a parabolic way, and exhibits the opposite trends with respect to the chemical potential and wavelength. Moreover, the full width at half maximum (FWHM) of the Talbot image is recorded as a function of chemical potential and the wavelength. This study provides a new approach for sub-wavelength scale imaging and extends the applications of Talbot effect as well as graphene-based plasmonic devices.

1. Introduction

The Talbot effect [1], a superposition phenomenon of multi-slit interference and single-slit diffraction, was interpreted by L.Rayleigh according to the Fresnel diffraction theory [2]. When a plane wave illuminates a periodic structure, imitative images of structure should appear at a periodic distance behind the structure. The self-imaging effect has attracted more attention from researchers. Excitingly, due to the excellent properties of optical imaging, Talbot effect is widely employed in lithography [3], optical metrology and laser resonators [4]. More recently, Dennis et al. have reported the plasmonic Talbot effect on metals [5]. The plasmonic Talbot effect occurs when surface plasmon waves are incident which is produced by the powerful interaction between the free electron oscillations and the electromagnetic field at the metal–dielectric interface. As new branch of self-imaging effect, the plasmonic Talbot effect breaks the diffraction limit [6,7,8,9,10,11] due to the excellent electromagnetic field confinement ability of plasmon [12,13,14,15,16]. However, in noble metals, huge ohmic loss prevents the plasmon from long distance propagation, and more seriously, it is difficult to tune the operating wavelength of the whole device once the geometric structure is determined [17,18,19,20,21]. All the drawbacks limit the implication of the conventional metal-based plasmonic Talbot effect.
To have a deeper study, some researchers shift their focus to the plasmonic Talbot effect in graphene. Graphene is a two-dimensional structure that supports surface plasmon in the infrared and terahertz wavelength range [22,23,24,25]. Besides the high confinement and low loss nature, the conspicuous feature of graphene materials is that the chemical potential can be adjusted by chemical doping or the external gate voltage. Thus, the surface conductivity of graphene can be flexibly regulated by controlling the chemical potential [14,26]. When the surface conductivity of graphene is changed, the graphene is equipped with the property of noble metals that can excite and propagate surface plasmon polaritons (SPPs). What is more, compared to noble metals, the SPPs supported by graphene possess lower loss and stronger field confinement. Recently, Bing Wang et al. demonstrated the plasmonic Talbot effect in monolayer graphene sheet arrays when surface plasmon polaritons between graphene experience weak coupling [19]. This investigation also finds that the Talbot effect distance can be regulated by some parameters of graphene. The graphene-based Talbot effect has potential applications in a sub-wavelength adjustable device [27].
In this work, the plasmonic Talbot effect based on monolayer graphene is investigated theoretically in the terahertz frequency range and the initial period D is 160 nm. The Talbot effect distance is studied by varying the chemical potential, incident wavelength and period. Additionally, full width at half maximum (FWHM) of the Talbot image is explored as a function of incident wavelength and chemical potential of the graphene sheet. Our proposed structure might have significant applications in graphene-based nanometer imaging devices, and open a new implication for the Talbot effect in sub-wavelength imaging.

2. Model of the Plasmonic Talbot Effect and Calculation Methods

The monolayer graphene sheet lies on the substrate (plane XOZ) with a relative dielectric constant of ε _ , and is covered by a media with dielectric constant of ε ¯ , as schematically shown in Figure 1a.
The incident side is divided into n identical segments, as shown in Figure 1b. The unit amplitude plane waves in transverse magnetic (TM) mode with phase difference are alternately incident upon each segment. In order to simplify the structure of the model in simulation and reduce the computation, the distribution of diffraction waves after the grating is considered solely and the process of incident wave passing through the grating is omitted. Instead adjacent incident waves with a fixed phase difference are used to describe the wave function through the grating. All the incident waves in each segment interfere with each other and form multiple intensity enhancements in both X and Z directions. One period of the grating includes two neighboring segments. Consequently, image arrays appear periodically along the propagation direction. This is the basic mechanism of the Talbot effect. Each period of the grating is composed of the two adjacent segments.
The periodic function of the grating at z = 0 is given by the Fourier series [12]:
T ( x , 0 ) = n = + C n exp ( i 2 π n x D )
when wavelength is less than period D, or the propagation distance is greater than the wavelength, according to the superposition of the multiple slit interferences in each segment, the amplitude at point (x, z) is given by [17]:
T ( x , z ) = exp ( i β z ) n = + C n exp ( i 2 π n x D )
where β is the propagation constant of graphene along the z-axis. For the plasmon supported by graphene, β is described by [28]:
β = i 2 ω ε 0 σ s ε ¯ + ε _ 2
where ε _ and ε ¯ are the dielectric constants of the material on both sides of graphene and ε 0 is the dielectric constant of vacuum. ω is the angular frequency, and σ s is the surface conductivity of the graphene sheet. According to Kubo’s formula [29,30], graphene’s surface conductivity is composed of the contributions from interband electron–electron transition and the intraband electron–photon scattering.
σ s = σ i n t r a + σ i n t e r
where the intraband electron–photon scattering σ i n t r a is described by
σ i n t r a = i e 2 k B T π ( ω + i τ 1 ) [ μ c k B T + 2 ln ( 1 + exp ( μ c k B T ) ) ]
and the interband electron–electron transition σ i n t e r is given by
σ i n t e r = i e 2 4 π ln ( 2 | μ c | ( ω + i τ 1 ) 2 | μ c | + ( ω + i τ 1 ) )
where T is the temperature which is set as 300 K, τ is the electron momentum relaxation time, and which is set as 1 ps in this article. ħ is the reduced Planck constant. μ c is the chemical potential, which could be modified by either chemical doping or the external gate voltage. The effective refractive index of graphene indicated as n e f f is described by Equation (7), where the real part of n e f f represents the dispersion characteristic and imaginary part implies the propagation loss of the plasmon. The effective wavelength λ n can also be defined by Equation (8)
n e f f = β k 0
λ n = λ 0 n e f f
where λ 0 is the wavelength of the plasmon in vacuum. In this paper, all the effective wavelengths in graphene λ n are smaller than period D, which fully conforms to the conditions of scalar diffraction theory [31]. Consequently, the Talbot distance Z T is given by
Z T = D 2 λ = D 2 λ n
On the other hand, finite element method-based commercially available software COMSOL multiple physics is employed to numerically explore the plasmonic Talbot effect. Figure 1b describes the calculation window of the proposed structure, where the plasmon incident at z = 0 and propagate along the Z direction. In order to simulate the periodic grating structure in X direction and reduce the computation, the Floquet periodic boundary conditions are utilized on the top and bottom of the graphene. The scattering boundary condition is set on the right side of the calculation window.

3. Calculation Results and Discussion

3.1. The Imaging of Plasmonic Talbot Effect

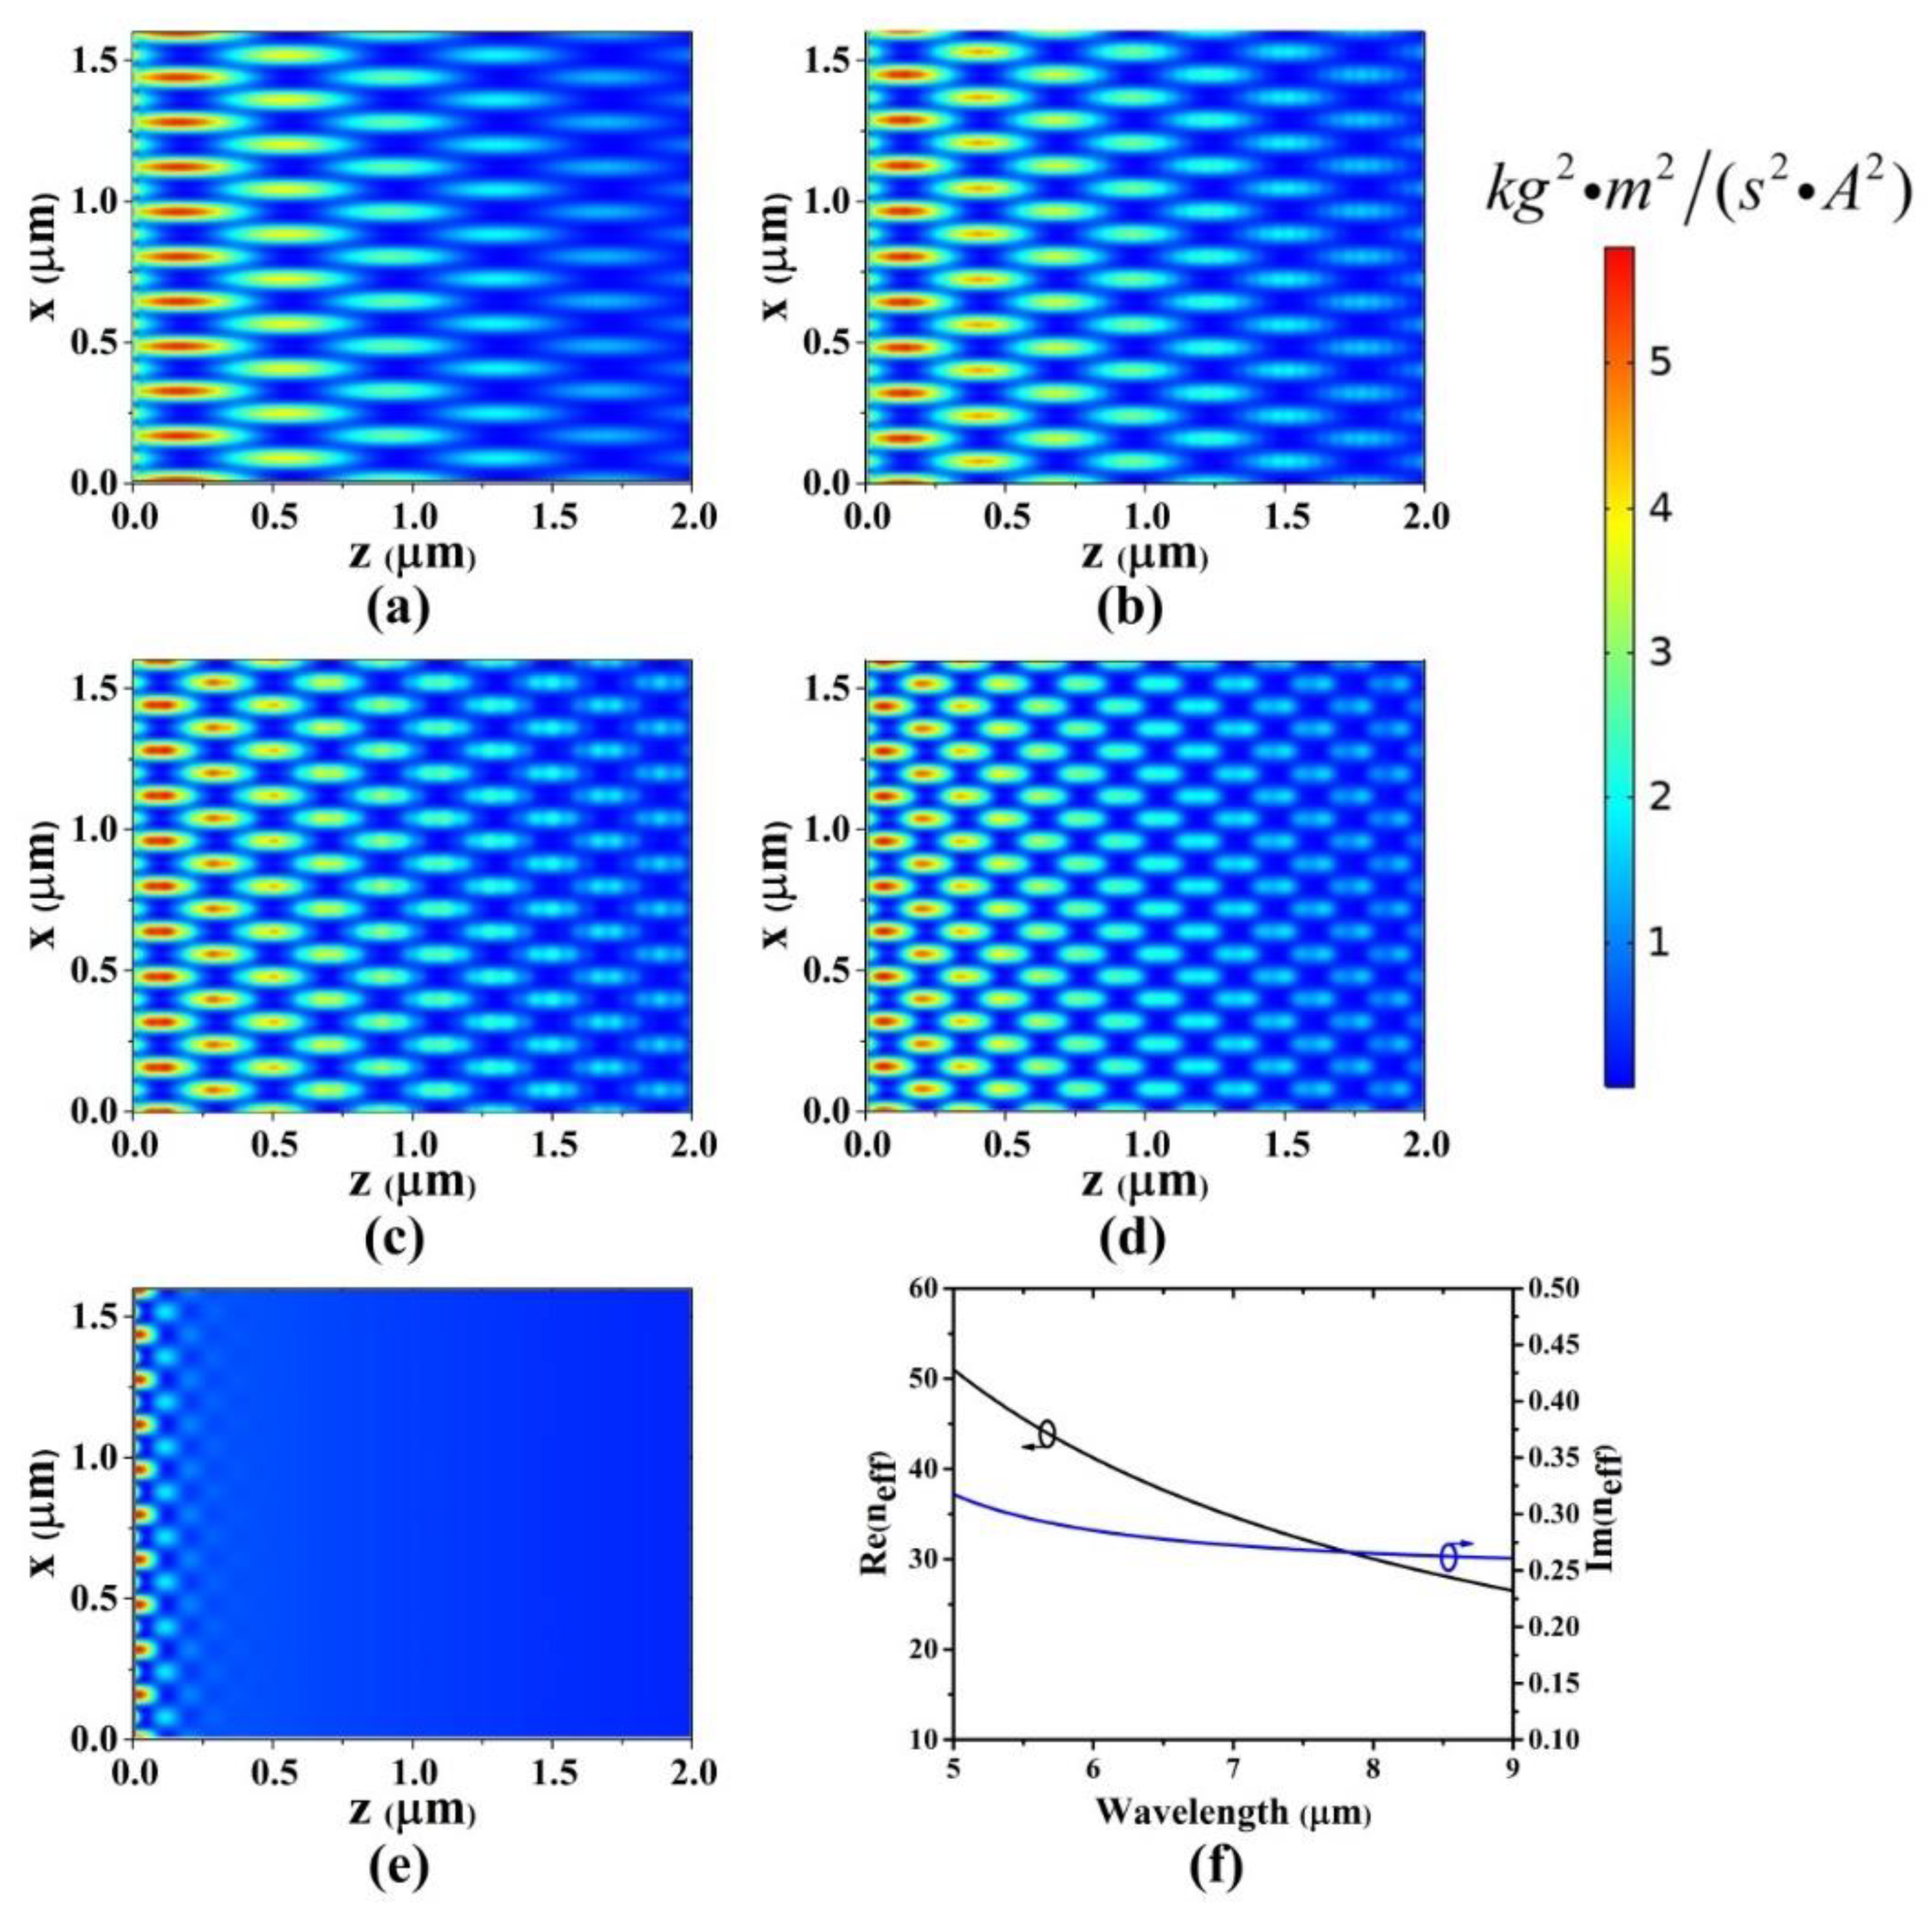
Figure 2 depicts the | E 2 | field distributions of the plasmonic Talbot patterns supported by the graphene monolayer, where the chemical potential is 0.3 eV, the period of the grating is 160 nm, the input wavelength in free space is 7 μm, 8 μm, 9 μm, 10 μm and 11 μm respectively and the effective wavelength in graphene is 64.3 nm, 86 nm, 111 nm, 137.9 nm and 168.2 nm respectively. All of the | E | 2 profile is obtained from COMSOL. The Talbot image arrays reproduce periodically along the propagation direction. In contrast to the conventional optical Talbot effect, the pattern of the plasmonic Talbot effect demonstrates the attenuation property, and eventually disappears at the propagation direction due to the propagation loss of graphene. However, from Figure 2a–e, it is clear that the Talbot image arrays disappear in different speeds with respect to the wavelength. Longer incident wavelength attenuates faster than the shorter ones. When incident, the wavelength is 11 μm and there is even no Talbot effect observable, as shown in Figure 2e. Figure 2f plots the imaginary part and real part effective index of the plasmon as a function of the wavelength with a given chemical potential. It is shown that the ratio of the imaginary part to the real part of the plasmon increases with the wavelength, which indicates that longer wavelength suffers higher attenuation. On the other hand, the effective wavelength λ n increases linearly with the increase in λ 0 . When λ n is comparable to period D, the Talbot effect gradually fades away because the diffraction effect becomes weaker. Consequently, the higher order diffraction wave is suppressed by sub-wavelength grating. At this point, even if the wavelength continues to increase, the Talbot effect disappears, as shown in Figure 2e, where λ n is 168.2 nm, which is comparable to the period D.

3.2. The Talbot Effect Distance Z T as a Function of the Multiple Parameters

In order to study the Talbot effect in more detail, we investigate the properties of the Talbot effect distance Z T as a function of the structural and material parameters. According to the Equation (9), the change of Z T is directly related to the period D and effective wavelength λ n . The effective wavelength λ n is in connection with the chemical potential of graphene and incident wavelength λ 0 . Therefore, in this paper, Z T is investigated by changing the period D, chemical potential of graphene and the incident wavelength.
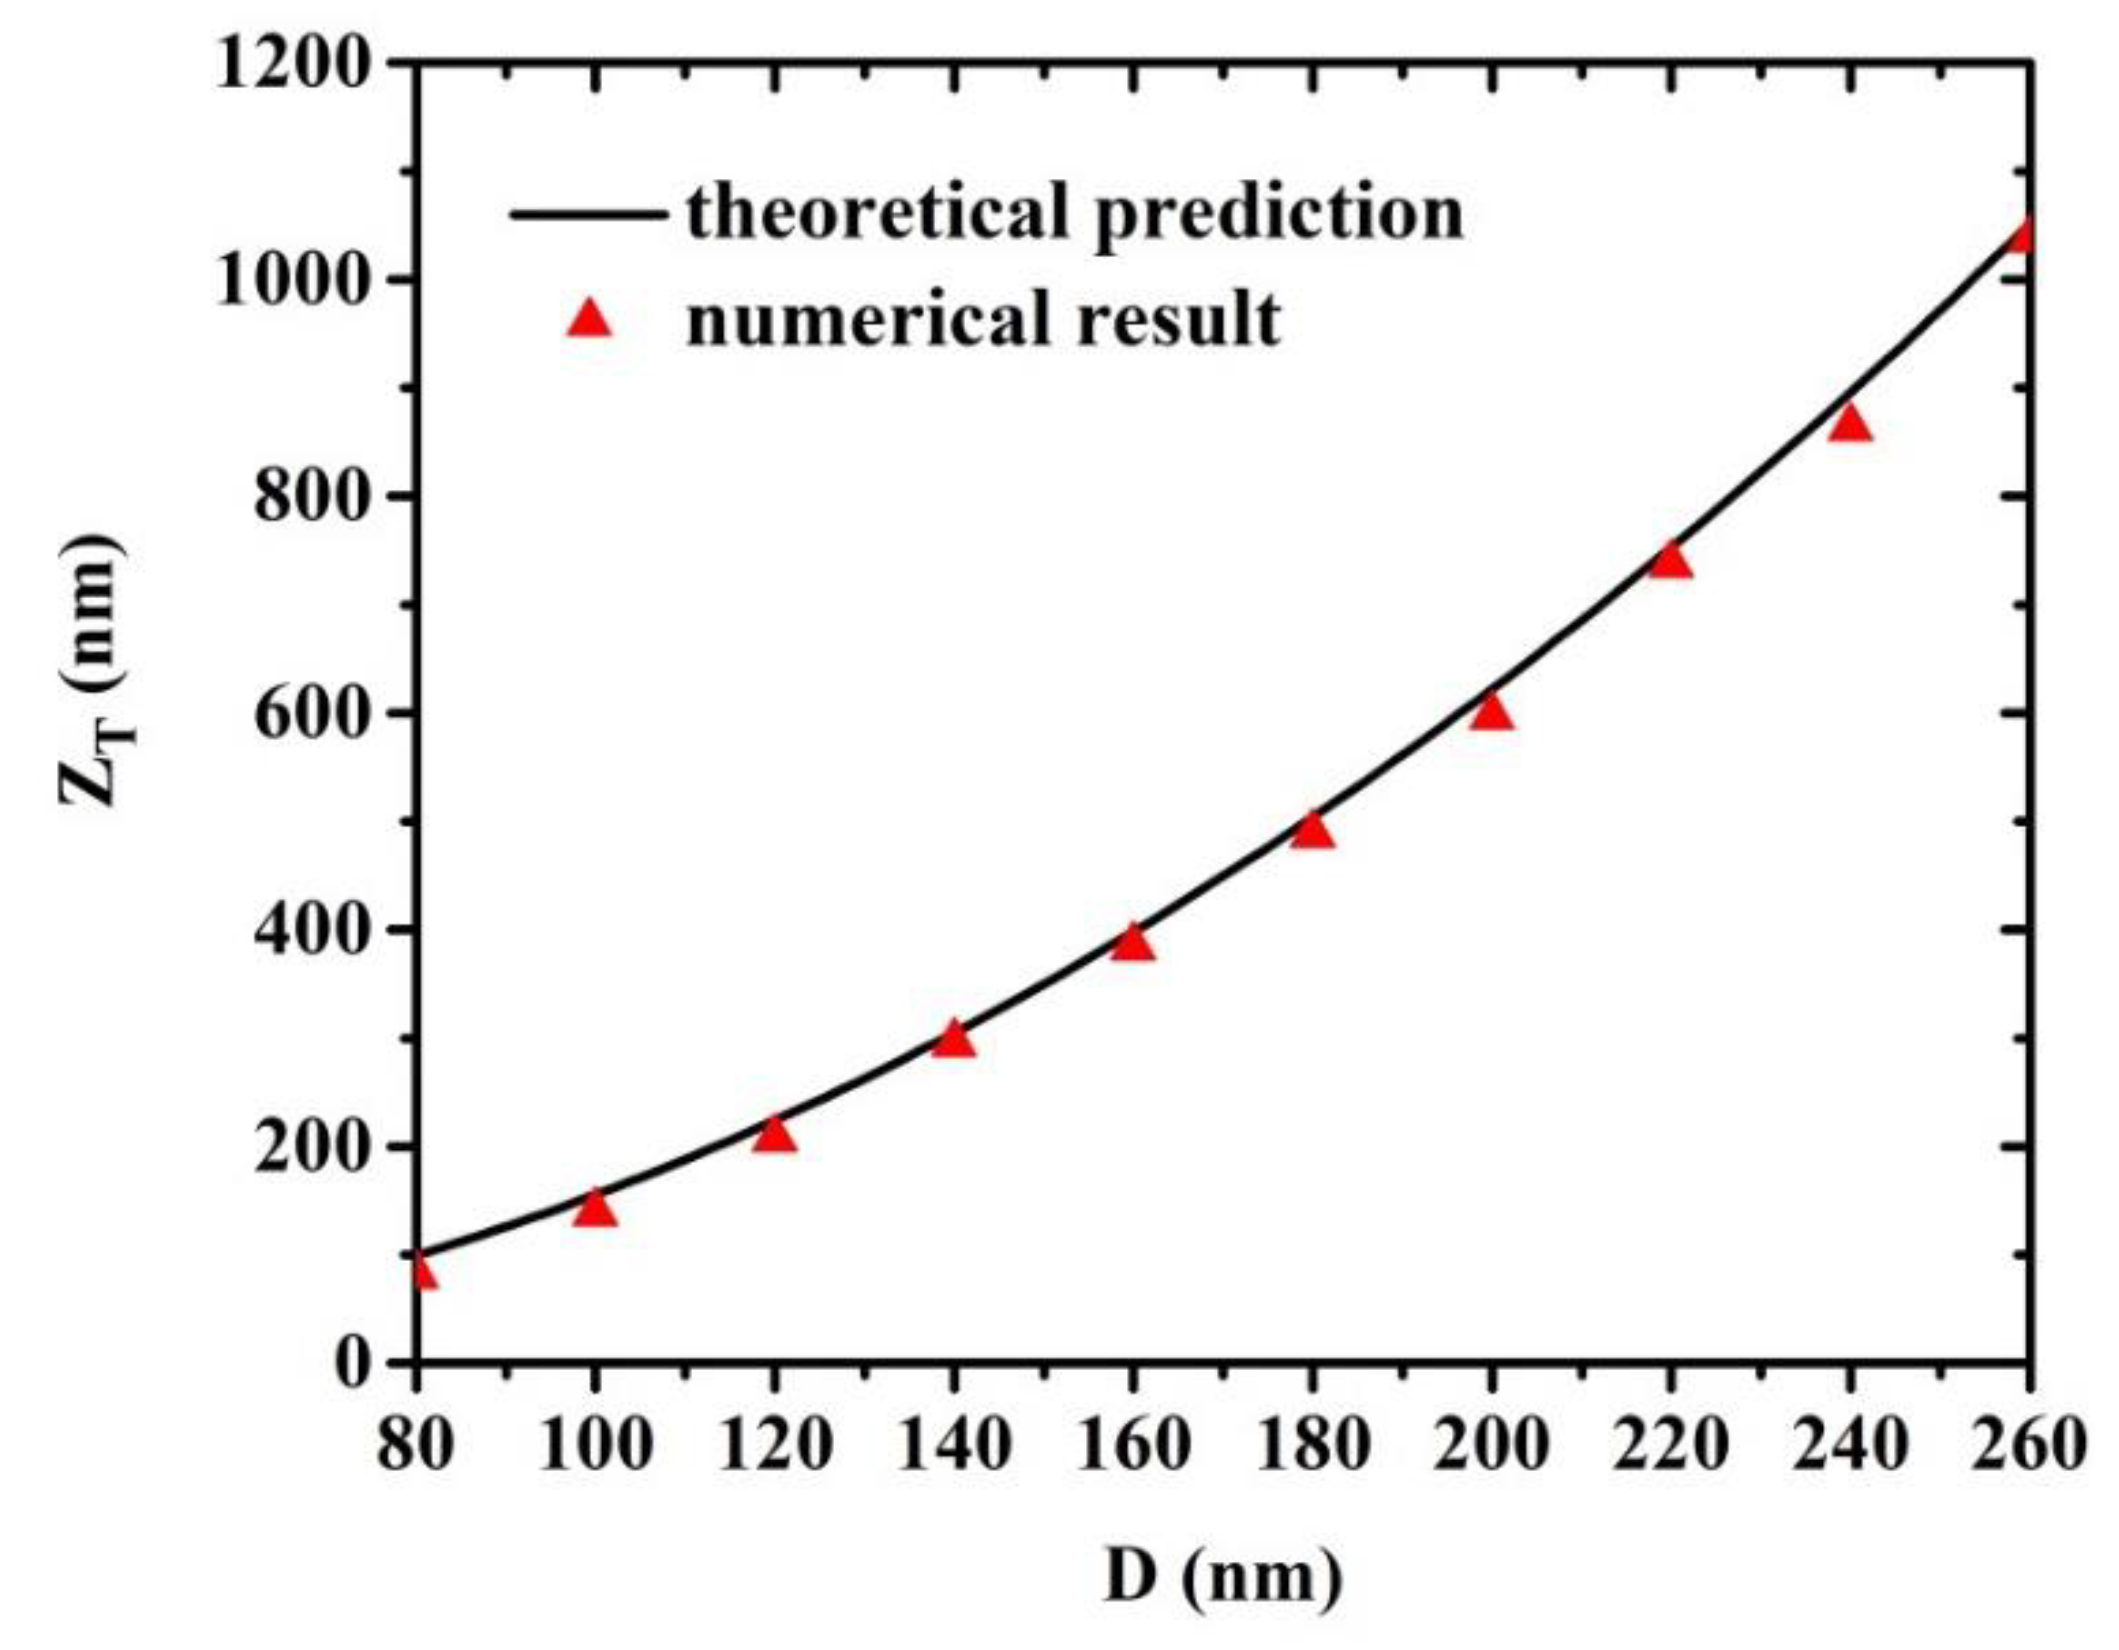
Firstly, the Talbot effect distance Z T is investigated as a function of the period D. The chemical potential of graphene is set as 0.3 eV, and the incident wavelength λ 0 is fixed on 7000 nm, which means that λ n is 64.3 nm. The period D starts at 80 nm and increases at a step of 20 nm and up to 260 nm. As demonstrated in Figure 3, Z T grows with the period D in a parabolic way, which agrees well with Equation (9). Note that there are some small deviations between the numerical values and the predicted data obtained from Equation (9), which is due to the fact that the imaginary parts of the surface conductivity are ignored in the numerical calculation of Equations (3)–(9). Consequently, the analytical result of wavelength λ n is slightly larger than the numerical results.
On the other hand, each Talbot image can be represented by the brightest interference fringe point, and the phase difference between the adjacent beams of light satisfies Δ φ = 2 k π , which is originally given by
Δ φ = Δ φ 0 + m 2 π λ n D sin θ Δ φ 0 + m 2 π λ n D tan θ = Δ φ 0 + m 2 π λ n D x z
where Δ φ 0 is the phase different between the adjacent beams of light at z = 0. The distance z between the adjacent Talbot images is given by
z = x n D λ n
so, according to Equation (10) as the period D gets larger, the distance z between the two adjacent images gets larger which results from the increase in the Talbot distance Z T .
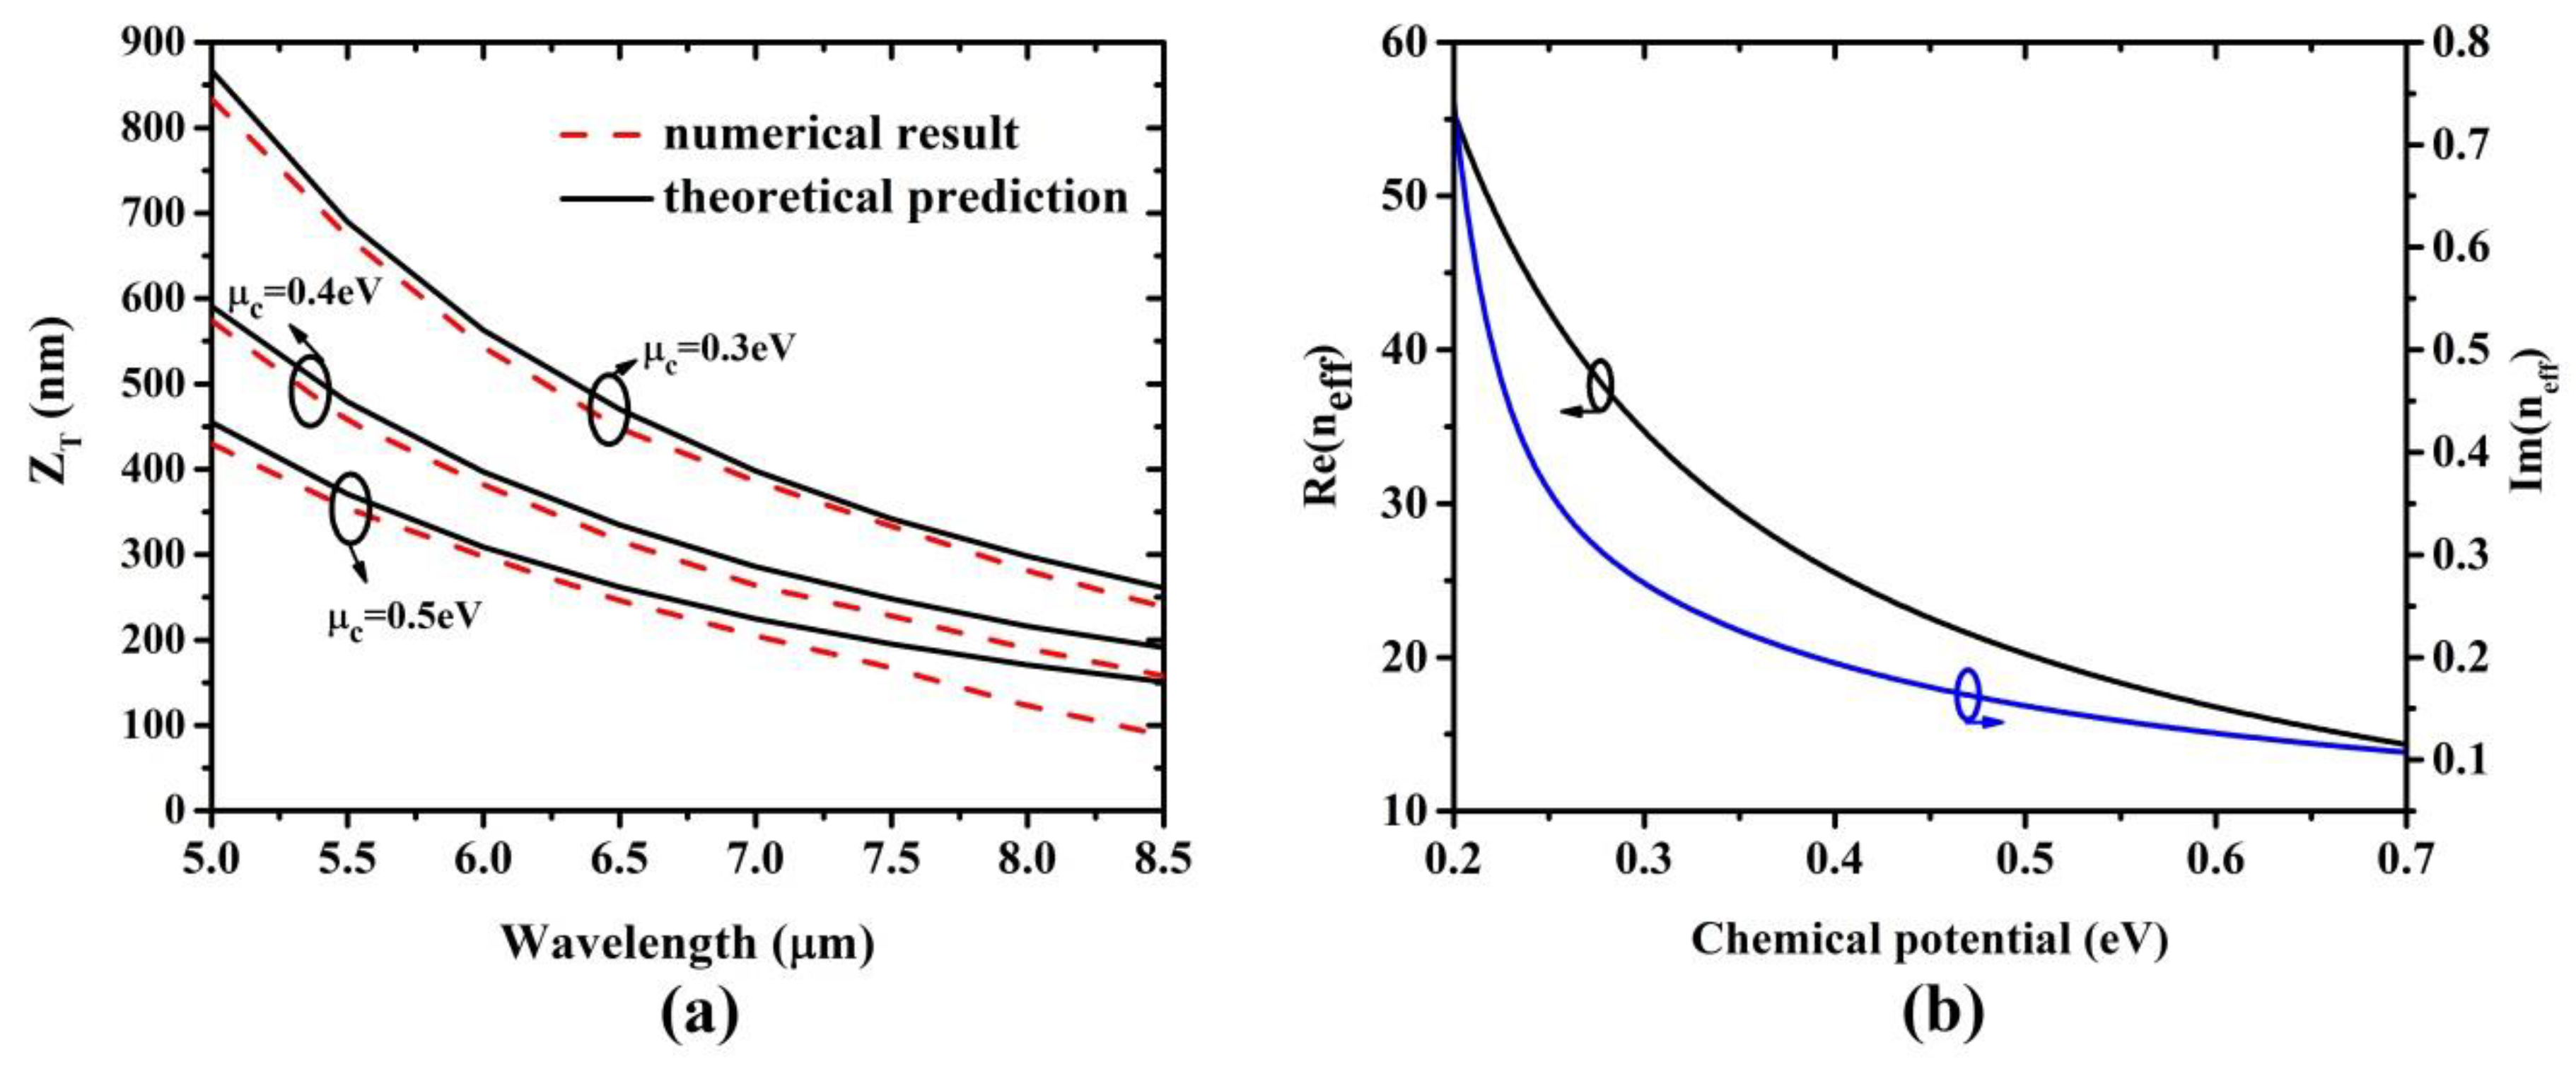
Next, the Talbot distance Z T as a function of the incident wavelength λ 0 and the chemical potential μ c of graphene sheet is studied. In Figure 4a, the Talbot distance Z T is recorded in the wavelength range from 5 to 9 μm with the chemical potential ranging from 0.3 to 0.5 eV. For a given chemical potential, the Talbot distance decreases with the increase in incident wavelength. In addition, the Talbot distance decreases with increased chemical potential for a fixed wavelength. The rigorous data of Z T obtained by Equation (9) are also plotted in Figure 4a in solid line. In general, the theoretical predictions in Equation (9) match well with the value of numerical calculation, which is illustrated the accuracy of research methods.
In order to further understand the behavior of Z T shown in Figure 4a, the real part of effective index denoted by Re ( n e f f ) = Real ( β / k 0 ) and the imaginary part of effective index described as Im ( n e f f ) = Imag ( β / k 0 ) are plotted as a function of chemical potential from 0.2 to 0.7 eV at a given wavelength of 7 μm as shown in Figure 4b. It can be seen that the real part of the effective index Re ( n e f f ) decreases with the increasing chemical potential, which suggests the increasing effective wavelength along the graphene sheet, and finally results in the decreasing Talbot effect distance Z T , according to Equation (9).

3.3. The FWHM Properties of the Talbot Images

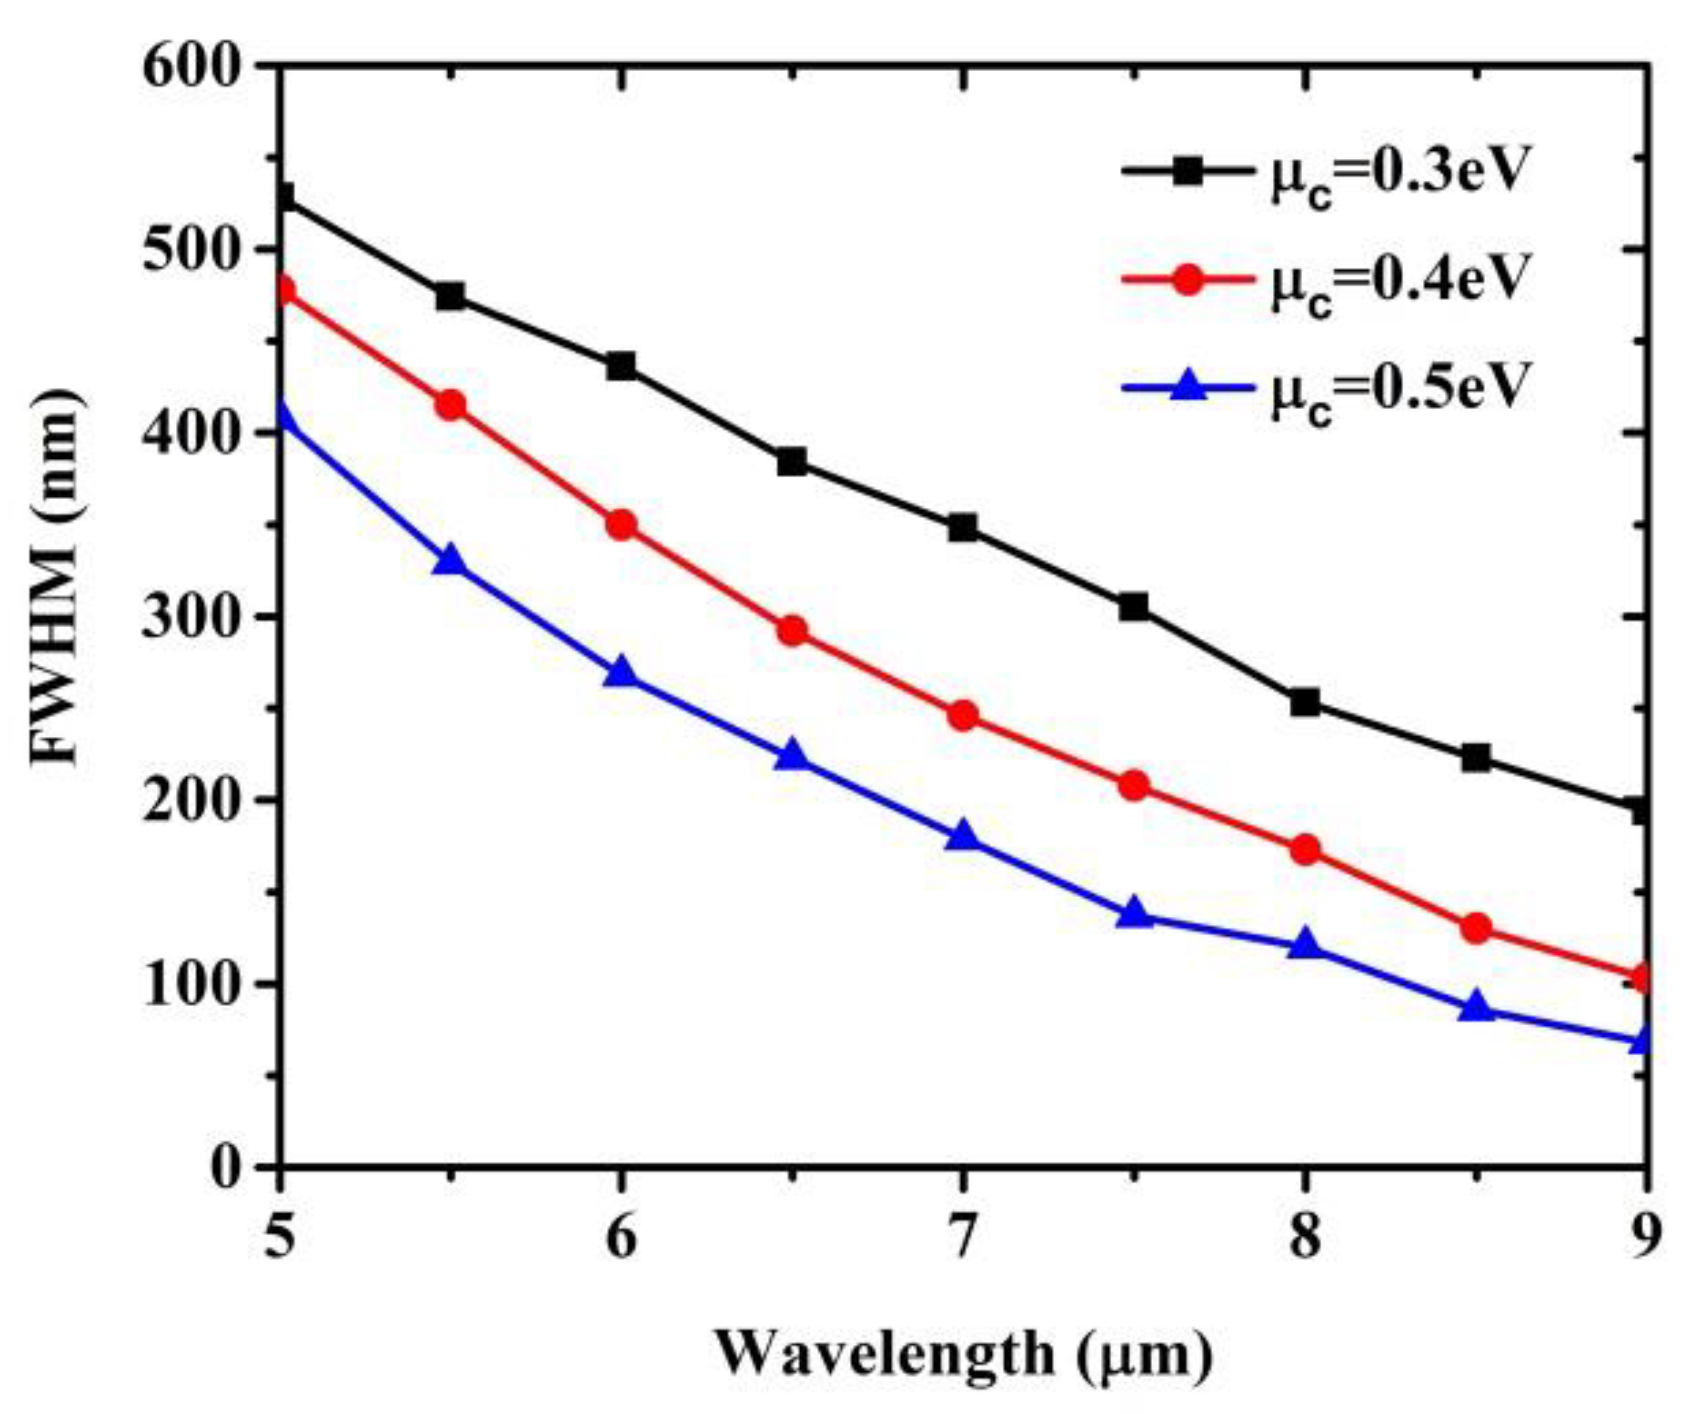
Finally, the full width at half maximum (FWHM) [32] of the Talbot image is also studied as a function of the incident wavelength as shown in Figure 5. Here, the period D is set as 160 nm and the duty cycle is 0.5. The optical field distribution behind the grating is the superposition of grating single slit diffraction and multislit interference. It can be seen from the simplest double-slit interference that the intensity of light waves at a certain point depends on the phase difference between the two interference waves, which can be described as Equations (10) and (11). So, the complex amplitude distribution of light field intensity is related to the spatial optical path difference and the phase difference introduced by the incident wave. Similarly, the FWHM also can be estimated by the phase difference between two points as shown in Equation (10). For a given chemical potential, the FWHM of Talbot image decreases with the increase in incident wavelength [33]. The larger the wavelength is, the more concentrated Talbot effect can be obtained, which improves the self-imaging resolution of sub-wavelength size. However, as a result the imaginary part of the effective refractive index of graphene represents the propagation loss; it should also be considered that a long wavelength possess greater material loss denoted by the ratio of the imaginary part to the real part of effective refractive index of graphene which can be observed visually from Figure 2f. Moreover, when the wavelength is fixed, the FWHM is inversely proportional to the chemical potential, as demonstrated in Figure 5. In the ranges of the chemical potential and wavelength, the FWHM is less than 1 μm, which implies the sub-wavelength imaging in the proposed structure. However, when the length of propagation of SPPs becomes smaller than the self-imaging distance, or the loss of plasmons is high enough, the phenomena are hard to obtain [34]. It should be noted that variation of the duty cycle of graphene grating has no effect on the FWHM. This may be understood by Equation (10), where no duty cycle is involved.

4. Conclusions

In this article, the plasmonic Talbot effect has been achieved in a sheet of graphene by using the interference of adjacent surface plasmon waves with different phases. The Talbot distance is studied as a function of the chemical potential of the graphene, the incident wavelength and the period. Moreover, the FWHM of the Talbot image is investigated as a function of the chemical potential and the wavelength. Deep sub-wavelength imaging is achieved by the proposed nanostructure. Moreover, the numerical results agree well with the theoretical prediction which shows the accuracy of the research method. The proposed nanostructure might offer an approach of a deep sub-wavelength imaging technique, and also extend the potential applications of the Talbot effect in sensor or optical metrology.

Author Contributions

W.Q. and S.S. supervised this project; H.M. and W.Q. provided the original idea; H.M., H.Z., Z.Z., and Z.L. created the models and did the simulations; H.M., W.Q., H.Z., Z.Z., and S.S. analyzed the data and discussed the results, H.M. S.S. and W.Q. wrote the paper. All authors read and approved the final manuscript.

Funding

Natural Science Fund of China under grant No. 11774103, Quanzhou City Science & Technology Program of China under grand No. 2018C003, the open project of Fujian Key Laboratory of Semiconductor Materials and Applications under No. 2019001.

Conflicts of Interest

The authors claim no conflicts of interest regarding this work.

References

  1. Talbot, H.F. Facts relating to optical science. Philos. Mag. 1836, 9, 401–407. [Google Scholar]
  2. Rayleigh, L. On copying diffraction-gratings, and on some phenomena connected therewith. Philos. Mag. 1881, 11, 196–205. [Google Scholar] [CrossRef] [Green Version]
  3. Lorenz Stuerzebecher, T.H.; Uwe Vogler, U.D.; Zeitner, R.V. Advanced mask aligner lithography: Fabrication of periodic patterns using pinhole array mask and talbot effect. Opt. Express 2010, 18, 19485–19494. [Google Scholar] [CrossRef] [PubMed]
  4. Liu, L. Lau cavity and phase locking of laser arrays. Opt. Lett. 1989, 14, 1312–1314. [Google Scholar] [CrossRef] [PubMed]
  5. Mark, R.D.; Nikolay, Z.F.; Javier, G.A. The plasmon talbot effect. Opt. Express 2007, 15, 9692–9700. [Google Scholar]
  6. Nikitin, A.Y.; Guinea, F.; García-Vidal, F.J.; Martín-Moreno, L. Edge and waveguide terahertz surface plasmon modes in graphene microribbons. Phys. Rev. B 2011, 84, 161407. [Google Scholar] [CrossRef] [Green Version]
  7. André, G.E.; Helfert, S.F.; Jürgen, J. Analysis of the self-imaging effect in plasmonic multimode waveguides. Appl. Opt. 2010, 49, A1–A10. [Google Scholar]
  8. Zhang, W.; Zhao, C.; Wang, J.; Zhang, J. An experimental study of the plasmonic talbot effect. Opt. Express 2009, 17, 19757–19762. [Google Scholar] [CrossRef]
  9. Liu, Z.W.; Steele, J.M.; Yuri, P.; Sun, C.; Xiang, Z. Focusing surface plasmons with a plasmonic len. Nano Lett. 2005, 5, 1726–1729. [Google Scholar] [CrossRef]
  10. Afshari-Bavil, M.; Luo, X.; Li, C.; Feng, S.; Dong, M.; Zhu, L. The observation of plasmonic talbot effect at non-illumination side of groove arrays. Plasmonics 2018, 13, 2387–2394. [Google Scholar] [CrossRef]
  11. Yu, Y.T.; Zappe, H. Experimental investigation of 3d plasmon talbot effect. In Proceedings of the 9th IEEE Internation Conference on Nano/Micro Engineered and Molecular Systems, Waikiki Beach, HI, USA, 13–16 April 2014; pp. 532–535. [Google Scholar]
  12. Sudhir, C.; Heinis, D.; Jean, C.; Niek, F.H.; Stefan, E. Romain Quidant Local observation of plasmon focusing in talbot carpets. Opt. Express 2009, 17, 23772–23784. [Google Scholar]
  13. Shi, X.Y.; Yang, W.; Xing, H.Y.; Chen, X.S. Discrete plasmonic talbot effect in finite metal waveguide arrays. Opt. Lett. 2015, 40, 1635–1638. [Google Scholar] [CrossRef] [PubMed]
  14. Lei, W.; Jia, Y.; Ji, Z.C. Discrete plasmonic talbot effect in single-mode graphene ribbon arrays. Appl. Opt. 2017, 56, 9998–10002. [Google Scholar]
  15. Li, L.L.; Zhang, Y.; Fu, Y.Q.; Wang, T.S.; Lu, Z.W.; Qiang, S.; Yu, W.X. Study of the plasmon talbot effect of metallic nanolenses induced by linearly polarized illumination. Plasmonics 2012, 7, 641–645. [Google Scholar] [CrossRef]
  16. Rahmani, M.; Miroshnichenko, A.E.; Lei, D.Y.; Luk’yanchuk, B.; Tribelsky, M.I.; Kuznetsov, A.I.; Kivshar, Y.S.; Francescato, Y.; Giannini, V.; Hong, M.; et al. Beyond the hybridization effects in plasmonic nanoclusters: Diffraction-induced enhanced absorption and scattering. Small 2014, 10, 576–583. [Google Scholar] [CrossRef]
  17. Wang, X.; Chen, H.; Liu, H.; Xu, L.; Sheng, C.; Zhu, S. Self-focusing and the talbot effect in conformal transformation optics. Phys. Rev. Lett. 2017, 119, 033902. [Google Scholar] [CrossRef] [Green Version]
  18. Salas, J.A.; Varga, K.; Yan, J.-A.; Bevan, K.H. Electron talbot effect on graphene. Phys. Rev. B 2016, 93, 104305. [Google Scholar] [CrossRef] [Green Version]
  19. Yang, F.; Wang, B.; Kai, W.; Hua, L.; Lu, P.X. Talbot effect in weakly coupled monolayer graphene sheet arrays. Opt. Lett. 2014, 39, 3371–3373. [Google Scholar]
  20. Yi, H.; Suh, J.Y.; Zhou, W.; Mark, D.H.; Teri, W.O. Talbot effect beyond the paraxial limit at optical frequencies. Opt. Express 2012, 20, 14284–14291. [Google Scholar]
  21. Zhang, Y.Q.; Yao, X.; Chen, Y.; Li, P.Y.; Yuan, J.M.; Feng, W.; Jia, S.Q.; Zhang, Y.P. Controllable multiwave mixing talbot effect. IEEE Photon. J. 2012, 4, 2057–2065. [Google Scholar] [CrossRef]
  22. Ferrari, A.C.; Meyer, J.C.; Scardaci, V.; Casiraghi, C.; Lazzeri, M.; Mauri, F.; Piscanec, S.; Jiang, D.; Novoselo, K.S.; Roth, S.; et al. Raman spectrum of graphene and graphene layers. Phys. Rev. Lett. 2006, 97, 187401. [Google Scholar] [CrossRef] [PubMed] [Green Version]
  23. Ren, J.; Qiu, W.; Chen, H.; Qiu, P.P.; Lin, Z.; Wang, J.X.; Kan, Q.; Pan, J.Q. Electromagnetic field coupling characteristics in graphene plasmonic oligomers: From isolated to collective modes. Phys. Chem. Chem. Phys. 2017, 19, 14671–14679. [Google Scholar] [CrossRef] [PubMed]
  24. Novoselov, K.S.; Geim, A.K.; Morozov, S.V.; Jiang, D.; Katsnelson, M.I.; Grigorieva, I.V.; Dubonos, S.V.; Firsov, A.A. Two-dimensional gas of massless dirac fermions in graphene. Nature 2005, 438, 197–200. [Google Scholar] [CrossRef] [PubMed]
  25. Marinko Jablan, H.B.; Marin, S. Plasmonics in graphene at infrared frequencies. Phys. Rev. B 2009, 80, 245435. [Google Scholar] [CrossRef] [Green Version]
  26. Fang, Z.Y.; Sukosin, T.; Andrea, S.; Liu, Z.; Ma, L.; Wang, Y.; Pulickel, M.A.; Peter, N.; Naomi, J.H.; Abajo, F.J.G.D. Gated tunability and hybridization of localized plasmons in nanostructured graphene. ACS Nano 2013, 7, 2388–2395. [Google Scholar] [CrossRef] [PubMed]
  27. Ashkan, V.; Nader, E. Transformation optics using graphene. Science 2011, 332, 1291–1294. [Google Scholar]
  28. Ren, J.; Wang, W.; Qiu, W.; Qiu, P.; Wang, Z.; Lin, Z.; Wang, J.X.; Kan, Q.; Pan, J.Q. Dynamic tailoring of electromagnetic behaviors of graphene plasmonic oligomers by local chemical potential. Phys. Chem. Chem. Phys. 2018, 20, 16695–16703. [Google Scholar] [CrossRef]
  29. Ren, J.; Wang, G.; Qiu, W.; Chen, H.; Qiu, P.; Kan, Q.; Pan, J.Q. A flexible control on electromagnetic behaviors of graphene oligomer by tuning chemical potential. Nanoscale Res. Lett. 2018, 13, 349. [Google Scholar] [CrossRef] [Green Version]
  30. Ren, J.; Wang, G.; Qiu, W.; Lin, Z.; Chen, H.; Qiu, P.; Wang, J.X.; Kan, Q.; Pan, J.Q. Optimization of the fano resonance lineshape based on graphene plasmonic hexamer in mid-infrared frequencies. Nanomaterials 2017, 7, 238. [Google Scholar] [CrossRef]
  31. Van Oosten, D.; Kuipers, M.S.L. Nanohole chains for directional and localized surface plasmon excitation. Nano Lett. 2010, 10, 286–290. [Google Scholar] [CrossRef]
  32. Gao, H.; Hyun, J.K.; Min, H.L.; Yang, J.C.; Lincoln, J.L.; Teri, W.O. Broadband plasmonic microlenses based on patches of nanohole. Nano Lett. 2010, 10, 4111–4116. [Google Scholar] [CrossRef] [PubMed] [Green Version]
  33. Xu, F.; Wan, M.; Yan, H.; Xie, G.C. High efficient narrow-band grating spectral filtering technology applied to laser echo detection. Chin. J. Lasers 2018, 45, 1005002. [Google Scholar]
  34. Zhong, H.; Zhang, Y.; Milivoj, R.B.; Zhang, Y. Generating lieb and super-honeycomb lattices by employing the fractional talbot effect. Phys. Opt. 2019, 3, 65. [Google Scholar] [CrossRef]
Figure 1. (a) The graphene sheet is surrounded by air with a dielectric constant ε 0 and placed on silicon dioxide substrate with a dielectric constant ε _ = 3.9. (b) The calculation window of the model structure of the plasmonic Talbot effect.
Applsci 10 04782 g001
Figure 2. | E | 2 field distribution of graphene plasmonic Talbot effect with different incident wavelengths. The chemical potential is 0.3 eV, period is 160 nm, and the input wavelength is (a) λ 0 =7 μm. (b) λ 0 = 8 μm. (c) λ 0 = 9 μm. (d) λ 0 = 10 μm. (e) λ 0 = 11 μm. (f) The imaginary part (described as Im ( n e f f ) = Imag ( β / k 0 ) ) and the real part (denoted by Re ( n e f f ) = Real ( β / k 0 ) ) of the effective refractive index of graphene supported plasmon as a function of the incident wavelength which is obtained from MATLAB.
Applsci 10 04782 g002
Figure 3. The Talbot distance Z T as a function of period D, where the input wavelength is 7 μ m and chemical potential is 0.3 eV.
Applsci 10 04782 g003
Figure 4. (a) Talbot distance varies with chemical potential of graphene and incident wavelength. (b) The imaginary part and the real part of the effective refractive index of graphene supported plasmon as a function of the chemical potential from 0.2 to 0.7 eV, where the wavelength is 7 μm.
Applsci 10 04782 g004
Figure 5. The full width at half maximum of the Talbot effect image’s intensity as a function of incident wavelength and chemical potential.
Applsci 10 04782 g005