Article

Subpopulations of Organoid-Forming Cells Have Different Motility

1
Department of Immunotechnology, Lund University, 223 63 Lund, Sweden
2
Department of ORL, Head and Neck Surgery, Skåne University Hospital, 221 85 Lund, Sweden
3
Phase Holographic Imaging, 223 63 Lund, Sweden
*
Author to whom correspondence should be addressed.
Appl. Sci. 2020, 10(13), 4673; https://doi.org/10.3390/app10134673
Submission received: 29 May 2020 / Revised: 24 June 2020 / Accepted: 2 July 2020 / Published: 7 July 2020
(This article belongs to the Special Issue Applications of Digital Holography in Biomedical Engineering)

Abstract

:
Cancer stem cells from oropharyngeal squamous cell carcinoma (OPSCC) have the ability to self-renew and differentiate into heterogeneous three-dimensional structures carrying features of tumor cells. Here, we describe a simple and label-free method for generating tumor organoids, and imaging them using live digital holographic microscopy (DHM) on the basis of the phase shift caused by light passing through the cells. We show early events of cell aggregation during tumor-organoid formation, and display their heterogeneity in terms of optical parameters up to an optical volume of 105 µm3. Lastly, by sorting OPSCC epithelial cells, we demonstrate that CD44+ cells displayed greater motility and tumor-forming capacity than those of CD44 cells. These results were in line with previous reports highlighting increased invasive and tumorigenic potential in tumor cells expressing high levels of CD44. Our method provides insight into the formation of tumor organoids, and could be used to assess stemness-associated biomarkers and drug screenings on the basis of tumor organoids.

1. Introduction

Oropharyngeal squamous cell carcinoma (OPSCC) is a head-and-neck cancer affecting the tonsils, base of the tongue, pharyngeal walls, and soft-palate region [1]. Despite advances in OPSCC treatment, over 25% of patients relapse, 16% experience local recurrence, and 7% experience distant recurrence [2]. It is important to develop culture methods that recapitulate key events in tumorigenesis, allowing for drug screening in an in vivo-like setting.
Tissue invasion and metastatic capacity are fundamental traits of cancer stem cells (CSCs), a heterogeneous subset of cancer cells with the ability to reproduce tumor complexity at a cellular level [1,3]. When cultured in a hydrogel, CSCs generate 3D structures known as organoids, self-organized cellular structures that exhibit phenotypes resembling those seen in tumors [3,4]. Basement-membrane matrices provide appropriate mechanical stimuli that allow CSCs embedded within them to aggregate, grow, and differentiate, resulting in organoids of different sizes and morphologies [4,5] with the ability to replicate cellular, mechanical, and physical signals that take place in the tumor microenvironment [6,7]. In OPSCC, CD44 and nerve growth-factor receptor (NGFR) are two candidate markers for identifying cancer stem cells [8,9], as shown by a study where CD44+/NGFR+ cells transferred into in vivo models recovered initial tumor heterogeneity [10]. However, loss of NGFR expression in the tonsillar crypt was reported in tonsil-cancer patients [11]. Therefore, studying the organoid-forming ability of different cancer-cell phenotypes may improve our understanding about tumor or metastasis initiation. In vivo tumor behavior can be monitored using transgenic cancer cells expressing bioluminescent or fluorescent proteins. Although useful, these methods generally lack single-cell resolution, are time-consuming, and require extensive manipulation of the model [12].
Here, we present a quick and inexpensive method for imaging organoid formation over short time periods. Homogeneous tumor organoids could be generated by embedding OPSCC-tumor cells in a hydrogel. The motility of single cells and the optical properties of organoids could be monitored, and used to determine aggregation events and organoid growth over time. Using this setup, we confirmed the motility and capability of CD44-enriched OPSCC cells to form organoids using the HoloMonitor M4 (Phase Holographic Imaging AB (PHI), Lund, Sweden) instrument.

2. Materials and Methods

2.1. Organoid Culture

The p16+ human papillomavirus (HPV16+) HN26 cell line (LU-HNSCC-26) isolated from a 48-year-old nonsmoking man diagnosed with poorly differentiated tonsillar squamous-cell carcinoma (Stage T2N0M0) was previously described [13]. Cells were detached from the culture flask using trypsin, and resuspended in organoid media: advanced Dulbecco’s Modified Eagle’s Medium (DMEM)/F-12 (Thermo Fisher Scientific, Waltham, MA, USA) supplemented with 300 mg/mL N2, 600 mg/mL B-27 (Thermo Fisher Scientific, Waltham, MA, USA), 50 ng/mL fibroblast growth factor-2, 50 ng/mL epidermal growth factor (PeproTech, Rocky Hill, CT, USA), and 25 µM Y-27632 (Sigma-Aldrich, St. Louis, MO, USA). One single drop of 50 µL hydrogel solution (Matrigel, Corning, Corning, NY, USA) was placed in the center of each well in 24-well suspension plates (Starstedt, Nümbrecht, Germany). Cells were then manually injected into the hydrogel drop, reaching a final 1:5 (v/v) cell-suspension-to-hydrogel ratio at seeding densities ranging from 100 to 1000 cells/µL of hydrogel. To avoid hydrogel gelation, all material used was kept at 4 °C until seeding. Solidification of the hydrogel was ensured by incubating the plates upside down at 37 °C for 30 min. Lastly, 1.8 mL of organoid media was added to each well, and contact between media and HoloLids (PHI, Lund, Sweden) was ensured for optimal holographic imaging.
Prior to injection of the cells, both hydrogel and organoid medium underwent short vacuuming treatment in a desiccator. This step was carried out to minimize the amount of bubbles present in both medium and hydrogel after injection, since their appearance greatly disturbs the imaging process.

2.2. Holographic Phase-Contrast Microscopy

Organoid formation was monitored with HoloMonitor M4, which is based on digital holography. Low-intensity laser light passes through the cells, resulting in a cell-density-dependent phase shift of the light. The phase shift is translated into cell thickness by HoloStudio software (PHI, Lund, Sweden) [14,15,16].
HoloMonitor M4 was placed in a cell-culture incubator at 37 °C with 5% CO2 and 95% humidity. Time-lapse images of organoid formation were taken from several positions every 30 min. Data on accumulated cell motility, aggregation, and organoid growth were obtained by analysis with HoloStudio v2.7.4 software. In the current work, accumulated motility was defined as the movement of cells embedded in the hydrogel over time. Briefly, single cells were identified by establishing a cutoff diameter of 20 µm. After that, cells were tracked in time-lapse experiments to monitor cell motility and aggregation events, followed by analysis of organoid homogeneity according to the increase in area, optical volume, and optical thickness over time. The percentage of single cells that did not form organoids was calculated according to the difference between the number of single cells identified in the first and last frames of a given time lapse.

2.3. Flow Cytometry and Phenotypic Study

In order to study the behavior of different OPSCC phenotypes, cells were stained with primarily conjugated antibodies CD44 APC-H7 (G44-26) and NGFR BV711 (C40-1457; BD Biosciences, San Jose, CA, USA). Flow-cytometry analysis and sorting cell suspensions were performed using FACSAria IIu (BD Biosciences, San Jose, CA, USA). Briefly, doublet exclusion was conducted on viable cells using Fixable Viability Stain 620 (BD Biosciences, San Jose, CA, USA). Then, cell sorting was performed on the basis of CD44 and NGFR expression, and resulted in three phenotypes: CD44+/NGFR, CD44+/NGFR+, and CD44/NGFR. Sorted cells were resuspended in organoid medium and cultured as described above at a cell density of 200 cells/µL of hydrogel. Flow-cytometry data were analyzed using FlowJo v10.6.2 software (FlowJo LLC, Ashland, OR, USA).

3. Results

3.1. Organoid Formation from OPSCC Cells

Our first step was determining the conditions that could be used to obtain a reliable number of homogeneous organoids within a time range of 24 h. To this end, we compared seeding densities of 100 and 1000 cells/µL hydrogel in a total volume of 50 µL, and assessed organoid formation with HoloMonitor M4. As depicted in Figure 1, all seeding densities tested allowed for the generation of organoids within 24 h after seeding. The obtained number and characteristics of the organoids varied depending on seeding density, where 100 cells/µL resulted in 102 ± 36 organoids/mm2, with median area 1234 µm2, optical volume 14,377 µm3, and optical thickness 13 µm; 1000 cells/µL resulted in 47 ± 34 organoids/mm2, with median area 2879 µm2, optical volume 71,651 µm3, and optical thickness 22 µm. Together, these results showed that seeding densities impacted the size and optical properties of organoids, and that close contact between cells, and therefore exposure to chemical and biological signals, favored organoid formation. HoloMonitor M4 monitored organoid formation up to a volume of approximately 105 µm3. For larger organoids, insufficient light for analysis passed through the organoid structures.
After selecting the appropriate seeding-density range to obtain homogeneous organoids, we assessed 3D-structure formation over time. Single cells were identified using a cutoff diameter of 20 µm and tracked over 15 h to assess events influencing organoid formation and growth (Figure 2). Organoids started forming 2 h after seeding, and overall growth was monitored by the increase in area and optical thickness over time. During the first 8 h, cell-aggregation events dominated organoid formation; in the last 7 h, organoids were fully formed, and displayed stable diameter and optical-thickness measurements.

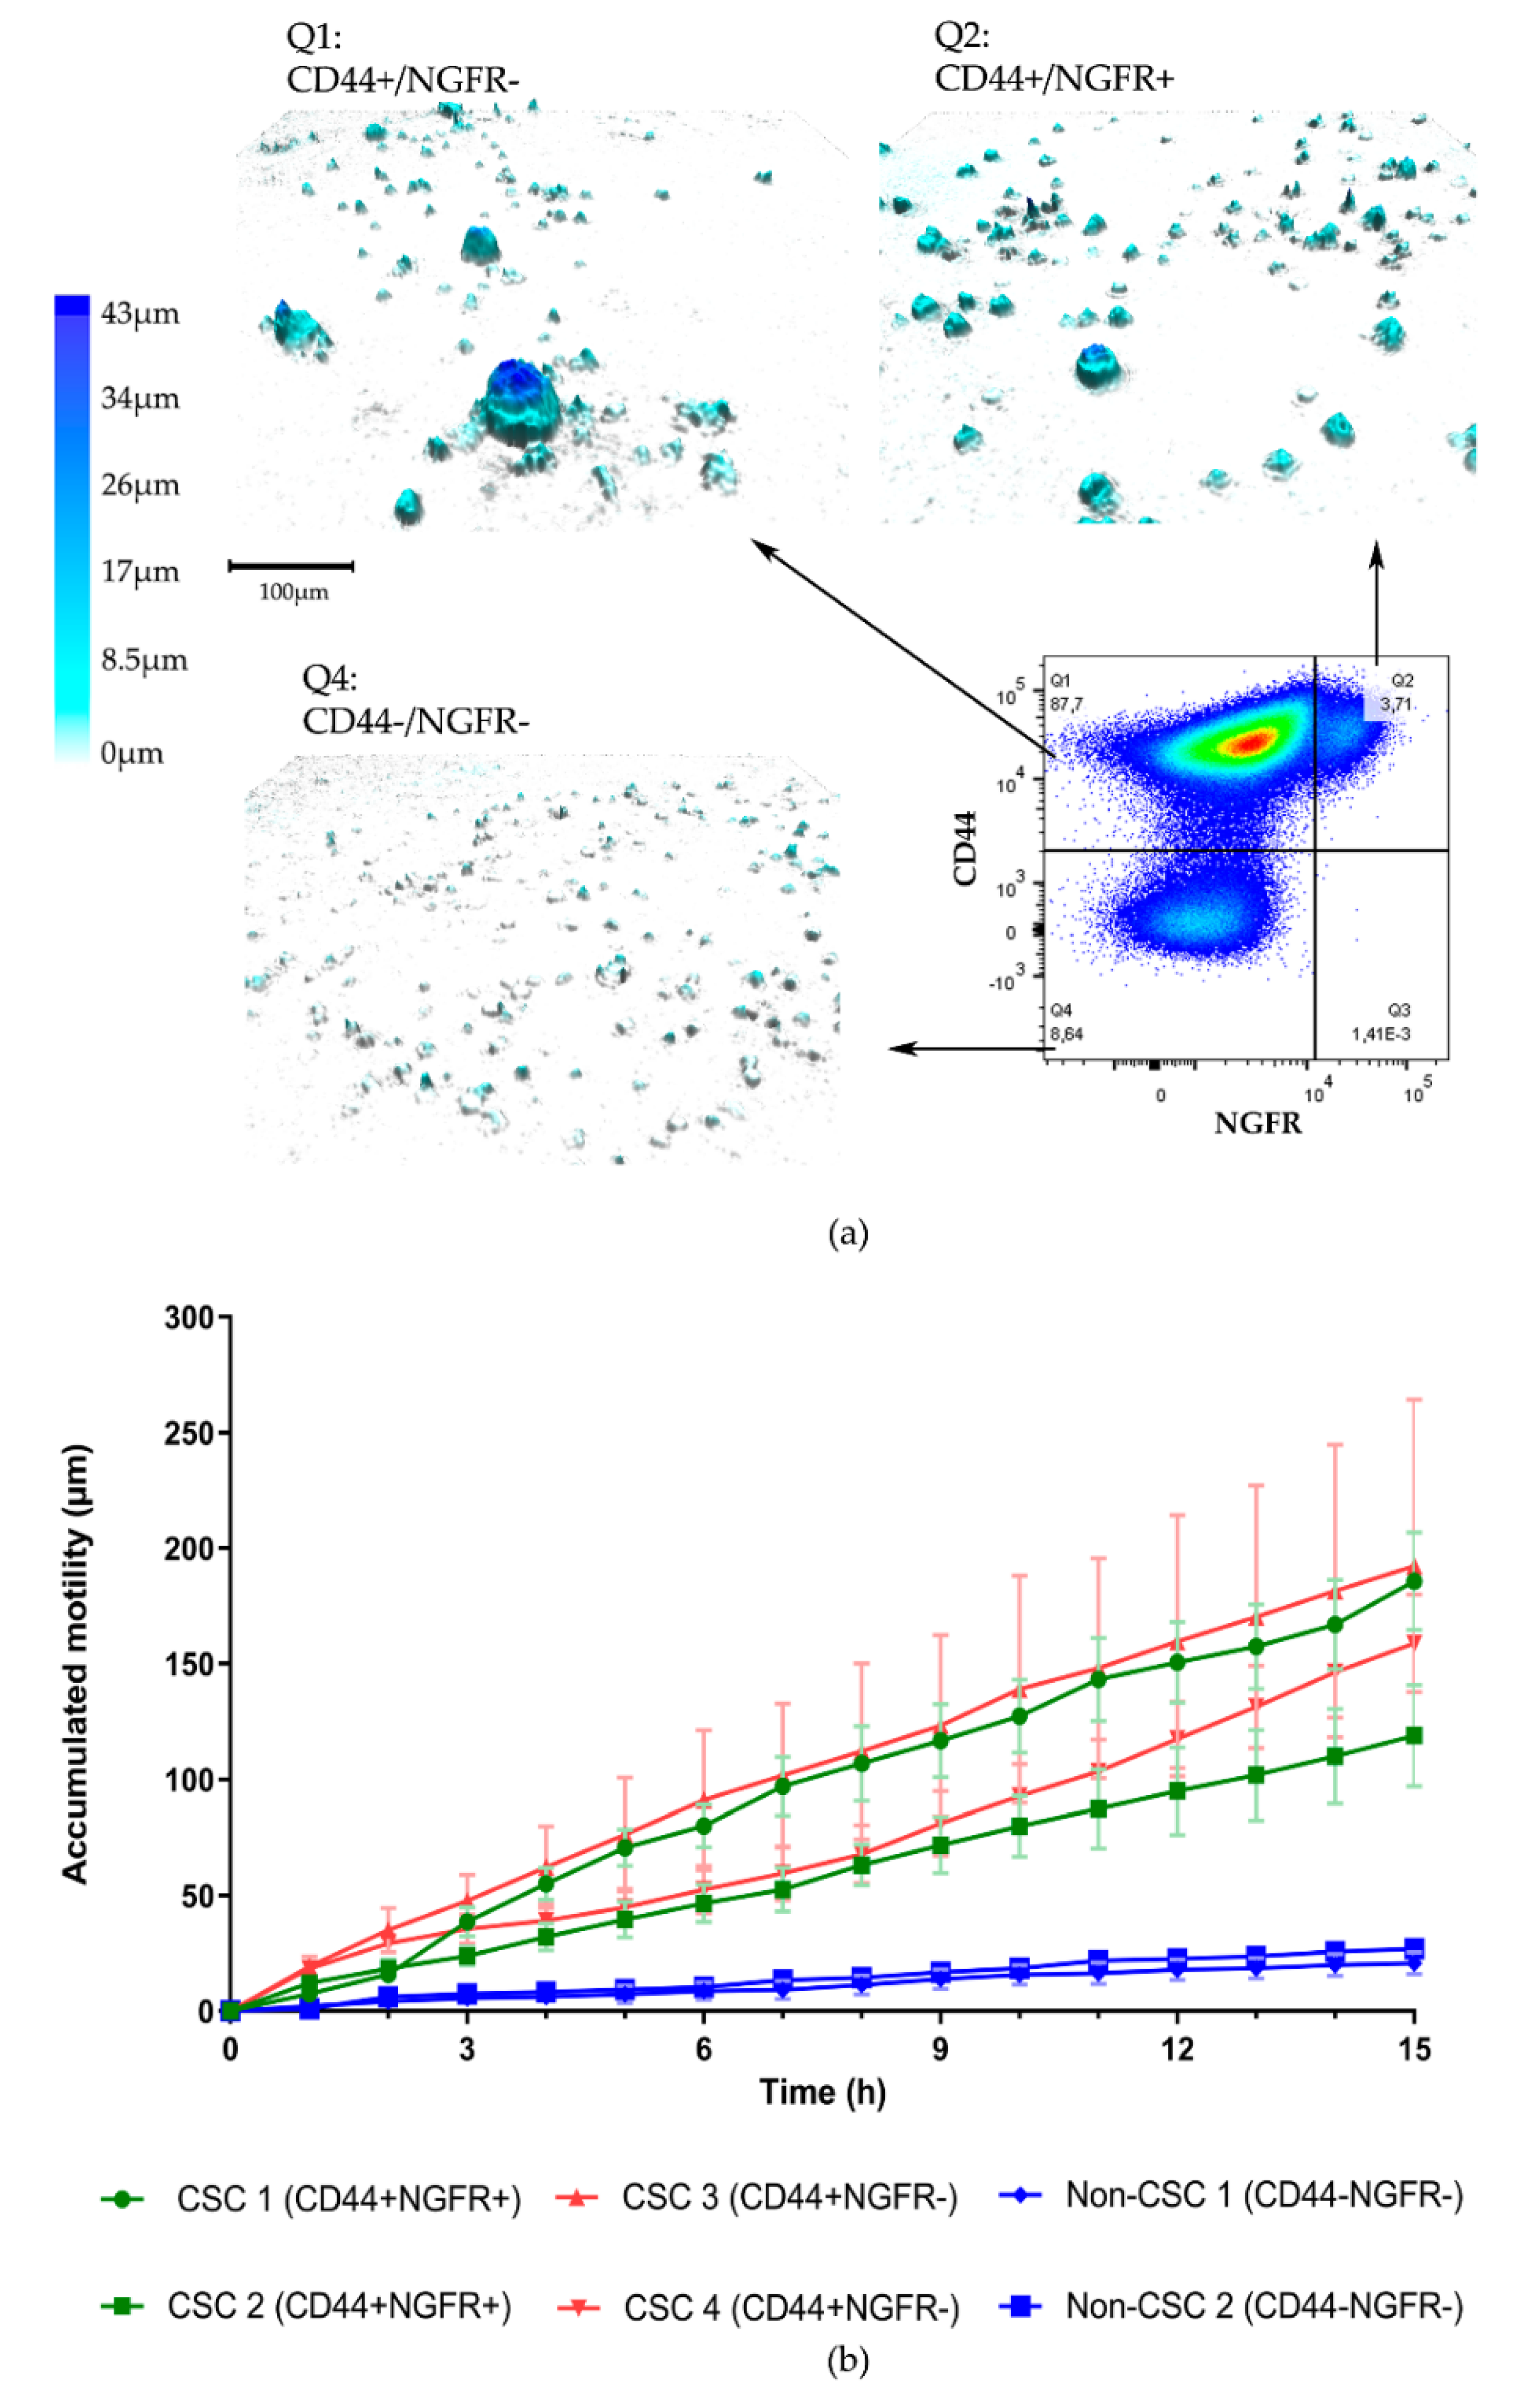
3.2. Organoid Formation from Sorted Cells

During organoid formation, most single cells in the cultures aggregated and formed organoids. Nevertheless, 14% of OPSCC cells did not form any 3D structure, indicating that there may have been subgroups of cells with different organoid-forming capabilities. Cancer stem-like cells have the ability to form organoids [6]. Thus, the organoid-formation capacity and differential motility of individual OPSCC cells were assessed by sorting them according to their expression of CD44 and NGFR, two well-established CSC-related markers [10]. After sorting, cells from three different phenotypes, CD44+/NGFR+, CD44+/NGFR, and CD44/NGFR, were seeded in hydrogel and tracked using HoloMonitor M4. In total, for each phenotype, five individual cells from two replicates were tracked over 15 h at 30 different time points.
As depicted in Figure 3, cells enriched for CD44 expression (Figure 3a) were able to form 3D structures within 15 h after seeding, independently of NGFR expression. CD44 tumor cells were unable to aggregate (Figure 3a), consistent with their reported nonstem-cell phenotype. In addition, cells enriched for CD44 expression displayed greater average motility (140–240 µm), while CD44 tumor cells moved less through the hydrogel (~30 µm; Figure 3b).

4. Discussion

Many different organoid systems enable researchers to study cells in a tumor environment in vitro [4,5], but the development of methods for understanding organoid formation is needed to study tumor initiation. Cell motility is an important feature as it is suggestive of invasiveness and, when monitored along organoid formation, arguably informs about the metastatic capacity of tumor cells [17]. Nonetheless, quantitative methods for studying these early events are scarce, as conventional migration assays such as wound-healing and transwell assays do not evaluate growth in 3D [18]. In turn, in vitro 3D cultures are commonly imaged using bright-field, fluorescence, or phase-contrast microscopy [19], where organoid formation is not continuously monitored. Bright-field and phase-contrast images show qualitative data rather than quantitative, although in precisely focused, high-quality images, some structures can be measured [20]. Live fluorescence-microscopy monitoring is useful since it enables the visualization of cell subsets in a complex mixture, but it causes phototoxicity [20,21] that could compromise obtained results. In this study, we presented a method for generating organoids from cells in suspension and monitoring their formation by measuring optical properties. Collected data using quantitative phase imaging were based on the phase shift of the light, making the images fully quantifiable [20]; since light intensity in HoloMonitor M4 is 0.2 mW/cm2, it did not cause any measurable phototoxicity [22].
We showed that organoids could be obtained from cell concentrations of 100 to 1000 cells/µL in hydrogel within 15 h. Optical thickness and volume increased with organoid size, highlighting the homogeneity of 3D structures. However, inaccurate measurements of optical parameters were observed in structures with an optical volume above 105 µm3, which highlighted the limitations of the method. By tracking multiple single cells and establishing a threshold on the basis of size, we observed that aggregation events took place up to 8 h after seeding, acquiring fully defined sphere shapes from that point onwards.
To show an application of the method, we evaluated the association between cell motility and organoid-formation capacity on the basis of the expression of CSC markers CD44 and NGFR. Here, we showed that CD44-enriched CSCs had greater ability to move and form organoids, something that may be correlated with the higher tumorigenic potential of this subset [17,23]. CD44+ tumor cells were linked to a stem-like phenotype because of their expression of stemness-related genes Sox2 and Nanog, as well as epithelial–mesenchymal-transition markers, such as vimentin, which are governed by increased signaling through the Wnt/β-catenin pathway [24].
In summary, the present method could be a useful tool for evaluating organoid initiation, and thus be implemented in drug screenings attempting to target early stages of tumor initiation in a label-free manner. To this end, cell density should be carefully examined for each cell type, and the tested substances should be able to diffuse into the hydrogel without causing structural changes in the extracellular matrix.

Author Contributions

Conceptualization, D.G.J., K.A., L.G., and M.L.; methodology, D.G.J., S.C.S., K.A., and M.L.; formal analysis, D.G.J., S.C.S., K.A., and M.L.; resources, K.A., L.G., and M.L.; writing—original-draft preparation, D.G.J., S.C.S., and K.A.; writing—review and editing, D.G.J., S.C.S., L.G., K.A., and M.L.; project administration, K.A. and M.L.; funding acquisition, M.L. All authors have read and agreed to the published version of the manuscript.

Funding

This research was funded by EU-H2020-MSCA-COFUND-2016-754299 and the Cancera Foundation.

Acknowledgments

The authors would like to acknowledge Johan Wennerberg and Lars Ekblad for their contribution to the present work by supplying primary OPSCC cell lines.

Conflicts of Interest

David Gomez Jimenez, Sofia Carreira Santos, Lennart Greiff, and Malin Lindstedt declare no conflict of interest. Kersti Alm is employed by Phase Holographic Imaging, the manufacturer of HoloMonitor M4.

References

  1. Monroe, M.M.; Anderson, E.C.; Clayburgh, D.R.; Wong, M.H. Cancer stem cells in head and neck squamous cell carcinoma. J. Oncol. 2011, 2011, 762780. [Google Scholar] [CrossRef] [PubMed] [Green Version]
  2. Grønhøj, C.; Jakobsen, K.K.; Jensen, D.H.; Rasmussen, J.; Andersen, E.; Friborg, J.; von Buchwald, C. Pattern of and survival following loco-regional and distant recurrence in patients with HPV+ and HPV− oropharyngeal squamous cell carcinoma: A population-based study. Oral Oncol. 2018, 83, 127–133. [Google Scholar] [CrossRef] [PubMed]
  3. Krishnamurthy, S.; Nör, J.E. Orosphere assay: A method for propagation of head and neck cancer stem cells. Head Neck 2013, 35, 1015–1021. [Google Scholar] [CrossRef] [PubMed] [Green Version]
  4. Gao, D.; Vela, I.; Sboner, A.; Iaquinta, P.J.; Karthaus, W.R.; Gopalan, A.; Dowling, C.; Wanjala, J.N.; Undvall, E.A.; Arora, V.K.; et al. Organoid cultures derived from patients with advanced prostate cancer. Cell 2014, 159, 176–187. [Google Scholar] [CrossRef]
  5. Panek, M.; Grabacka, M.; Pierzchalska, M. The formation of intestinal organoids in a hanging drop culture. Cytotechnology 2018, 70, 1085–1095. [Google Scholar] [CrossRef] [Green Version]
  6. Mehta, P.; Novak, C.; Raghavan, S.; Ward, M.; Mehta, G. Self-Renewal and CSCs In Vitro Enrichment: Growth as Floating Spheres. Methods Mol. Biol. 2018, 1692, 61–75. [Google Scholar] [CrossRef] [Green Version]
  7. Fennema, E.; Rivron, N.; Rouwkema, J.; van Blitterswijk, C.; de Boer, J. Spheroid culture as a tool for creating 3D complex tissues. Trends Biotechnol. 2013, 31, 108–115. [Google Scholar] [CrossRef]
  8. Ghuwalewala, S.; Ghatak, D.; Das, P.; Dey, S.; Sarkar, S.; Alam, N.; Panda, C.K.; Roychoudhury, S. CD44(high)CD24(low) molecular signature determines the Cancer Stem Cell and EMT phenotype in Oral Squamous Cell Carcinoma. Stem Cell Res. 2016, 16, 405–417. [Google Scholar] [CrossRef] [Green Version]
  9. Kang, S.Y.C.; Kannan, N.; Zhang, L.; Martinez, V.; Rosin, M.P.; Eaves, C.J. Characterization of Epithelial Progenitors in Normal Human Palatine Tonsils and Their HPV16 E6/E7-Induced Perturbation. Stem Cell Rep. 2015, 5, 1210–1225. [Google Scholar] [CrossRef] [Green Version]
  10. Murillo-Sauca, O.; Chung, M.K.; Shin, J.H.; Karamboulas, C.; Kwok, S.; Jung, Y.H.; Oakley, R.; Tysome, J.R.; Farnebo, L.O.; Kaplan, M.J.; et al. CD271 is a functional and targetable marker of tumor-initiating cells in head and neck squamous cell carcinoma. Oncotarget 2014, 5, 6854–6866. [Google Scholar] [CrossRef] [Green Version]
  11. Wu, V.; Auchman, M.; Mollica, P.A.; Sachs, P.C.; Bruno, R.D. ALDH1A1 positive cells are a unique component of the tonsillar crypt niche and are lost along with NGFR positive stem cells during tumourigenesis. Pathology 2018, 50, 524–529. [Google Scholar] [CrossRef] [PubMed]
  12. Zhong, R.; Pytynia, M.; Pelizzari, C.; Spiotto, M. Bioluminescent imaging of HPV-positive oral tumor growth and its response to image-guided radiotherapy. Cancer Res. 2014, 74, 2073–2081. [Google Scholar] [CrossRef] [Green Version]
  13. Forslund, O.; Sugiyama, N.; Wu, C.; Ravi, N.; Jin, Y.; Swoboda, S.; Andersson, F.; Bzhalava, D.; Hultin, E.; Paulsson, K.; et al. A novel human in vitro papillomavirus type 16 positive tonsil cancer cell line with high sensitivity to radiation and cisplatin. BMC Cancer 2019, 19, 265. [Google Scholar] [CrossRef] [PubMed] [Green Version]
  14. Gustafsson, M.; Sebesta, M.; Bengtsson, B.; Pettersson, S.G.; Egelberg, P.; Lenart, T. High-resolution digital transmission microscopy—A Fourier holography approach. Opt. Lasers Eng. 2004, 41, 553–563. [Google Scholar] [CrossRef] [Green Version]
  15. Kim, M. Principles and techniques of digital holographic microscopy. SPIE Rev. 2010, 1, 018005. [Google Scholar] [CrossRef] [Green Version]
  16. Sebesta, M.; Egelberg, P.; Langberg, A.; Lindskov, J.-H.; Alm, K.; Janicke, B. HoloMonitor M4: Holographic imaging cytometer for real-time kinetic label-free live-cell analysis of adherent cells. Proc. SPIE. 2016, 971813. [Google Scholar] [CrossRef]
  17. Hiraga, T.; Ito, S.; Nakamura, H. Cancer Stem–like Cell Marker CD44 Promotes Bone Metastases by Enhancing Tumorigenicity, Cell Motility, and Hyaluronan Production. Cancer Res. 2013, 73, 4112–4122. [Google Scholar] [CrossRef] [Green Version]
  18. Wingren, A.G. Moving into a new dimension: Tracking migrating cells with digital holographic cytometry in 3D. Cytom. A 2019, 95, 144–146. [Google Scholar] [CrossRef] [Green Version]
  19. Azharuddin, M.; Roberg, K.; Dhara, A.K.; Jain, M.V.; Darcy, P.; Hinkula, J.; Slater, N.K.H.; Patra, H.K. Dissecting multi drug resistance in head and neck cancer cells using multicellular tumor spheroids. Sci. Rep. 2019, 9, 20066. [Google Scholar] [CrossRef]
  20. Kasprowicz, R.; Suman, R.; O’Toole, P. Characterising live cell behaviour: Traditional label-free and quantitative phase imaging approaches. Int. J. Biochem. Cell Biol. 2017, 84, 89–95. [Google Scholar] [CrossRef]
  21. Laissue, P.P.; Alghamdi, R.A.; Tomancak, P.; Reynaud, E.G.; Shroff, H. Assessing phototoxicity in live fluorescence imaging. Nat. Methods 2017, 14, 657–661. [Google Scholar] [CrossRef] [PubMed] [Green Version]
  22. Logg, K.; Bodvard, K.; Blomberg, A.; Kall, M. Investigations on light-induced stress in fluorescence microscopy using nuclear localization of the transcription factor Msn2p as a reporter. FEMS Yeast Res. 2009, 9, 875–884. [Google Scholar] [CrossRef] [PubMed] [Green Version]
  23. Davis, S.; Divi, V.; Owen, J.; Bradford, C.; Carey, T.; Papagerakis, S.; Prince, M. Metastatic Potential of Cancer Stem Cells in Head and Neck Squamous Cell Carcinoma. Arch. Otolaryngol. Head Neck Surg. 2010, 136, 1260–1266. [Google Scholar] [CrossRef] [PubMed] [Green Version]
  24. Le, P.N.; Keysar, S.B.; Miller, B.; Eagles, J.R.; Chimed, T.S.; Reisinger, J.; Gomez, K.E.; Nieto, C.; Jackson, B.C.; Somerset, H.L.; et al. Wnt signaling dynamics in head and neck squamous cell cancer tumor-stroma interactions. Mol. Carcinog. 2019, 58, 398–410. [Google Scholar] [CrossRef] [PubMed]
Figure 1. Seeding-density conditions and optical properties of organoids imaged with HoloMonitor M4. Oropharyngeal squamous-cell carcinoma (OPSCC) cells imaged 15 h after seeding at densities of (a) 100 and (b) 1000 cells/µL, both obtained by digital holographic microscopy (DHM). (c) Scatter plot displaying optical volume and thickness of organoids obtained using seeding densities of 100 and 1000 cells/µL (n = 3).
Applsci 10 04673 g001
Figure 2. Organoid-formation events monitored over 15 h using DHM. (a) DHM images captured at different time points (0, 7.5, and 15 h) in a hydrogel-embedded culture system. (b) Increase in area and optical-volume patterns of five organoids tracked over 15 h at 30 different time points.
Applsci 10 04673 g002
Figure 3. Organoid-formation ability and motility of different oropharyngeal squamous cell carcinoma-cell phenotypes. (a) Cells derived from quadrants Q1 and Q2 included cancer-stem-cell (CSC) phenotypes CD44+/NGFR (Q1) and CD44+/NGFR+ (Q2). Q4 contained the CD44/NGFR nonstem-cancer-cell population. DHM images obtained for each cell phenotype (Q1, Q2, and Q4) at t = 15 h. (b) Average accumulated motility of single cells according to expression of CD44 and NGFR. Five single cells were monitored for each phenotype in duplicates.
Applsci 10 04673 g003

