Featured Application
This paper presents test results from non-destructive testing performed to detect both metallic and non-metallic reinforcement laid in bed joints of the masonry wall.
Abstract
Detecting non-metallic reinforcement made of FRP (Fibre Reinforced Polymers) can be problematic, particularly at the stage of work inspection and constructional evaluation. In contrast to steel reinforcement, detecting non-metallic reinforcement is difficult using NDT (Non-Destructive Testing) techniques. These difficulties mainly arise from considerably lower density, radiation resistance or electromagnetic impedance and cross-section of rebars when compared to steel reinforcement. Specific problems with the reinforcement detection are experienced in masonry structures, in which reinforcement is laid in bed joints. Measurements are made on a masonry face in the plane perpendicular to the reinforcement plane, and not the parallel one compared to reinforced concrete structures. Thus, the interpretation of results obtained from NDT can be complicated due to many physical phenomena occurring during tests, methods of presenting measurements and their accuracy. This paper compares different testing techniques used to detect non-metallic reinforcement in the masonry wall made of autoclaved aerated concrete (AAC). For the purpose of the tests, fibreglass and basalt meshes, traditional steel trusses and steel wire meshes were placed in bed joints of the masonry wall. An ultrasonic tomography and GPR (Ground-Penetrating Radar) scanner operating within a broad range of frequencies were used for the tests. We also used the electromagnetic device to detect metal meshes. As expected, the tests confirmed problems with detecting the non-metallic reinforcement. Only the radar method was effective in detecting the non-metallic method, whereas other methods failed. The electromagnetic method detected only the steel reinforcement in the masonry.
1. Introduction
Non-metallic Fiber Reinforced Polymer (FRP) reinforcement is used in the building sector as an alternative to conventional bars and steel meshes for reinforcing concrete and masonry. Durability, and particularly resistance to corrosion, high tensile strength, and very low specific gravity are advantages of this reinforcement. That is why non-metallic reinforcement is more commonly used. However, strength characteristics of this material, the lack of clear qualitative standards for its production, resistance to high temperatures and, until recently, the lack of design procedures have raised a series of doubts.
Non-metallic reinforcement in concrete structures is usually applied in wall and slab elements, which do not require any bent bars, and reinforcement anchorage can be performed easily [1,2]. Moreover, research works have been conducted on the reinforcement for beam elements without stirrups [3] and the preparation of hybrid beams with steel and non-metallic reinforcement [4]. No restrictions on employing reinforcement in elements exposed to puncturing and twisting are known [3]. Minor plastic deformations reduce the possibility of using non-metallic reinforcement in structures, for which redistribution of bending moments (slabs and continuous beams) is permitted.
In masonry structures, non-metallic reinforcement is applied in regions of concentrated stresses, such as the zone below the window [5,6,7], regions of concentrated loads [8] and zones connecting perpendicular walls [9]. Reinforcement can be used to reduce the risk of crack formation or to provide higher strength capacity to the element [10,11,12,13,14,15,16]. Bed joint reinforcement can be also applied in structures exposed to seismic effects. Masonry walls used as reinforced concrete frame infill are particularly susceptible to cracking [17,18,19,20,21,22]. Reinforcement laid in bed joints limits the width of cracks developed in this type of wall.
The more common uses of non-metallic reinforcement in reinforced concrete and masonry structures create problems with their diagnosing. Detecting small-diameter non-metallic reinforcement after completing the wall, at the stage of works acceptance or constructional evaluation is difficult and often requires professional diagnostic equipment. In practice, uncovering each bed joint of the masonry wall to detect the reinforcement is unlikely. Hence, non-destructive testing is the only alternative; however, this is difficult because reinforcement is in the plane perpendicular to the wall face. This article describes the results from non-destructive tests that were conducted to detect the metallic and non-metallic bed joint reinforcement in the AAC masonry wall using different diagnostic techniques. We prepared tests elements and performed non-destructive tests using the GPR equipment, the electromagnetic equipment and the ultrasonic tomograph. The ultrasonic tomograph with 24 exponential transducers, the GPR equipment with antennae having a frequency range of 0.2–4.0 GHz, and the electromagnetic equipment with one transmitting coil and seven pairs of receiving coils were selected for the tests. The main objective of these tests was to detect the non-metallic reinforcement laid in thin bed joints of the masonry wall that was made of autoclaved aerated concrete. These tests were conducted using different and commonly applied non-destructive techniques.
2. Potential of Non-Destructive Tests for Detecting the Reinforcement
Currently, non-destructive tests that are conducted to detect reinforcement in structures involve radar, electromagnetic, radiologic (radiographic), ultrasonic and tomography techniques [23,24,25,26]. The radiologic technique was commonly applied in the 1960s and 1970s, since it produced the best results. This technique is based on X, γ, or other hard radiation and its recording that follows radiation emitted to the tested facility. During the tests on structures, radiation was recorded using special photographic films sensitive to ionising radiation. Radiographic techniques are now rarely used because of their long test duration, time-consuming elaboration of results and the exposure of operators performing measurements to harmful effects of hard radiation. Accuracy and a wide range (depth) of measurements are the unquestionable advantages of radiology.
The ultrasonic technique is an acoustic technique based on the analysis of relations between the velocity of elastic waves with a frequency higher than 20 kHz, which propagate in solid medium, and the properties of that medium. These methods are mainly employed to determine the strength of concrete and masonry, to detect voids and discontinuities in the structure, and to test crack depths. Due to different velocity of an acoustic wave in concrete/masonry and reinforcement, and the effects of wave interference and reflection, the ultrasonic technique can be applied to detect reinforcement. The typical frequency of ultrasonic waves used to detect reinforcement varies from 20 to 100 kHz. Until recently, the method had not been suitable for locating the reinforcement due to its low accuracy. Modern devices for ultrasound tomography increase the measuring accuracy as the elastic wave is induced by a multi-head antenna equipped with many independent ultrasonic transducers. This is why efforts have been made to detect reinforcement using this method [27,28,29,30,31,32].
Infrared thermography consists of recording, processing, and visualising the invisible IR emitted by a body. Infrared thermography usually uses the medium IR band with a wavelength of 0.9–14 μm. A thermal image (thermogram) is the result of tests capturing temperature distribution over the area of a tested body. Non-destructive tests using infrared thermography can be divided into procedures of passive and active tests [26,33,34]. Passive thermography analyses heat emitted by material without any additional thermal simulation, whereas active thermography is based on thermal analyses of the material response after its exposure to heat. Thermography can be used to detect reinforcement as concrete and steel have different thermal properties. Hence, this technique gives very promising results [33,34,35].
Currently, electromagnetic and radar techniques are the most popular non-destructive techniques for detecting reinforcement. Electromagnetic methods for locating reinforcement in reinforced concrete elements usually include the analysis of changes in the magnetic field near rebars [22,23,36]. However, they are suitable only for detecting metallic reinforcement. The GPR (Ground-Penetrating Radar) method is based on emitting electromagnetic waves in ultra-short and short frequencies of radio waves and recording waves reflected from layers characterised by variable dielectric properties. This technique had rarely been used for reinforced concrete structures until the 1980s [24,25,37]. At that time, both the measuring technique and the methods of interpreting results were improved. Currently, many measuring systems are available that vary in measurement ranges and levels of result interpretation. Thus, the GPR technique is often used to localise reinforcement [38]. The assumed measurement range of 1.0–3.0 GHz offered by devices available on the market limits the method accuracy. Lower frequencies enable to make tests at greater depths, and higher ones to detect small bodies localised near a tested edge. Density and porosity of tested concrete also affect the results. Due to wave suppression, tests are usually performed on concrete with the standard density within the range of 2400–2700 kg/m3, less commonly on light concrete with a density from 350 to 1500 kg/m3.
Non-metallic reinforcement applied in reinforced concrete structures is usually characterised by diameters greater than or equal to 5 mm, whereas masonry structures (with standard or thin joints) usually have meshes with weaves up to 1 mm in diameter, which are more difficult to localise. Problems with detecting reinforcement in masonry structures are also caused by its location. Contrary to reinforced concrete structures, reinforcement is horizontal, that is, in a perpendicular direction to the tested area because it is usually laid in head joints of the masonry, often in thin joints.
This article describes an attempt to detect the non-metallic reinforcement in the masonry wall using different diagnostic techniques. The ultrasonic tomograph with 24 exponential transducers and the GPR device equipped with antennae having a wide range of frequencies 0.2–4.0 GHz were employed in the tests.
3. Experimental Campaign
3.1. Test Specimens
Two masonry specimens were prepared to detect the reinforcement. Each of them contained four masonry units made of AAC, with the strength fb = 4.04 N/mm2 and nominal density of 600 kg/m3, which were placed on thin-layer mortar of class M5. Test results for masonry units of the mortar and the masonry itself are described in the papers [10]. The specimens had a width equal to a width of a single masonry unit, a height of 970 mm and a thickness of 180 mm. The thickness of the bed joints was 3 mm in accordance with the standard EN 1996-1-1 [39]. Different types of reinforcement (Figure 1) were laid in individual joints of both specimens. The applied reinforcement included two metallic meshes, two meshes from fibreglass and two meshes from basalt fibre.
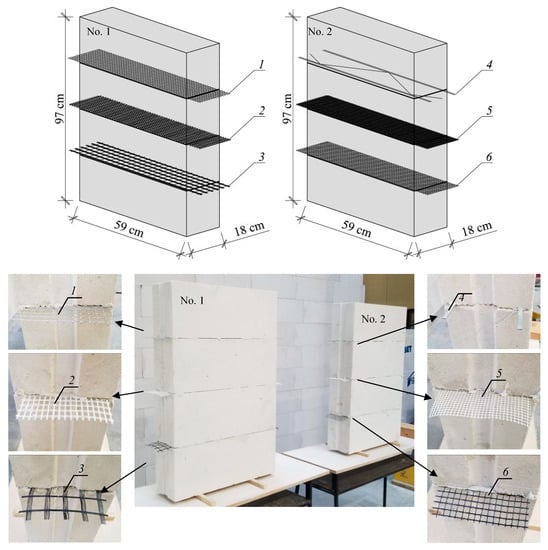
Figure 1.
Masonry specimens used in tests: 1—steel mesh reinforcement (size 12 × 12 mm), 2—fibreglass mesh reinforcement (size 10 × 12 mm), 3—basalt mesh reinforcement (size 30 × 30 mm), 4—truss-type reinforcement, 5—fibreglass mesh reinforcement (size 5 × 5 mm), 6—basalt mesh reinforcement (size 8 × 8 mm).
The steel mesh with wires having a diameter of 1.2 mm and mesh size of 12 × 12 mm (Figure 2a) was laid in the top joint in the first test sample. The mesh wires were protected against corrosion by hot dip galvanization. The fibreglass mesh with latex protective coat and a window size 10 × 12 mm was used in the central joint. Its weft section was 0.42 × 2 mm, and a warp was composed of three fibres with the smallest section of 2 × 0.2 × 0.4 mm (Figure 2b). The mesh density was 2500 kg/m3. A basalt mesh with a window size 30 × 30 mm was in the bottom joint. The weft section was 0.8 × 3.2 mm, and the warp was composed of four fibres with the smallest section of 0.3 × 0.9 mm (Figure 2c). The mesh density was 1800 kg/m3.
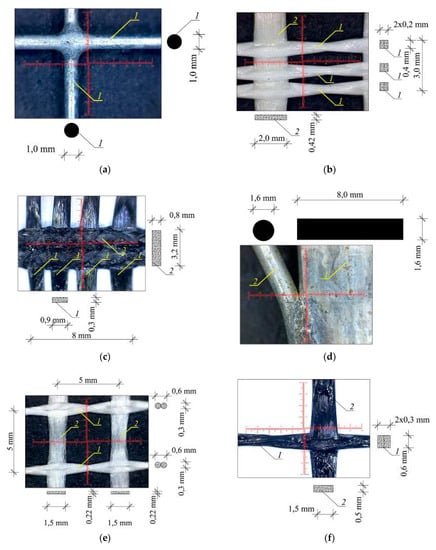
Figure 2.
Microscopic view of reinforcement used in tests: (a) steel mesh reinforcement with a diameter of 1.2 mm, (b) fibreglass mesh (size 10 × 12 mm), (c) basalt fibre mesh (size 30 × 30 mm), (d) truss-type reinforcement, (e) fibreglass mesh (size 5 × 5 mm), (f) basalt fibre mesh (size 10 × 10 mm).
Additional tests were performed on the unreinforced masonry wall for comparative purposes. That wall is shown in Figure 1, behind specimens No. 1 and 2.
The top joint in the second specimen had a truss reinforcement of EFZ 140/Z 140 type intended for masonry walls built on thin joints. That reinforcement was composed of two flat bars with a section of 1.6 × 8 mm (design strength of strip steel fy = 685 N/mm2 acc. to the code [40]) and trussing from a wire having a diameter of 1.6 mm (Figure 2d). The spacing of flat bars was 140 mm, and the reinforcement was protected against corrosion by hot dip galvanization. The fibreglass mesh (size 5 × 5 mm) was in the central joint. The weft section was 0.22 × 1.5 mm, and the warp was composed of two fibres with a smallest diameter of 0.3 mm (Figure 2e). The mesh density was 2550 kg/m3. Basalt mesh size of 10 × 10 mm TBM Reinforcement Fiberglass Geogrid (maximum strength of 1 m of mesh determined acc. to [41], method A—testing a weft -38.7 kN/m, testing a warp—22.7 kN/m) was laid in the bottom joint in the second test sample. The mesh had a weft section of 0.5 × 1.5 mm, and a warp with the smallest section of 2 × 0.3 × 0.6 mm (Figure 2f). The basalt mesh density was 1800 kg/m3.
3.2. Measurement Techniques and Equipment
The tests were performed with the ultrasonic tomograph and the GPR device. Additionally, the electromagnetic scanner was used for the masonry specimens. The applied equipment is shown in Figure 3. The ultrasonic tomograph (Pundit 250 Array—manufacturer Proceq AG, Schwerzenbach, Switzerland) was equipped with eight measuring transducers in each three rows, operating within a frequency range of 50 kHz. Each measuring transducer was emitting an ultrasonic shear wave. The working principles are that one channel transmits and the others are listening, each receiving a separate so-called A-scan (ultrasonic signal described by the dependence of amplitude on time), then the second channel transmits and the others are listening and so on [42]. Transducers were sending their own signals one after another with a delay of 8 ÷ 200 ms. The complete measurement in one row included 28 A-scans (Figure 4). A-scans are used to create in real time a B-scan, i.e., the cross-section of the tested element located perpendicular to the scanning surface. To display the results from tests, the software assigns amplitudes of the received signals to colours and creates maps. The lowest amplitudes are displayed in navy blue, and the highest ones in red.
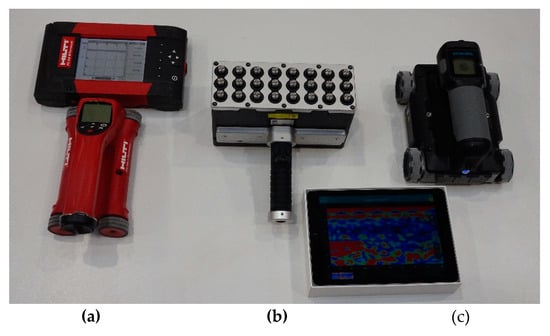
Figure 3.
Applied measuring equipment, (a) electromagnetic scanner - PS 200, (b) ultrasonic tomography - Pundit 250 Array, (c) radar scanner - GPR Live.
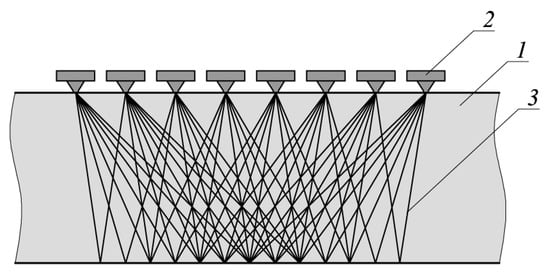
Figure 4.
Principles of measurements made with ultrasonic tomograph, 1—tested element, 2—ultrasonic transducer, 3—ultrasound beam.
Radar measurements employ the GPR system (GPR Live—manufacturer Proceq AG, Schwerzenbach, Switzerland) with antennae generating the measurement signal with a stepwise variable frequency within the range of 0.2 ÷ 4.0 GHz. During the tests, the frequency was changed progressively in an automatic way, and the max. acquisition time was 20 ns. The upper limit of obtained frequencies was particularly important for the test elements. The maximum thickness of elements tested with that device was 70 cm. This device involves the time of flight method (TOFM), which simultaneously records the received signal and the movement of wheels in the measuring transducer. As in the ultrasonic tomograph, the instrument combines A-scans to create B-scans in real time. C-scans, showing the cross-section of the test object parallel to the scanning surface, are additionally taken by the GPR instrument [43]. The test results displayed by the software are similar to the visualization of the results from the ultrasonic tests.
The electromagnetic scanner (PS 200—manufacturer Hilti Corp., Schaan, Lichtenstein) was the last device used during the tests conducted on the masonry units. The scanning head was equipped with a circumferential transmitting coil and seven receiving coils. We analysed current induced in the receiving coils. That equipment could only detect metallic reinforcement built into top joints of the masonry specimens.
A measuring grid, with a mesh size 10 × 10 cm, shown in Figure 5, was plotted onto planes of all test samples. In the case of tests using ultrasound tomography, a line scan was taken that ran through the whole height of the measuring base beginning at the top of the model. The tests with the GPR equipment and the electromagnetic scanner were conducted on the whole selected surface. Additionally, the line scans of the masonry specimens were taken along a height of the measuring base using the GPR equipment. Line scans started from the base bottom (in accordance with requirements of the measuring tool).
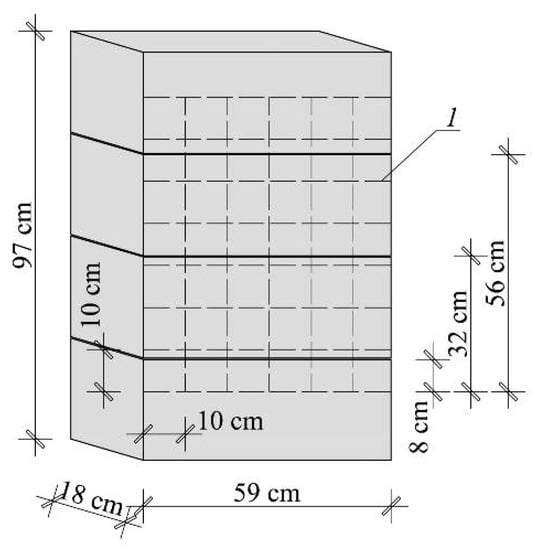
Figure 5.
Measuring bases plotted onto masonry test samples, 1—measuring grid.
4. Test Results
The tests were at first performed on the masonry wall with unreinforced bed joints. The purpose of the tests was to show whether the device recorded the image of bed joints with thin-layer mortar and head joints. The representative results from the tests performed with the GPR equipment are shown in Figure 6. The tests confirmed that the device recorded bed and head joints. However, the results did not clearly indicate the presence of mortar in the joints.
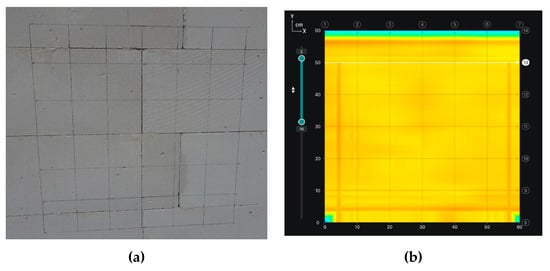
Figure 6.
Tests on unreinforced masonry wall: (a) photo of tested area, (b) results from tests with Ground-Penetrating Radar (GPR) equipment (C-scan)-no visible joints.
The core tests were conducted on the masonry wall with the reinforcement laid in the bed joints. Figure 7a illustrates the results from linear measurement taken with the ultrasonic tomograph, and Figure 7b shows similar results from the linear measurement taken with the GPR equipment. The location of the tested reinforcement is seen in both figures. However, the results obtained from the measurements with the GPR equipment are presented as the mirror reflection to provide a better comparison with the results obtained from the ultrasound measurement (the scan was taken in a reverse direction). The fine reinforcement from the fibreglass mesh (Section 2 shown in scans) was not detected in either cases. However, each device detected the metallic mesh much better despite its very small diameter. The first wire of the metallic mesh was clearly visible in the GPR scan (a hyperbole illustrating location of the mesh wire is shown in Figure 7b). More distant wires were not visible because their diameter was very small. Some anomalies in the metallic mesh were also visible in the ultrasound scan. The basalt mesh (Section 3 shown in scans) was barely visible in both scans. Some scan disorders were observed, but generally, interpretation of the measurements was impossible without knowing the sample content.
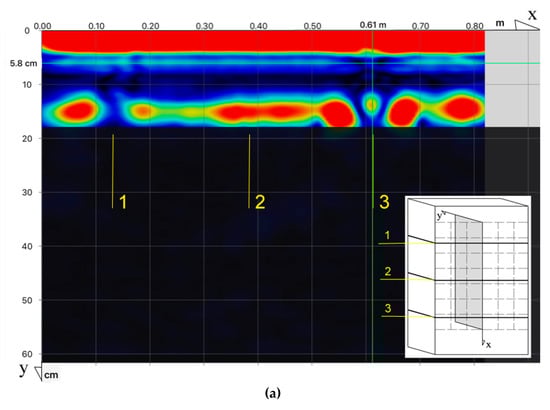
Figure 7.
B-scans (sectional view of the element) of the masonry specimen No. 1 from tests performed with: (a) ultrasonic tomography, (b) GPR scanner, 1—location of steel mesh with a diameter of 1.2 mm, 2—location of fibreglass mesh (size 10 × 12 mm), 3—location of basalt mesh (size 30 × 30 mm).
Figure 8 shows the results from the area scan taken with the GPR equipment. The reinforcement location was detected as in Figure 7. Metal reinforcing mesh and basalt reinforcing mesh were also detected as in the line scan, but the basalt mesh reinforcement was the most visible. Similar tests were performed on the second masonry specimen.
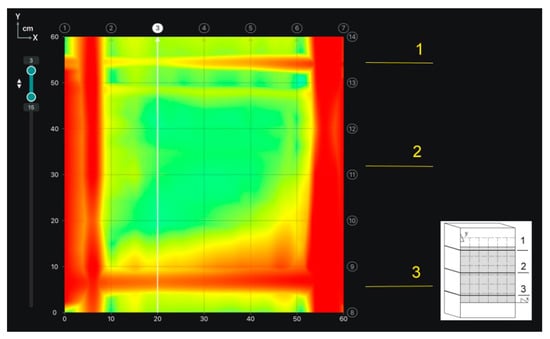
Figure 8.
C-scan of the masonry specimen No. 1 at the depth of 30 ÷ 150 mm obtained from the GPR scanner (the area scan).
Figure 9a presents the result from the linear measurements taken with the ultrasonic tomograph, and Figure 9b shows a similar result from the linear measurements taken with the GPR equipment. As in sample 1, none of the both techniques detected the fine reinforcement of the fibreglass mesh (Section 2 shown in scans). These techniques were more effective in detecting the truss-type reinforcement. The first wire (the upper one in the scan) of the metal truss was clearly seen in case of both tests. The basalt mesh (Section 3 shown in scans) was barely visible in both scans, as in specimen 1. The interpretation of measurements was again impossible without knowing the sample content.
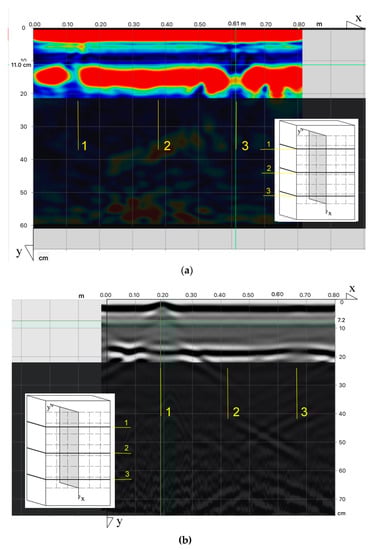
Figure 9.
B-scans (sectional view of the element) of the masonry specimen No. 2 from tests performed with: (a) ultrasonic tomography, (b) GPR scanner, 1—location of truss-type reinforcement, 2—location of fibreglass mesh (size 5 × 5 mm), 3—location of basalt mesh (size 8 × 8 mm).
Figure 10 shows the area scan with the detected reinforcement. The scan was taken with the GPR equipment. As in the case of the line scan, the metal mesh and basalt mesh reinforcement were detected, and the latter one was clearly visible in that scan.
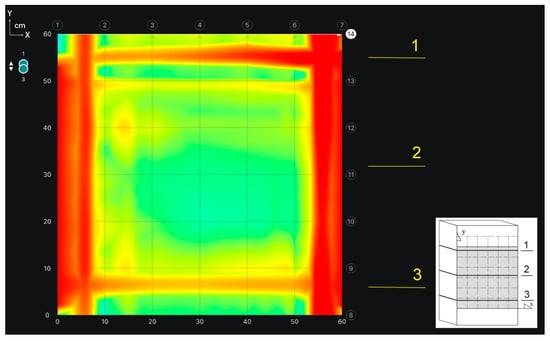
Figure 10.
C-scan of the masonry specimen No. 2 at the depth of 10 ÷ 30 mm obtained from the GPR scanner (a surface scan).
The electromagnetic tests were conducted only for the visualization purpose as this method is not used for detecting non-metallic reinforcement. However, the authors considered whether the mesh with small diameter wires, built into the sample No. 1, could be detected. Moreover, the images of the metallic reinforcement in both specimens were obtained during the tests (Figure 11).
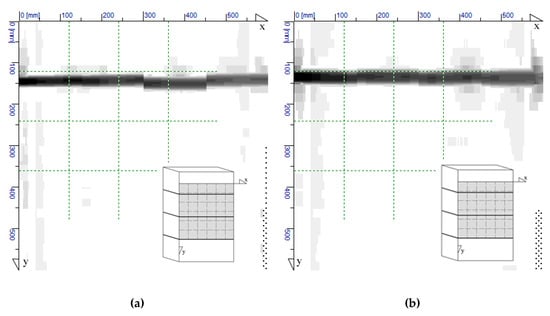
Figure 11.
Results from electromagnetic tests of the masonry specimens, (a) masonry specimen No. 1, (b) masonry specimen No. 2.
5. Conclusions
Diagnostic of masonry walls will be required in the future as the production and application of non-metallic reinforcement have been continuously developed. Moreover, the standardization of products and calculation procedures is needed. As in the case of reinforced concrete structures, diameter and geometry of reinforcement (cover, rebar spacing, overlaps, junctions, bends) will have to be unambiguously determined. However, problems related to the detection of reinforcement with a diameter < 2.0 mm, which is laid in bed joints of the masonry wall, are completely neglected in the area of commercial potentials of equipment and scientific methods of measurements. This type of reinforcement is usually made of non-metallic mesh, steel mesh is not as popular. Reinforcement for bed joints is applied not only in infill walls, but also in load-bearing walls carrying mainly vertical load, and in stiffening walls.
Currently, researchers and practising engineers have access to tools for testing metallic reinforcement or detecting defects in structures. These tools have different usefulness as shown during the performed tests.
In the case of masonry structures, none of the employed methods provided expected results, that is, diameters and geometry of the used reinforcement. The obtained results did not significantly differ from the results obtained for bed joints without reinforcement or with different types of reinforcement. For fibreglass mesh with the smallest diameter, the results were completely unrecognizable and indistinguishable. The detection of basalt mesh with larger fibres was successful using UT and GPR methods. And steel reinforcement – steel mesh and truss, was detected with the electromagnetic equipment; however, its diameters and geometry were not determined. In each case, recognizable imaging was limited to areas closest to the surface, to which transducers or probes were applied. It was difficult to identify the geometry of reinforcement inside the masonry.
Considering the current development of NDT methods, non-metallic reinforcement should be tested using at least two methods that can detect its approximated location. Measurements with ultrasonic equipment should be performed using the array of transducers located on the smallest possible area to ensure that the mutual delay in measurements of individual transducers is as long as possible. In the case of GPR scanners, the equipment with variable frequency of electromagnetic impulse and high values of the limiting frequency should be selected. Regardless of obtained results, the identification of types of mesh fibre or FRP rebars should be confirmed by conducting destructive testing (DT) of specimens taken from the structure.
Further works on detecting reinforcement in bed joints of the masonry wall should focus on improving measuring possibilities of test equipment. In the case of GPR equipment, better results can be obtained when the instrument with high-frequency impulses (> 2.5 GHz) is used. The improvement in ultrasonic equipment should be understood as the development of measuring techniques and processing results obtained from multi-transducer tomographs.
The application of combined NDT techniques, e.g., infrared thermography and post processing by means of neural networks [44], or ultrasonic methods and the methods of acoustoelastic emission [45], seems to be an interesting solution for non-destructive detecting of non-metallic reinforcement.
Author Contributions
Conceptualization, Ł.D. and R.J.; methodology, Ł.D., R.J. and W.M.; formal analysis, Ł.D., R.J. and W.M.; investigation, Ł.D., W.M. and R.J.; writing—original draft preparation, Ł.D.; writing—review and editing, Ł.D. and R.J.; visualization, W.M. and Ł.D.; supervision, R.J. and Ł.D. All authors have read and agreed to the published version of the manuscript.
Funding
The research was financed from funds of the Department of Building Structures and Laboratory of Civil Engineering Faculty.
Acknowledgments
The authors would like to thank the companies VIATECO (Poland), Solbet Sp. z o.o. (Poland), NOVA Sp. z o.o. (Poland) and MAP Products Private Limited (India) for their valuable tips and supply of materials (masonry units, mortar and steel reinforcement and TBM-Reinforcement) used to build the test samples and the equipment (VITECO) to perform the tests.
Conflicts of Interest
The authors declare no conflicts of interest.
References
- Nanni, A.; De Luca, A.; Zadeh, H.J. Reinforced Concrete with FRP Bars: Mechanics and Design; CRC Press: Boca Raton, FL, USA, 2014. [Google Scholar]
- Bank, L.C. Composites for Construction: Structural Design with FRP Materials; John Willey and Sons LTD: Hoboken, NJ, USA, 2006. [Google Scholar]
- Kaszubska, M.; Kotynia, R.; Barros, J. Influence of longitudinal GFRP reinforcement ratio on shear capacity of concrete beams without stirrups. Procedia Eng. 2017, 193, 361–368. [Google Scholar] [CrossRef]
- Lau, D.; Pam, H.J. Experimental study of hybrid FRP reinforced concrete beams. Eng. Struct. 2010, 32, 3857–3865. [Google Scholar] [CrossRef]
- Timperman, P.; Rice, T. Bed joint reinforcement in masonry. In Proceedings of the Fourth International Masonry Conference, London, UK, 23–25 October 1995; British Masonry Society: London, UK, 1995; Volume 2, pp. 451–453. [Google Scholar]
- Murauer, T. Edelstahl im zweischaligen Mauerwerk—Sicherheit im Hintergrund. Mauerwerk 2006, 21, 230–234. [Google Scholar] [CrossRef]
- Drobiec, Ł. Limitation of cracking in AAC masonry under the window zone. Mauerwerk 2017, 21, 332–342. [Google Scholar] [CrossRef]
- Drobiec, Ł. Analyse von Spannungen und Verformungen im Brüstungsbereich von Wandmodellen aus Porenbeton und Kalksandstein. Mauerwerk 2020, 24, 2–16. [Google Scholar] [CrossRef]
- Drobiec, Ł. Analysis of AAC walls subjected to vertical load. Mauerwerk 2019, 23, 387–403. [Google Scholar] [CrossRef]
- Ernst, M. Compressive strength of reinforced perforated clay block masonry. Darmst. Concr. 1995, 10, 145–161. [Google Scholar]
- Vintzileou, E. Improvement of ductility characteristics of plain masonry by means of local horizontal reinforcement. Mason. Int. 1999, 13, 27–31. [Google Scholar]
- Jasiński, R.; Drobiec, Ł. Study of Autoclaved Aerated Concrete Masonry Walls with Horizontal Reinforcement under Compression and Shear. Procedia Eng. 2016, 161, 918–924. [Google Scholar] [CrossRef]
- Jasiński, R. Research on the Influence of Bed Joint Reinforcement on Strength and Deformability of Masonry Shear Walls. Materials 2019, 12, 2543. [Google Scholar] [CrossRef]
- Mazur, W.; Drobiec, Ł.; Jasiński, R. Research and numerical investigation of masonry—AAC precast lintels interaction. Procedia Eng. 2017, 193, 385–392. [Google Scholar] [CrossRef]
- Mosele, F.; Da Porto, F. Innovative Clay Unit Reinforced Masonry System: Testing, Design and Applications in Europe. Procedia Eng. 2011, 14, 2109–2116. [Google Scholar] [CrossRef]
- Da Porto, F.; Mosele, F.; Modena, C. In-plane cyclic behaviour of a new reinforced masonry system: Experimental results. Eng. Struct. 2011, 33, 2584–2596. [Google Scholar] [CrossRef]
- De Luca, F.; Verderame, G.M.; Gómez-Martínez, F.; Pérez-García, A. The structural role played by masonry infills on RC building performances after the 2011 Lorca, Spain, earthquake. Bull. Earthq. Eng. 2014, 12, 1999–2026. [Google Scholar] [CrossRef]
- Hermanns, L.; Fraile, A.; Alarcón, E.; Álvarez, R. Performance of buildings with masonry infill walls during 2011 Lorca earthquake. Bull. Earthq. Eng. 2014, 12, 1977–1997. [Google Scholar] [CrossRef]
- Furtado, A.; Rodrigues, H.; Arêde, A.; Varum, H.; Grubišić, M.; Šipoš, T.K. Prediction of the earthquake response of a three-storey infilled RC structure. Eng. Struct. 2018, 171, 214–235. [Google Scholar] [CrossRef]
- Masi, A.; Chiauzzi, L.; Santarsiero, G.; Manfredi, V.; Biondi, S.; Spacone, E.; Del Gaudio, C.; Ricci, P.; Manfredi, G.; Verderame, G.M. Seismic response of RC buildings during the Mw 6.0 August 24, 2016 Central Italy earthquake: The Amatrice case study. Bull. Earthq. Eng. 2019, 17, 5631–5654. [Google Scholar] [CrossRef]
- Furtado, A.; Rodrigues, H.; Arêde, A.; Varum, H. Influence of the in Plane and Out-of-Plane Masonry Infill Walls’ Interaction in the Structural Response of RC Buildings. Procedia Eng. 2015, 114, 722–729. [Google Scholar] [CrossRef]
- De Risi, M.; Gaudio, C.; Verderame, G. Evaluation of Repair Costs for Masonry Infills in RC Buildings from Observed Damage Data: The Case-Study of the 2009 L’Aquila Earthquake. Buildings 2019, 9, 122. [Google Scholar] [CrossRef]
- Forde, M.C. International practice using NDE for the inspection of concrete and masonry arch bridges. Bridge Struct. 2010, 6, 25–34. [Google Scholar] [CrossRef]
- Cotic, P.; Jaglicic, Z.; Niederleithinger, E.; Effner, U.; Kruschwitz, S.; Trela, C.; Bosiljkov, V. Effect of moisture on the reliability of void detection in brickwork masonry using radar, ultrasonic and complex resistivity tomography. Mater. Struct. 2013, 46, 1723–1735. [Google Scholar] [CrossRef]
- Hoła, J.; Schabowicz, K. State-of-the-art non-destructive methods for diagnostic testing of building structures–anticipated development trends. Arch. Civ. Mech. Eng. 2010, 10, 5–18. [Google Scholar] [CrossRef]
- Gholizadeh, S. A review of non-destructive testing methods of composite materials. Procedia Struct. Integr. 2016, 1, 050–057. [Google Scholar] [CrossRef]
- Drobiec, Ł.; Jasiński, R.; Mazur, W. Accuracy of Eddy-Current and Radar Methods Used in Reinforcement Detection. Materials 2019, 12, 1168. [Google Scholar] [CrossRef] [PubMed]
- De Nicolo, B.; Piaga, C.; Popescu, V.; Concu, G. Non Invasive Acoustic Measurements for Faults Detecting in Building Materials and Structures. Appl. Meas. Syst. 2012, 259–292. [Google Scholar] [CrossRef]
- Zielińska, M.; Rucka, M. Non-Destructive Assessment of Masonry Pillars using Ultrasonic Tomography. Materials 2018, 11, 2543. [Google Scholar] [CrossRef]
- Samokrutov, A.A.; Kozlov, V.N.; Shevaldykin, V.G. Ultrasonic testing of concrete objects using dry acoustic contact. Methods, instruments and possibilities. In Proceedings of the 5th International Conference Non-Destructive Testing and Technical Diagnostics in Industry, Moscow, Russia, 16–19 May 2006; p. 152. [Google Scholar]
- Castellano, A.; Foti, P.; Fraddosio, A.; Marzano, S.; Piccioni, M.A. Ultrasonic immersion tests for mechanical characterization of multilayered anisotropic materials. In Proceedings of the IEEE Workshop on Environmental, Energy, and Structural Monitoring Systems, Naples, Italy, 17–18 September 2014; pp. 1–6. [Google Scholar] [CrossRef]
- Cammasa, D.; Castellano, A.; Fraddosio, A.; Piccioni, M.A. Improvements of the Ultrasonic Tomography for Applications to Historical Masonry Constructions. In Structural Analysis of Historical Constructions: An Interdisciplinary Approach; RILEM Bookseries; Springer: Cham, Switzerland, 2019; pp. 447–455. [Google Scholar] [CrossRef]
- Stawiski, B.; Kania, T. Tests of Concrete Strength across the Thickness of Industrial Floor Using the Ultrasonic Method with Exponential Spot Heads. Materials 2020, 13, 2118. [Google Scholar] [CrossRef]
- Khan, F.; Rajaram, S.; Vanniamparambil, P.A.; Bolhassani, M.; Hamid, A.; Kontsos, A.; Bartoli, I. Multi-sensing NDT for damage assessment of concrete masonry walls. Struct. Control. Health Monit. 2015, 22, 449–462. [Google Scholar] [CrossRef]
- Zhang, H.; Yang, R.; He, Y.; Foudazi, A.; Cheng, L.; Tian, G. A Review of Microwave Thermography. Nondestructive Testing and Evaluation. Sensors 2017, 17, 1123. [Google Scholar] [CrossRef]
- Swiderski, W. Non-Destructive Testing of Carbon Fiber Reinforced Plastic by Infrared Thermography Methods. Int. Sch. Sci. Res. Innov. 2016, 10, 1470–1473. [Google Scholar]
- Bungey, J.H. Sub-surface radar testing of concrete: A review. Constr. Build. Mater. 2004, 18, 1–8. [Google Scholar] [CrossRef]
- Agred, K.; Klysz, G.; Balayssac, J.P. Location of reinforcement and moisture assessment in reinforced concrete with a double receiver GPR antenna. Constr. Build. Mater. 2018, 188, 1119–1127. [Google Scholar] [CrossRef]
- EN 1996-1-1 Eurocode 6—Design of Masonry Structures—Part 1-1: General Rules for reinforced and unreinforced masonry structures; European Committee for Standardization (CEN): Brussels, Belgium, 2005.
- EN 10080:2005 Steel for the Reinforcement of Concrete. Weldable Reinforcing Steel. General; European Committee for Standardization (CEN): Brussels, Belgium, 2005.
- ASTM D6637/D6637M-15, Standard Test Method for Determining Tensile Properties of Geogrids by the Single or Multi-Rib Tensile Method; ASTM International: West Conshohocken, PA, USA, 2015.
- Misak, L.; Corbett, D.; Grantham, M. Comparison of 2D and 3D ultrasonic pulse echo imaging techniques for structural assessment. MATEC Web. Conf. 2019, 289, 06003. [Google Scholar] [CrossRef][Green Version]
- Castellano, A.; Fotti, P.; Fraddosio, A.; Marzano, S.; Piccioni, M.A. The ultrasonic C-Scan technique for damage evaluation of GFRP composite materials. Int. J. Mech. 2016, 10, 206–212. [Google Scholar]
- Galietti, U.; Luprano, V.; Nenna, S.; Spagnolo, L.; Tundo, A. Non-destructive defect characterization of concrete structures reinforced by means of FRP. Infrared Phys. Technol. 2007, 49, 218–223. [Google Scholar] [CrossRef]
- Castellano, A.; Fraddosio, A.; Marzano, S.; Piccioni, M.A. Some advancements in the ultrasonic evaluation of initial stress states by the analysis of the acoustoelastic effect. Procedia Eng. 2017, 199, 1519–1526. [Google Scholar] [CrossRef]


© 2020 by the authors. Licensee MDPI, Basel, Switzerland. This article is an open access article distributed under the terms and conditions of the Creative Commons Attribution (CC BY) license (http://creativecommons.org/licenses/by/4.0/).