1. Introduction
Studies conducted worldwide [
1,
2,
3,
4] have shown that one of the most important and common causes of structure degradation is the accumulation of exogenous/external, polluting, organic or inorganic materials on surfaces. The accumulation of exogenous/external materials initially leads to loss of aesthetic appearance, but in time causes the degradation of the building material, which implicitly determines maintenance works and repairing costs, as well as indirect costs (for example, the reduction, the hindrance or stopping the activity in the building during the repair works, etc.). One solution to improve this situation is the use of nanotechnology by creating materials with a self-cleaning capacity in the construction field.
The photocatalytic oxidation-reduction reaction under the influence of ultraviolet (UV) radiation of titanium dioxide (TiO
2) was reported as the Honda–Fujishma effect in 1972 [
5]. It is known that cementitious composites containing TiO
2 nanoparticles, under UV rays, have a specific behavior: on one hand, they catalyze the decomposition of organic molecules, which are generally large, into compounds with a simpler and smaller molecule, and on the other hand they increase the hydrophilicity of their surface. The two mechanisms, namely the photocatalytic oxidation of the chemical pollutants and increasing the surface hydrophilicity under UV action, determine the self-cleaning effect of cementitious composites containing TiO
2 nanoparticles. When this stage is achieved, exogenous/external substances or particles can be more easily removed by rainwater [
1,
5,
6,
7,
8,
9,
10,
11,
12], as schematically shown in
Figure 1. Moreover, the literature shows that catalytic photoactivation capacity contributes to the reduction of NO
x pollutants in the air and surface decontamination of viruses, bacteria and sponges [
13,
14,
15,
16,
17].
On the other hand, the literature [
5] indicates that TiO
2 nanoparticles alone lose their hydrophilicity property as soon as the UV action ceases, but in combination with the amount of SiO
2 contained by cement, the UV-activated effect extends even in days of complete darkness (no UV radiation).
The literature [
18,
19,
20,
21,
22] indicates an influence of the addition of TiO
2 nanoparticles on the structure of the cementitious composite, at the microstructural level, by modifying the distribution and size of the pores. Reduction of the general porosity by a decrease of the total volume of the pores simultaneously with the reduction of their dimensions will cause a local densification and, consequently, a modification of both the physico-mechanical characteristics, especially the mechanical strength, as well as the water absorption capacity and the permeability to liquids or gaseous substances. Chunping et al. [
19] reports an improvement in the mechanical strength of high-performance concrete and a reduction in capillary porosity of concrete, in general, by the addition of 1% TiO
2 nanoparticles. Bautista-Gutierrez et al. [
18] confirms the possibility of reducing the total porosity by changes occurring at the microstructural level as a result of the addition of TiO
2 nanoparticles. Singh et al. [
23] confirms this hypothesis as a consequence of an inhomogeneous dispersion of nanoparticles in the cementitious matrix, recommending an incorporation method with ultrasonic dispersion. On the other hand, in terms of the capacity for the generation of the hydroxyl radical, respectively, of a modification of the chemical bonds, Jimenez-Relinque and Castellote [
24] confirm, in accordance with other reports in the literature [
25,
26,
27], that the specific surface, i.e., the total porosity, has no influence on the performance of photo-catalytic characteristics of the materials with the addition of TiO
2 nanoparticles. Hamidi and Aslani [
28], consistent with Zhang et al. [
29] and other researchers [
30,
31,
32,
33,
34], showed that by adding 1, 3 and 5 wt.% nano-TiO
2, pore diameters and their total volume are reduced compared to the control sample (without nano-TiO
2) even by half, but these decreases are not directly proportional with the amount of nanoparticles. Salman et al. [
35] observed that nano-TiO
2 are able to fill the pores, reducing the size of calcium hydrate crystals and densifying the microstructure of cement-based composites [
32].
2. Materials and Methods
2.1. Theoretical Aspects
The mechanism that underlies the increase in hydrophilicity of cementitious composites surfaces containing TiO
2 nanoparticles under exposure to UV rays can be explained on the basis of the increase in hydroxyl groups (OH
−). This phenomenon, identified through X-ray photoemission spectroscopy (XPS), Fourier transformation infrared spectroscopy (FTIR) or nuclear magnetic resonance (NMR), is schematically shown in
Figure 2 [
5,
36,
37,
38]. The transition of the surface, under the influence of UV radiation, to a metastatic thermodynamic state is the result of the coexistence of forms of molecular water and dissociated water.
In general, under the action of UV rays, titanium dioxide is a semiconductor with a band gap of about 3.0 eV in the presence of UV light with a wavelength between 100 and 400 nm. By energy absorption, TiO
2 generates electrons (e
−) and holes (h
+) (Equation (1)). Electrons tend to reduce the Ti(IV) cation to the Ti(III) ion (Equation (2)) and the voids oxidize the O
2− anions (Equation (3)). This process will release oxygen by creating gaps on the surface of titanium dioxide; that latter gives the possibility of binding water molecules to the release of hydroxyl radicals (OH
−).
Since the oxidation capacity of the (h
+) voids is higher than the reduction capacity of (e
−) electrons, and on the surface of the photocatalyst there is a single layer of adsorbed H
2O molecules, hydroxyl radicals (OH
−) are formed. Being highly oxidizing, these hydroxyl groups react with organic molecules producing peroxyl free radicals, which will react with molecular oxygen in a chain of reactions up to the CO
2 and H
2O end products. On the other hand, (e
−) electrons reduce oxygen to the free O
2− radical, which will react with the resulting peroxy molecules during the reaction between hydroxyl groups and organic molecules, ultimately leading to a chain of reactions up to the final CO
2 and H
2O products [
5,
39]. As a general reaction, this process can be explained according to Equation (4).
In the case of cementitious composite surfaces with TiO
2 content, the literature also indicates [
5,
40] that photogenerated holes (h+) increase the length of ties within the TiO
2 network (
Figure 2, left), bringing the surface to a metastable state that allows adsorption of molecular water simultaneously with the formation of new hydroxyl groups and the release of a proton. The research considers that these hydroxyl groups are less thermodynamically stable, therefore the surface will allow the water droplet to be flattened to cover a larger area in order to stabilize [
5,
40,
41,
42]. Consequently, at the level of the cementitious surface, oxido-reduction reactions occur. This mechanism is shown in
Figure 2, top right.
Regarding the hydrophilicity, the literature [
5] also specifies the influence that surface roughness and homogeneity have on the contact angle between the water drop and the surface and indicates the ways by which Young’s Equation (5) is modified by the introduction of the roughness correction factor by Wentzel (Equation (6)) and Cassie’s correction for the situation of a heterogeneous two-phase surface (Phase 1 and Phase 2) (Equation (7)) for ensuring homogeneity.
where: γ
SV, γ
SL, γ
LV are the free energies at the interface per unit area, at solid-gas, solid-liquid and liquid-gas contact, respectively; θ is the contact angle; ʋ represents the roughness as ratio between the real surface and the apparent surface; f
1 and f
2 are the Phase 1 and Phase 2 fractions in the heterogeneous surface; and θ
1 and θ
2 are the contact angles that would be recorded for homogeneous surfaces in Phase 1 and Phase 2, respectively.
A hydrophilic surface that is more water-friendly has the following characteristics:
Water droplets spread over the surface and so, instead of being water-free zones and areas in contact with water, a continuous film of water is formed. In normal conditions under the action of gravity, some drops fall, roll or drip onto the surface, removing dirt particles; other drops, smaller and lighter, do not end up falling, remaining on the surface and eventually evaporating. A continuous film of water is heavier, so it will certainly slide on the surface under the action of gravitational force, taking over all the dirt particles encountered. Therefore, it is advantageous to determine the formation of a continuous film of water on the surface, the case of hydrophilic surfaces, because there is an obvious increase in the ability to clean them.
In contact with a hydrophilic surface, the water drop flattens (decreases the contact angle), thus the water–surface interface area is larger. By default, the potential for water absorption in the pores of the surface is higher; therefore, the absorption of water to the surface is an indirect indicator of the hydrophilicity degree.
On the other hand, and depending on the roughness of the surface, the formation of the water film differs greatly. On one surface there may be simultaneously several phenomena occurring: filling the open pores with water, increasing the thickness of the water film, and water film sliding under the influence of the resultant gravitational forces and friction. Although initially a matching among different other materials (brick, ceramic, natural stone, marble) was intended [
42,
43], the literature shows that these situations are not comparable [
1] because it is virtually impossible to compare the phenomena occurring on the surfaces of different materials.
Consequently, cementitious composite material surfaces with TiO
2 nanoparticles were proven to have the ability to reduce the angle of contact from the usual 20–30° to almost 0°, which is considered as representative of an ideal, superhydrophilic surface [
38].
According to the literature [
38,
44], an angle of contact that tends to 0° indicates a superhydrophilic surface.
Whether it is the assessment of the hydrophilicity or hydrophobicity (as an opposite phenomenon) of the surfaces, the point-shift of the literature indicates that, in principle, the two methods of measurement are: the direct method of measuring the contact angle of the droplet of liquid to the surface [
1,
43,
45], and the indirect method for the determination of water absorption on the surface [
1,
37,
43]. The specific cause of the high wettability (photochemical induced) will lead to a high potential of water adsorption on the surface. Some references [
46] also indicate a method that describes the dynamic wettability of surfaces by analyzing and graphically representing the variation of the contact angle of the comparatively analyzed control sample. Regarding the assessment of the hydrophilicity of the surface of cementitious composite materials with TiO
2 nanoparticles addition, conclusive results have been reported in the literature. Thus, Husken et al. [
47] recommended the introduction of the TiO
2 nanoparticles into the cementitious matrix by mixing them in the preparation water. Irie and Hashimoto [
5] show that the contact angle of water with the surface is influenced by the ambient temperature, increasing function of the rising temperature; this influence was also confirmed by Chenxi et al. [
48]. On the other hand, the contact angle is higher under vacuum conditions (10-6 Torr) when compared to atmospheric pressure conditions; by the activation of the surface by UV rays exposure, the contact angle of water with the surface increases with increasing UV exposure time, respectively, and decreases with a lack of UV ray action until a similar effect is achieved. Until recently it has been considered that these specific types of cementitious composites are intended exclusively for outdoor use due to the need for solar radiation proving the UV content to activate TiO
2 nanoparticles. Currently, research has shown that even in indoor conditions, a minimum radiation of 1 µW/cm
2 provided by a fluorescent tube is sufficient to achieve the photocatalytic effect [
5].
Given the fact that the change in hydrophilicity represents a part of the mechanism generating the surface self-cleaning of the cementitious materials with TiO
2, the specific literature [
1,
5,
38,
42,
49,
50,
51,
52] did not identify outcomes relating the phenomenon to the change of the angle of contact with water. The results on the ability of self-cleaning are presented on the basis of the tests carried out, mainly by the method of staining with Rhodamine B, methylene blue, metanil yellow, etc. The aim of this research was to analyze the influence of the TiO
2 nanoparticles addition on the hydrophilicity of the cementitious composite matrix surface and to draw specific guiding lines for an optimal mix-design performant material with high self-cleaning capacity.
2.2. Experimental Research
The principle of the method consisted in determining the surface water absorption of the specimens as an indirect indicator of the evaluated surface hydrophilicity.
Cementitious composite material prismatic specimens, with a 0.085 m2 exposed area were prepared in order to evaluate this indicator. The preparation of the cementitious composites was performed by using white Portland cement as the binder and the nanoparticles were introduced as an addition in different mass percentages, relative to cement quantity: 1% (P2), 2% (P3), 3% (P4), 3.6% (P5), 4% (P6), 5% (P7), 6% (P8) and 10% (P9). The control sample, P1, was prepared without the TiO2 nanoparticles addition. For all mixtures, the mass ratio of water / dry powdery material of 0.5 was maintained constant, where the dry powdery material represented the mass sum of the quantities of cement and TiO2 nanoparticles. After casting, the test specimens were stored for 24 h in molds in a wet box (RH 90%, 20 ± 1 °C). After demolding, the samples were immersed in water at 20 ± 1 °C until the age of testing of 28 days.
The test surface of the specimens (at 28 days age), conditioned by exposure to 105° until dried constant mass was reached, was exposed to testing with a tilt of 10° with respect to the vertical. From a distance of 30 cm, 5 mL of distilled water was sprayed every 2 min until a cumulative volume of 50 mL of water was used for each surface specimen. After each step (spray of 5 mL distilled water), the test specimens were weighed and water absorption was determined on the surface. All tests were carried out under laboratory conditions (20 ± 2 °C, RH 50%).
After testing, the specimens were dried until constant mass and exposed for 1 h to the action of UVA (Ultraviolet A: 400 – 315 nm) wave-length UV rays with light intensity of 405 lux, then the test was repeated. Subsequently, the specimens were dried until constant mass again, exposed another for 24 h to UV and the water absorption on the surface was measured.
Prior to the surface water absorption test, porosity was evaluated by calculation for all cementitious composites. This method was used by assimilation with standardized methods for characterizing the porosity of concrete, which allow the determination of this parameter based on the apparent and absolute density of the material.
Surface water absorption (Q) was calculated as an indirect indicator of the degree of hydrophilicity of the surface of the cementitious composite material (Equation (8)):
where, m
t is the sample mass at time t (2, 4, 6, 8, 10, 12, 14, 16, 18, 20 min) from the start of spraying, and corresponds to the specific volumes of sprayed distilled water (5, 10, 15, 20, 25, 30, 35, 40, 45, 50 mL); m
0 is the initial mass of the dry specimen at constant mass; and A is the exposed surface of the specimen.
For the evaluation of the kinetic phenomenon, the rate of the surface water absorption was determined in terms of the water amount coming in contact with the surface at a given time. This was expressed as the slope of the graphical representation, namely, the tangent of the angle formed with the x-axis.
The rate of evolution of the water absorption process, v, is defined as the ratio between the amount of water absorbed on the surface of the sample and the amount of sprayed water that reached contact with it (Equation (9)). The amount of water sprayed on the surface was calculated knowing that, throughout the procedure, a constant amount of 5 mL of water was sprayed at a constant interval of 2 min until the total volume of 50 mL of water was cumulated. Given that the exposed specimens were initially dried until constant mass was reached, the amount of water initially absorbed was considered to be 0 kg/m
2.
where Q
tx is the surface water absorption (kg/m
2) at step p (1, 2, 3, 4, 5, 6, 7, 8, 9, 10) which corresponds to the time t (2, 4, 6, 8, 10, 12, 14, 16, 18, 20 min) recorded from the start of the test, and corresponding to a certain volume of sprayed water on the surface (5, 10, 15, 20, 25, 30, 35, 40, 45, 50 mL).
The parameter thus determined, namely the evolution rate of the water absorption process, v, characterizes the process of water absorption on the surface, and indirectly the surface hydrophilicity evaluation from a kinetic point of view.
For each case of activation, with or without UV exposure, indicators for the efficiency of the addition of TiO2 in the cementitious matrix on the surface water absorption have been properly defined:
where, Q
txUV is the water absorption to the surface of the specimen at time t (4, 6, 8, 10, 12, 14, 16, 18, 20 min) from the start of the test; Q
t-2xUV is the surface water absorption of the specimen measured at the previous stage (t = 2 min); and x is the number of hours of UV exposure (0 h, 1 h or 1 + 24 h).
A faster increase in the Evolution Index is an indicator of the effectiveness of the addition of nanoparticles on surface hydrophilicity.
The Efficiency Index of Nanoparticles (EIN) represents the percentage variation (increase) of surface total water absorption (time 20 min, volume of water 50 mL), of the specimen of the cementitious composite with TiO2 nanoparticles addition, in relation to surface total water absorption, (time 20 min, volume of water 50 mL) of the control cementitious composite samples (without TiO2 nanoparticles) (Equation (11)):
where, Q
20xUV is the surface water absorption of the cementitious composite specimen with TiO
2 nanoparticles addition at t = 20 min after the start of the test (50 mL water); Q
20control sample xUV is the surface water absorption of the control specimen (without TiO
2 nanoparticles addition) at t = 20 min after the start of test (50 mL water); and x is the number of UV exposure hours (0 h, 1 h or 1 + 24 h).
The higher the Efficiency Index of Nanoparticles, the higher the surface hydrophilicity is; furthermore, the cementitious mixture with the corresponding TiO2 nanoparticles addition is considered to be more efficient in assessing the self-cleaning performance.
3. Results and Discussions
The experimental results, presented as mean values from five repeated tests for each proposed mixture, provided relevant information regarding the evolution of water absorption at the surface of the tested cementitious composite materials in relation to the content of nanoparticles introduced in their composition as an indirect indicator of hydrophilicity and on the kinetics of the process.
As an influencing factor of the absorption mechanisms, the porosity of the developed cementitious composites with TiO
2 addition is currently not considered relevant; specific tests revealed scarce variation among the evaluated compositions, namely a 2.6 mean square deviation, which allows the assumption of a rather constant value of porosity with inconsistent effect upon the recorded absorption results as shown in
Table 1. There is an almost constant porosity in the case of the samples containing 1%, 2%, 3% and 5% nano-TiO
2. However, for samples with 3.6% and 4% nano-TiO
2, a minimum level of material porosity was observed. In accordance with the literature [
18,
20,
21,
22], although slightly influenced by the addition of nano-TiO
2, this parameter does not directly proprotionally vary with the amount of nanoparticles introduced in the cementitious matrix, with a porosity reduction compared with the control sample being between 0.7%-5.2%, except for the two extreme samples.
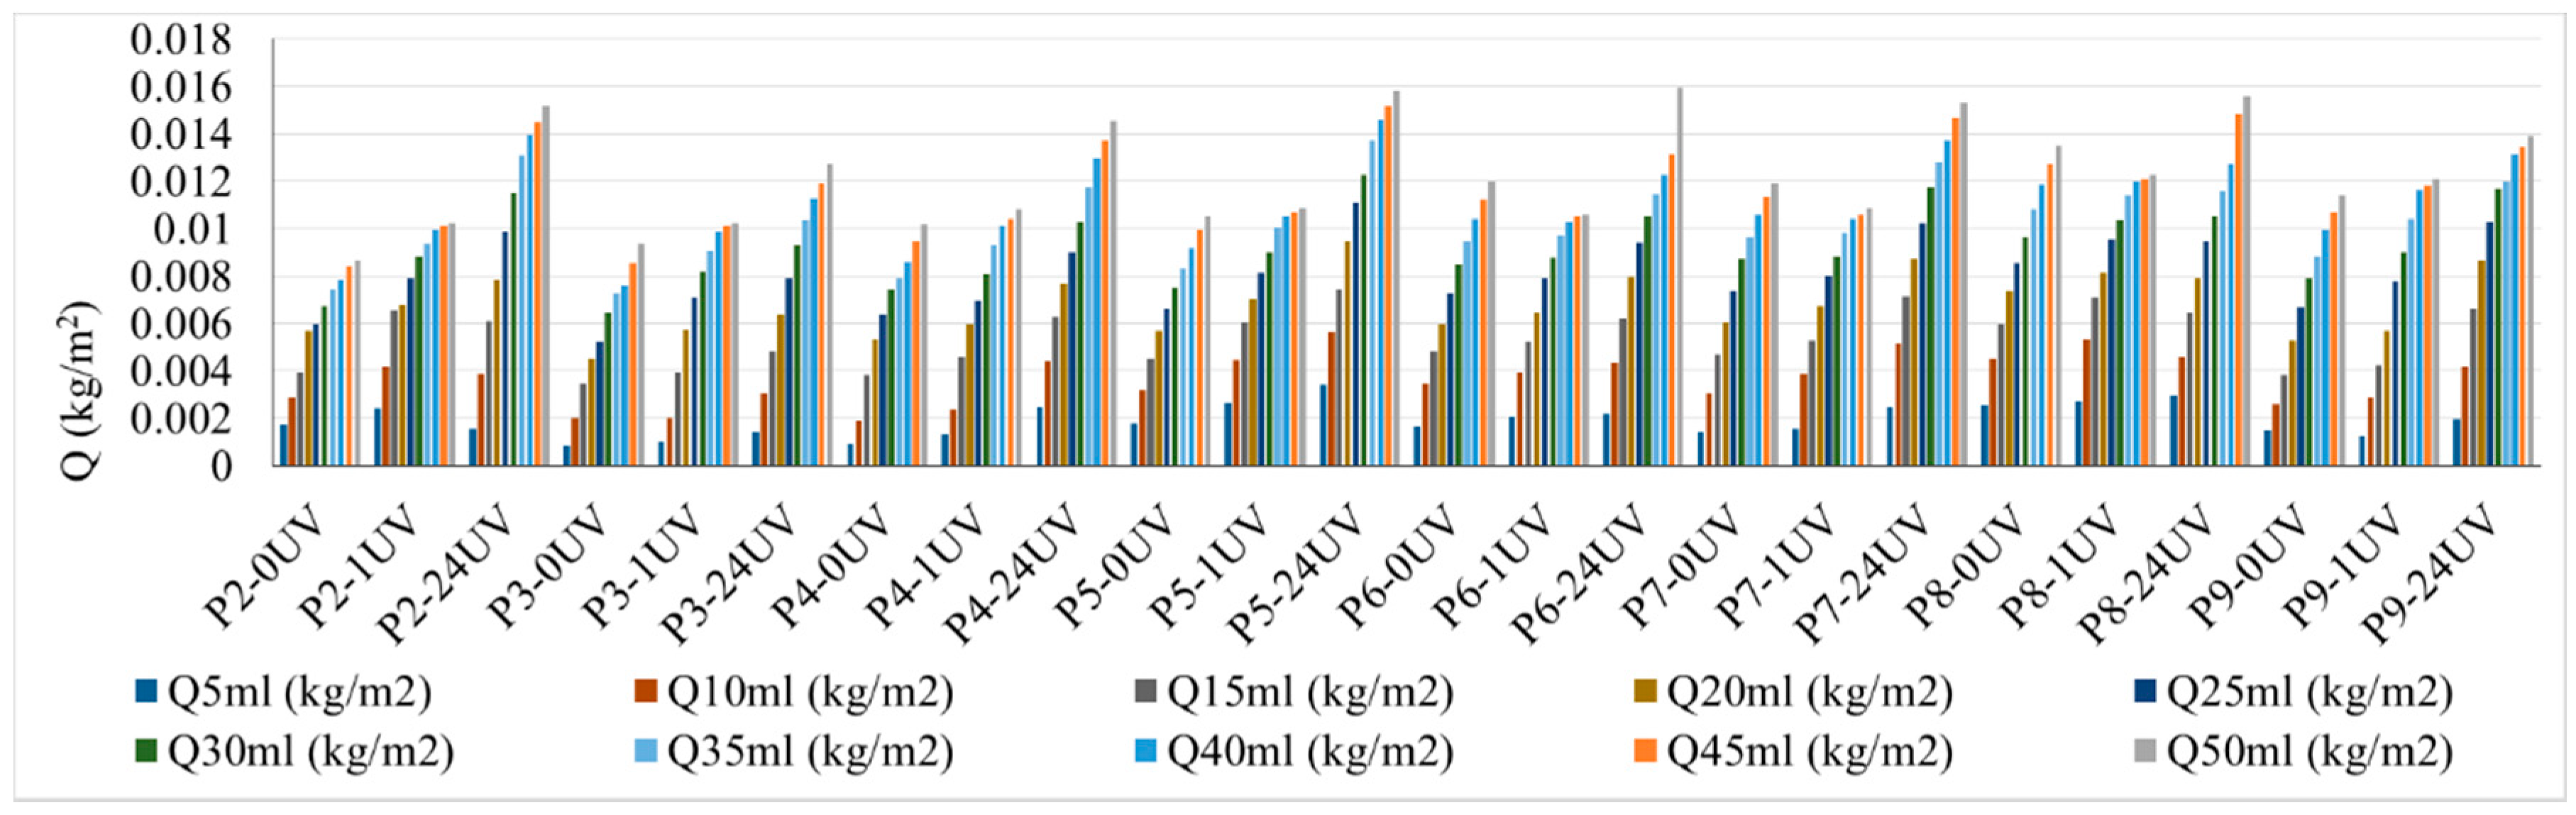
Thus, the surface water absorption of the samples is presented in
Figure 3, depending on the type of mixture tested, the volume of sprayed water and the type of exposure (with or without UV exposure). As shown in
Figure 3, the surface water absorption increases continuously and constantly with the increase in the amount of sprayed water for all the analyzed cases. This behavior of the phenomenon shows that an evaluation of the kinetic process by the rate of evolution of the water absorption process (indicator v) is suitable and can be used to determine this parameter.
It is noted that the maximum water absorption was achieved by mixture P8, containing 6% TiO2, for all situations of the amount of sprayed water, therefore it is appreciated that this composite matrix shows the highest hydrophilicity, both in non-exposure to UV conditions and also to 1 h exposure to the action of UV rays. Regarding the samples exposed to 1 + 24 h for UV action, the maximum water absorption was initially recorded for the mixture P5 (3.6% TiO2), closely followed by mixture P8 (6% TiO2); when the amount of sprayed water was increased as the test continued, an increase of water absorption was observed for all specimens ranging from P2-P8 (1% to 6% TiO2) intervals. Increasing the amount of TiO2 in the mixtures over 6% (mixtures with 10% TiO2) determines the reduction of water absorption at the surface, which indicates the reduction of hydrophilicity. P2 (1% TiO2) and P3 (2% TiO2) specimens, unexposed to UV action and with 1 h UV exposure, indicate quite small changes in hydrophilicity when compared to the control samples; this proves that an addition of 1%-2% TiO2 in the cementitious matrix is insufficient. The slight flattening of the curve with the increase of the amount of sprayed water can be considered the tendency of phenomenon stabilization when reaching a peak of water absorbed on the surface, after which the excess water has a chance to slip on the existing film.
It is noted that although porosity is minimal for P5 (3.6% TiO2) and P6 (4% TiO2), they do not correlate with extreme values in terms of the amount of water absorbed on the surface; the corresponding water absorption curves are not positioned at the extremes of the graph. Moreover, the surface water absorption varies independent of the porosity variation when comparing close porosity values of the samples (P2, P3, P4, P7 and P9). Therefore, it can be assessed that for the analyzed cases under conditions of variation of porosity in the range of an average square deviation of 2.6, its influence on surface water absorption can be neglected.
Figure 4 shows the rate of evolution of the surface water absorption process depending on the type of samples tested, the volume of sprayed water and the type of exposure.
As seen in
Figure 4, the rate of water absorption on the surface decreases continuously and constantly for all the analyzed samples when the amount of sprayed water is increased. This trend could probably indicate that the surface initially accumulates amounts of water and subsequently, once a film of water is formed, the excess slides more easily under the influence of gravitational efforts. This conclusion can also be supported by the slight flattening of the surface water absorption curves shown in
Figure 3.
The P8 with the 6% TiO2 sample unexposed to UV rays shows the most intense kinetics of the surface water absorption process, therefore this process is the most favorable in terms of obtaining the optimized self-cleaning effect (as shown in the previous chapter, the property of self-cleaning is the result of a cumulation of properties between which the hydrophilicity of the surface has a particularly important role). P9 with the 10% TiO2 sample shows a lower rate of the surface water absorption process which indicates that the kinetics of the phenomenon are not directly influenced by the quantity of TiO2 addition in the cementitious matrix. This statement is also supported by the surface water absorption rate recorded by the P2 (1% TiO2) sample, which initially is high but then decreases quickly as the process progresses. P3 (2% TiO2) and P4 (3% TiO2) samples show similar behavior as the phenomenon progresses. The variations between the momentary rates for each of these two cases are rather low, which would suggest a saturation phenomenon after spraying 20-25 ml of water.
P8 (6% TiO2) test specimens show the most intense kinetics of the process, with good results after exposure of 1 h UV action. The same intense kinetics are also seen for P5 (3.6% TiO2) samples. Sample P9 (10% TiO2) shows, again, a lower rate of the surface water absorption process, which supports the assertion that the kinetics of the phenomenon are not directly and proportionally influenced by the content of TiO2 in the cementitious matrix; consequently, it can be concluded that an optimal range of TiO2 nanoparticles addition or a certain dosage needs to be established. Although not showing an equally spectacular evolution regarding the rate of the phenomenon, P6 (4% TiO2) and P7 (5% TiO2) samples eventually reach the similar rate of P4 (3% TiO2) and P5 (3.6% TiO2) samples at the end of the test (50 mL water). This evolution cannot be interpreted independently, but only in the context of maintaining a balance as favorable as possible in terms of benefits accumulation.
After exposure to 1+24 h UV action, P5 (3.6% TiO2) and P8 (6% TiO2) samples exhibit the most intense kinetics of the surface water absorption process. Kinetic favorable developments have also been seen for samples P4 (3% TiO2), P6 (4% TiO2) and P7 (5% TiO2). Different behavior was observed on samples P2 (1% TiO2) and P3 (2% TiO2) when small amounts water were sprayed (5 mL, 10 mL). The process rate increased, reaching a maximum after spraying a total amount of 15 mL of water. Later, the rate of the process decreases as the amount of sprayed water increases. This behavior was also noticed for P9 (10% TiO2). This kinetic behavior can be assimilated with a possible lower surface quality (in terms of self-cleaning capacity), respectively, as there is a tendency to form a water film, but the surface does not have the ability to maintain the continuity of this film.
In all cases, as expected, the control sample (P1) shows a much reduced evolution of the water absorption process on the surface compared to the composite samples containing nanoparticles, a sign that this surface is less hydrophilic with most of the water remaining on the surface as droplets fail to form a film and easily fall.
Generally, it can be stated that at the beginning of the process (when small amounts of water are sprayed), the evolution of surface water absorption is more strongly influenced by the amount of TiO2 as the steps of the test increase. As the amount of sprayed water increases, the surface absorption process stabilizes, while the percentage of water added by each spray generally decreases.
Figure 5 analyzes the efficiency of the presence of TiO
2 nanoparticles on the surface water absorption on the hydrophilicity of the surfaces of the cementitious matrix, expressed in terms of efficiency index of nanoparticles, depending on the type of samples at the total volume of sprayed water (50 mL) and the type of exposure.
As emphasized by
Figure 5 in the case of the test specimens without UV exposure, respectively, out of those tested with 1 h UV exposure, P8 (6% TiO
2) samples show the highest efficiency in terms of the influence of addition of TiO
2 on surface hydrophilicity compared to the control sample. Sample P9 (10% TiO
2) indicates a decrease in the efficiency of addition of nanoparticles on surface hydrophilicity. Regarding the P6 (4% TiO
2) sample, followed closely by the P5 (3.6% TiO
2) sample, the test results after 1 + 24 h UV exposure show the highest efficiency in terms of the influence of TiO
2 addition on surface hydrophilicity when compared to the control sample.
The results presented in
Figure 6 show that, regardless of the TiO
2 nanoparticles content for all samples, the surface water absorption increases when subjected to UV exposure compared to the lack of UV exposure. The increase of exposure time has also the effect of increasing surface water absorption. The satisfactory behavior of the P8 (6% TiO
2) test specimens, as well as the unsatisfactory behavior of the P9 (10% TiO
2) test specimens and the highly dependent role of the UV exposure conditions of the other test specimens, can easily be noticed in the figure above.
4. Conclusions
The aim of this experimental research was to analyze the effect of the TiO2 nanoparticles content in white Portland cement-based cementitious matrix regarding the surface hydrophilicity by the means of surface water absorption as a relevant parameter for the hydrophilicity characteristics of materials under several exposure conditions (water amount reaching the considered surface, exposure to UV rays).
Experimental results show that the hydrophilicity of the cementitious composite surface is not directly influenced by the content of nanoparticles and there is a concentration range in which they develop maximum efficiency. In this case it was proved that an addition of TiO2 nanoparticles (relative to the cement quantity) in the range of 3%-6% is the optimum in terms of kinetics and phenomenon efficiency. Based on the above obtained results, current conclusions are consistent with the existing literature in the field in terms of mechanisms that affect the general self-cleaning capacity of the cementitious composites with nano-TiO2 in terms of surface hydrophilicity. An increased addition of TiO2 nanoparticles (see sample P9 with 10% TiO2 nanoparticles) not only does not improve surface performance in terms of hydrophilicity, but on the contrary, it reduces it.
By analyzing the overall evolution of the surface water absorption results of the cementitious composite samples, it can be said that the P8 (6% TiO2) sample is the most balanced and has the most successful outcome regarding the evolution of the phenomenon, the kinetics of the process of water absorption, and the effectiveness of the presence of the nanoparticles in comparison to the control sample.
After analyzing the literature, it can be said that the current experimental research originally contributes and adds value to the current level of knowledge. This is done by the identification of suitable functions for the modeling of the phenomena and the kinetics of the latter by introducing and demonstrating proper use of relevant indicators for the efficiency of the process. The results of the current experimental study and their analysis facilitate the proper comparison and interpretation of a large volume of experimental data collected considering different, relevant exposure situations.
Last but not least, based on the specific results obtained, on a case-by-case basis it is necessary to analyze the optimal amount of nanoparticles used as an addition in the cementitious matrix that can optimize the quality of the self-cleaning process, depending on the use, climate, degree and duration of sunlight.

 ,
, 

 CO2 + H2O + Residual inorganic compound


