Article

Assessment and Mitigation of Heavy Metals Uptake by Edible Vegetables Grown in a Turin Contaminated Soil Used as Vegetable Garden

1
Department of Chemistry, University of Torino, Via Pietro Giuria 5, 10125 Torino, Italy
2
Department of Life Sciences and Systems Biology, University of Torino, Via Accademia Albertina 13, 10123 Torino, Italy
3
Department of Drug Science and Technology, University of Torino, Via Pietro Giuria 9, 10125 Turin, Italy
*
Author to whom correspondence should be addressed.
Appl. Sci. 2020, 10(13), 4483; https://doi.org/10.3390/app10134483
Submission received: 1 June 2020 / Revised: 24 June 2020 / Accepted: 25 June 2020 / Published: 29 June 2020
(This article belongs to the Special Issue Environmental Restoration of Metal-Contaminated Soils)

Abstract

:
In this study we evaluated the concentration of 22 elements, namely Al, As, Ba, Ca, Cd, Ce, Co, Cr, Cu, Fe, K, La, Mg, Mn, Na, Ni, P, Pb, Sr, Ti, V, Zn, and their uptake by edible plants in soils collected in a green urban area. The results highlighted a high yield of those heavy metals typical for anthropic pollution, such as Pb, Zn, Cu, Ba and Co, likely due to the intensive vehicular traffic. The uptake of metals by edible plants was analyzed on two broadleaf plants, Lactuca sativa and Brassica oleracea, grown in this soil and in an uncontaminated Turin soil in a growth chamber with and without the addition of a soil improver, provided by a local Organic Waste Treatment Plant. The subsequent analysis of their aerial part and roots highlighted the absorption of the main potentially toxic elements (PTEs) by the vegetables grown in the contaminated soil, whereas their concentration was lower if cultivated in the comparison soil, which was free of pollutants. The use of a soil amendment did not decrease the uptake of PTEs by Lactuca sativa and Brassica oleracea, but it caused a strong reduction in their translocation from the roots to the edible part, which consisted of the aerial part.

1. Introduction

In recent years, the urban and peri-urban horticulture underwent a widespread diffusion in European cities prompted by the need for more sustainable and inclusive growth. Urban gardens are green spaces, owned by the municipal administrations, rented to associations, groups or individuals for the cultivation of flowers, fruit and vegetables [1]. Often, they are realized in peripheral areas of the city, constituting transition areas between the city and the countryside at risk of building speculation.
Urban gardens can be considered a concrete response to needs related to the concept of common good [2]. They represent an ancient, but highly innovative system to improve access to food for citizens, mainly for the poorest population, and to reduce socio-economic and environmental issues. The interest in urban horticulture is due to the need for citizens to regain green areas in contrast with increasing urbanization, the greater attention to fresh products with a short food supply chain and to an enhanced sensitivity toward sustainability. In fact, this practice favors an environmentally friendly urban regeneration that implies a reduction in the energy impact of the cities, an improvement in the urban microclimate, an overbuilding limitation, a sustainable cultivation by fighting food waste, a diffusion of virtuous circuits of fair trade, and ultimately a local production system through micro-economy paths [3,4]. It also contributes to increased urban life quality thanks to the aesthetic satisfaction given by a greener urban environment [5]. Moreover, the social impact of this activity is extremely positive since this community experience brings together different generations and different social contexts and encourages social aggregation, constituting a place for meeting and sharing. For instance, it has an important role in the rehabilitation of people with alcohol and drug addictions, for supporting and helping the elderly or physically and mentally disabled people [6].
Turin can be considered the Italian capital of urban gardens, due to the attention it has always paid to their planning and implementation. Currently the city counts 15 regulated urban gardens (total area of approximately 64,232 m2), 22 associative gardens, 7 spontaneous urban gardens and 3 vegetable gardens under construction [7].
Nevertheless urban gardens, and hence the plants growing therein, are exposed to continuous pollution sources such as atmospheric deposition, polluted irrigation water, vehicular traffic, use of pesticides and, mainly in post-industrial cities like Turin, previous industrial settlements [8]. Therefore, pollutants can be absorbed by crops, leading to a potential risk for human health. In particular, exposure to heavy metals is the most important risk factor in urban areas, especially as regards lead [9], whose adverse effects on health have been extensively documented [10].
For these reasons, it is imperative to determine the level of heavy metals pollution in the soil envisioned for the cultivation of edible species and to evaluate the yield of inorganic contaminants absorbed by plants. It is also fundamental to investigate a possible correlation between the content of contaminants in the edible plant species and that of the area where the plant grew. In plants, both the bioaccumulation factor and the translocation factor from root to shoot greatly vary with the plant species, the type of heavy metal and their interactions Thus, the risk of human exposure to contaminants can be significantly reduced by selecting suitable plants.
Generally, broad-leaved plants, such as species belonging to the genus Brassica, are more liable to store heavy metals in their edible parts [11,12,13], and the genus Lactuca exhibits a great absorption capacity for different metals [13]. Toxic elements present in the soil are usually absorbed by the plant at a radical level through binding carrier proteins normally involved in the transport of nutrients [12,14], and by acidifying the rhizosphere through proton pumps, with the consequent release of low-molecular-weight compounds which are able to act as metals chelators, thus favoring their uptake [14].
Our study aims to assess the level of heavy metal contamination in an urban soil in Turin, suitability for its position as an urban garden, its effects on the growth and uptake capacity of two selected broad-leaved plants, Lactuca sativa and Brassica oleracea, usually found in vegetable gardens.

2. Materials and Methods

2.1. Soil Sampling and Characterization

A sandy-loam soil was collected in a garden situated in a central area of Turin, in San Salvario neighborhood (CA-Via F. Campana, GPS coordinates: N 45°3’14", E 7°40’57") which is supposed to have a high level of heavy metals content. For comparison, another Turin sandy-loam soil, known as uncontaminated by heavy metals, was collected in a hilly peripheral green area (NOB-Parco del Nobile, GPS coordinates: N 45°3’1", E 7°42’52").
As regards the CA site, a more thorough sampling was carried out in February 2018 considering several points both on the surface and on the deep layer. The site was divided into four cells of 4 m2 area following a square grid layout, named A, B, C, D. The soil collected at the surface (10 cm) of vertexes and in the center of each square cell was mixed to obtain composite samples, namely SurA, SurB, SurC and SurD. The samples DeepA and DeepB were collected at a depth of 40 cm in the center of cells A and B, respectively. In the NOB site, five cores were randomly collected within a 40 m2 area. During the procedure, plastic tools were used in order to avoid contaminations and the samples were stowed into polyethylene bags. Thereafter, they were air-dried, sieved on a 2 mm sieve, ground in a centrifugal ball mill and stored in carbonate jars until they were analyzed.

2.2. Pot Experiments

Pots with a capacity of 600 mL were filled with the soil taken from the surface in the two sites after placing at the bottom a fine net of 10 cm2 and a layer of coarse sand (sterilized in a stove at 150 °C) to facilitate drainage.
Lactuca sativa L. and Brassica oleracea L. var. capitata were grown in pots, under controlled conditions and they were cultivated with and without the addition of a soil amendment supplied by Acea Pinerolese (AM) to evaluate its effect on the plants. This concentrated soil amendment comprises composted green waste and anaerobically digested organic materials from several sources. The composting process consists of two phases, namely the bio-oxidation (active composting time) of the most easily degradable organic components and the maturation (curing phase) in which the product is stabilized and enriched with humic substances [15]. The final product has the following characteristics: pH = 7–8.8, humidity = 50%, C/N ratio = 25, organic nitrogen = 80% NTK, total organic carbon = 20% p/p, electrical conductivity = 1.8 mS/cm. Lactuca sativa and Brassica oleracea were sown and grown in CA and in NOB soils both unaltered and mixed with the soil improver (70% soil and 30% soil improver (v/v)). Five pots were prepared as replicates for each plant for a total of 20 pots, considering the two soil sampling sites and the treatment with and without the amendment. They were kept in a growth chamber under a 16/8 h photo- and thermo-period of 24/20 °C day/night. The light source consisted of four Green Power led production modules (Philips) per shelf with a 2:1 red (626 nm peak) and blue (470 nm peak) emission. The plants were watered three times a week with 50–100 mL of deionized water for each watering.
The plants were harvested 3 months from sowing, and morphometric measurements were made on the diameter at the base of the stem and the number and area of the leaves. For the latter, the most representative leaves were scanned and the area was calculated through ImageJ, a computer program for digital image processing [16].
The root system was washed and separated from the rest of the plant. Fresh and dry weights were calculated before and after a drying process at a temperature of 60 °C in the oven until a constant weight was reached.

2.3. Treatment and Analysis of Vegetable and Soil Samples

Soil organic carbon (SOC), organic matter (SOM) and pH were measured in the soil of both sites according to the Italian official soil chemical analysis methods described by the Ministerial Decree 13/9/1999 [17]: pH was determined by potentiometric analysis on soil-CaCl2 suspension, SOC and SOM were measured with the Walkley–Black method [18].
The aerial part and roots were freeze-dried and ground to obtain a sample as homogeneous as possible. Before proceeding with the analysis, the samples of soil and vegetables were pre-treated mineralizing them with a Milestone MLS-1200 Mega (Milestone, Sorisole, Italy) microwave.
The digestion procedure for soil samples was performed by adding 5 mL of aqua regia to 0.05 g of soil inside tetrafluoromethoxyl (TFM) vessels, whereas for vegetables samples 0.5 g of epigeal or hypogeal parts were weighed and added with 6 mL of nitric acid and 2 mL of hydrogen peroxide. This mixture is strongly oxidizing and develops a lot of foam; for this reason, the vessels were let to rest under the hood for about thirty minutes before starting the digestion. Three replicates were made for each soil and vegetable sample. Soil and plant extracts, obtained from the mineralization step, were filtered on a Whatman 40 paper filter and then diluted with Highly Purified Water (HPW) to a final volume of 50 mL.
Twenty elements (Al, As, Ba, Ca, Cd, Ce, Co, Cr, Cu, Fe, K, La, Mg, Mn, Na, Ni, P, Pb, Sr, Ti, V, Zn) in plant samples and twenty-two (with the addition of La and Ce) in soil samples were determined by inductively coupled plasma–optical emission spectrometer (ICP-OES) or, when below the detection limit (LOD) of this instrument, the chemical analyses were conducted by a high-resolution inductively coupled plasma-mass spectrometer (HR-ICP-MS) or a graphite furnace atomic absorption spectrometer (GF-AAS), according to the different matrixes of soil and vegetables samples. In particular, As and Cd were determined by GF-AAS in all soil samples since they presented concentrations below the LOD of ICP-OES. As regards the plant samples, Cu, Ti and Al were below the LOD of ICP-OES and were determined by HR-ICP-MS in the 25% of samples, Cr, Ni and V in the 50% and Pb and Co in the 75% of samples. The other elements were quantified using the ICP-OES. Three instrumental replicates were performed for the determination of each element. The quality of the analytical procedure was verified using two NIST standard reference materials: tomato leaves 1573a for plant samples and San Joaquin soil 2709 for soil samples.
Models and technical specification of instruments are reported in Table 1.
Calibration curves were performed using the external standard calibration method for the quantification of all the elements. Standard solutions were prepared by diluting single element concentrated (1000 mg L−1) stock solutions (Sigma-Aldrich TraceCERT), with aliquots of sample blanks prepared with the same acid mixtures of samples (matrix matching method) [19].
The bioconcentration factor for each vegetable was calculated to assess the yield of metals transferred from the soil to the plant as follows [20,21]:
BF = metal concentration in aerial part and roots (mg kg−1 dry weight)/metal concentration in soil (mg kg−1 dry weight).
The translocation factor allows evaluating to what extent elements were transferred from the root system to the aerial part of the plant and was calculated for each vegetable through the relationship [20,21]:
TF = metal concentration in aerial part (mg kg−1 dry weight)/metal concentration in roots (mg kg−1 dry weight).

2.4. Data Analysis

Data about plants’ weights and morphometric parameters and the experimental results obtained by chemical analyses were processed by statistical treatment using the XlStat 2017 software package, an add-on of Microsoft Excel. Analysis of variance (ANOVA) and Tukey test with a level of confidence of 95% were performed [22,23].

3. Results and Discussion

3.1. Soil Characterization
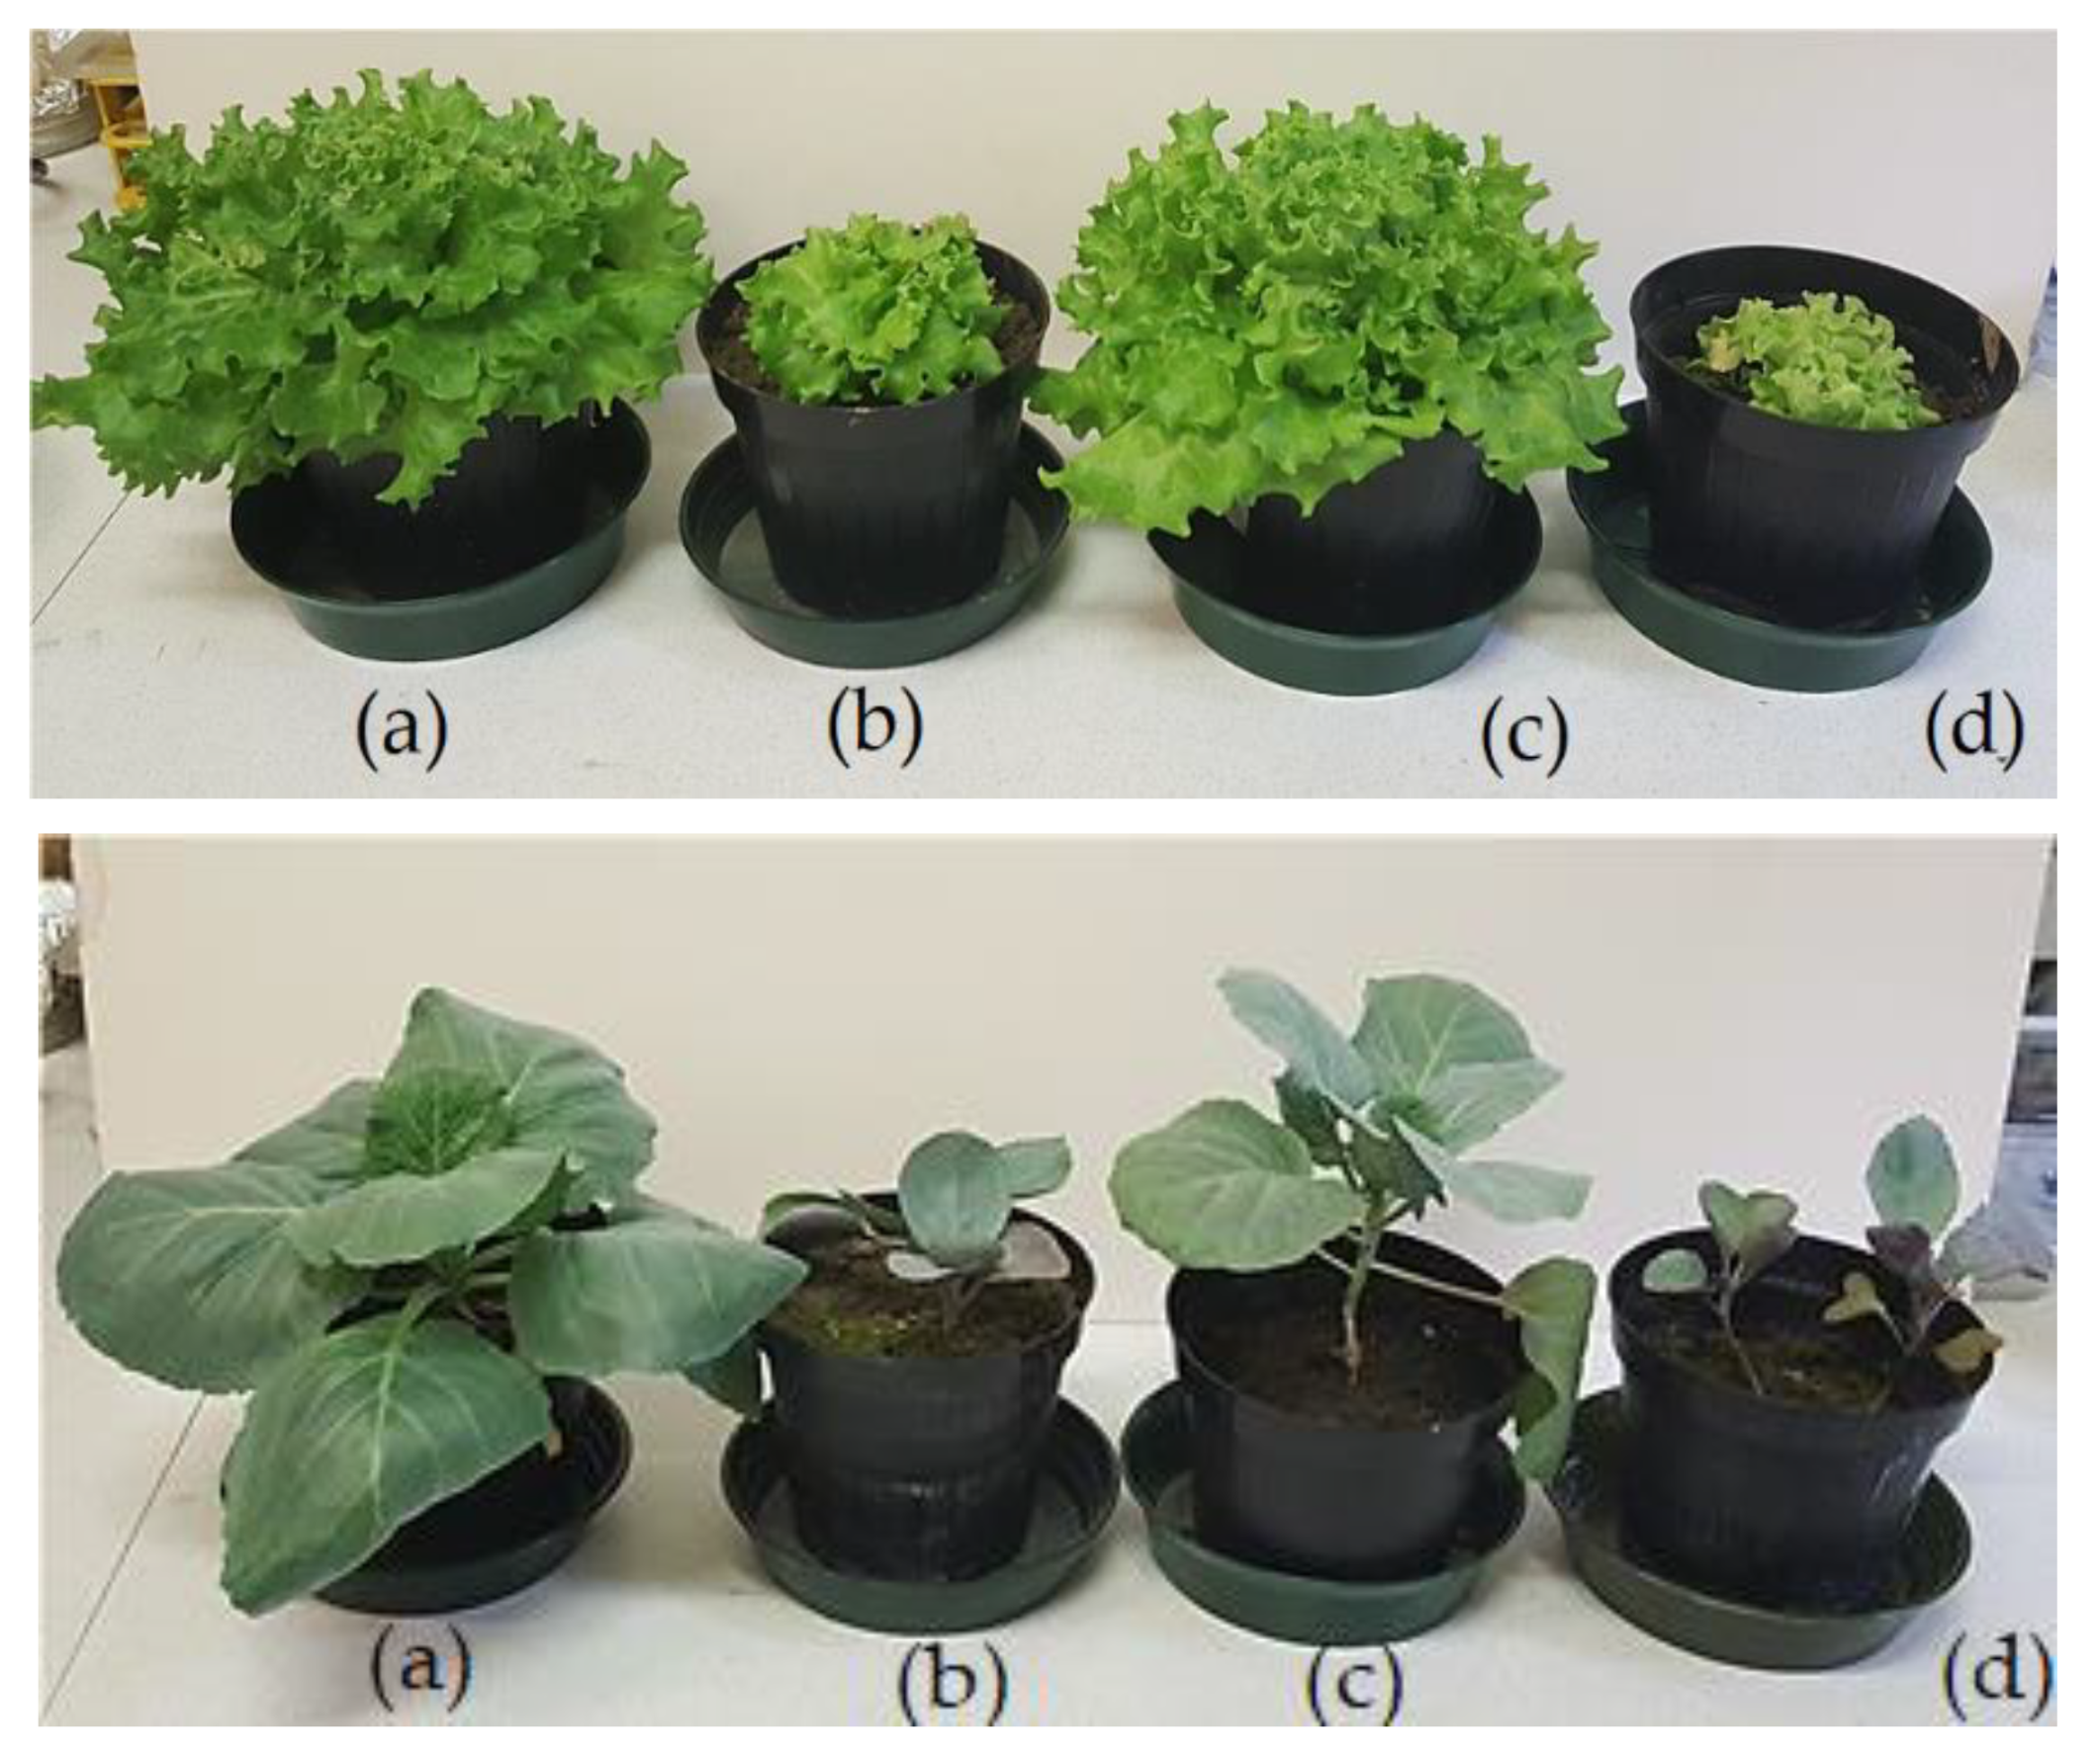
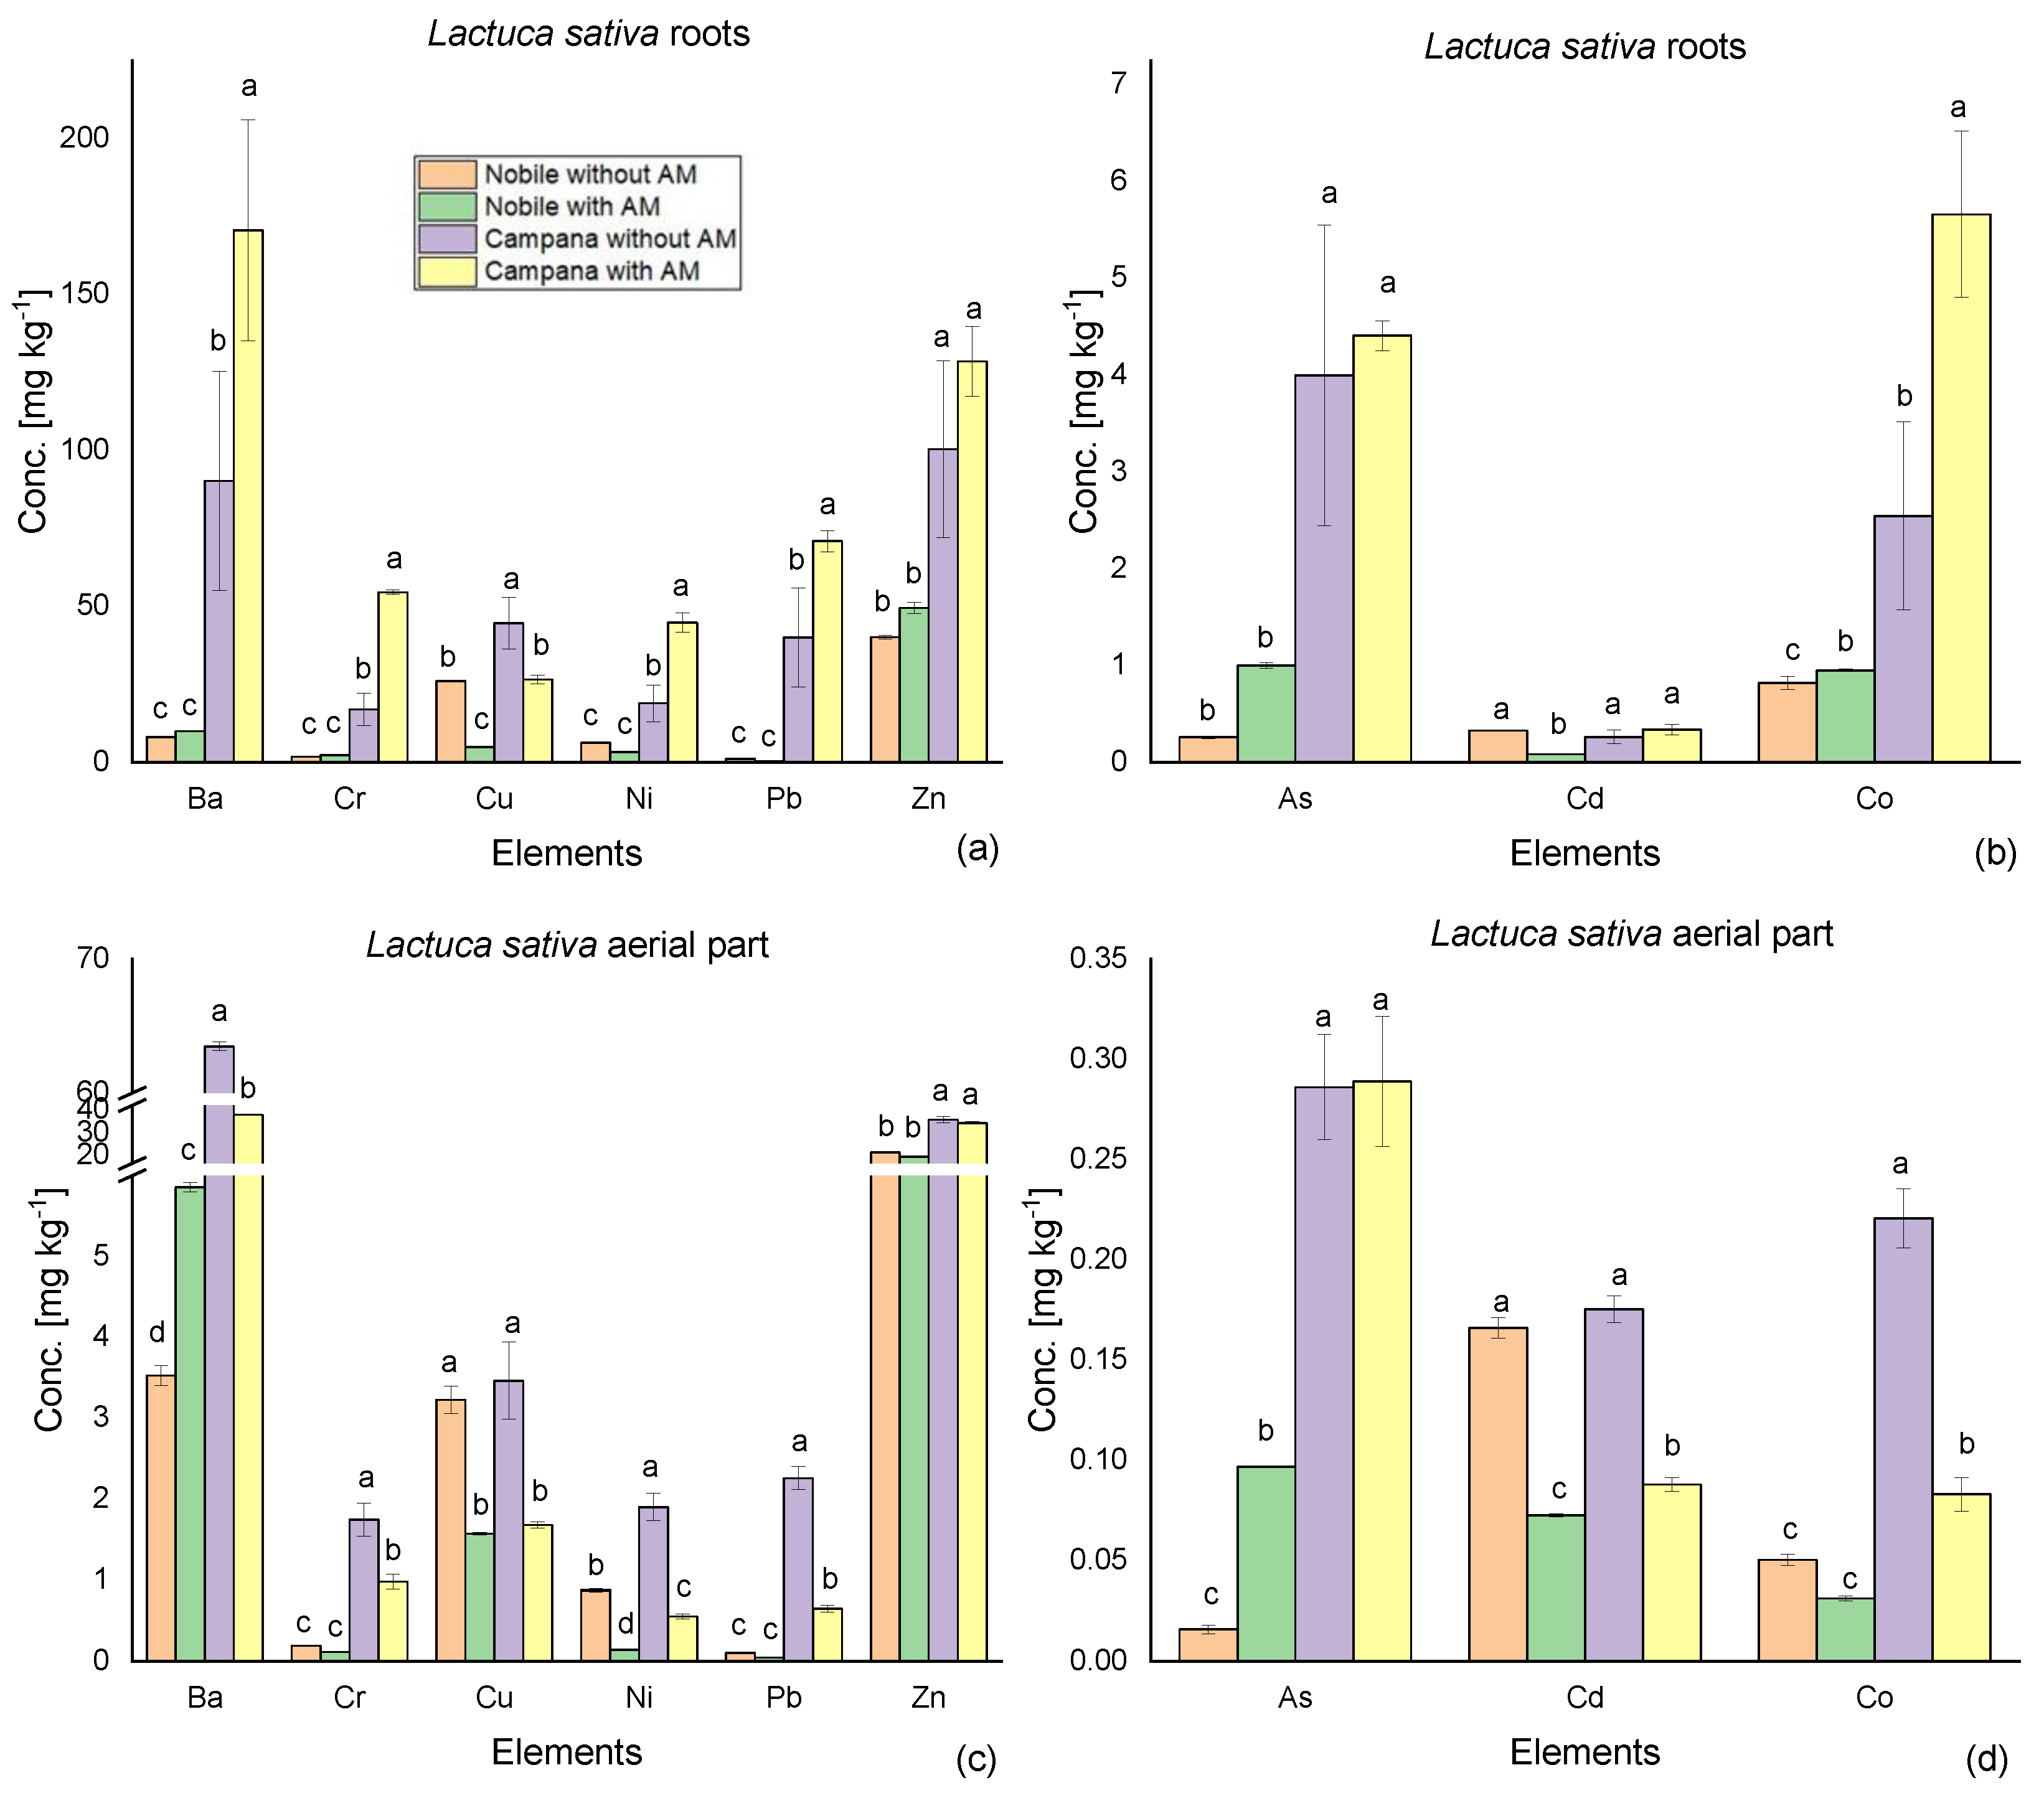
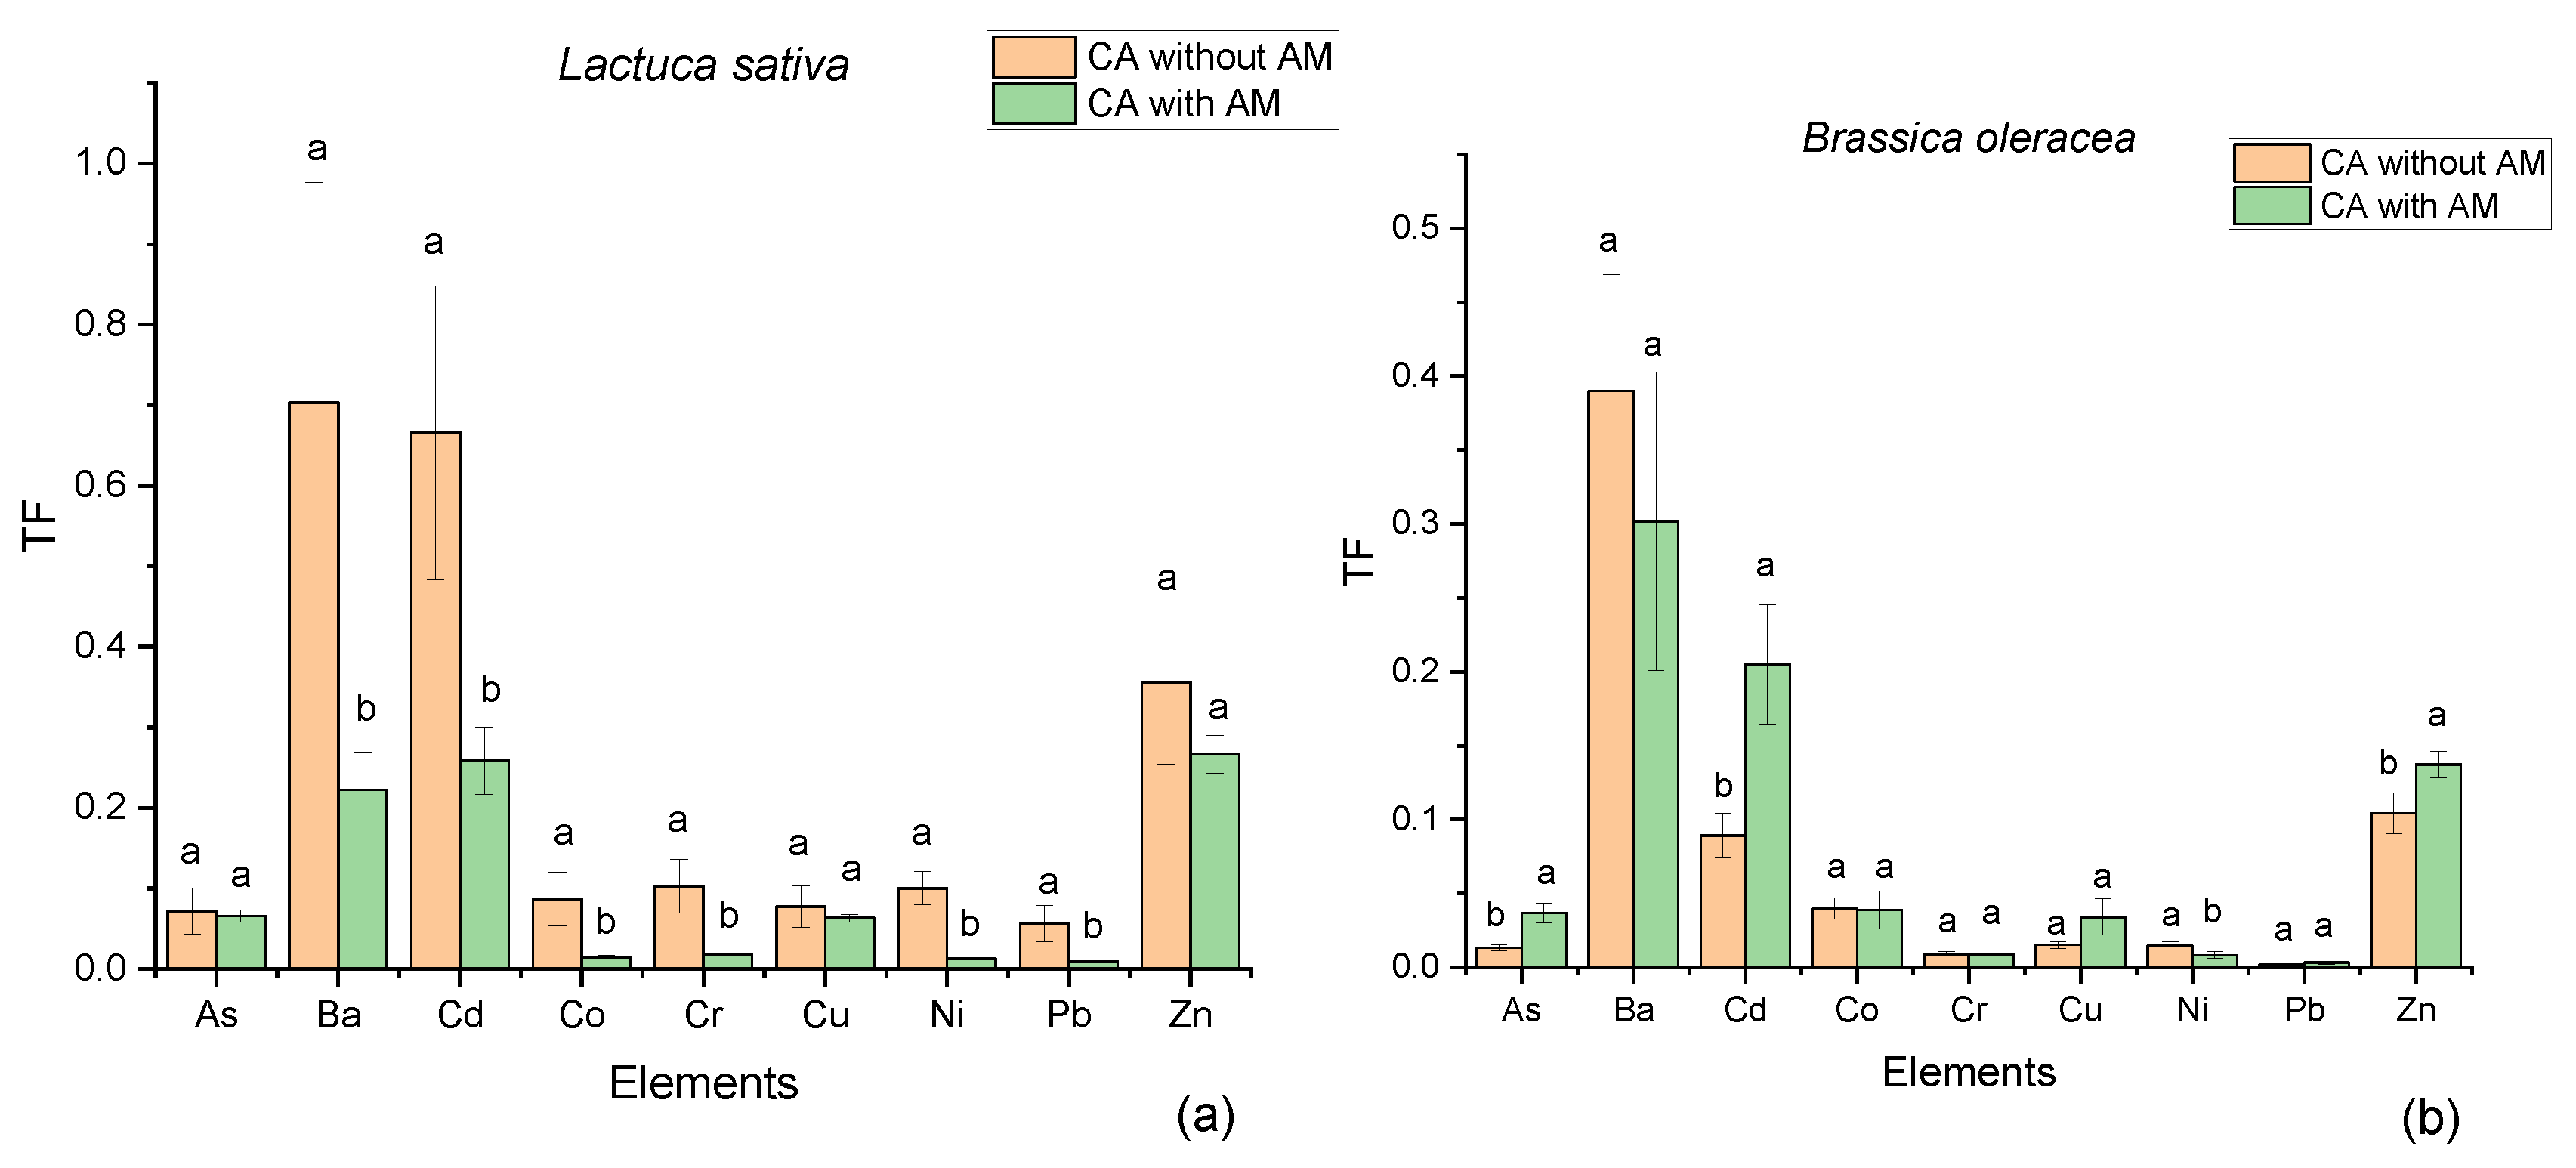
The values of SOC, SOM and pH for the investigated soils are shown in Table 2.
Analyses of CA soil evidence higher contents of SOC and SOM in surface layer than on deeper layers. These results are not surprising, as they are generally higher in the first decimeters of the soil [24]. SOC and SOM content is grater for NOB soil compared to CA soil. SOC accomplishes an essential positive function on many soil properties; it promotes the aggregation and stability of soil particles and it binds effectively with numerous substances, improving soil fertility, microbial activity, and nutrient availability such as nitrogen and phosphorus [25]. SOM is largely constituted by high-molecular-weight organic materials such as polysaccharides, proteins, sugars, amino acids and humic substances. Humic and fulvic acids can be present in a dissociated form, and thus are negatively charged (the main sources of these charges are carboxylic and phenolic groups in which hydrogen can be replaced by metal ions). The source of negative charges in soil colloids is strongly pH-dependent, and so the sorption of heavy metals in soils with relatively high organic content is strongly affected by pH as well as the ion properties of metals, like charge and ionic radius [26]. Moreover, the pH influences the availability of the nutrients for plants that reaches the maximum in the range 6–7 for P, 6.5–8 for macronutrients (K, Ca, Mg), and 5–7 for micronutrients such Cu, Fe, Mn, Ni, and Zn. Therefore, neutral conditions appear to be optimal for crop growth and soil microorganisms’ activity [27]. In our case, pH is close to neutrality for both terrains. Considering the sandy-loam texture of soils, the medium-high percentages of organic matter and organic carbon [25], which foster metals immobilization, and the neutral pH, marked metal availability and massive uptake by cultivated plants were not expected [28,29].
The concentration of the 22 elements detected in the superficial and deep layer samples of CA site, as well as their mean values and limits set by Italian legislation [30] are reported in Table 3. Overall, high concentration of Cr, Zn, Ni, Pb and Co were found in the CA site that exceeded public green area limits but not industrial area limits. NOB soil presents concentration values below the legal limits for all elements, except for Co, Cr and Ni.
It can be noticed that the content of some elements, namely Ba, Cd, Cu, P, Pb and Zn, was higher on the surface soil layer. The higher yield of P on the surface is not surprising as it is derived from decomposed organic material (leaves, insects) or from the addition of organic soil amendments or fertilizers [31]. The other results could be attributable to anthropogenic contamination, as these metals are commonly linked to urban pollution. For instance, Ba may derive from its widespread use in manufactured materials such as tiles, automobile clutch and brake linings, rubber, brick, paint, glass, and other materials [32]. Cd input in the environmental is due to different sources, such as vehicular traffic, combustion of fossil fuels and various industrial activities including the production of steel, pigments and batteries.
As concerns Pb, this metal is used in manifold activities, e.g., the production of automotive batteries, the manufacture of metal alloys, the working of the crystal, the welding and the production of bullets [33,34] and, in the past, in the production of paints and enamels, pipes, pesticides and as a gasoline additive for use as an anti-knock agent [35].
The anthropogenic sources of Cu should come from its use in agriculture (pesticides, agronomic use of zootechnical sewage, sewage sludge and amendment) and in industry, whereas the main sources of Zn are the industries (electroplating, foundries, battery production, etc.) and road traffic [36,37,38].
However, elements such as As, Cd and Cu, although more concentrated in the topsoil and therefore deserving of monitoring, the presented values below the Italian legal limits. Pb and Zn, instead, showed concentrations well above the limit for public green areas and their presence is probably connected to vehicular traffic, which represents the primary pollution source for the site of interest.
On the contrary, Co, Cr and Ni concentration is almost the same in surface and deep samples, because their presence in the soils of Turin area is mainly attributable to the lithological substrate of ultramafic rock of which they are the main constituents, as documented by other studies on the soil metal content in the Turin area [39,40].

3.2. Pot Experimets

Morphometric measurements and analysis of metal content were carried out on the L. sativa and B. oleracea plants grown in the growth chamber with different soil samples in the presence or absence of a soil amendment.
Morphological measurements are collected in Table 4 and show that both the type of soil and the addition of a soil amendment influenced the biomass of B. oleracea and L. sativa as fresh weight of aerial part and roots, as confirmed by ANOVA and Tukey tests (Table S1, Supplementary Materials).
In the absence of the amendment, the difference between the fresh weight of the aerial part of the plants grown in the NOB soil and in the CA soil is remarkable for L. sativa, whereas the values concerning B. oleracea do not differ significantly. Adding the amendment, a relevant increase in weight for both plants in CA soil and even more in NOB soil can be noted.
The root system shows the same trend. The ratio between the fresh weight of roots and the aerial part was higher in the plants grown in the absence of an amendment in both types of soil, since in this condition plants develop a more extensive root system due to the reduced availability of macro- and micro-nutrients compared with the soil with AM added to it. Considering the ratio between the dry and fresh weights of the aerial part of B. oleracea, a significant difference between the values of the plants grown in unpolluted soil without soil amendment and all other conditions can be observed, whereas higher values were found in both soils for L.sativa grown in the absence of AM. These data indicate a higher water content for plants grown in soils added with the amendment, which acts positively by reducing stomatal resistance.
The data reported in Table 5 and Figure 1 and ANOVA and Tukey tests (Table S1, Supplementary Materials) highlight that the soil used for cultivation particularly influenced the leaf area of both plants, showing the highest values for NOB soil. The addition of AM significantly affects the plant growth, as higher values of stem diameter and of number and size of the leaves are measured in all the examined plants for both sites. In particular, the stem diameter of B. oleracea and L. sativa grown with AM are about three and two times those of the plants grown without and the number of leaves is about double in the presence of AM for both plants.
To assess the adsorption in investigated edible plants of potentially harmful metals, the content of 22 elements was determined in the aerial parts and roots (data reported in Tables S2–S5, Supplementary Materials). Figure 2 shows the concentrations of potentially toxic elements (As, Ba, Cd, Co, Cr, Cu, Ni, Pb and Zn) analyzed in the roots (a, b) and in the aerial parts (c, d) of L. sativa grown in the soil of the two sites with or without the addition of AM, whereas the results of ANOVA and Tukey tests are reported in Tables S6 and S7 of Supplementary Materials. In general, the metal content in any part of the L. sativa is lower in those grown in the NOB soil, reflecting the difference in concentration detected in the two sites, except for the Cd, which shows similar concentrations.
The effectiveness of the addition of soil amendment depends both on the type of plant and the soil, and on the element under examination, which can have a different speciation and reactivity.
Considering both the root and aerial part of L. sativa grown in CA soil, it can be noticed that the total concentration of Ba, Co, Cr, Ni and Pb is greater for the vegetable grown in the presence of AM, but there is a minor translocation from the roots to the aerial part, with a consequently lower concentration in the edible part when the amendment is used. The plant is probably positively affected by the presence of the amendment and develops a more efficient root system that allows it to absorb a greater quantity of elements; however, these are not transferred to the edible aerial part. In particular, Ba and Ni adsorption seems to be significantly affected by the addition of AM since the difference between their content in the L. sativa samples grown in soils treated or not is very marked. In fact, the addition of the amendment causes a decrease in the concentration of Ni and Ba in the aerial parts of the plants grown in CA soil. Zinc, similar to the elements mentioned so far, presents a higher total concentration in L. sativa grown in the presence of AM, but in this case the amendment does not cause a strong reduction in its transfer to the edible part. Therefore, Zn, an essential microelement for plant life and very abundant in the soils considered, is well absorbed by the plant.
Copper is also an essential element for vegetable species, but its behavior is different since its uptake in the L. sativa is strongly influenced by the presence of amendment in both soils. Copper amount is always higher in L. sativa cultivated without amendment and this could be due to the different speciation of this element, often added as fungicide to the plants also cultivated in urban gardens, and at the lowest concentration necessary for plant growth.
In the case of As and Cd, the total concentration in the vegetable is comparable. The transport of Cd in the aerial parts of the plant is greater for the samples grown without the use of amendment, contrary to what was observed for As, where the addition of amendment does not cause a decreased concentration in the aerial part.
Regardless of the improver’s use, the concentration values of Pb and Cd in L. sativa (Table S2) are well below the maximum concentration allowed for edible parts of broad-leaved vegetables by Commission Regulation (EC) No. 1881/2006 of the Official Journal of the European Union [41], which defines as a threshold 0.30 mg kg−1 wet weight for Pb and 0.20 mg kg−1 wet weight for Cd.
In Figure 3, the concentrations of potentially toxic elements analyzed in roots (a, b) and in the aerial part (c, d) of B. oleracea grown in the soil of the two sites with or without the addition of the soil amendment are reported, whereas the results of ANOVA and Tukey tests are reported in Tables S8 and S9 of Supplementary Materials.
As in the case of L. sativa, the total metal content is higher for B. oleracea grown in the CA soil than for the vegetable grown in NOB soil, reflecting the different metal content of the two soils. The concentration gap is particularly significant in the case of the roots, while it decreases if the aerial part is considered. In particular, Ni, As and Co show unusually higher concentrations in the aerial part of B. oleracea grown in NOB soil.
Chromium, copper, lead, barium, cobalt, arsenic, and cadmium are more concentrated in the roots of B. oleracea grown in the polluted soil of CA site and in the absence of the AM for both soils. As regards the aerial part, the use of the amendment causes a decrease in Cr, Ni, and Pb concentration in plants grown in both soils and a decrement in Ba and Co concentration in CA plants. On the contrary, the addition of AM induces an opposite trend of concentration for Cu and As in the aerial part, that is higher in the presence of the amendment both in CA and NOB soils.
Zinc, although an essential element for plants, has a behaviour similar to that assumed by most of the potentially toxic elements considered.
As observed for L. sativa, the concentration values of Pb and Cd in B. oleracea aerial part (Table S4) are below the limits set by Commission Regulation (EC) No. 1881/2006 of the Official Journal of the European Union [39], whether the improver is used or not.
The comparison of bioconcentration and translocation factors of L. sativa and B. oleracea grown in CA soil with or without AM, reported in Figure 4 and Figure 5, and the results of ANOVA and Tukey tests reported in Tables S10–S13 of Supplementary Materials, provide evidence that the absorption of metals from the soil by L. sativa increases in the presence of an amendment for most elements, namely Cd, Co, Cr, Ni, Pb and Zn; on the contrary, a clear trend is not evidenced in the case of B. oleracea, since BF decreases or increase according to the considered element.
Overall, in the presence of AM, B. Oleracea shows a lower absorption than L. Sativa for most elements examined.
Moreover, comparing the two vegetables, the translocation in the case of B. oleracea occurs to a much lesser extent than L. sativa. The translocation of potentially toxic elements from roots to the aerial part is significantly higher for L. sativa cultivated in the absence of an amendment, whereas no significant variation in TF values for B. oleracea were observed, with the exception of As, Cd and Zn.
Therefore, the addition of the amendment proved to be efficient in decreasing the translocation of potentially toxic elements in L. sativa and it did not alter the behavior of the B. oleracea which showed a lower assimilation of the toxic elements.

4. Conclusions

The site of Via Campana (Turin), usable as vegetable garden due to its central position, was found to be contaminated by the following metals: Cr, Zn, Ni, Pb and Co, whose concentrations exceeded Italian legislation limits.
The cultivation in growth chamber of the edible species L. sativa and B. Oleracea in the soil collected from CA, and the subsequent analysis of their aerial part and roots highlighted the absorption of the main potentially toxic elements by these plants. Comparing the PTEs uptake in L. sativa and B. oleracea, cultivated in CA soil, and in another soil considered as blank, it was evident that the metal content in vegetables was higher in the former than in the latter, as a consequence of the contamination of CA soil.
Despite this, the use of the soil amendment leads to a lower absorption with regard to B. oleracea and involves a considerable decrease in the translocation factor from the roots to the aerial part, especially for L. sativa, an encouraging result since it is precisely the aerial part that is consumed by humans, and therefore it is particularly important that there is a low content of contaminants in this portion.
The analyses showed that the presence of inorganic contaminants caused a reduction in the biomass of the plants, however, this can be compensated for by adding a soil amendment, thanks to the consequent enrichment of nutrients and organic matter, the improvement in the structure of the soil and the reduction in the bioavailability of toxic compounds. This is particularly convenient if we consider that the soil amendment also causes a decrease in the translocation of potentially toxic elements, thus not causing an increase in the concentration in the aerial parts that can be consumed.

Supplementary Materials

The following are available online at https://www.mdpi.com/2076-3417/10/13/4483/s1, Table S1. Summary of multiple comparisons for pairs of plants weights and morphometric parameters with Tukey test. NOB = plants grown in Nobile soil, CA = plants grown in Campana soil, AM = addition of amendment to the soil, Ls = Lactuca sativa, Bo = Brassica oleracea. Letter B identifies weights and parameters whose means are significantly lower than the ones obtained for weights and parameters identified by letter A; the same concept applies to letter C with respect to letter B, letter D with respect to letter C and letter E with respect to letter D, Table S2. Elements concentration [mg kg−1 dry weight] ± SD in L. sativa aerial part. NOB = plants grown in Nobile soil, CA = plants grown in Campana soil, AM = amendment, Table S3. Elements concentration [mg kg−1 dry weight] ± SD in L. sativa roots. NOB = plants grown in Nobile soil, CA = plants grown in Campana soil, AM = amendment, Table S4. Elements concentration [mg kg−1 dry weight] ± SD in B. oleracea aerial part. NOB = plants grown in Nobile soil, CA = plants grown in Campana soil, AM = amendment, Table S5. Elements concentration [mg kg−1 dry weight] ± SD in B. oleracea roots. NOB = plants grown in Nobile soil, CA = plants grown in Campana soil, AM = amendment, Table S6: Summary of multiple pairwise comparisons on element concentrations in Lactuca sativa roots obtained with ANOVA and Tukey tests. NOB = plants grown in Nobile soil, CA = plants grown in Campana soil, AM = addition of amendment to the soil. Letter B identifies soil samples whose mean concentrations in the respective elements are significantly lower than the ones obtained for soil samples identified by letter A; the same concept applies to letter C with respect to letter B, Table S7: Summary of multiple pairwise comparisons on element concentrations in Lactuca sativa aerial part obtained with ANOVA and Tukey tests. NOB = plants grown in Nobile soil, CA = plants grown in Campana soil, AM = addition of amendment to the soil. Letter B identifies plant samples whose mean concentrations in the respective elements are significantly lower than the ones obtained for plant samples identified by letter A; the same concept applies to letter C with respect to letter B and letter D with respect to letter C, Table S8: Summary of multiple pairwise comparisons on element concentrations in Brassica oleracea roots obtained with ANOVA and Tukey tests. NOB = plants grown in Nobile soil, CA = plants grown in Campana soil, AM = addition of amendment to the soil. Letter B identifies plant samples whose mean concentrations in the respective elements are significantly lower than the ones obtained for plant samples identified by letter A; the same concept applies to letter C with respect to letter B and letter D with respect to letter C, Table S9: Summary of multiple pairwise comparisons on element concentrations in Brassica oleracea aerial part obtained with ANOVA and Tukey tests. NOB = plants grown in Nobile soil, CA = plants grown in Campana soil, AM = addition of amendment to the soil. Letter B identifies plant samples whose mean concentrations in the respective elements are significantly lower than the ones obtained for plant samples identified by letter A; the same concept applies to letter C with respect to letter B and letter D with respect to letter C, Table S10: Summary of multiple comparisons for pairs of Lactuca sativa BF with Tukey test. CA = plants grown in Campana soil, AM = addition of amendment to the soil. Letter B identifies BF values whose means are significantly lower than the ones obtained for BF values identified by letter A, Table S11: Summary of multiple comparisons for pairs of Lactuca sativa TF with Tukey test. CA = plants grown in Campana soil, AM = addition of amendment to the soil. Letter B identifies TF values whose means are significantly lower than the ones obtained for TF values identified by letter A, Table S12: Summary of multiple comparisons for pairs of Brassica oleracea BF with Tukey test. CA = plants grown in Campana soil, AM = addition of amendment to the soil. Letter B identifies BF values whose means are significantly lower than the ones obtained for BF values identified by letter A, Table S13: Summary of multiple comparisons for pairs of Brassica oleracea TF with Tukey test. CA = plants grown in Campana soil, AM = addition of amendment to the soil. Letter B identifies TF values whose means are significantly lower than the ones obtained for TF values identified by letter A.

Author Contributions

Conceptualization, A.F. and P.C.; methodology, A.F. and M.M. (Marco Mucciarelli); formal analysis, E.G.; investigation, D.F. and G.B.; resources, M.M. (Mery Malandrino), D.F. and A.F.; data curation, G.B.; writing—original draft preparation, E.G. and D.F.; writing—review and editing, M.M. (Marco Mucciarelli), M.M. (Mery Malandrino), O.A.; visualization, E.G.; supervision, M.M. (Mery Malandrino), A.F. and P.C.; project administration, M.M. (Mery Malandrino) and P.C.; funding acquisition, P.C. All authors have read and agreed to the published version of the manuscript.

Funding

This work has received funding from Compagnia di San Paolo (project CSTO168877- ReHorti).

Acknowledgments

We kindly acknowledge ACEA Pinerolese for providing the soil improver.

Conflicts of Interest

The authors declare no conflict of interest.

References

  1. C.d.T.-. Orti urbani. Available online: www.comune.torino.it (accessed on 9 February 2020).
  2. DeLind, L.B. Place, work, and civic agriculture: Common fields for cultivation. Agr. Hum. Values 2002, 19, 217–224. [Google Scholar] [CrossRef]
  3. Orsini, F.; Kahane, R.; Nono-Womdim, R.; Gianquinto, G. Urban agriculture in the developing world: a review. Agron. Sustain. Dev. 2013, 33, 695–720. [Google Scholar] [CrossRef] [Green Version]
  4. Leake, J.R.; Adam-Bradford, A.; Rigby, J.E. Health benefits of ’grow your own’ food in urban areas: implications for contaminated land risk assessment and risk management? Environ. Health 2009, 8, S6. [Google Scholar] [CrossRef] [PubMed] [Green Version]
  5. La Greca, P.; La Rosa, D.; Martinico, F.; Privitera, R. Agricultural and green infrastructures: the role of non-urbanised areas for eco-sustainable planning in a metropolitan region. Environ. Pollut. 2011, 159, 2193–2202. [Google Scholar] [CrossRef]
  6. Muganu, M.; Balestra, G.M.; Senni, S. THE IMPORTANCE OF ORGANIC METHOD IN SOCIAL HORTICULTURE. In ISHS Acta Horticulturae 881: II International Conference on Landscape and Urban Horticulture; ISHS: Leuven, Belgium, 2010; pp. 847–849. [Google Scholar]
  7. Comune di Torino. Available online: http://www.comune.torino.it/verdepubblico/patrimonioverde/verdeto/numeri.shtml (accessed on 2 February 2020).
  8. Antisari, L.V.; Orsini, F.; Marchetti, L.; Vianello, G.; Gianquinto, G. Heavy metal accumulation in vegetables grown in urban gardens. Agro. Sustain. Dev. 2015, 35, 1139–1147. [Google Scholar] [CrossRef]
  9. Alloway, B.J. Contamination of soils in domestic gardens and allotments: a brief overview. Land Contam. Reclam. 2004, 12, 179–187. [Google Scholar] [CrossRef]
  10. Hough, R.L.; Breward, N.; Young, S.D.; Crout, N.M.; Tye, A.M.; Moir, A.M.; Thornton, I. Assessing potential risk of heavy metal exposure from consumption of home-produced vegetables by urban populations. Environ. Health Perspect. 2004, 112, 215–221. [Google Scholar] [CrossRef] [PubMed] [Green Version]
  11. McBride, M.B.; Simon, T.; Tam, G.; Wharton, S. Lead and Arsenic Uptake by Leafy Vegetables Grown on Contaminated Soils: Effects of Mineral and Organic Amendments. Water Air Soil Pollut. 2013, 224. [Google Scholar] [CrossRef]
  12. Kaur, H.; Garg, N. Recent Perspectives on Cross Talk Between Cadmium, Zinc, and Arbuscular Mycorrhizal Fungi in Plants. J. Plant Growth Reg. 2017, 1–14. [Google Scholar] [CrossRef]
  13. Khan, A.; Khan, S.; Khan, M.; Qamar, Z.; Waqas, M. The uptake and bioaccumulation of heavy metals by food plants, their effects on plants nutrients, and associated health risk: A review. Environ. Sci. Pollut. Res. Int. 2015, 22. [Google Scholar] [CrossRef]
  14. Clemens, S. Toxic metal accumulation, responses to exposure and mechanisms of tolerance in plants. Biochimie 2006, 88, 1707–1719. [Google Scholar] [CrossRef] [PubMed]
  15. Gaggero, E.; Malandrino, M.; Fabbri, D.; Bordiglia, G.; Fusconi, A.; Mucciarelli, M.; Inaudi, P.; Calza, P. Uptake of Potentially Toxic Elements by Four Plant Species Suitable for Phytoremediation of Turin Urban Soils. Appl. Sci. 2020, 10, 3948. [Google Scholar] [CrossRef]
  16. ImageJ. Available online: https://imagej.net/ImageJ (accessed on 6 April 2020).
  17. Metodi Ufficiali di Analisi Chimica del Suolo; Decreto Ministeriale, Ministero Delle Politiche Agricole e Forestali: Rome, Italy, 13 September 1999.
  18. Schulte, E.; Hoskins, B. Recommended Soil Testing Procedures for the Northeastern United States. Recomm. Soil Org. Matter Tests 1995, 493, 52–60. [Google Scholar]
  19. Thompson, M.; Ramsey, M.H.; Coles, B.J. Communication. Interactive matrix matching: a new method of correcting interference effects in inductively coupled plasma spectrometry. Analyst 1982, 107, 1286–1288. [Google Scholar] [CrossRef]
  20. Yoon, J.; Cao, X.; Zhou, Q.; Ma, L.Q. Accumulation of Pb, Cu, and Zn in native plants growing on a contaminated Florida site. Sci. Total Environ. 2006, 368, 456–464. [Google Scholar] [CrossRef]
  21. Fitz, W.J.; Wenzel, W.W. Arsenic transformations in the soil rhizosphere plant system fundamentals and potential application to phytoremediation. J. Biotechnol. 2002, 99, 259–278. [Google Scholar] [CrossRef]
  22. Einax, W.; Zwanziger, H.W.; Gei, S. Chemometrics in Environmental Analysis; Wiley-VHC: Weinhem, Germany, 1997. [Google Scholar]
  23. Massart, D.L.; Vandenginste, B.G.M.; Buydens, L.M.C.; De Jono, S.; Leqi, P.J.; Smeyers-Verbeke, J. Handbook of Chemometrics and Quantimetrics, Parts A and B; Elsevier: Amsterdam, The Netherlands, 1997. [Google Scholar]
  24. Lorenz, K.; Lal, R. The Depth Distribution of Soil Organic Carbon in Relation to Land Use and Management and the Potential of Carbon Sequestration in Subsoil Horizons. Adv. Agron. 2005, 88, 35–66. [Google Scholar]
  25. ARPAV. Available online: https://www.arpa.veneto.it/arpavinforma/indicatori-ambientali/indicatori_ambientali/geosfera/qualita-dei-suoli/contenuto-di-carbonio-organico-nello-strato-superficiale-di-suolo/view (accessed on 14 February 2020).
  26. Dube, A.; Zbytniewski, R.; Kowalkowski, T.; Cukrowska, E.; Buszewski, B. Adsorption and migration of heavy metals. Pol. J. Environ. Stud. 2001, 10, 1–10. [Google Scholar]
  27. McCauley, A.; Jones, C.; Jacobsen, J. Soil pH and organic matter. Nutr. Manag. 2009, 8, 1–12. [Google Scholar]
  28. Yin, Y.; Impellitteri, C.A.; You, S.-J.; Allen, H.E. The importance of organic matter distribution and extract soil:solution ratio on the desorption of heavy metals from soils. Sci. Total Environ. 2002, 287, 107–119. [Google Scholar] [CrossRef]
  29. Lair, G.J.; Gerzabek, M.H.; Haberhauer, G. Sorption of heavy metals on organic and inorganic soil constituents. Environ. Chem. Lett. 2007, 5, 23–27. [Google Scholar] [CrossRef]
  30. Norme in Materia Ambientale. Decreto Legislativo, Italy, 3 April 2006; n. 152. Available online: https://www.ambientediritto.it/Legislazione/VARIE/2006/dlgs_2006_n.152.htm (accessed on 24 June 2020).
  31. Syers, J.; Johnston, A.; Curtin, D. Efficiency of soil and fertilizer phosphorus use. FAO Fertil. Plant Nutr. Bull. 2008, 18. [Google Scholar]
  32. McBride, M.B.; Shayler, H.A.; Spliethoff, H.M.; Mitchell, R.G.; Marquez-Bravo, L.G.; Ferenz, G.S.; Russell-Anelli, J.M.; Casey, L.; Bachman, S. Concentrations of lead, cadmium and barium in urban garden-grown vegetables: The impact of soil variables. Environ. Pollut. 2014, 194, 254–261. [Google Scholar] [CrossRef] [PubMed] [Green Version]
  33. Ross, S.M. Toxic Metals in Soil-plant Systems; Wiley: Hoboken, NJ, USA, 1994; p. 484. [Google Scholar]
  34. Tong, S.; von Schrinding, Y.E.; Prapamontol, T. Environmental lead exposure: a public health problem of global dimension. Bull. World Health Organ. 2000, 78, 1068–1077. [Google Scholar] [PubMed]
  35. Kushwaha, A.; Hans, N.; Kumar, S.; Rani, R. A critical review on speciation, mobilization and toxicity of lead in soil-microbe-plant system and bioremediation strategies. Ecotoxicol. Environ. Saf. 2018, 147, 1035–1045. [Google Scholar] [CrossRef]
  36. Wuana, R.A.; Okieimen, F.E. Heavy Metals in Contaminated Soils: A Review of Sources, Chemistry, Risks and Best Available Strategies for Remediation. ISRN Ecol. 2011, 2011, 1–20. [Google Scholar] [CrossRef] [Green Version]
  37. Su, C. A review on heavy metal contamination in the soil worldwide: Situation, impact and remediation techniques. Environ. Skept. Crit. 2014, 3, 24. [Google Scholar]
  38. Tchounwou, P.B.; Yedjou, C.G.; Patlolla, A.K.; Sutton, D.J. Heavy metal toxicity and the environment. Exp. Suppl. 2012, 101, 133–164. [Google Scholar]
  39. Biasioli, M.; Barberis, R.; Ajmone-Marsan, F. The influence of a large city on some soil properties and metals content. Sci. Total Environ. 2006, 356, 154–164. [Google Scholar] [CrossRef]
  40. Bonifacio, E.; Falsone, G.; Piazza, S. Linking Ni and Cr concentrations to soil mineralogy: Does it help to assess metal contamination when the natural background is high? Soils Sediments 2010, 10. [Google Scholar] [CrossRef]
  41. Commission Regulation (EC) No. 1881/2006 of 19 December 2006 setting maximum levels for certain contaminants in foodstuffs. Off. J. Eur. Union 2006, 364, 324–365.
Figure 1. Plants of Lactuca sativa (top) and Brassica oleracea (bottom) grown under different conditions: (a) = NOB soil with AM, (b) = NOB soil without AM, (c) = CA soil with AM, (d) CA soil without AM.
Applsci 10 04483 g001
Figure 2. Comparison of potentially toxic elements’ uptake in the roots (a,b) and in aerial part (c,d) of Lactuca sativa grown in CA and NOB soils. Elements concentrations are expressed as mg kg−1 dry weight. Letters above columns refer to the summary of multiple comparisons for pairs obtained with Tukey test. Letter b identifies plant samples whose mean concentrations in the respective elements are significantly lower than the ones obtained for plant samples identified by letter a; the same concept applies to letter c with respect to letter b and letter d with respect to letter c.
Applsci 10 04483 g002
Figure 3. Comparison of potentially toxic elements’ uptake in the roots (a,b) and in the aerial part (c,d) of Brassica oleracea grown in CA and NOB soils. Element concentrations are expressed as mg kg−1 dry weight. The letters above columns refer to the summary of multiple comparisons for pairs obtained with Tukey test. Letter b identifies plant samples whose mean concentrations in the respective elements are significantly lower than the ones obtained for plant samples identified by letter a; the same concept applies to letter c with respect to letter b and letter d with respect to letter c.
Applsci 10 04483 g003
Figure 4. Bioconcentration factors (BF) of Lactuca sativa (a) and Brassica oleracea (b) grown in the polluted Ca soil with or without the amendment (AM). Letters above columns refer to the summary of multiple comparisons for pairs obtained with Tukey test. Letter b identifies BF values whose means are significantly lower than the ones obtained for the BF values identified by letter a.
Applsci 10 04483 g004
Figure 5. Translocation factors (TF) of Lactuca sativa (a) and Brassica oleracea (b) grown in the polluted CA soil with or without the amendment (AM). Letters above columns refer to the summary of multiple comparisons for pairs obtained with Tukey test. Letter b identifies TF values whose means are significantly lower than the ones obtained for the TF values identified by letter a.
Applsci 10 04483 g005
Table 1. Models and technical specification of instrumental techniques used for the analyses.
TechniqueModelFeatures
ICP-OESPerkin Elmer Optima
7000 DV
Mira Mist nebulizer, cyclonic spray chamber, dual echelle monochromator, dual CCD detector
HR-ICP-MSThermo Finnigan
Element 2
Conical nebulizer, cyclonic spray chamber, magnetic and electric sector, SEM detector
GF-AASPerkin Elmer Aanalyst 600Transversely Heated Graphite Atomizer (THGA) furnace assembly, longitudinal Zeeman-effect background correction, enhanced STPF technology, True Temperature Control (TTC), solid-state detector
Table 2. General characteristics of the Turin central area (CA) and peripheral green area (NOB) soils.
CA (Surface Layer)CA (Deep Layer)NOB
Organic carbon (% w/w)1.66 ± 0.010.47 ± 0.022.05 ± 0.05
Organic matter (% w/w)2.86 ± 0.010.80 ± 0.033.54 ± 0.08
pH7.17.07.3
Table 3. Concentrations (mean and standard deviation) of the elements determined in the soil samples collected in the CA site and comparison with Italian legislation limits for green public areas (limit A) and industrial areas (limit B). All the concentrations are expressed as mg kg−1 dry weight. <LOD indicates that the concentration of the element is below the limit of detection of the analytical technique. Element concentrations that exceed limits for green public areas are reported in bold.
Sup ASup BSup CSup DProf AProf BSurficial Samples Mean ValueDeep Samples Mean ValueLimit ALimit B
Al 44,372±176745,331±110041,785±330542,421±221252,790±195851,645±162543,477±165552,218±810
As10.9±0.314±113±216±49.6±0.210.0±0.413±29.8±0.32050
Ba 396±56472±31467±92461±93229±4232±6449±35231±2
Ca 18,167±90320,269±60121,274±342420,803±199533,281±215230,341±212920,128±137031811±2079
Cd0.25±0.030.28±0.040.18±0.020.17±0.03<LOD<LOD0.22±0.05<LOD215
Ce 40±345±542±741±652±549±642±250±3
Co 25±325±526±619±622±523±124±322.3±0.320250
Cr 191±2252±66211±52254±76233±23210±21227±31222±17150800
Cu 89±1789±379±391±2258±159±287±659±1120600
Fe 37,379±971036,442±96134,696±41737,475±164935,779±53536,379±22036,498±128936,079±424
K11,804±50012,316±36311,343±69911,858±23312,865±40912,932±37511,830±39812,899±47
La 15±217±216±316±220±219±216±119.4±0.7
Mg 12,313±63913,357±73812,535±191513,688±43915,404±133414,811±187212,973±65515,108±419
Mn 866±61941±10936±7928±34980±121036±33918±351008±40
Na 7034±3427762±1108254±8197566±5378011±978518±197654±5058265±359
Ni 142±12167±26157±26159±7139±4148±10156±10143±6120500
P 999±1411407±2581196±911013±19383±11403±151154±191393±15
Pb 267±68302±17249±21322±13757.0±1.456.3±1.4285±3356.7±0.51001000
Sr92±3104±1294±1493±4115±6117±796±5116±1
Ti 2730±4192797±1492731±672633±2002974±1763235±1522723±683105±185
V 77±184±282±479±479.5±0.685±281±382±490250
Zn 220±12257±11225±8218±895±398±2230±1897±21501500
Table 4. Weights observed for Lactuca sativa and Brassica oleracea plants in the four growing conditions after three months of growing.
Vegetable SpeciesSoilAmendment (AM)Aerial Part Fresh Weight [g]Root Fresh Weight [g]Root Fresh Weight/Aerial Part Fresh Weight [g]Aerial Part Dry Weight/Aerial Part Fresh Weight [g]
B. oleraceaNOBNo6.6 ± 0.71.5 ± 0.40.22 ± 0.030.36 ± 0.06
Yes60.9 ± 75 ± 10.09 ± 0.010.25 ± 0.04
CANo5.0 ± 0.51.4 ± 0.40.3 ± 0.10.23 ± 0.03
Yes28 ± 24 ± 10.14 ± 0.040.19 ± 0.03
L. sativaNOBNo15 ± 24 ± 10.24 ± 0.070.11 ± 0.01
Yes113 ± 1110 ± 30.09 ± 0.020.06 ± 0.01
CANo5.32 ± 0.061.5 ± 0.50.28 ± 0.070.14 ± 0.03
Yes37 ± 58 ± 30.20 ± 0.050.07 ± 0.01
Table 5. Morphometric parameters relating to Lactuca sativa and Brassica oleracea plants grown for 3 months under the investigated experimental conditions.
Vegetable SpeciesSoilAmendment (AM)Stem Diameter [mm]Leaves NumberLeaf Area [cm2]
B. oleraceaNOBNo2.2 ± 0.1 8 ± 124 ± 4
Yes6.3 ± 0.612 ± 1112 ± 9
CANo1.8 ± 0.2 6 ± 18 ± 1
Yes5 ± 112 ± 250 ± 10
L. sativaNOBNo7.21 ± 0.916 ± 224 ± 1
Yes14 ± 333 ± 286 ± 3
CANo6.8 ± 0.514 ± 114.1 ± 0.3
Yes10.9 ± 0.131 ± 257 ± 3

