Article

Response Characteristics of Cross Tunnel Lining under Dynamic Train Load

School of Civil Engineering, Central South University, Changsha 410075, China
*
Author to whom correspondence should be addressed.
Appl. Sci. 2020, 10(12), 4406; https://doi.org/10.3390/app10124406
Submission received: 29 May 2020 / Revised: 15 June 2020 / Accepted: 22 June 2020 / Published: 26 June 2020
(This article belongs to the Special Issue Dynamics of Building Structures)

Abstract

:

Featured Application

The results of this paper provides a reference for the future design of new cross tunnels and the operation safety evaluation and damage analysis of existing high-speed railway tunnels.

Abstract

The crossing area is a vulnerable component of the interchange high-speed railway tunnel because of the high-static stress level and the long-term dynamic train load in the operation period. Although attention has been paid to this problem, the response characteristics of high-speed railway tunnel lining at the cross position under the dynamic train load may still need further research as very little investigation is available on this issue at present. In this paper, the initial stress state and dynamic response characteristics of tunnel lining were studied using the three-dimensional finite element method. Furthermore, the damage evolutionary characteristics of the tunnel inverted arch under dynamic and initial static loads were researched using a set of self-developed indoor fatigue test devices. The size of the test box is 400 × 300 × 250 mm (length × width × height). Numerical simulation results indicate that the displacement and stress levels of tunnel lining are very high at the cross position. The stress increment of tunnel lining due to the dynamic train load is more likely to induce a break in the tunnel lining at this position. The indoor fatigue tests reveal that the change of structural strain increment amplitude and strain ratio is obvious when the dynamic load stress level is higher. It is better for dynamic stress levels not to exceed 0.6 times of structural tensile strength to avoid the tunnel lining being damaged in the long-time service period. The initial static load has an influence on the tunnel inverted arch, and the static stress level should be lower than 0.65 times of structural tensile strength to ensure the tunnel has long-time serviceability. This paper provides a reference for the future design of new cross tunnels and the operation safety evaluation and disease regulation of existing high-speed railway tunnels.

1. Introduction

With the construction of high-speed railways (HSRs) in China, it is inevitable to come across high-speed railway tunnels under- or over-passing road tunnels [1], railway tunnels [2], subway tunnels [3], or even another HSR tunnel. For example, the Gao Jiu Lu-Jia Hua Up-Down Cross Tunnel is a small, close distance cross tunnel project in Chongqing, with a minimum thickness of 0.9 m in the residual rock mass [4]. Another example is the Jinjiangshan Tunnel, which overpasses the existing Caomeigou Tunnel in Dandong city, Liaoning province, with a minimum distance of 16.5 m between these two tunnels.
For tridimensional cross tunnels, the internal force at the tunnel lining at the intersection is usually greater than that at other positions. It may be caused by the construction of a newly built tunnel nearby [5] or other factors. Through indoor tests, Kim et al. [6] found out that cross tunneling increases the initial stress, deformation, and bending moments of adjacent tunnel lining if the distance between the two tunnels is too small. For example, a significant bending moment increment of the existing tunnel lining may be induced by the construction of a new under-passing tunnel or even cause tensile cracks to the existing tunnel lining [7,8]. Through field measurements, the maximum additional stress induced by shield tunneling below on the existing tunnel lining was about 0.7 MPa [9], and the maximum settlement of the existing upper tunnel was about 4.7 mm [10]. Other investigations have also presented that the stress level of tunnel lining and surrounding rock in an intersection is generally higher than those at other positions [11,12].
During the long service period, the reciprocating vibration of trains is one of the key predisposing factors that cause tunnel failure. Deng et al. [13] found out that dynamic metro train loads may induce a significant dynamic response in the structure of tunnel lining and the soft foundation. Yi et al. [14] advocated that the dynamic train load above, indeed, has an influence on the metro line underneath through the analysis of numerical modeling and physical model experiment results. For HRS tunnels, the dynamic response of tunnel lining induced by trains would be more significant than that of tunnels for normal speed trains [15]. Bian et al. [16,17] advocated that the geometric parameters of trains have a great influence on the peak frequencies of the vibration response of track structures and that dynamic stresses of roadbed, subgrade, and subsoil are strongly dependent on train speed once the speed is higher than 150 km/h.
At present, many tunnels in China have different degrees of damage, such as fatigue damage of the tunnel inverted arch [18], lining cracks [19], soil-water inrush [20], and other damage. For these tunnels, the secondary disturbance of a newly built tunnel would cause an adverse impact on the existing tunnel lining. Additionally, the displacement and stress states of tunnel lining with primary defects would be much larger than those of tunnel lining without primary defects [21]. Though the success of the above references has been achieved, the influence of long-term dynamic load on tridimensional cross high-speed railway tunnels is still unclear because very little investigation has been made on this issue. Due to the higher initial stress of tridimensional cross tunnels, the long-term dynamic train load is likely to affect the durability and service performance of tunnel lining, and its influence should be taken into consideration in the design work of similar engineering cases.
The dynamic response of adjacent tunnels decreases as the distance between them becomes large and the train speed is low. However, further research is still needed on the extent of influence and characteristics of some parameters, like rock level (λ) [22], the way the train passes (κ), train speed (v), tunnel cross angle (θ), and rock thickness between the upper tunnel and the lower one (H), on dynamic response and long-time serviceability of tridimensional cross tunnel lining under train loads. Aiming to solve this question, numerical simulations and fatigue tests were carried out. When doing the research, the methods of numerical simulation were adopted to analyze the displacement and stress characteristics of high-speed railway tunnel lining under the action of strata loads and train loads. Based on the numerical results, the fatigue test was conducted to analyze the fatigue failure law of the tunnel inverted arch under different static loads and dynamic vibrations according to its mechanical characteristics because it is hard to obtain the cumulative damage characteristic by using the numerical simulation method. Finally, some conclusions were drawn based on the above research results.

2. Research Method

For tunnel lining, the stress state of the tunnel inverted arch is complex because it mainly bears three kinds of loads—the surrounding rock pressure, self-weight of track structure and filling layer (static load), and the dynamic train load transmitted by track structure, as shown in Figure 1. Surrounding rock pressure and self-weight of the structure are the basic loads acting on the tunnel inverted arch; when the train passes, the tunnel bottom structure bears the cyclic load of the train. Under the action of the vertical load, there will be a horizontal force at the arch foot. Therefore, the tunnel bottom structure is in a three-dimensional mechanical environment, which is affected by different vertical and horizontal stresses. As a result, the dynamic response of the cross tunnel inverted arch under strata and dynamic train loads should be paid more attention during research.

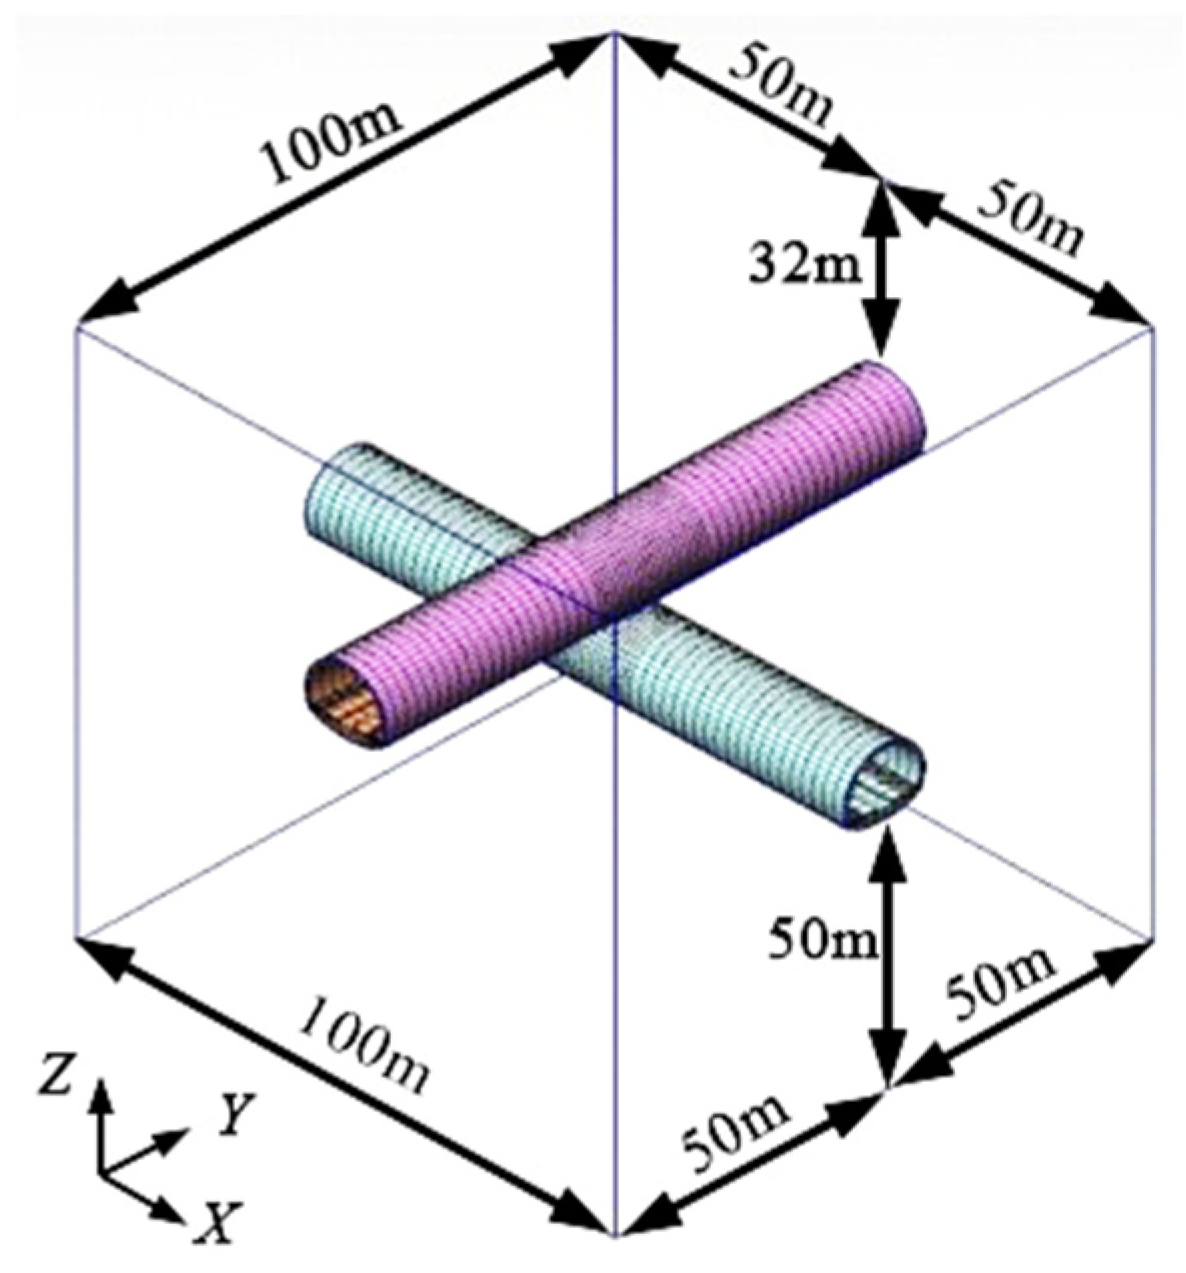
2.1. Numerical Model

2.1.1. Simulation Method

In this paper, a 3D tunnel-strata simulation model was established using MIDAS/GTS 12 [23,24,25]. In the numerical model, eight-node hexahedron elements are used to simulate the strata, primary support, secondary lining, track plate, concrete support layer, and inverted arch filling layer. The model of steel rails is not established, and the wheel-rail superposition coefficient and rail dispersion coefficient are used to reflect the influence of the wheel-rail force acting on the steel rail instead [26]. The reinforcement effect of the anchor rod on the surrounding rock is simulated by improving the mechanical parameters of surrounding rock in the anchor zone to avoid the influence of bolt setting on the efficiency of dynamic analysis. Material properties of strata are described by the elastoplastic model and the Mohr–Coulomb yield criterion; other parts are described by the elastic model.
To deal with the dynamic problems in this paper, the static and dynamic internal forces of the surrounding rock and tunnel lining were calculated separately under the action of dynamic and static loads, and the total internal stress and displacement of tunnel lining were obtained by superimposing those under the dynamic and static loads linearly. The influence of the 5 parameters was analyzed, which are rock level (λ), the way the train passes through the two tunnels (κ), train speed (v), tunnel cross angle (θ), and the rock thickness between the two tunnels (H). The total number of numerical models is 18, as is shown in Table 1.
Taking the intersection of upper and lower tunnels as the center, a distance of 50 m was selected from the center to the left, right, front and back boundaries, as is shown in Figure 2. The burial depth of the upper tunnel is 32 m, and the bottom boundary is 50 m, away from the tunnel inverted arch. To eliminate the wave reflection at left, right, front, back, and bottom boundaries, tridimensional viscoelastic artificial boundaries were adopted in this paper, and springs and damp elements were used to achieve this function. The normal and tangential damping ratios are 1.0 and 0.5, respectively. Analysis sections are selected with an interval of 10 m along the longitudinal direction of both the upper tunnel and the lower one, and measuring points are located at the tunnel vault, side wall, and tunnel inverted arch in each section.
The strata, tunnel lining, and track slab were considered as a continuously homogeneous medium. Table 2 shows the mechanical parameters of the strata used in the numerical models. The mechanical parameters of secondary lining, concrete foundation, filling layer, primary support, and track plate, in turn, refer to that of C35, C30, C25, C25, and C45 concrete, which are the concret strength level in Chinese code GB50010-2010 [27]. For example, concrete with strength grade C30 refers to the compressive strength of standard cubic specimen of concrete not less than 30MPa.

2.1.2. Dynamic Train Load

Two approaches are usually used to determine the dynamic train load in numerical simulations: the excitation force function and field measurements. Research indicates that it is feasible to simulate the high-speed train load with the excitation force function [28,29]. The following is the expression of the dynamic train load when doing this research [26]:
P ( t ) = k 1 k 2 ( P 0 + P 1 sin ω 1 t + P 2 sin ω 2 t + P 3 sin ω 3 t )
where k1 and k2 are the adjacent wheel–rail force superposition coefficient and dispersion coefficient, which are in the range of 1.2–1.7 and 0.6–0.9, respectively; P0 is the static vehicle load; P1, P2, and P3 are the vibration load. The mass of the train is set as M0. The following equation is used to calculate the amplitude of the vibration load:
P i = M 0 a i ω i 2
where ωi is the track irregularity rise; ωi = 2πv/Li, v is the speed of the high-speed train; and Li is the typical wavelength of the geometric irregularity curve; M0 is the mass under the lower spring. The value is 750 kg in this paper.
Referring to the Code [29], wave length and vector height under the three conditions of ride flatness, the additional load acting on railway and wave loss were L1 = 10 m, L1 = 2 m, L3 = 0.5 m, a1 = 3.5 mm, a2 = 0.4 mm, and a3 = 0.08 mm, respectively.

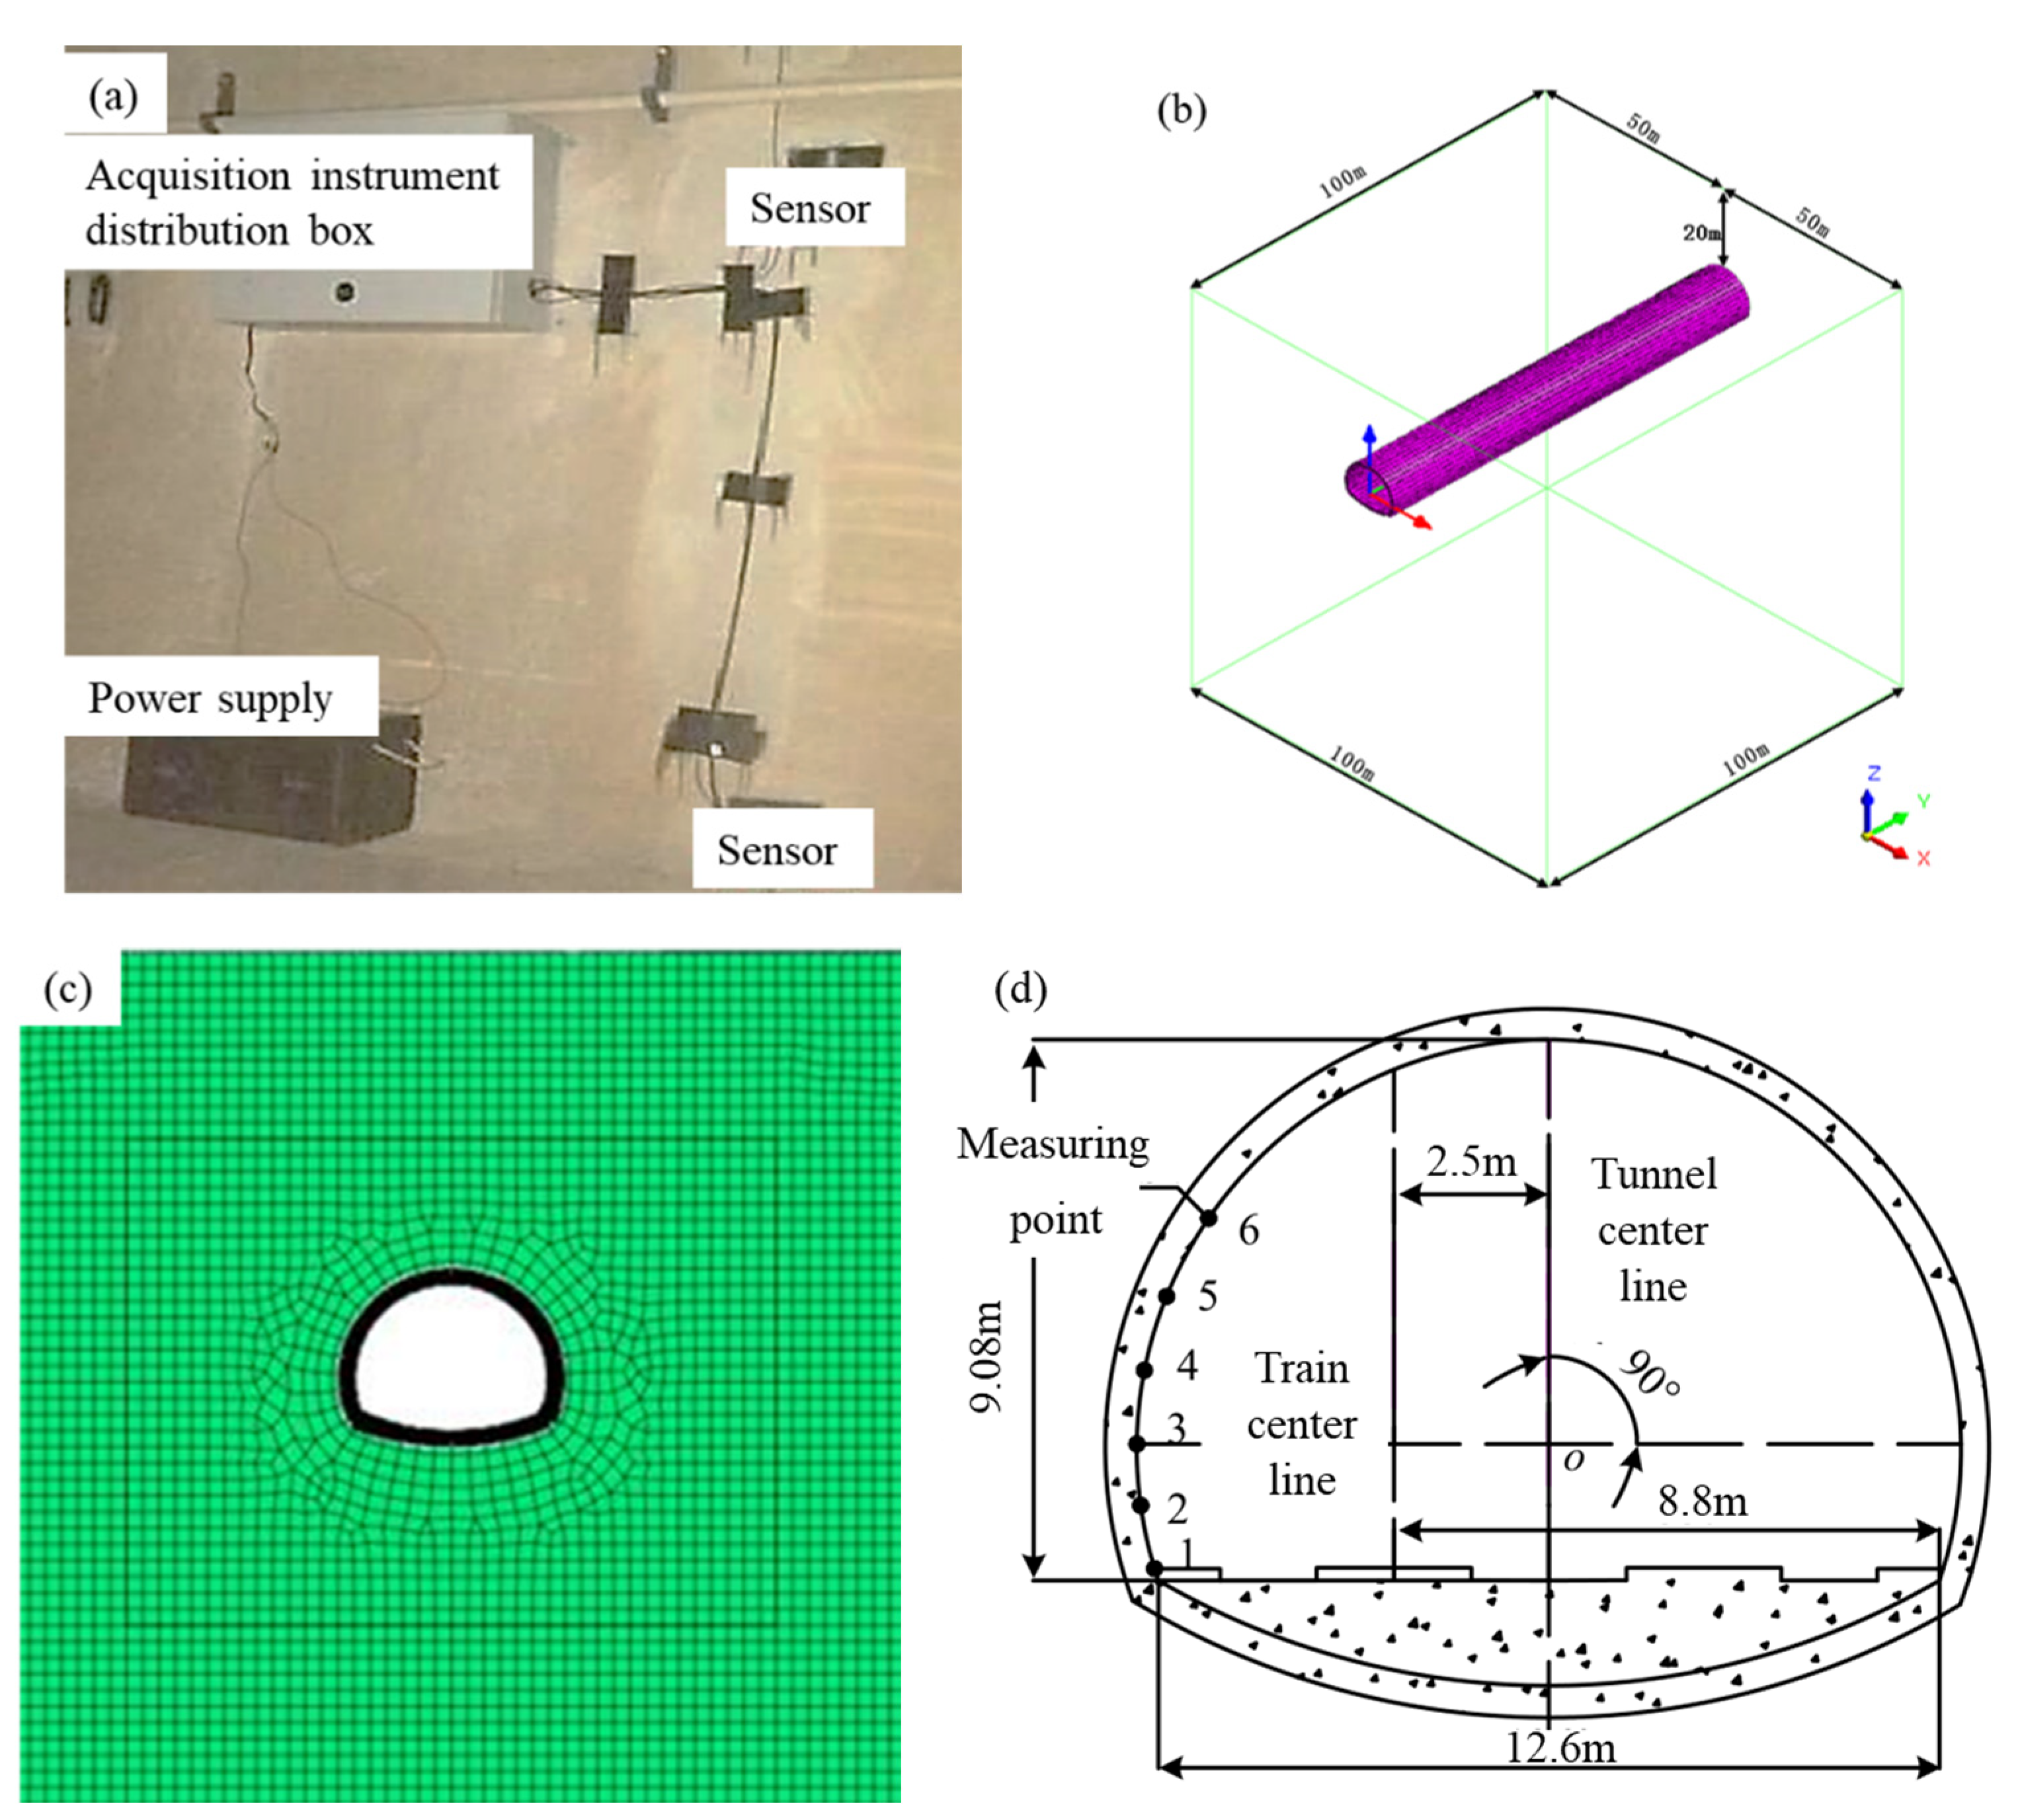
2.1.3. Validation of Numerical Results

The acceleration dynamic response value obtained by numerical simulation is compared with the field measured results, in order to verify the reliability of the numerical simulation method (material characteristics, train load, boundary conditions, etc.) adopted in the cross-tunnel. According to the reference [30], the test tunnel site is a double-line standard tunnel of China’s high-speed railway trunk lines. The internal height of the tunnel is 8.78 m in height and 12.6 m in width. CRTS II slab ballastless track is used. DASP-V10 engineering platform software was used for data acquisition. The acceleration sensor is INV9828. Two acceleration sensors are arranged at each measuring point to collect the transverse and vertical vibration acceleration of tunnel lining. Figure 3 is the comparison between field tests and corresponding numerical models.
The same finite element numerical model is established, according to the actual engineering geological conditions on site, as shown in Figure 3. Through on-site investigation, the parameters of the surrounding rock are basically the same as those of rock level V. The tunnel is about 20m deep. The numerical simulation method presented in this paper is adopted. For example, the surrounding rock adopts the elastoplastic model and Mohr-Coulomb yield criterion, the initial and the secondary support structure adopt the elastic model, the boundary is set as the three-dimensional viscoelastic artificial boundary, and the dynamic load of high-speed train is selected according to Equation (1). The train speed is 300Km/h. The comparison of vibration acceleration between numerical simulation and field measurement at each measuring point is shown in Figure 4.
According to the Figure 4, the numerical simulation results are basically consistent with the field measured values, with the maximum relative error of 15% and the same variation trend. It shows that the numerical simulation method adopted in this paper is highly reliability and can be applied to the study of the dynamic response of cross-tunnel.
The dynamic response value of tunnel lining structure subjected to train load, including displacement and tensile stress, obtained through the corresponding field and model tests, are shown in Table 3. As can be seen from the table, the displacement response of the inverted arch structure of the tunnel is 2.3–14 mm, and the maximum tensile stress is 0.14–0.31 MPa. In the numerical calculation results of this paper, the maximum displacement of the inverted arch is 1–6 mm, and the maximum tensile stress is 0.1–0.6 mpa. The results show that the numerical calculation results are close to the field measurements and model test results, and the dynamic response of the cross tunnel is within a reasonable range.

2.2. Cumulative Damage Tests
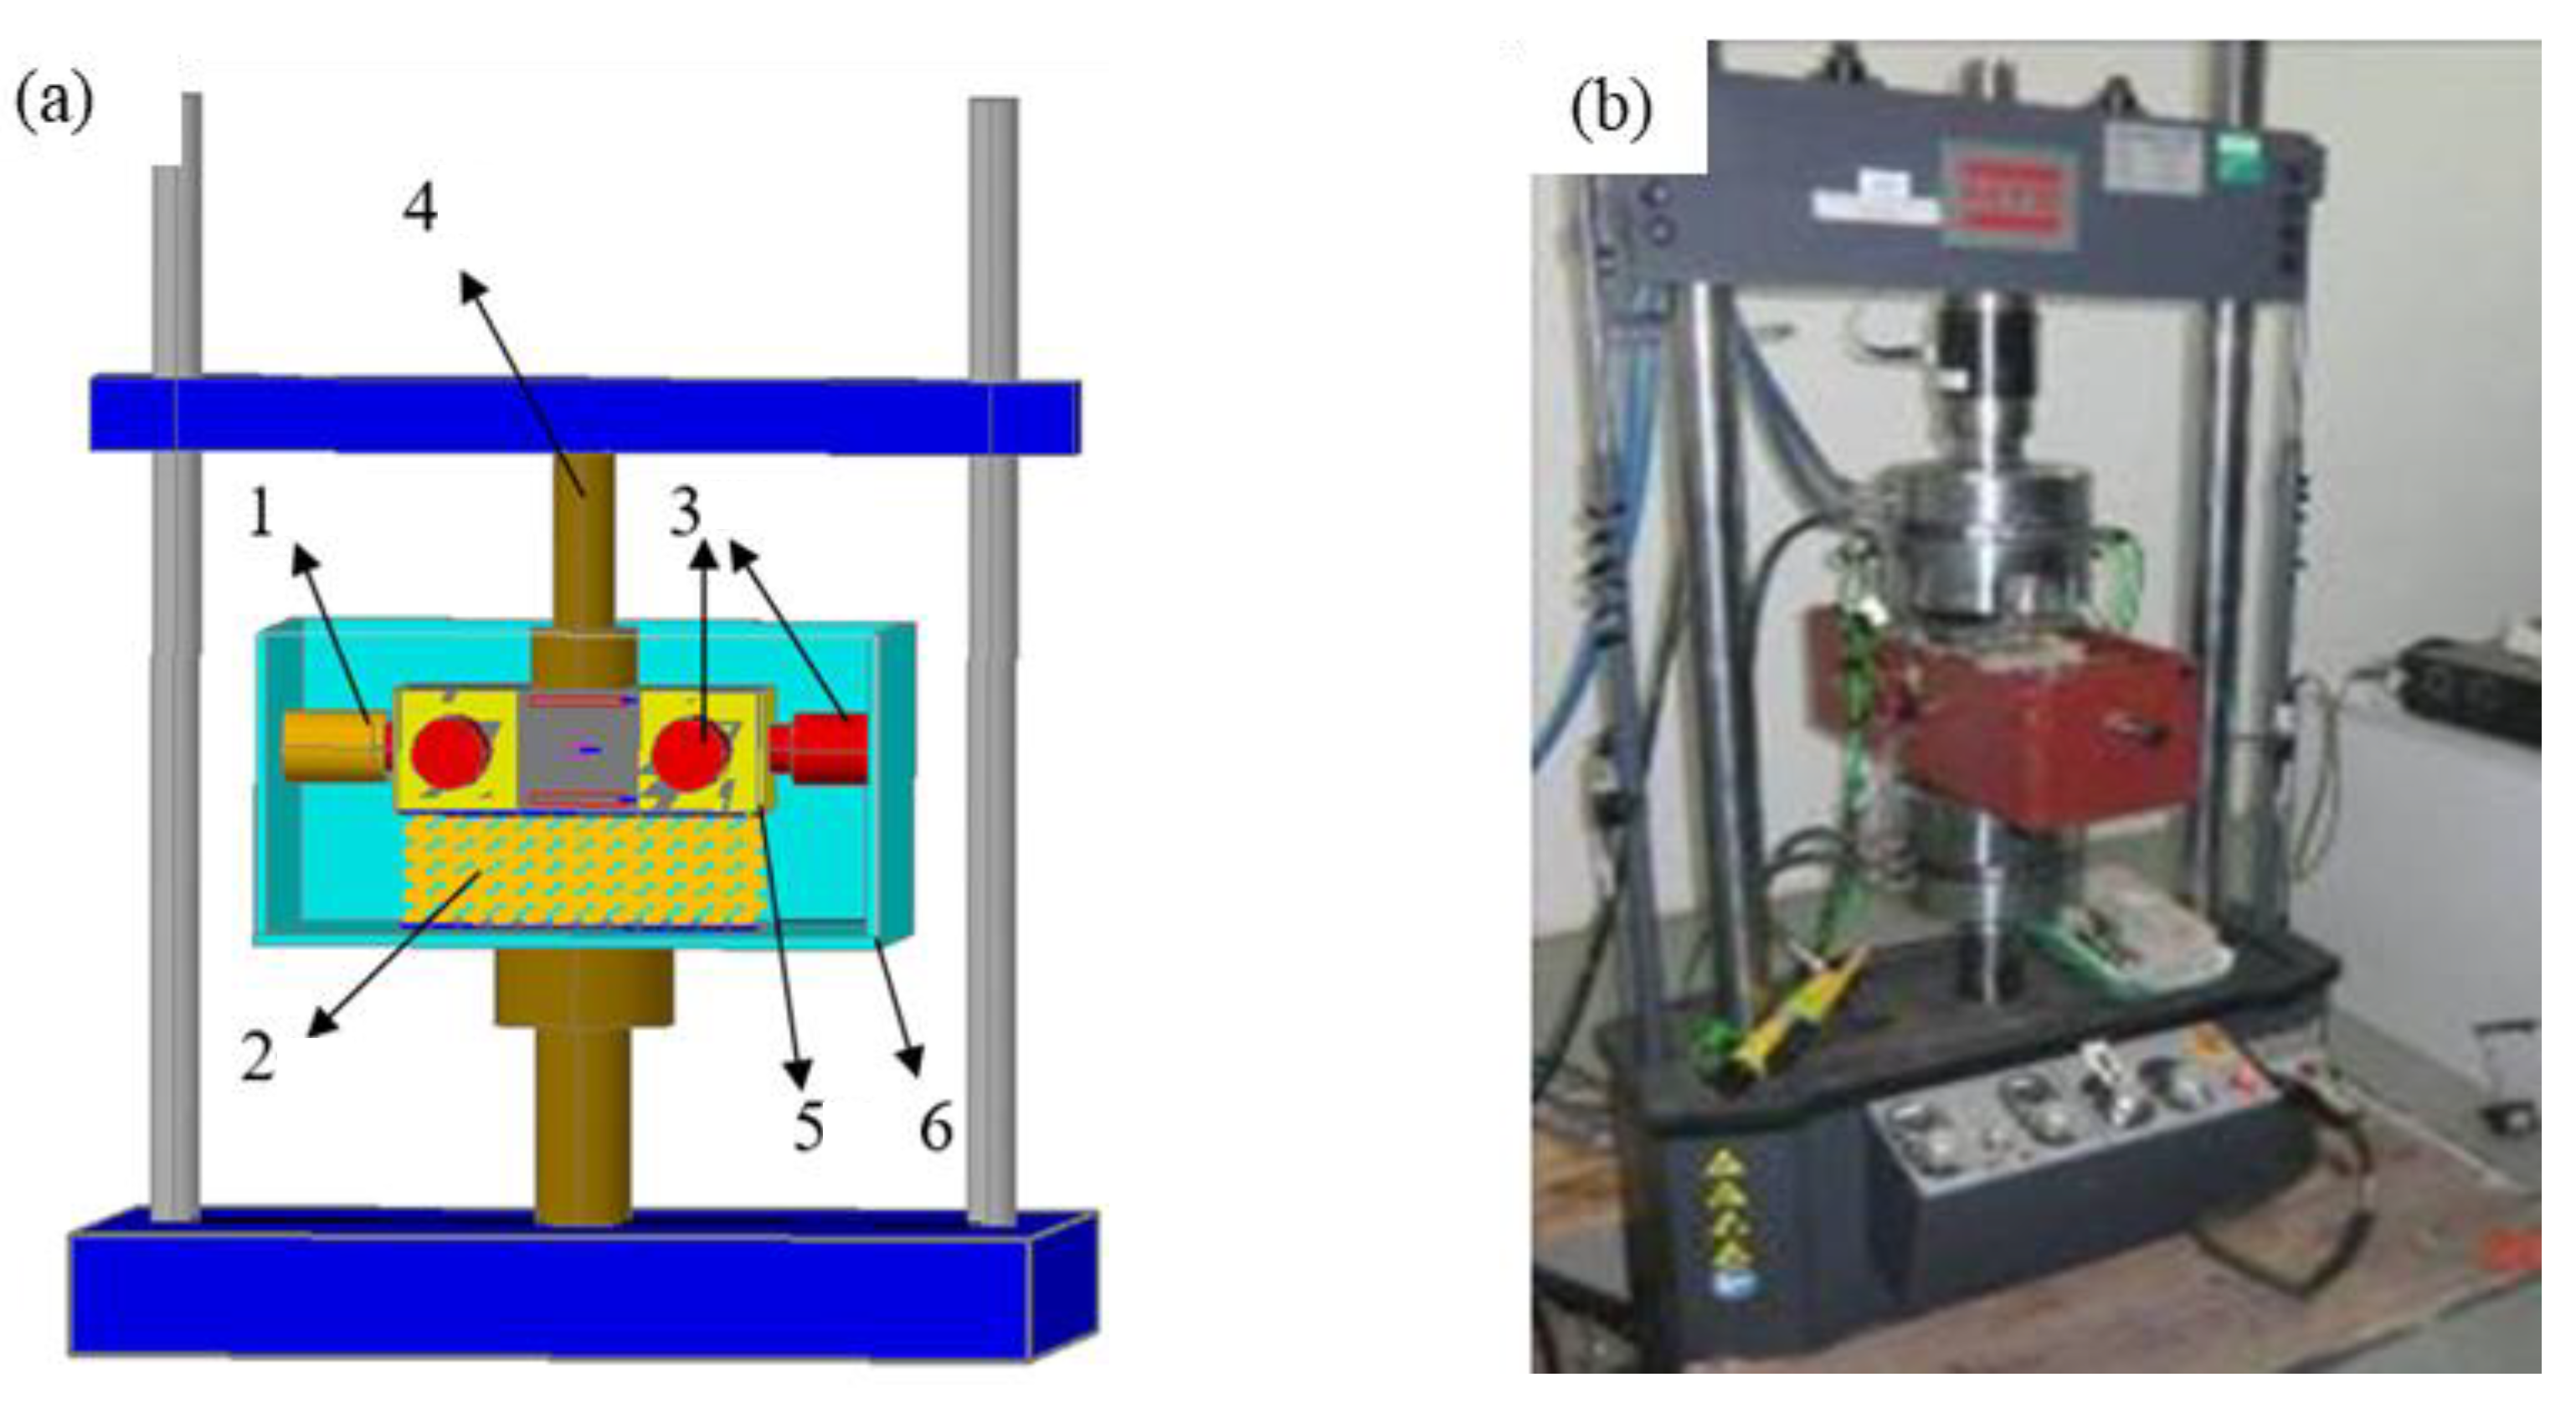
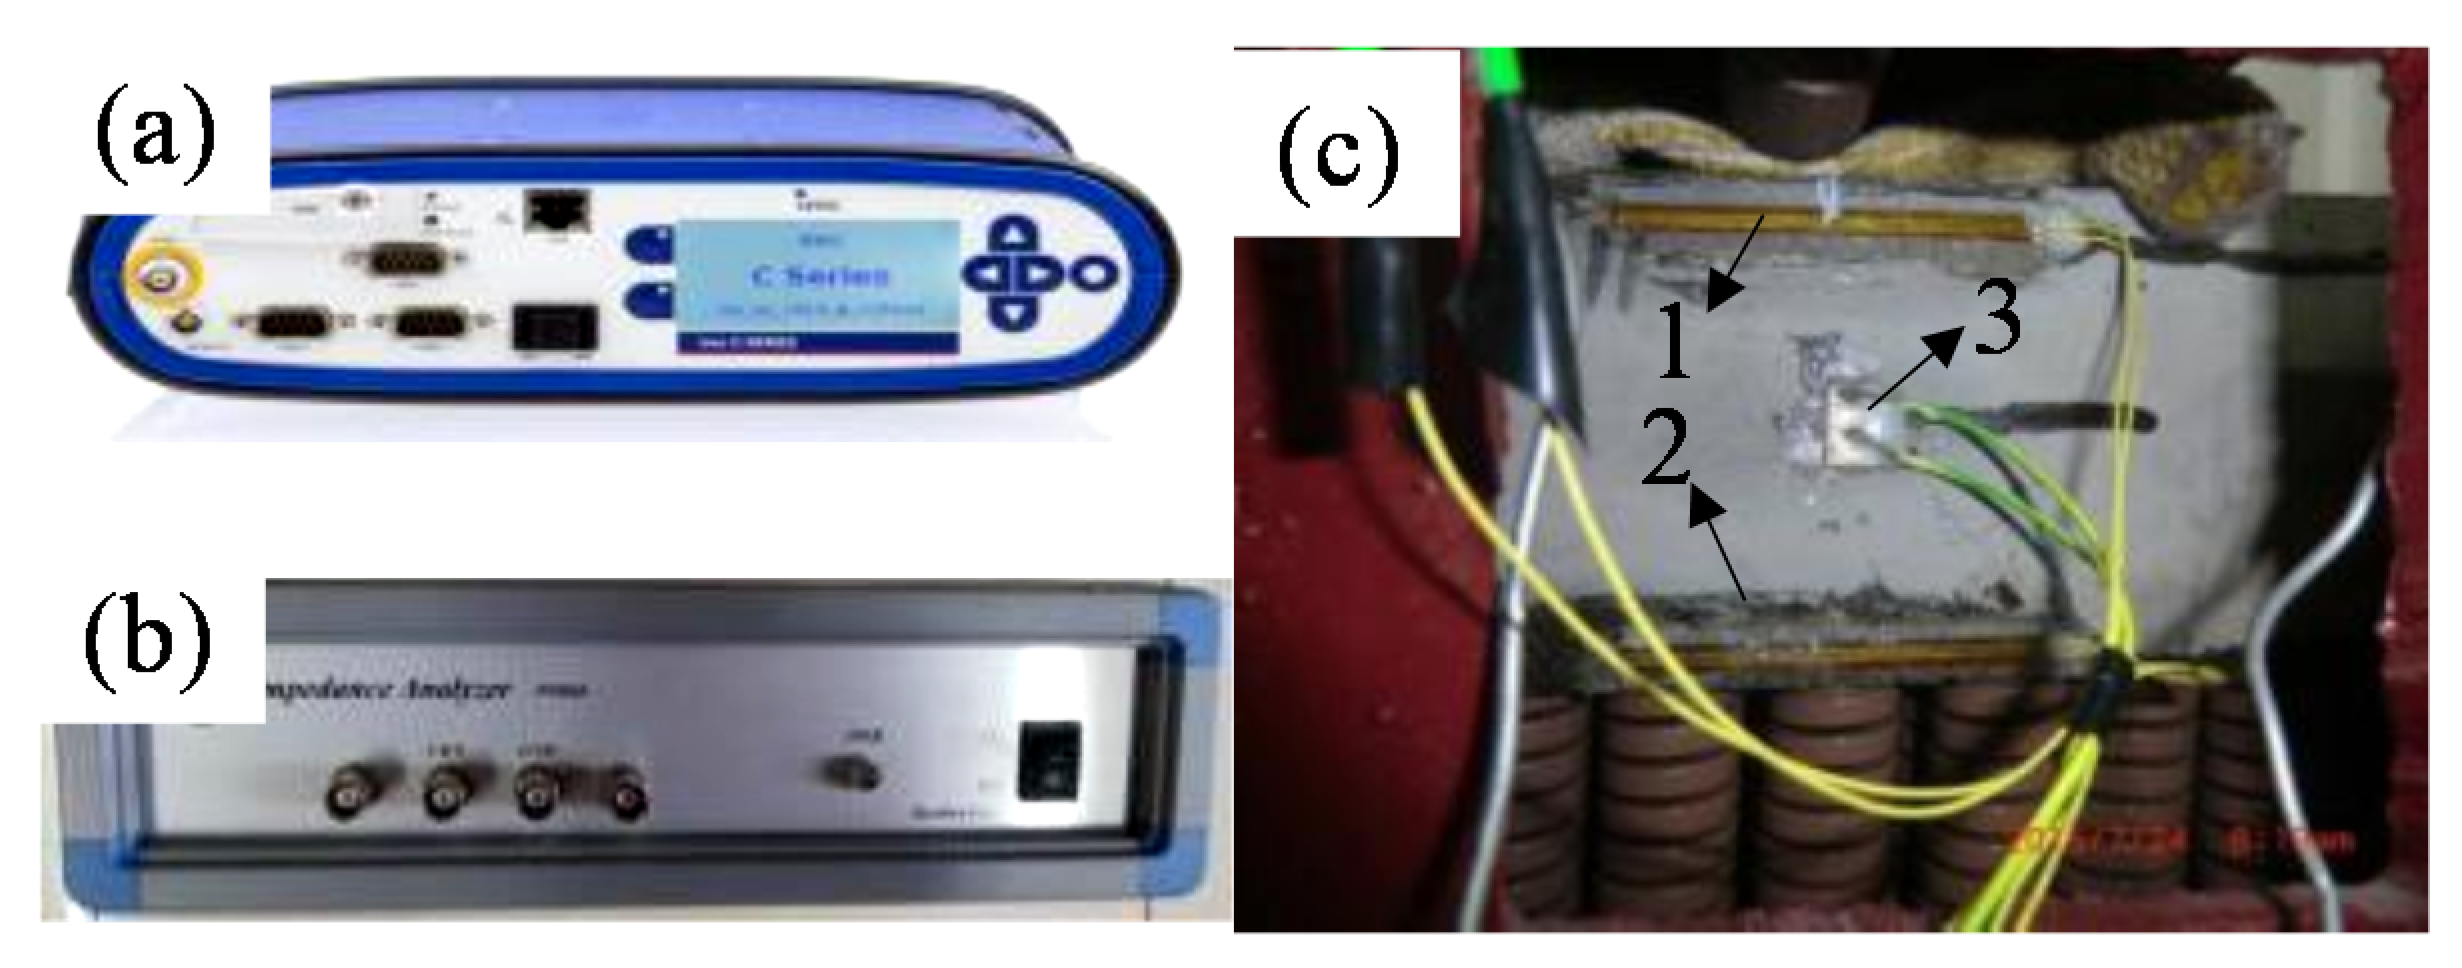
A self-developed loading device that simulates the special mechanical environment of a tunnel inverted arch was developed to research the cumulative damage mechanism of tunnel structures under different conditions.

2.2.1. Test System

The self-developed test system is composed of a lateral hydraulic loading system, lateral springs, a vertical MST loading system, and vertical springs. The size of the test box is 400 × 300 × 250 mm (length × width × height), as shown in Figure 5.
The lateral digital jack and springs were used to simulate the actual stress state of the tunnel inverted arch. The springs with different stiffness coefficients were used to simulate the bedrock with different elastic coefficients. In addition, the springs absorb the vibration reflection wave and reduce its reflection at the boundaries. A contact steel plate was used to reduce the local failure possibility of specimens that is caused by stress concentration. A lubricant was applied between the steel plate and the specimen to reduce the size effect in the small-scale test system.
On the basis of the stiffness similarity principle, the spring can provide equal elastic resistance when the same amount of deformation occurs as the bedrock ( δ i = δ 0 ). According to the elastic resistance of the surrounding rock at any point and its radial change, it can be obtained as follows:
k δ i a b = k 0 δ 0 m
where, δ i is the compressive deformation of surrounding rock at a certain action point; k is the elasticity resistance coefficient; a is the length at the bottom of the specimen; b is the width at the bottom of the specimen; δ 0 is the compression deformation of the spring; k 0 is the rigidity of the mold spring at the bottom of the specimen; m is the number of die springs at the bottom of the specimen.
Three kinds of spring stiffness were used in the experiment. Through test calibration, the spring stiffness is 2.157 × 10⁶, 0.669 × 10⁶, and 0.361 × 10⁶ N/m, respectively. The corresponding elastic resistance coefficients of surrounding rocks were obtained by using Equation (3), which are 1.941 × 10⁹, 0.602 × 10⁹, and 0.325 × 10⁹ N/m3.
The data collection system mainly composes of a strain gauge, ceramic piezoelectricity, strain collection instruments, an impedance analyzer, and other relevant software. Figure 6 and Table 4 show the data collection instruments, the layout of monitoring points, and the relevant parameters of the instruments.

2.2.2. Sample Preparation and Mechanical Parameters

The concrete strength level chosen for the specimens was C35, and Table 5 shows the mix proportion of them. The fabrication and curing of specimens were carried out in accordance with relevant code [36].
There are two kinds of mechanical parameters of the specimens, according to the static and dynamic states. The specimens were made up of two standard sizes to obtain the static and dynamic parameters, respectively. The static parameter test was mainly to obtain the compressive strength and relevant mechanical parameters, like the elastic modulus and the Poisson ratio. The size of this kind of specimen was chosen to be 100 × 100 × 100 mm. The dynamic parameter test was to obtain static mechanical parameters of the structure and its relevant dynamic mechanical parameters, like the dynamic elastic modulus and shear modulus of elasticity. The size of this kind of specimen is 100 × 100 × 300 mm. The dynamic test was carried out by using ETM (Emodumeter-TM). The test results of the mechanical parameters of the specimens are shown in Table 6.
During the loading process, the lateral static force was first applied using the lateral hydraulic jack, and then the constant static load was applied using the MTS to simulate the weight of the structures themselves, and, finally, cyclic loading was applied to simulate the vibration load of trains.

2.2.3. Test Cases

(1)
Cumulative load
The dynamic stress acting on the tunnel inverted arch is difficult to express with a simple mathematical formula due to the complex influence factors such as train axle load, running speed of trains, track irregularity, tunnel inverted arch condition, and other factors. An empirical mathematical formula was put forward by the China Academy of Railway Sciences based on field test data and theoretical calculations [37]:
σ d = 0.26 P × ( 1 ± 0.004 V )
where σd is the designed dynamic stress of the subgrade, kPa; P is the net axle weight, kN; V is the train speed, km/h.
Considering the increase of local stress in the inverted arch due to poor surrounding rock conditions or structural defects at the tunnel bottom, the dynamic amplitudes were chosen to be 1.6, 2.4, 3.6, and 4.5 kN, and its corresponding stress levels were 0.6, 0.7, 0.75, and 0.85 times of structural tensile strength. In these cases, the lateral load is 1.5 kN, the vertical static load is 2.4 kN, and the loading frequency is 12 HZ.
(2)
Initial static load
The vertical static load is a main influential factor that may cause primary damage to the tunnel inverted arch, which is composed of the initial stress of the basement and the gravity of structures under the railway. To explore the influence of the initial static load on the fatigue life of the tunnel inverted arch, a group of tests was carried out to obtain the cumulative damage behaviors of specimens from intact state to broken state under different load conditions, including the ultimate load.
The static load values were chosen to be 25, 27, 29, and 31 kN, and its corresponding stress levels were 0.65, 0.70, 0.75, and 0.80 times of structural tensile strength. In these cases, the lateral load is 1.5 kN, the amplitude of the dynamic load is 2.4 kN, and the loading frequency is 12 HZ.

3. Results Analysis

Figure 7 and Figure 8 show the initial stress and displacement distribution of the tunnel lining. It can be found from these figures that the displacement and stress levels of tunnel lining are significant at the cross position. Extracting the displacement and stress of the upper and lower tunnels at the tunnel vault, side wall, and inverted arch, it can be found out that the maximum vertical displacements of the upper tunnel in the cross-section are –4.91, –4.55, and –0.36 mm, respectively; those of the lower tunnel are –0.43, –0.15, and 3.87 mm; the maximum tensile stress values, σ1, of the upper tunnel are 142.0, –54.8, and 95.6 kPa, and those of the lower tunnel at these positions are –62.8, –83.6, and 9.4 kPa, respectively; the maximum compressive stress values, σ3, of the upper tunnel are –2013.0, –2590.2, and –641.9 kPa, respectively, and those of the lower tunnel are –2649.4, –2948.4, and –847.5 kPa.

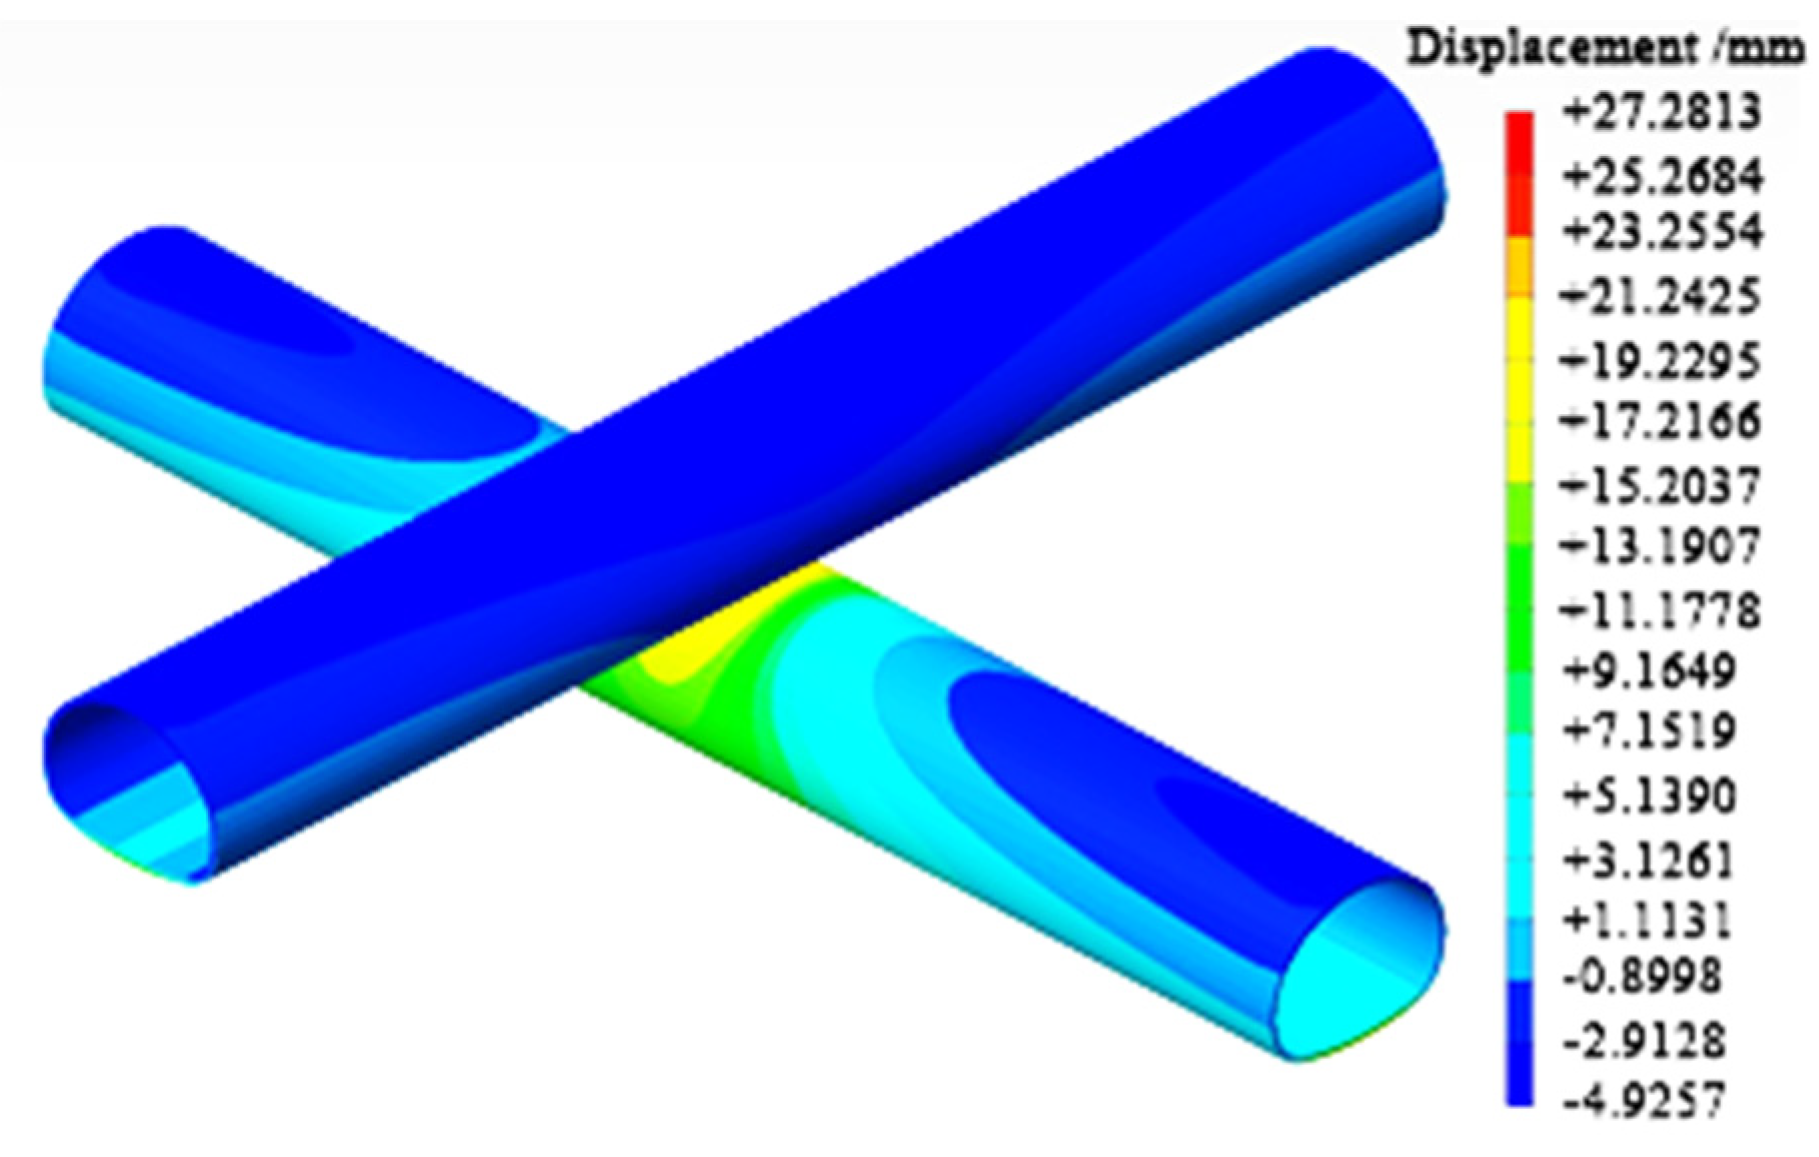
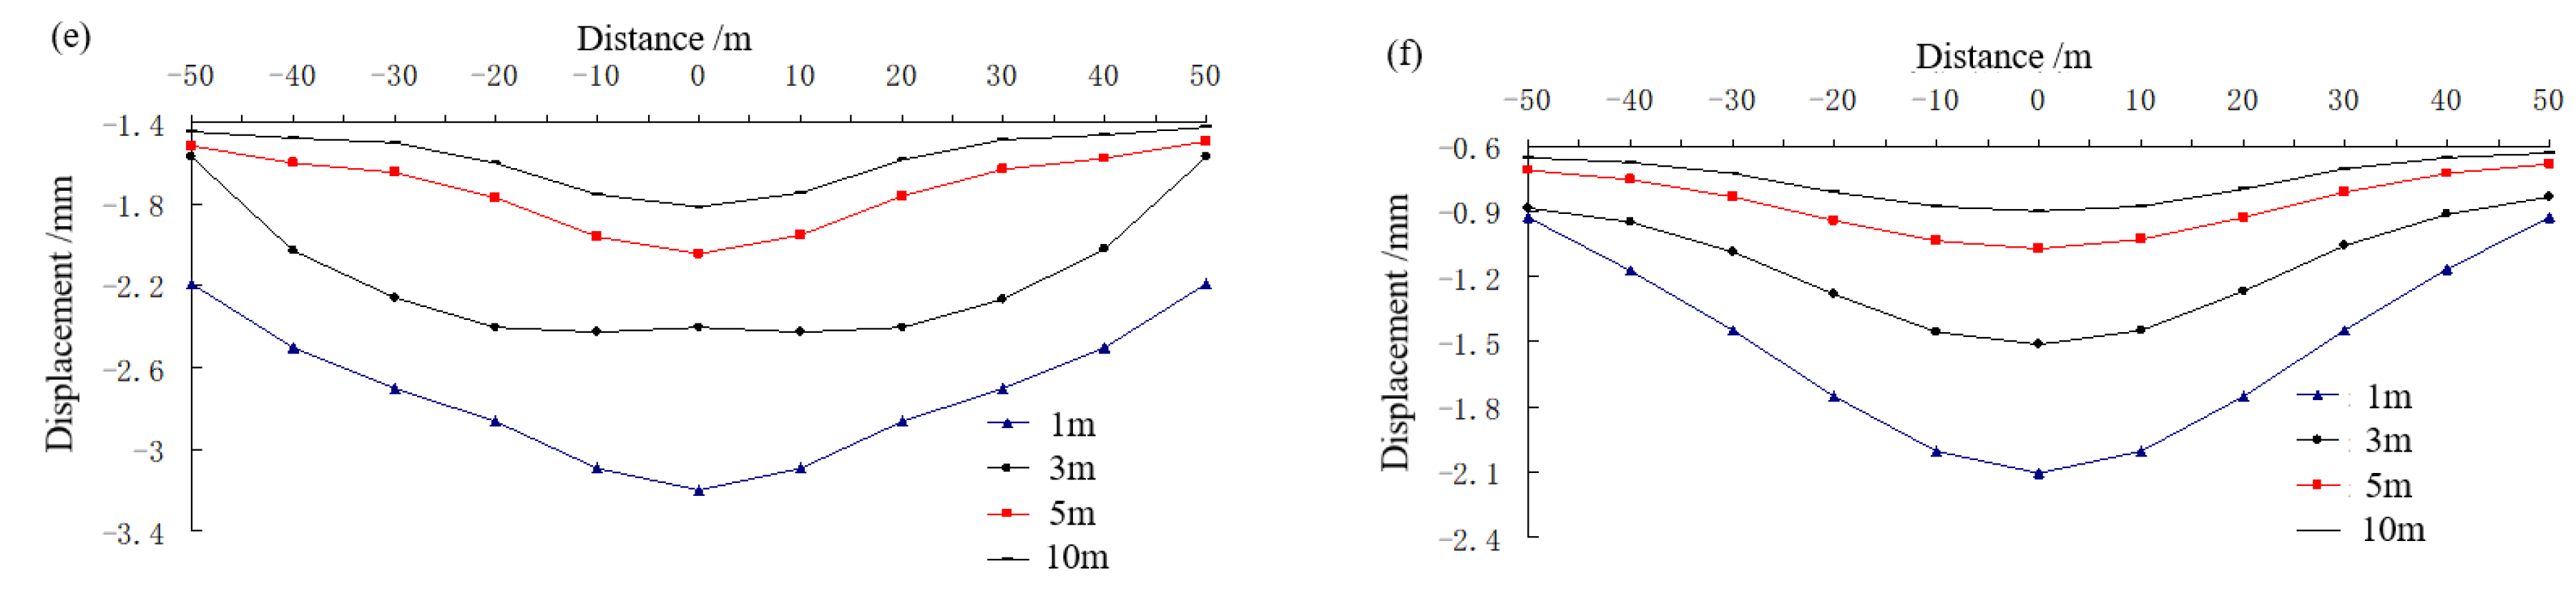
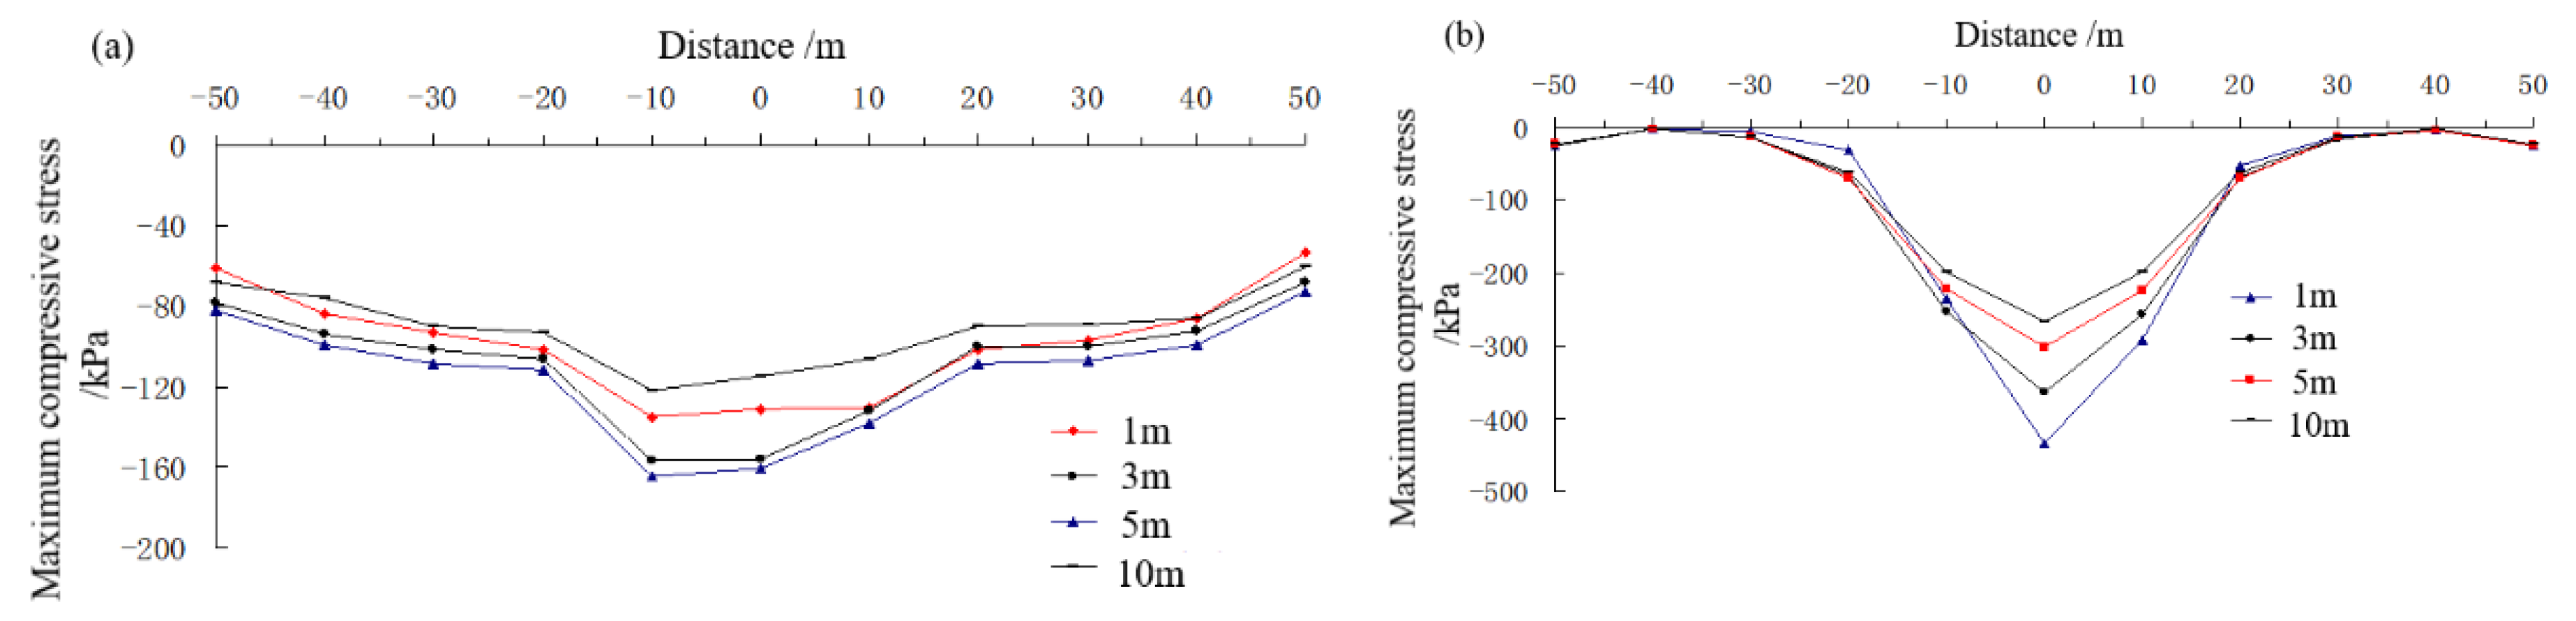
3.1. Dynamic Response of Tunnel Lining

Figure 9, Figure 10 and Figure 11 show the maximum vertical displacement, tensile stress, and compressive stress distributions of tunnel lining at each group of measuring points on the 15th working condition. Numerical simulation results under other conditions are not displayed in this paper.
The results show out that displacement of both the upper and lower tunnels increases significantly due to the action of train loads, the displacement response of these two tunnels decreases as the rock thickness increases, and the dynamic response becomes unfavorable for the tunnel lining at the tridimensional cross region as the rock thickness decreases. For example, the maximum displacement increment of the upper tunnel vault is −2.28, −1.76, −1.54, and −1.46 mm when rock thickness values are 1, 3, 5, and 10 m, respectively. The displacement at the interaction is also larger than that at other places in the longitudinal direction for both tunnels. When the rock thickness is larger than 3 m, the displacement increment of tunnel lining becomes relatively small about 20 m away from the intersection, which is approximately 1.5 times the tunnel width. However, the influence zone would be significantly increased to 50 m away from the intersection if the rock thickness between the two tunnels is 1 m.
The most affected positions are different for the upper tunnel and the lower one under the action of dynamic train loads. The maximum displacement of the upper tunnel locates at the inverted arch, followed by the side wall and tunnel vault, while for the lower tunnel, the location order by degree of affected extent is the opposite—the maximum displacement of the lower tunnel locates at the arch, followed by the side wall and inverted arch.
Similarly, the stress response of the two tunnels also indicates that thinner thickness of the rock column between the upper tunnel and the lower one is not good for the safety of the tunnel lining. For example, the maximum values of the lower tunnel inverted arch were 619.63, 580.96, 430.74, and 287.27 kPa when the thickness of rock was 1, 3, 5, and 10 m, respectively. It is worth noting that the maximum vertical displacement, tensile stress, and compressive stress of the lining are all at the tunnel intersection, whether the upper tunnel or the lower tunnel. It also shows that the farther the distance from the tunnel intersection, the smaller the corresponding dynamic index. It shows that the dynamic response of the tunnel intersection is the strongest and the weakest link of the three-dimensional intersection tunnel as shown in Table 7.
The maximum tensile stress increment of the tunnel lining under different working conditions are shown in Table 7. It can be found out that the dynamic response of the adjacent tunnel is more significant when the surrounding rock condition is worse, the train speed is higher, or the intersection angle is smaller. Among the three conditions of a train passing through the cross tunnels, the dynamic response of the lining structure is the largest when two trains pass through the upper and the lower tunnels at the same time, which is about 0.789 MPa.
Regardless of the mutual influence of each parameter, an equation is obtained by considering the rock level (λ), the way a train passes through the two tunnels (κ), train speed (v), tunnel cross angle (θ), and rock thickness between the upper tunnel and the lower one (H), as shown in Equation (5):
σ ( λ ,   κ ,   ν ,   θ ,   H ) = λ κ ( 1.15 × 10 1 e ν 150.7035 0.1754 ) ( 1.0528 e H 23.313 0.0152 )   ( 2.6247 × 10 3 e θ 21.3271 + 0.8208 ) × σ t
where λ is 0.7, 0.79, and 1.0 when the surrounding rock level is III, IV, and V, respectively; κ is 1.0, 0.75, and 1.54 in accordance with trains passing through the upper tunnel, the lower tunnel, and both tunnels simultaneously; σt is the tensile stress increment in the third working condition, σt = 0.513 MPa.
In conclusion, the stress level of the tridimensional cross tunnel lining at the cross position is generally higher than that at other positions, and the significant stress increment due to the dynamic train load would increase the stress levels of the tunnel lining, which is more likely to cause adverse impacts to tunnels at this position. Some countermeasures, like ensuring the height of the rock column between the upper tunnel and the lower one is greater than 3 m, improving the strength of the rock column, and avoiding the condition of two trains passing through the cross position at the same time, should be introduced to avoid damage of the tunnel lining at the cross position.

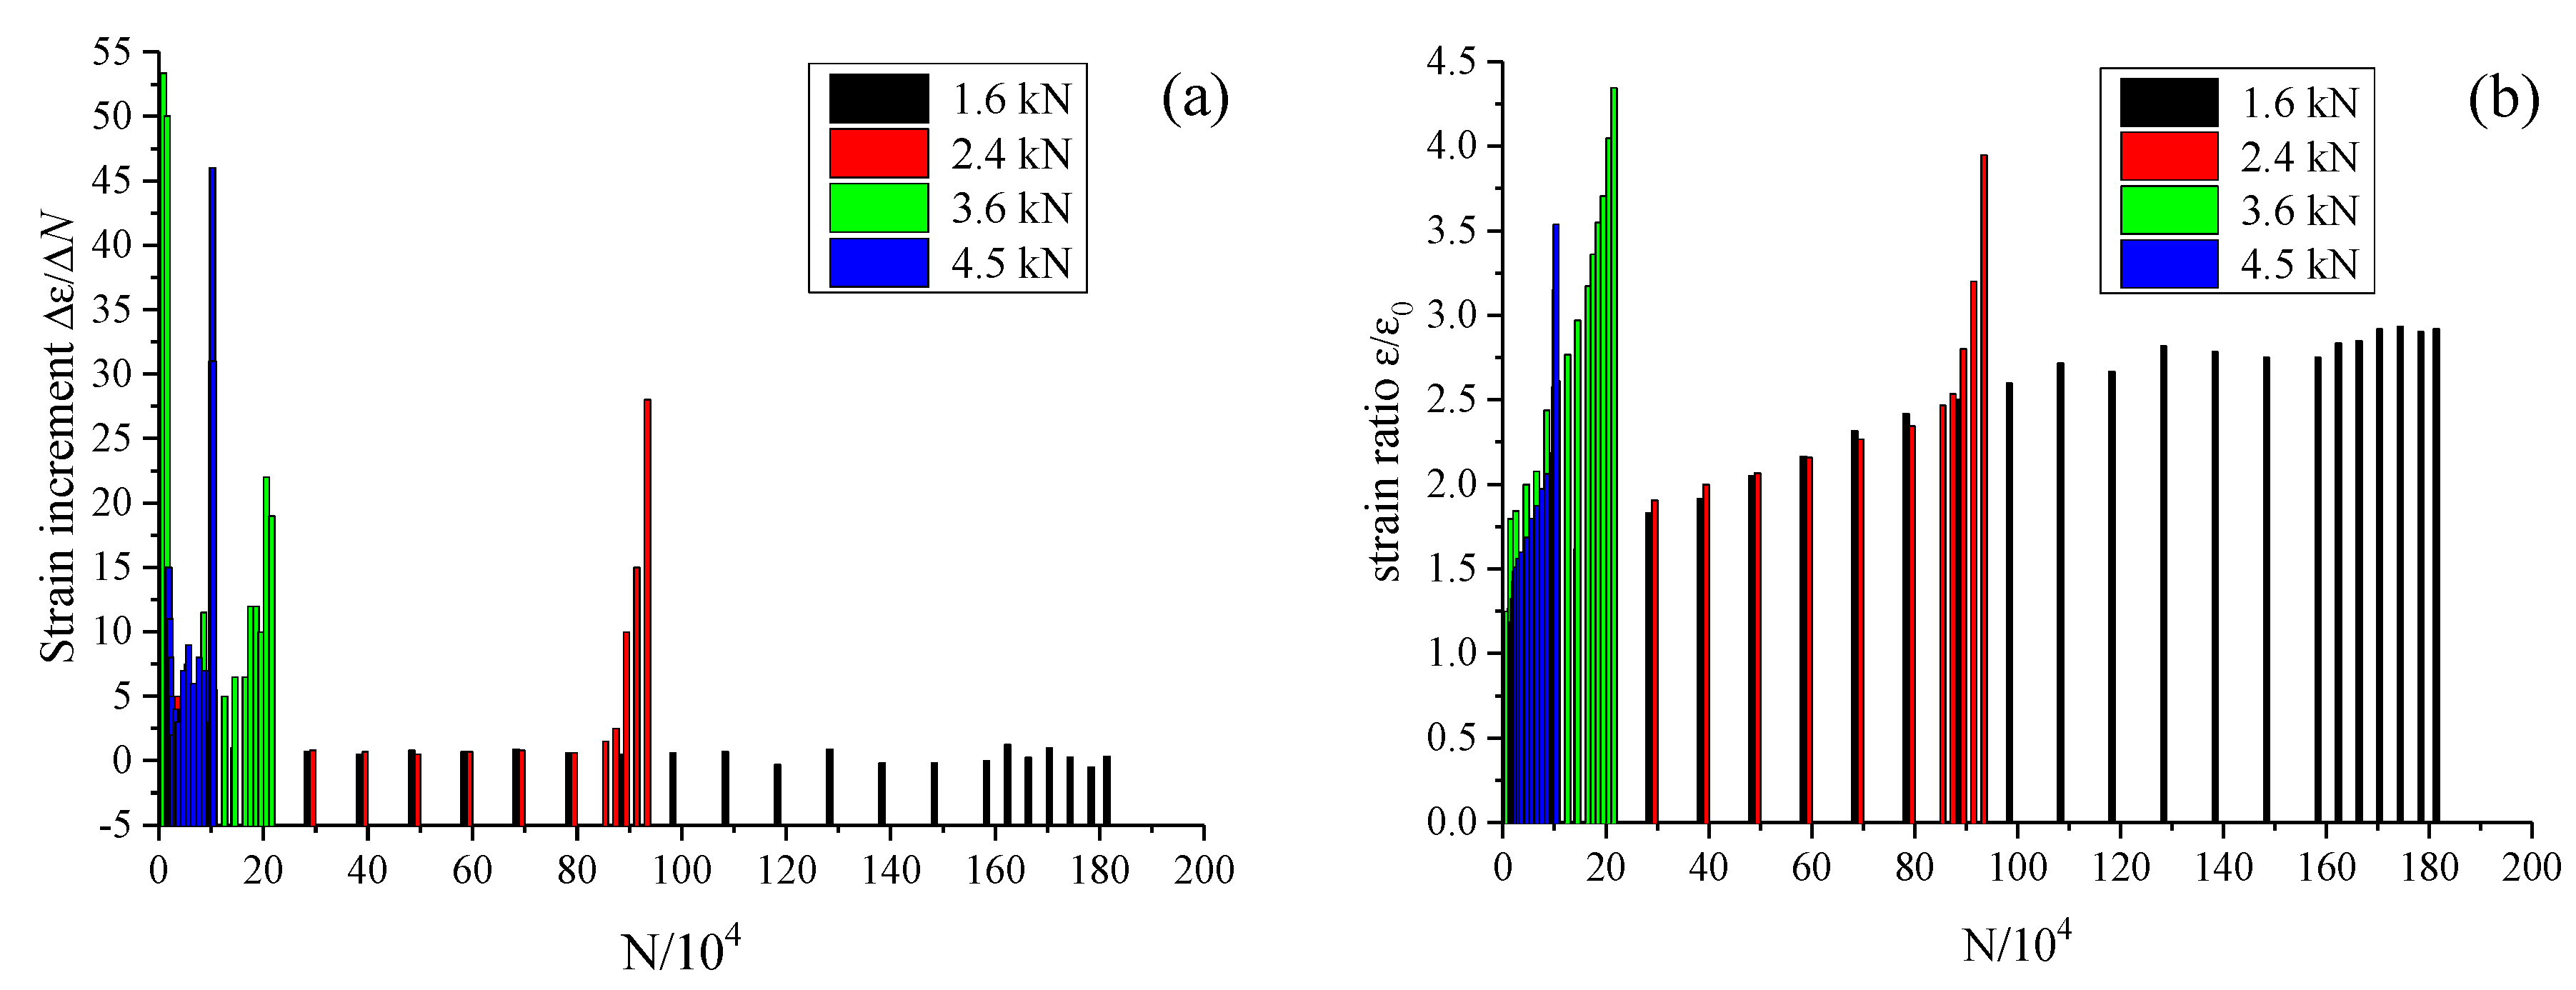
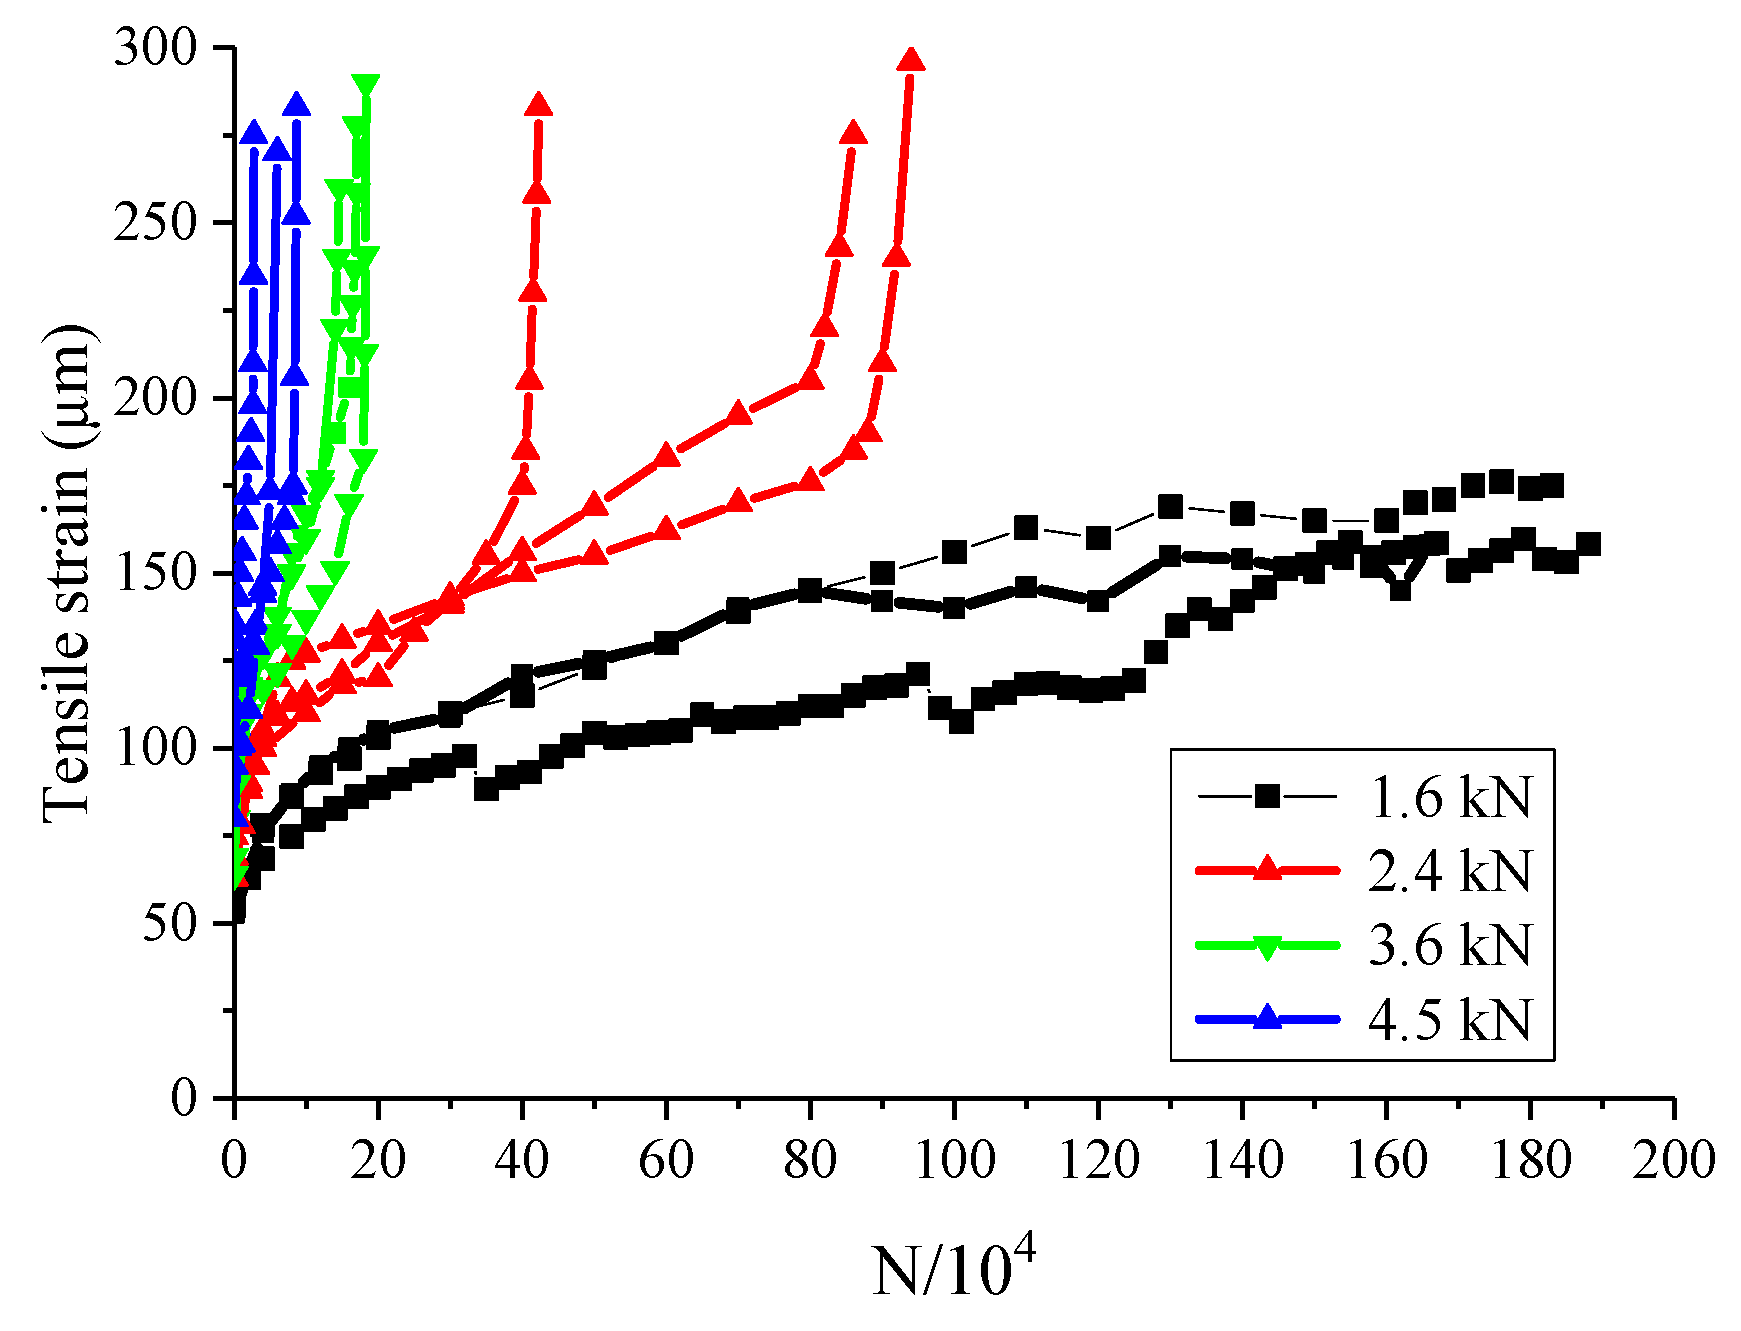
3.2. Cumulative Damage Characteristic Under Dynamic Load

Figure 12 shows the strain evolutionary characteristics of the inverted arch under different working conditions obtained by indoor tests. From this figure, we found out that the higher the stress level of dynamic load, the more obvious the change of strain increment amplitudes and strain ratios, which indicates that the tunnel lining would be more easily damaged under the higher stress level of dynamic train loads.
When the dynamic load is 1.6 kN, the specimens still remain intact although the load cycle number reaches 2 million times, and the increments of strain amplitude, Δε/ΔN, and strain ratio, ε/ε0, are stable after their growth in the early loading period. For the conditions of a dynamic load greater than 1.6 kN, the strain amplitude increment and strain ratio of specimens suffer from three stages during the dynamic loading process—the gradually increasing stage in the early loading period, the stable stage in the middle period, and finally, the breaking stage in the final period. We found that the high-stress level of a dynamic load is not good for the long-term service of the tunnel lining as shown in Figure 13.
The relationship curves between tensile strain, ε, and cycling times of dynamic load, N, are extracted to study the entire process of strain development under cyclic loads, as shown in Figure 13. From this figure, we find that when the stress level is less than 0.6, the failure will not occur in the strain development stage. On the contrary, if the stress level is greater than 0.6, the failure will occur within 1 million dynamic load cycles. Figure 14 shows the S-N fatigue life curve.
According to Xiao et al. [38], the fatigue life of the tunnel inverted arch is about 10 times that of the three-point bending. The S-N fatigue life curve was drawn, as shown in Figure 14, and the following is the linear fitting equation:
S = 0.136 lg N + 0.937 , ( r = 0.875 ) ,
where r is the correlation coefficient.
From the perspective of the long-term service of the tunnel, the dynamic stress level of the tunnel inverted arch should not be higher than 0.6.

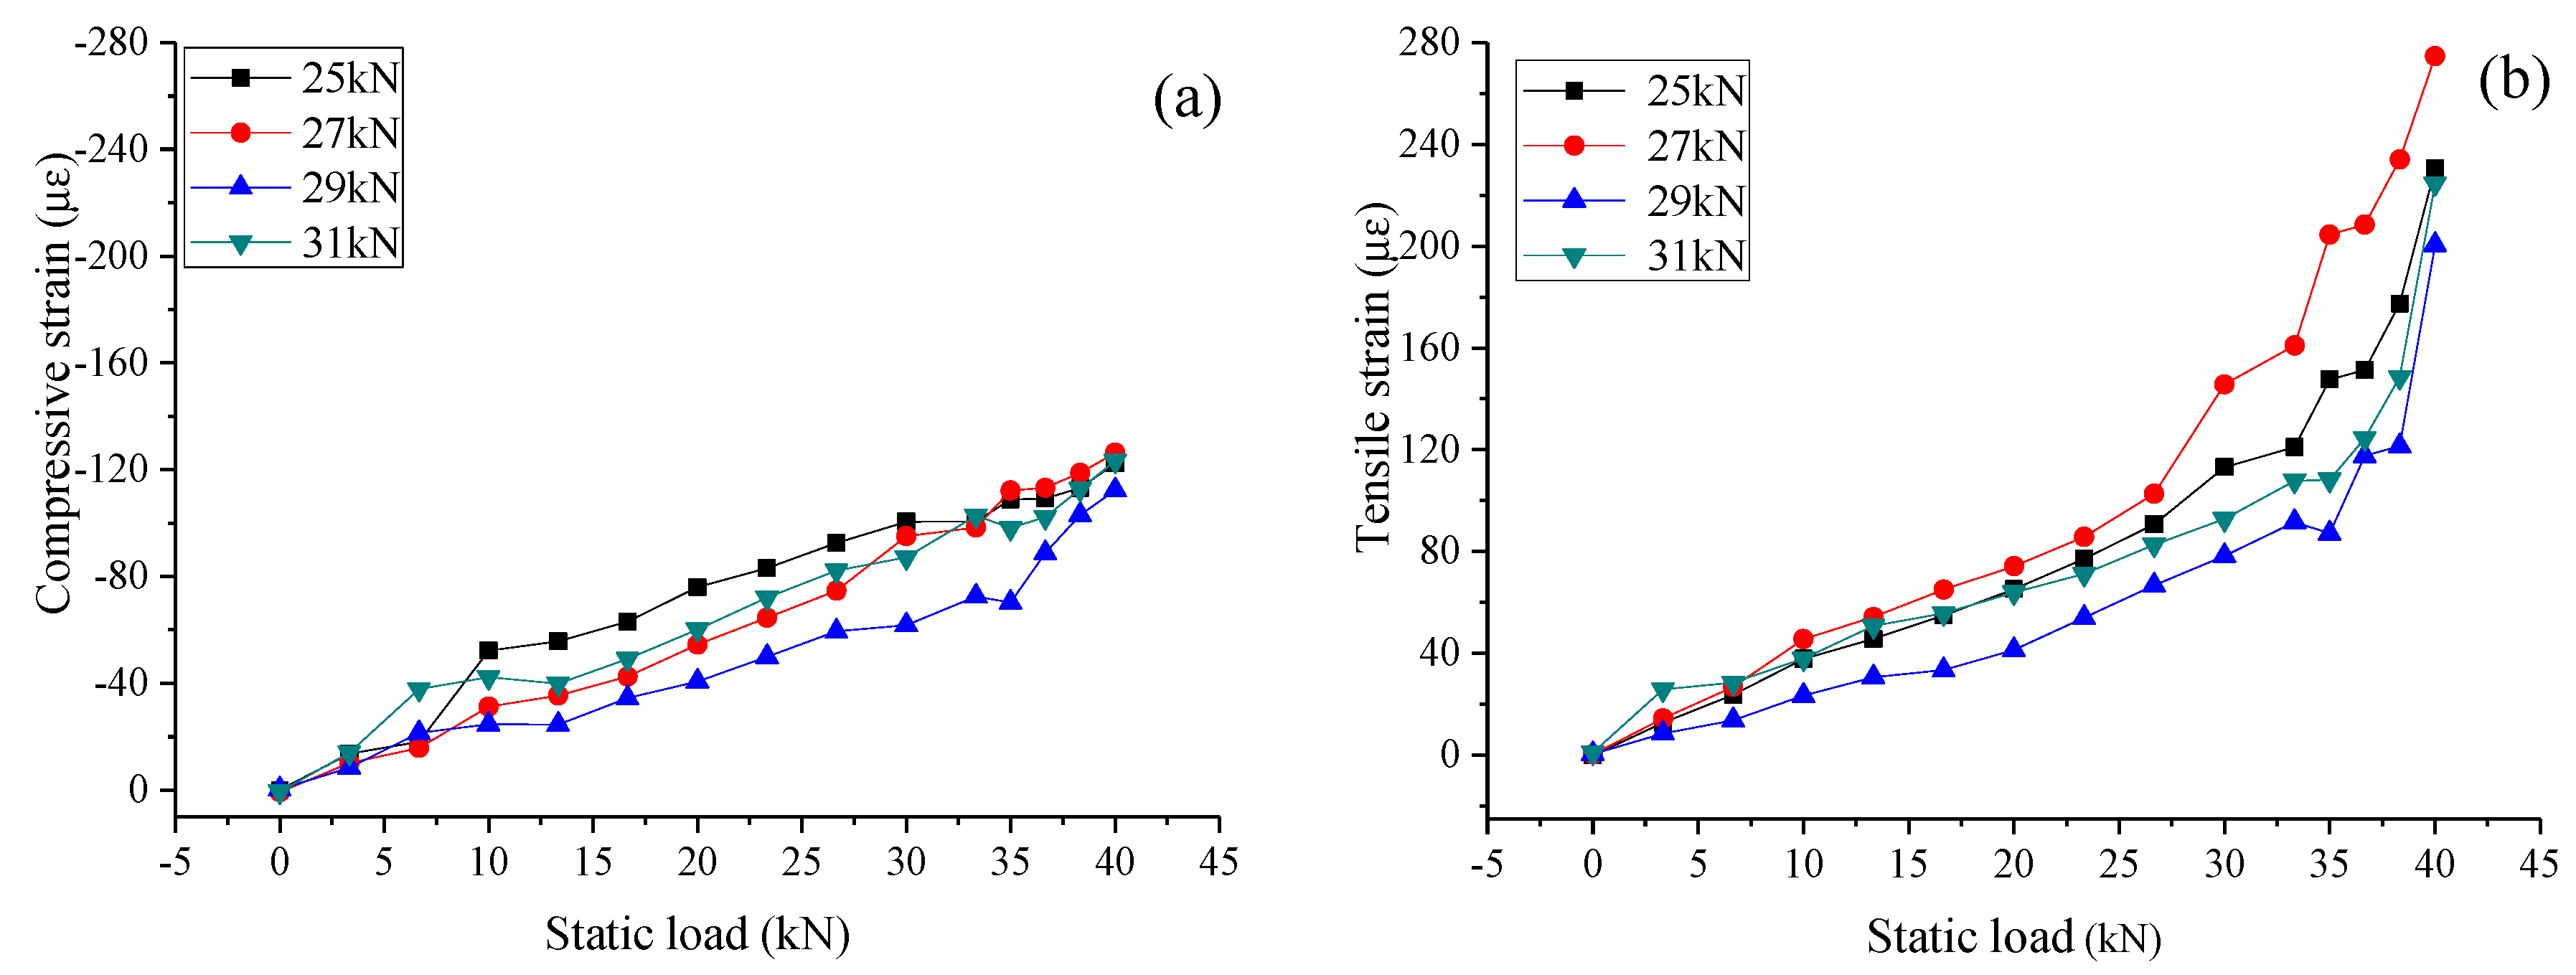
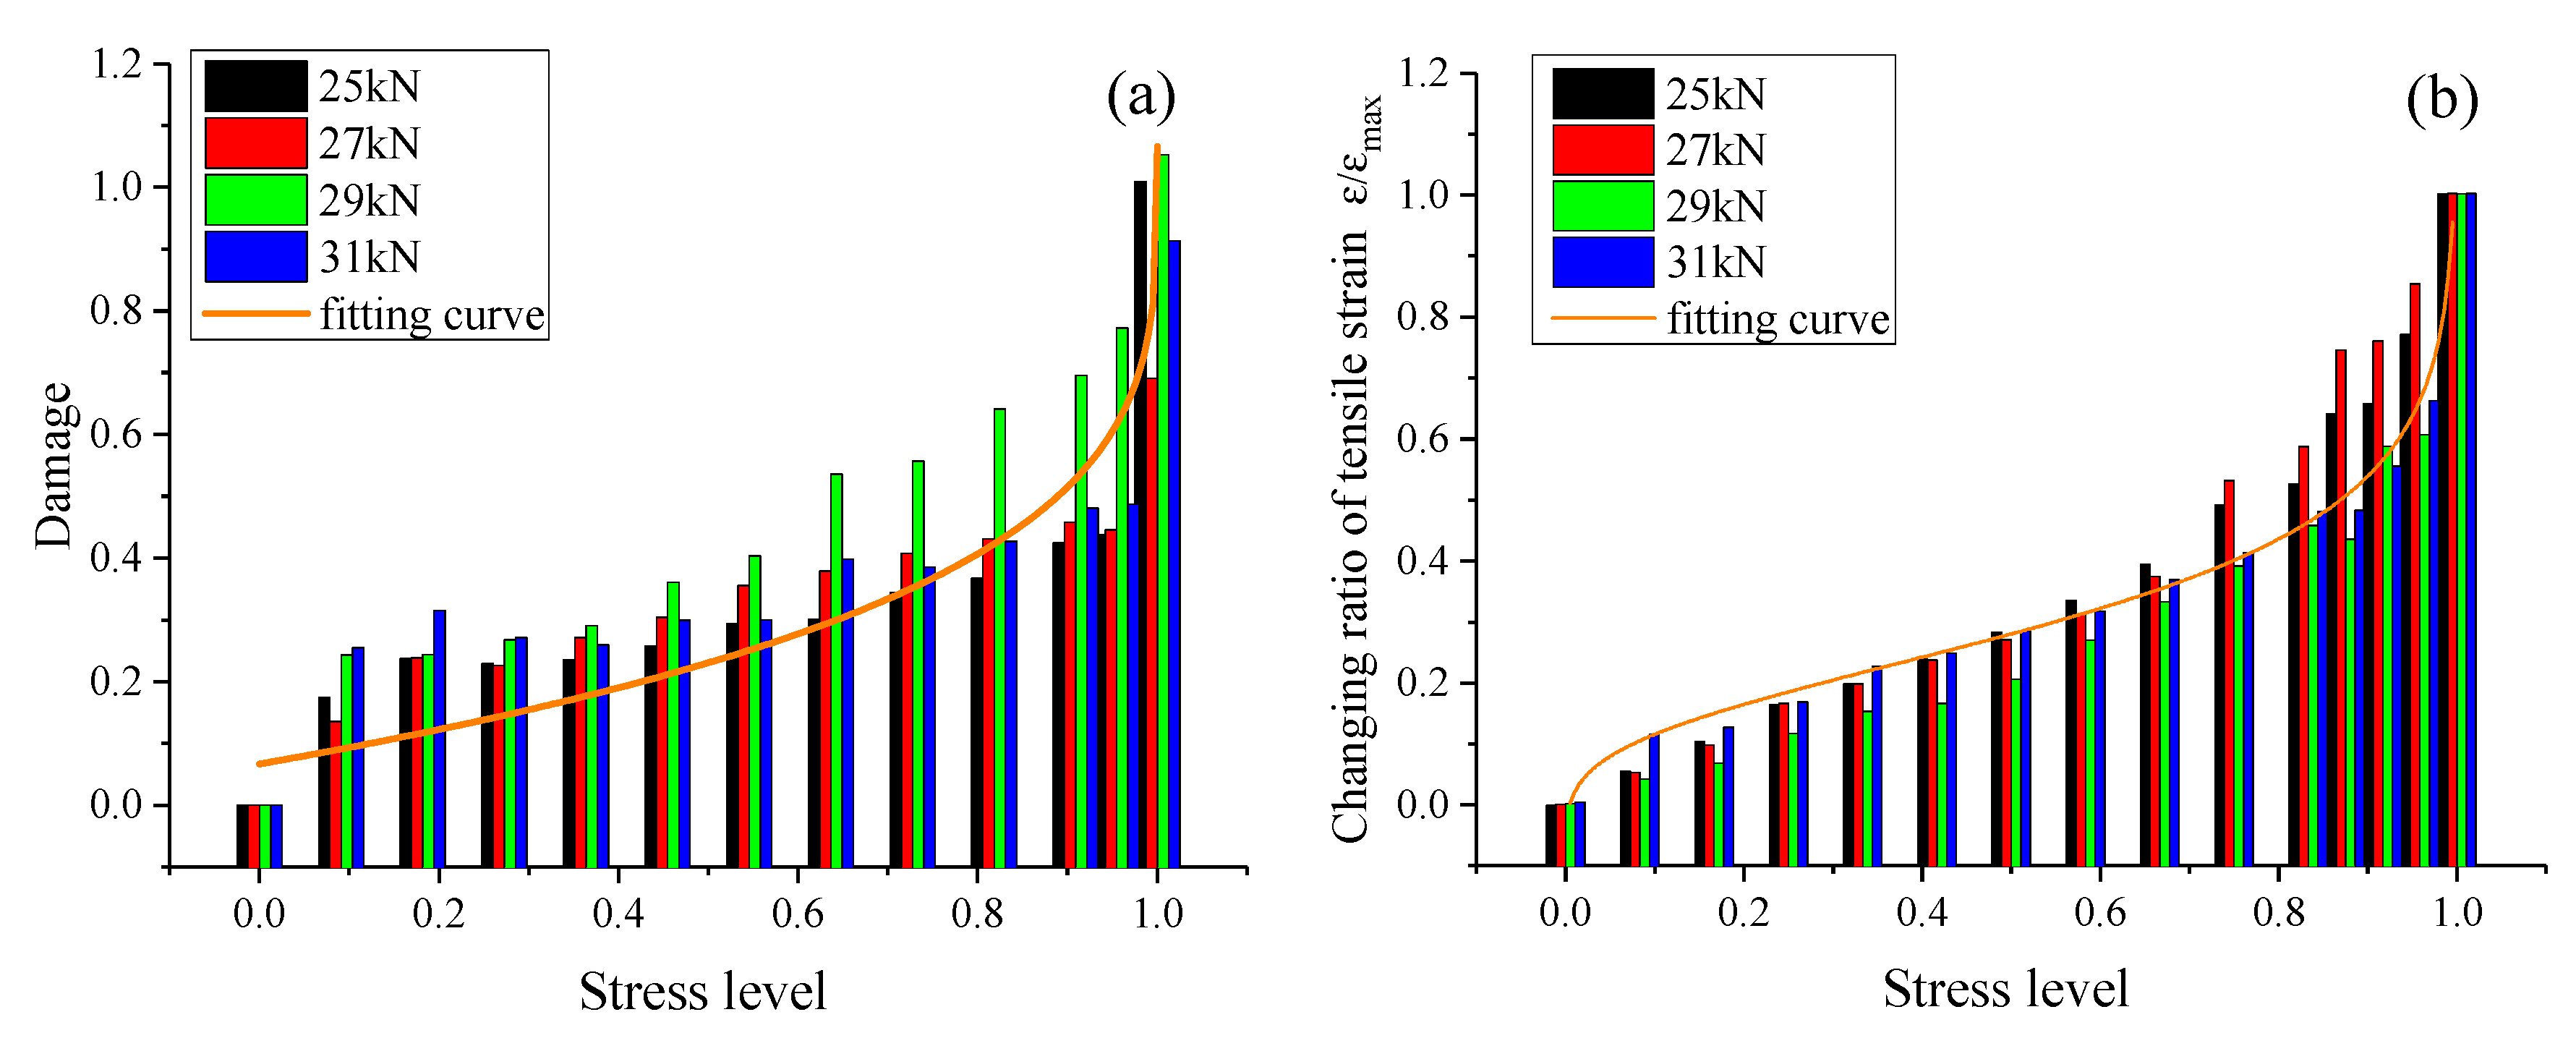
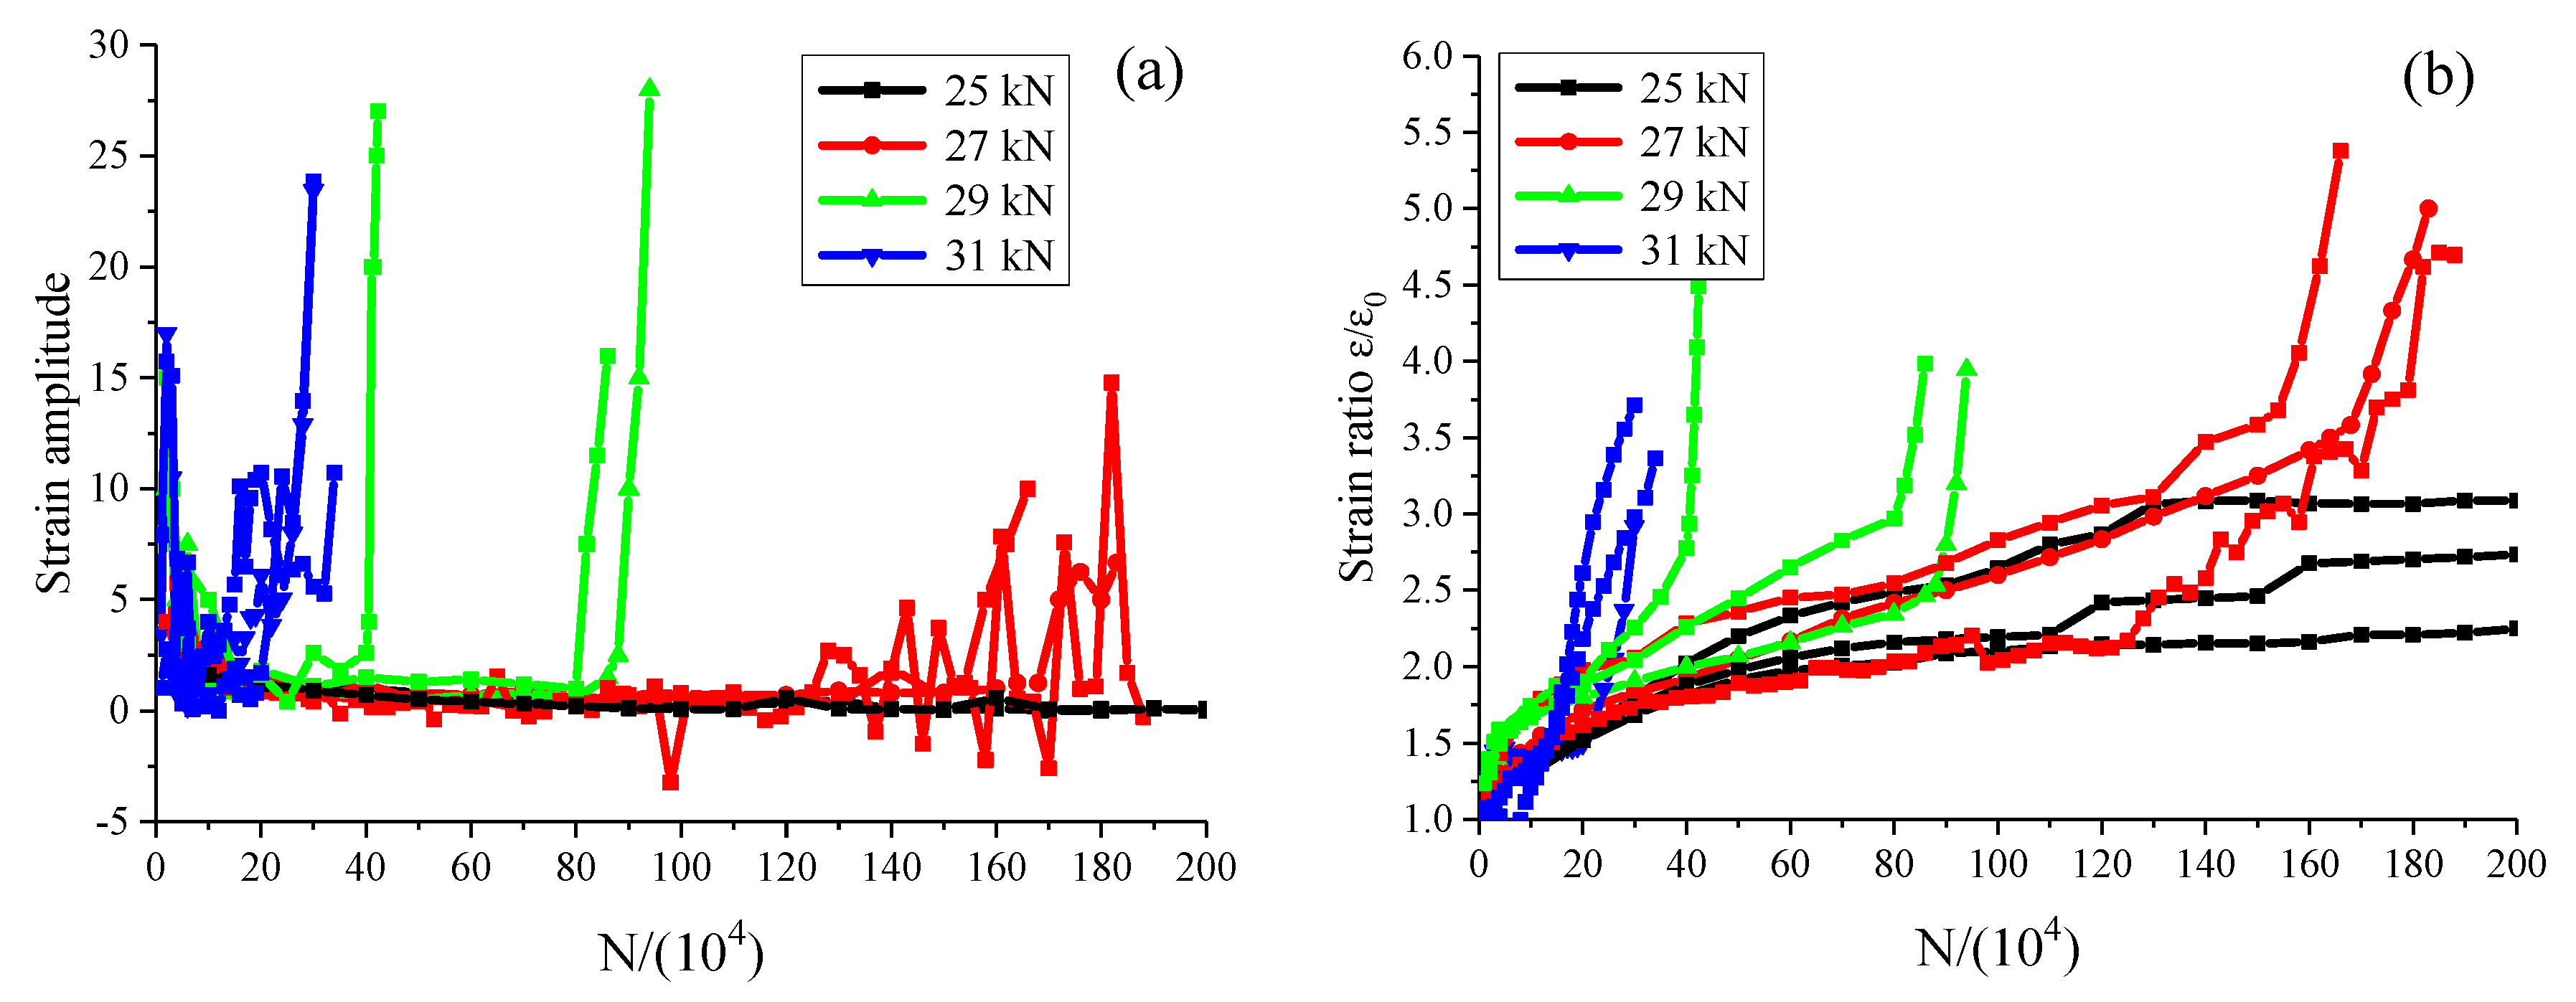
3.3. Cumulative Damage Under Initial Static Load

Figure 15 shows the strain evolutionary characteristics of specimens under different initial static loads. This figure indicates that both the tensile and compressive strains increase with the increase of initial static load, and the ultimate compressive strain is much smaller than its ultimate tensile strain, which indicates that the tensile strain, instead of the compressive strain, is the controlling failure factor of the tunnel inverted arch.
The development of damage extent and strain is also an aspect reflecting the serviceability of the tunnel lining. Both the damage extent and changing ratio of the tensile strain of the tunnel inverted arch are strongly influenced by the stress level of the initial static load. Their relationship curves are obtained and drawn in Figure 16.
The test results indicate that the damage amount gradually increases with the increase of initial static stress levels. The growth rates of damage amount in the early stage and the damage stage are bigger than that in the middle stage, and the failure stage has obvious nonlinear characteristics. The following is the fitting curve between the damage level and the stress level:
d = 1.066 ( 1 s ) 0.258
where d is the damage level, and s is the stress value.
The following is the regression formula between the changing ratio of tensile strain and stress levels:
L = 0.35 ( 1 s ) 25
where L is the increasing ratio of tensile strain, and s is the stress value.
Table 8 shows the damage value and strain ratio of the tunnel inverted arch under different stress levels.
This table shows out that strain will increase as the stress level improves. The strain changing rate also has two rapid growth stages, which indicate that there are three stages in the initial damage period of the tunnel lining as shown in Figure 17.
Test results indicate that the strain amplitude and strain ratio ε/ε0 are influenced by the initial static load levels. Figure 17 shows their development characteristic with fatigue life N. The following remarks can be observed from this figure:
(1)
The change of strain amplitude and strain ratio would be more significant if the static stress level is higher, and the tunnel inverted arch would be easily damaged in less action times of the dynamic load.
(2)
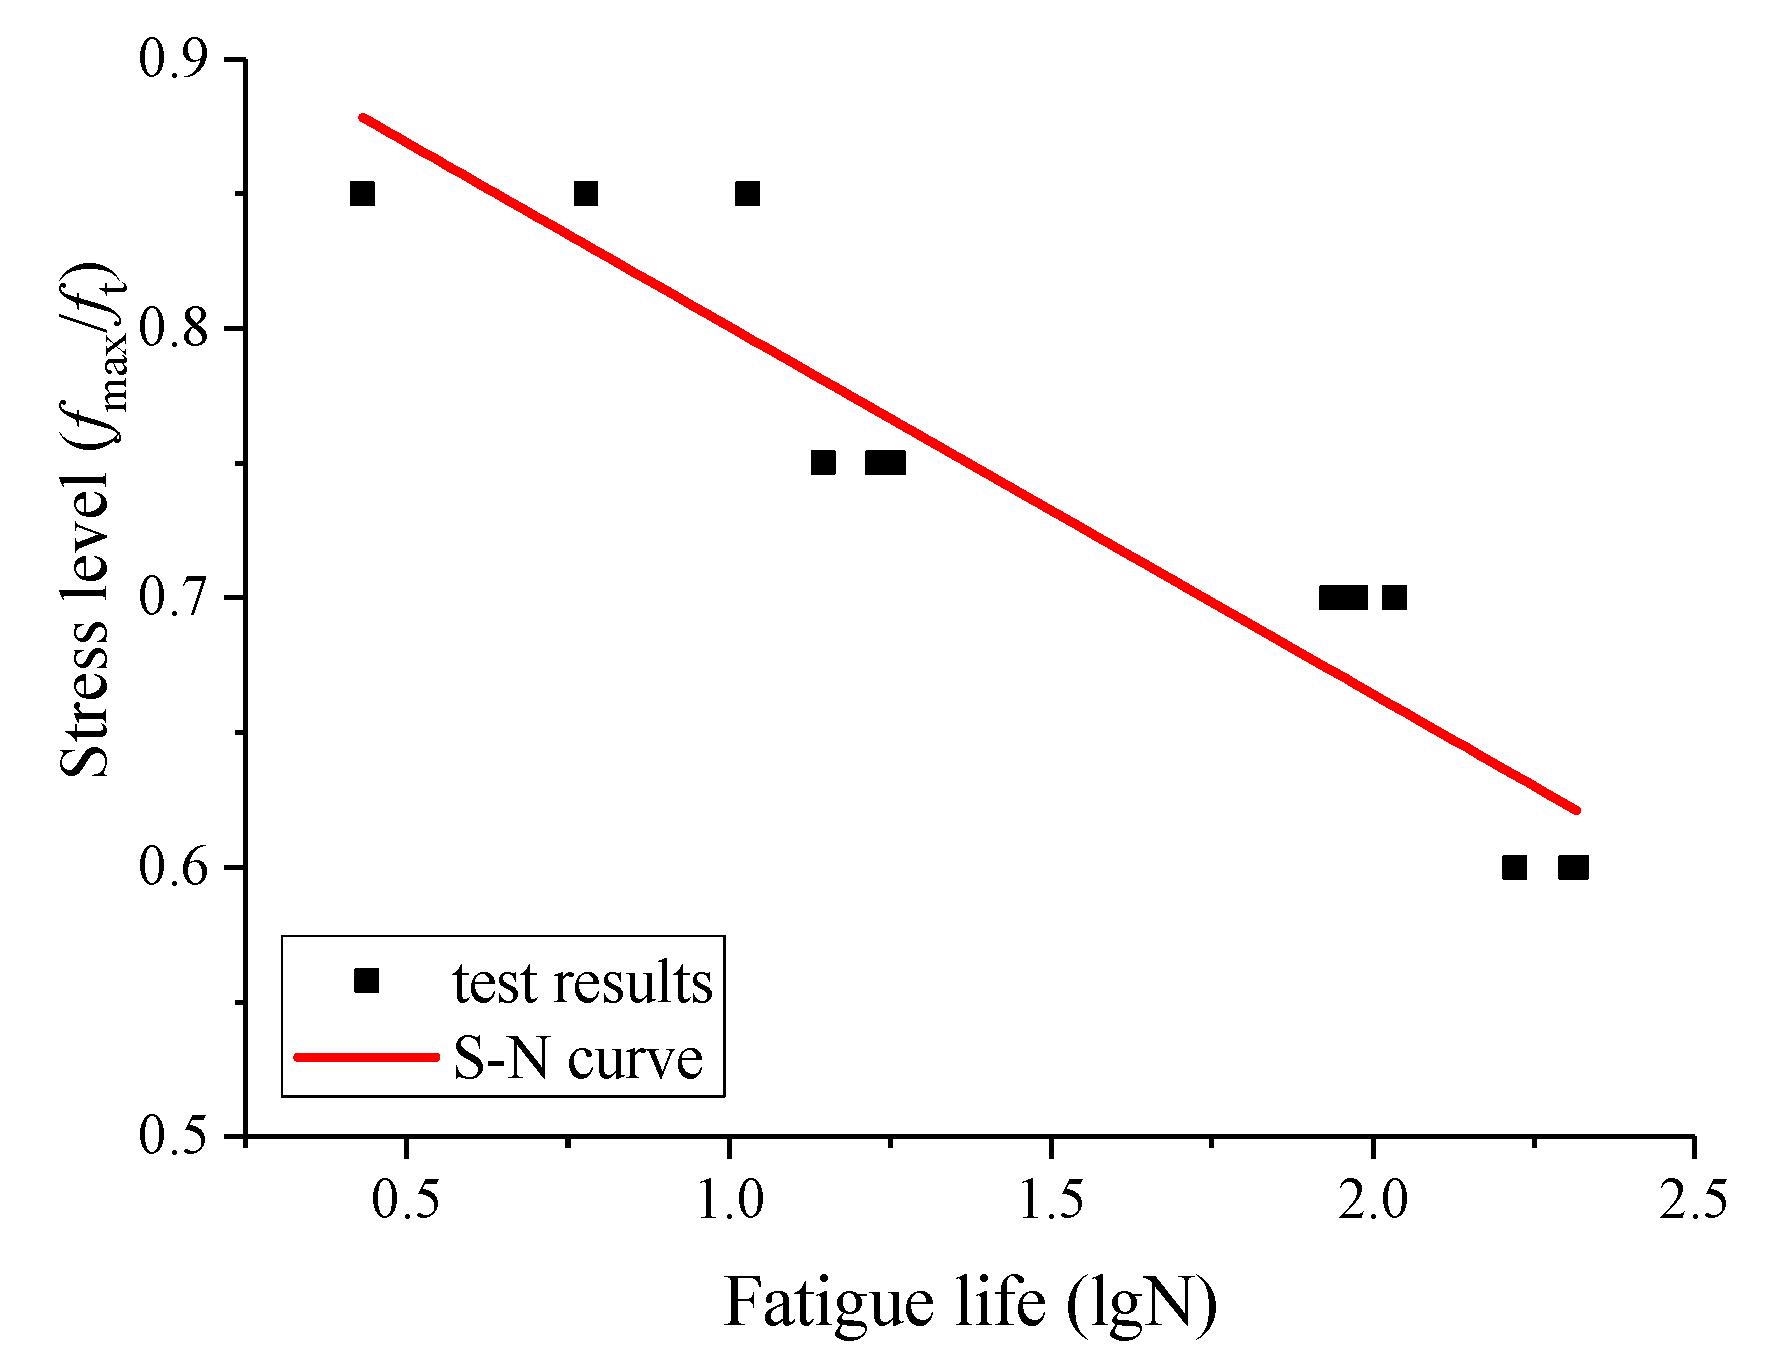
When the static load is 25 kN, the corresponding stress level is 0.65 and the change of strain amplitude and strain ratio tends to be stable after growth in the early stage. Once the static load is higher than this value, the strain amplitude and strain ratio are large in the initial stage and failure stage. Therefore, the fatigue life of the tunnel inverted arch would be short if the strain amplitude and strain ratio are significant in the failure stage.
In order to ensure that the tunnel has a long service capacity, the initial static stress levels should be less than 0.65.

4. Conclusions

In order to analyze the response characteristic of high-speed railway cross tunnel lining under dynamic train loads, this paper analyzed the displacement and stress response of tunnel lining under static strata loads and dynamic train loads using numerical analysis. We further analyzed the damage evolutionary characteristics of the tunnel inverted arch under different dynamic load conditions and different initial static stress conditions with the indoor test method. The main conclusions are as follows:
(1)
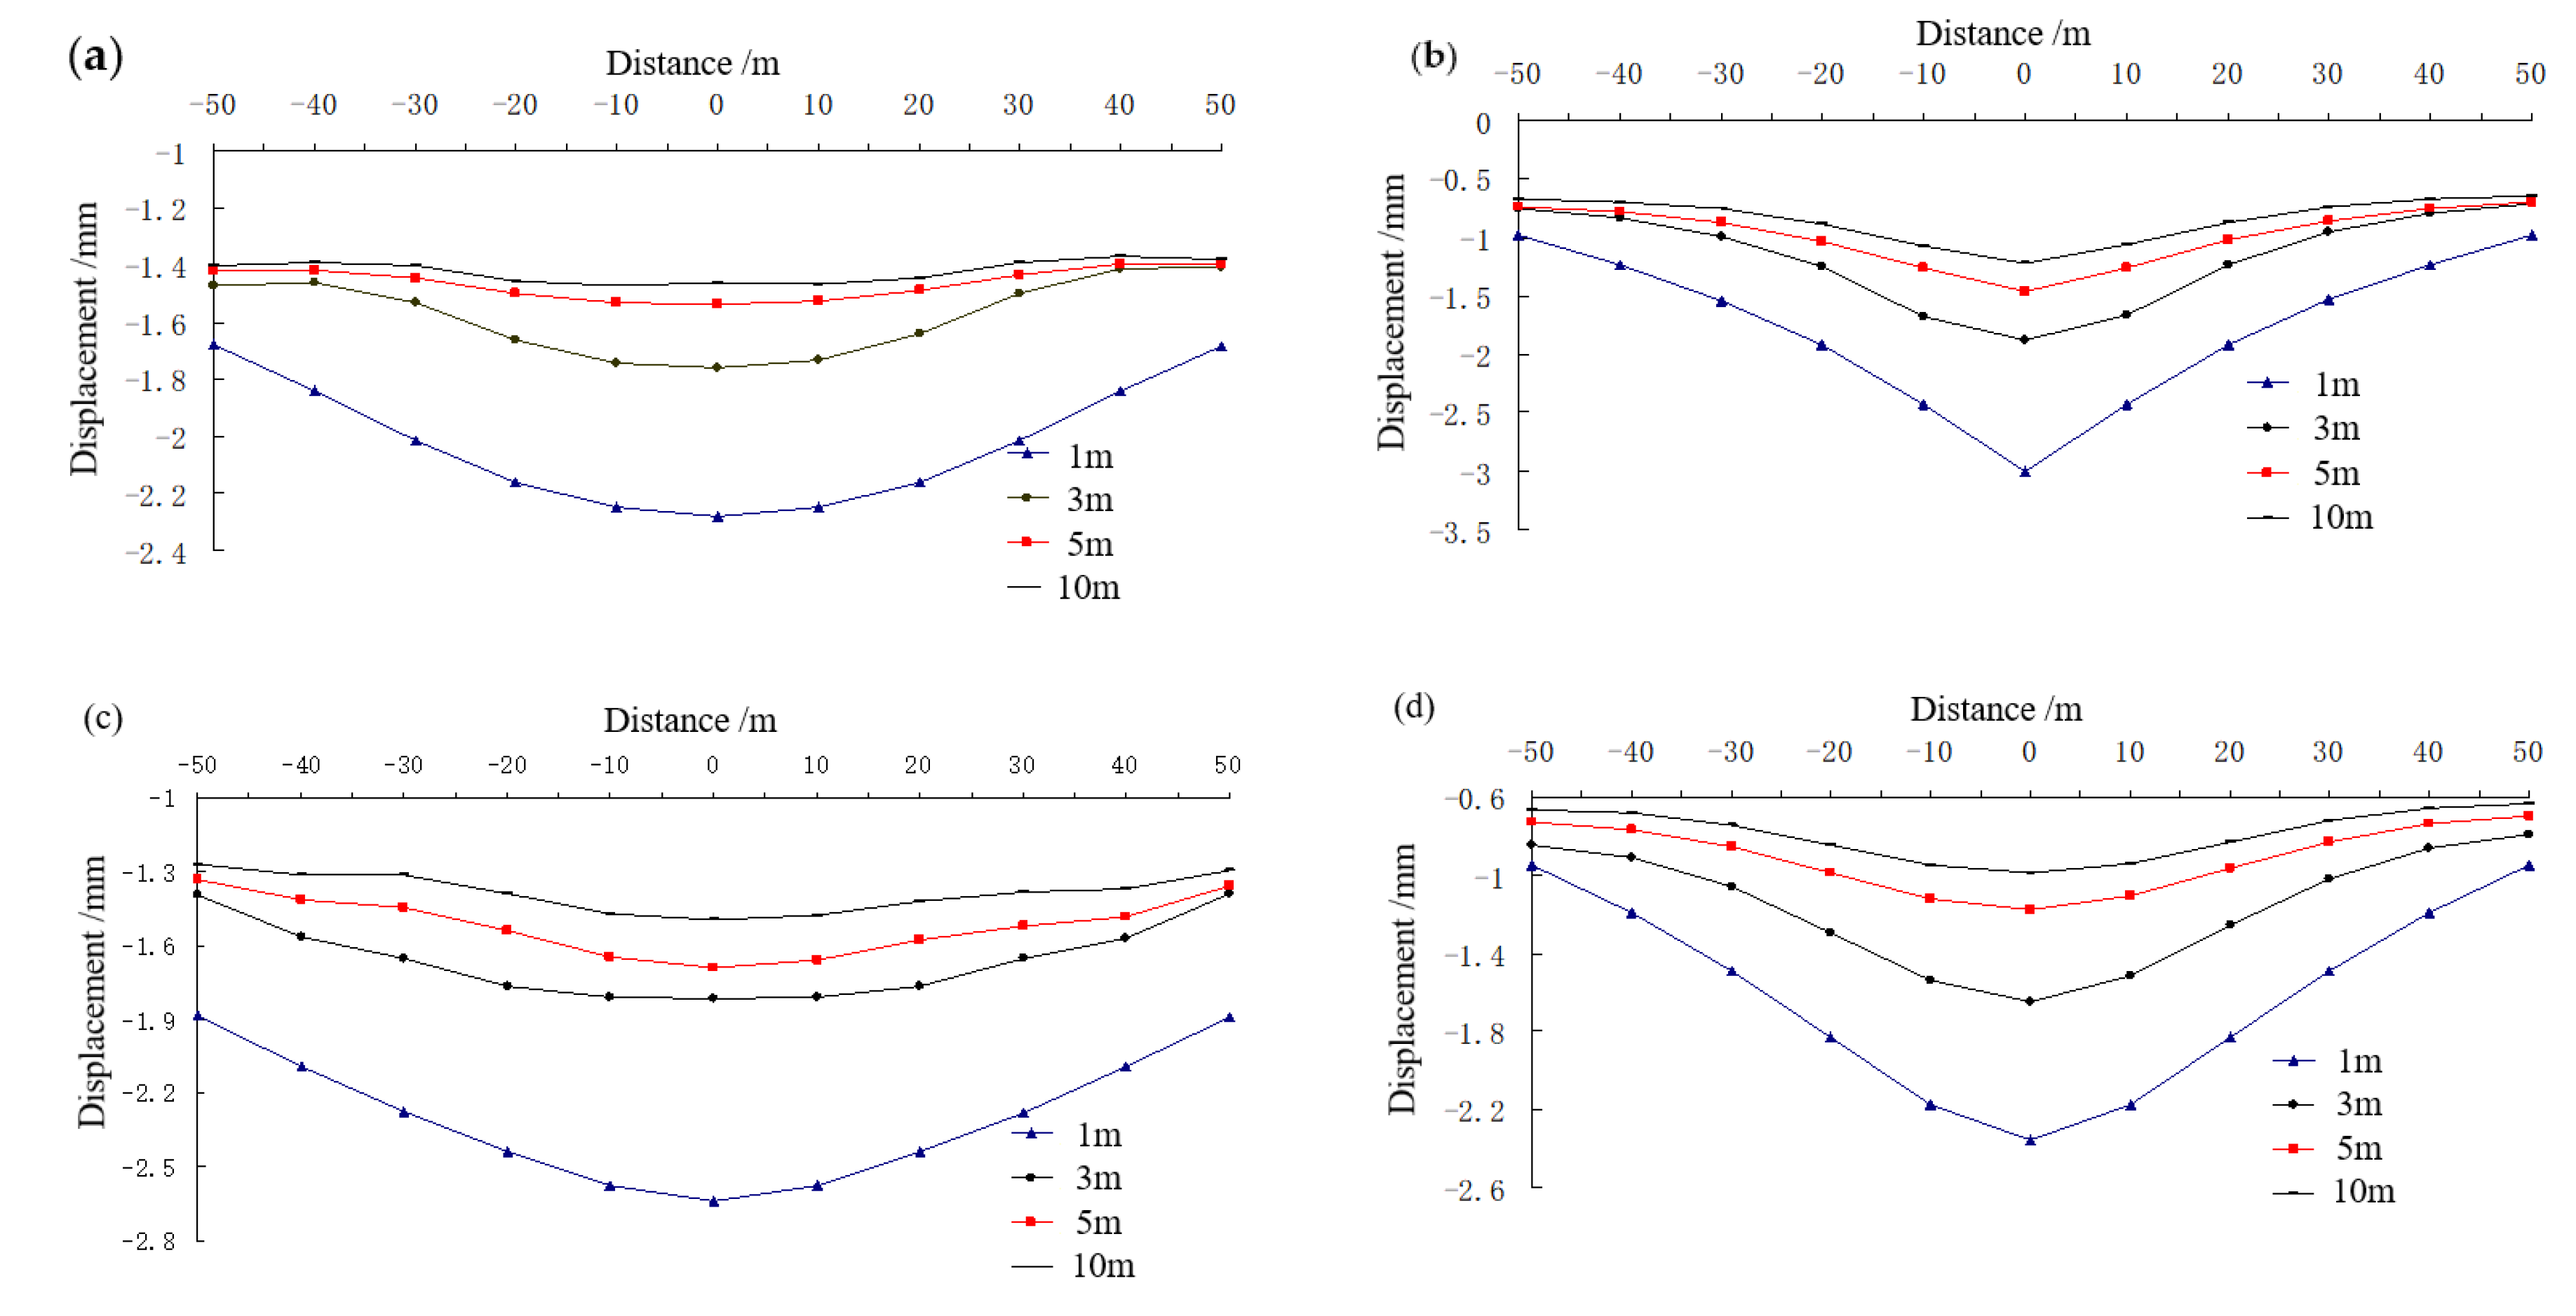
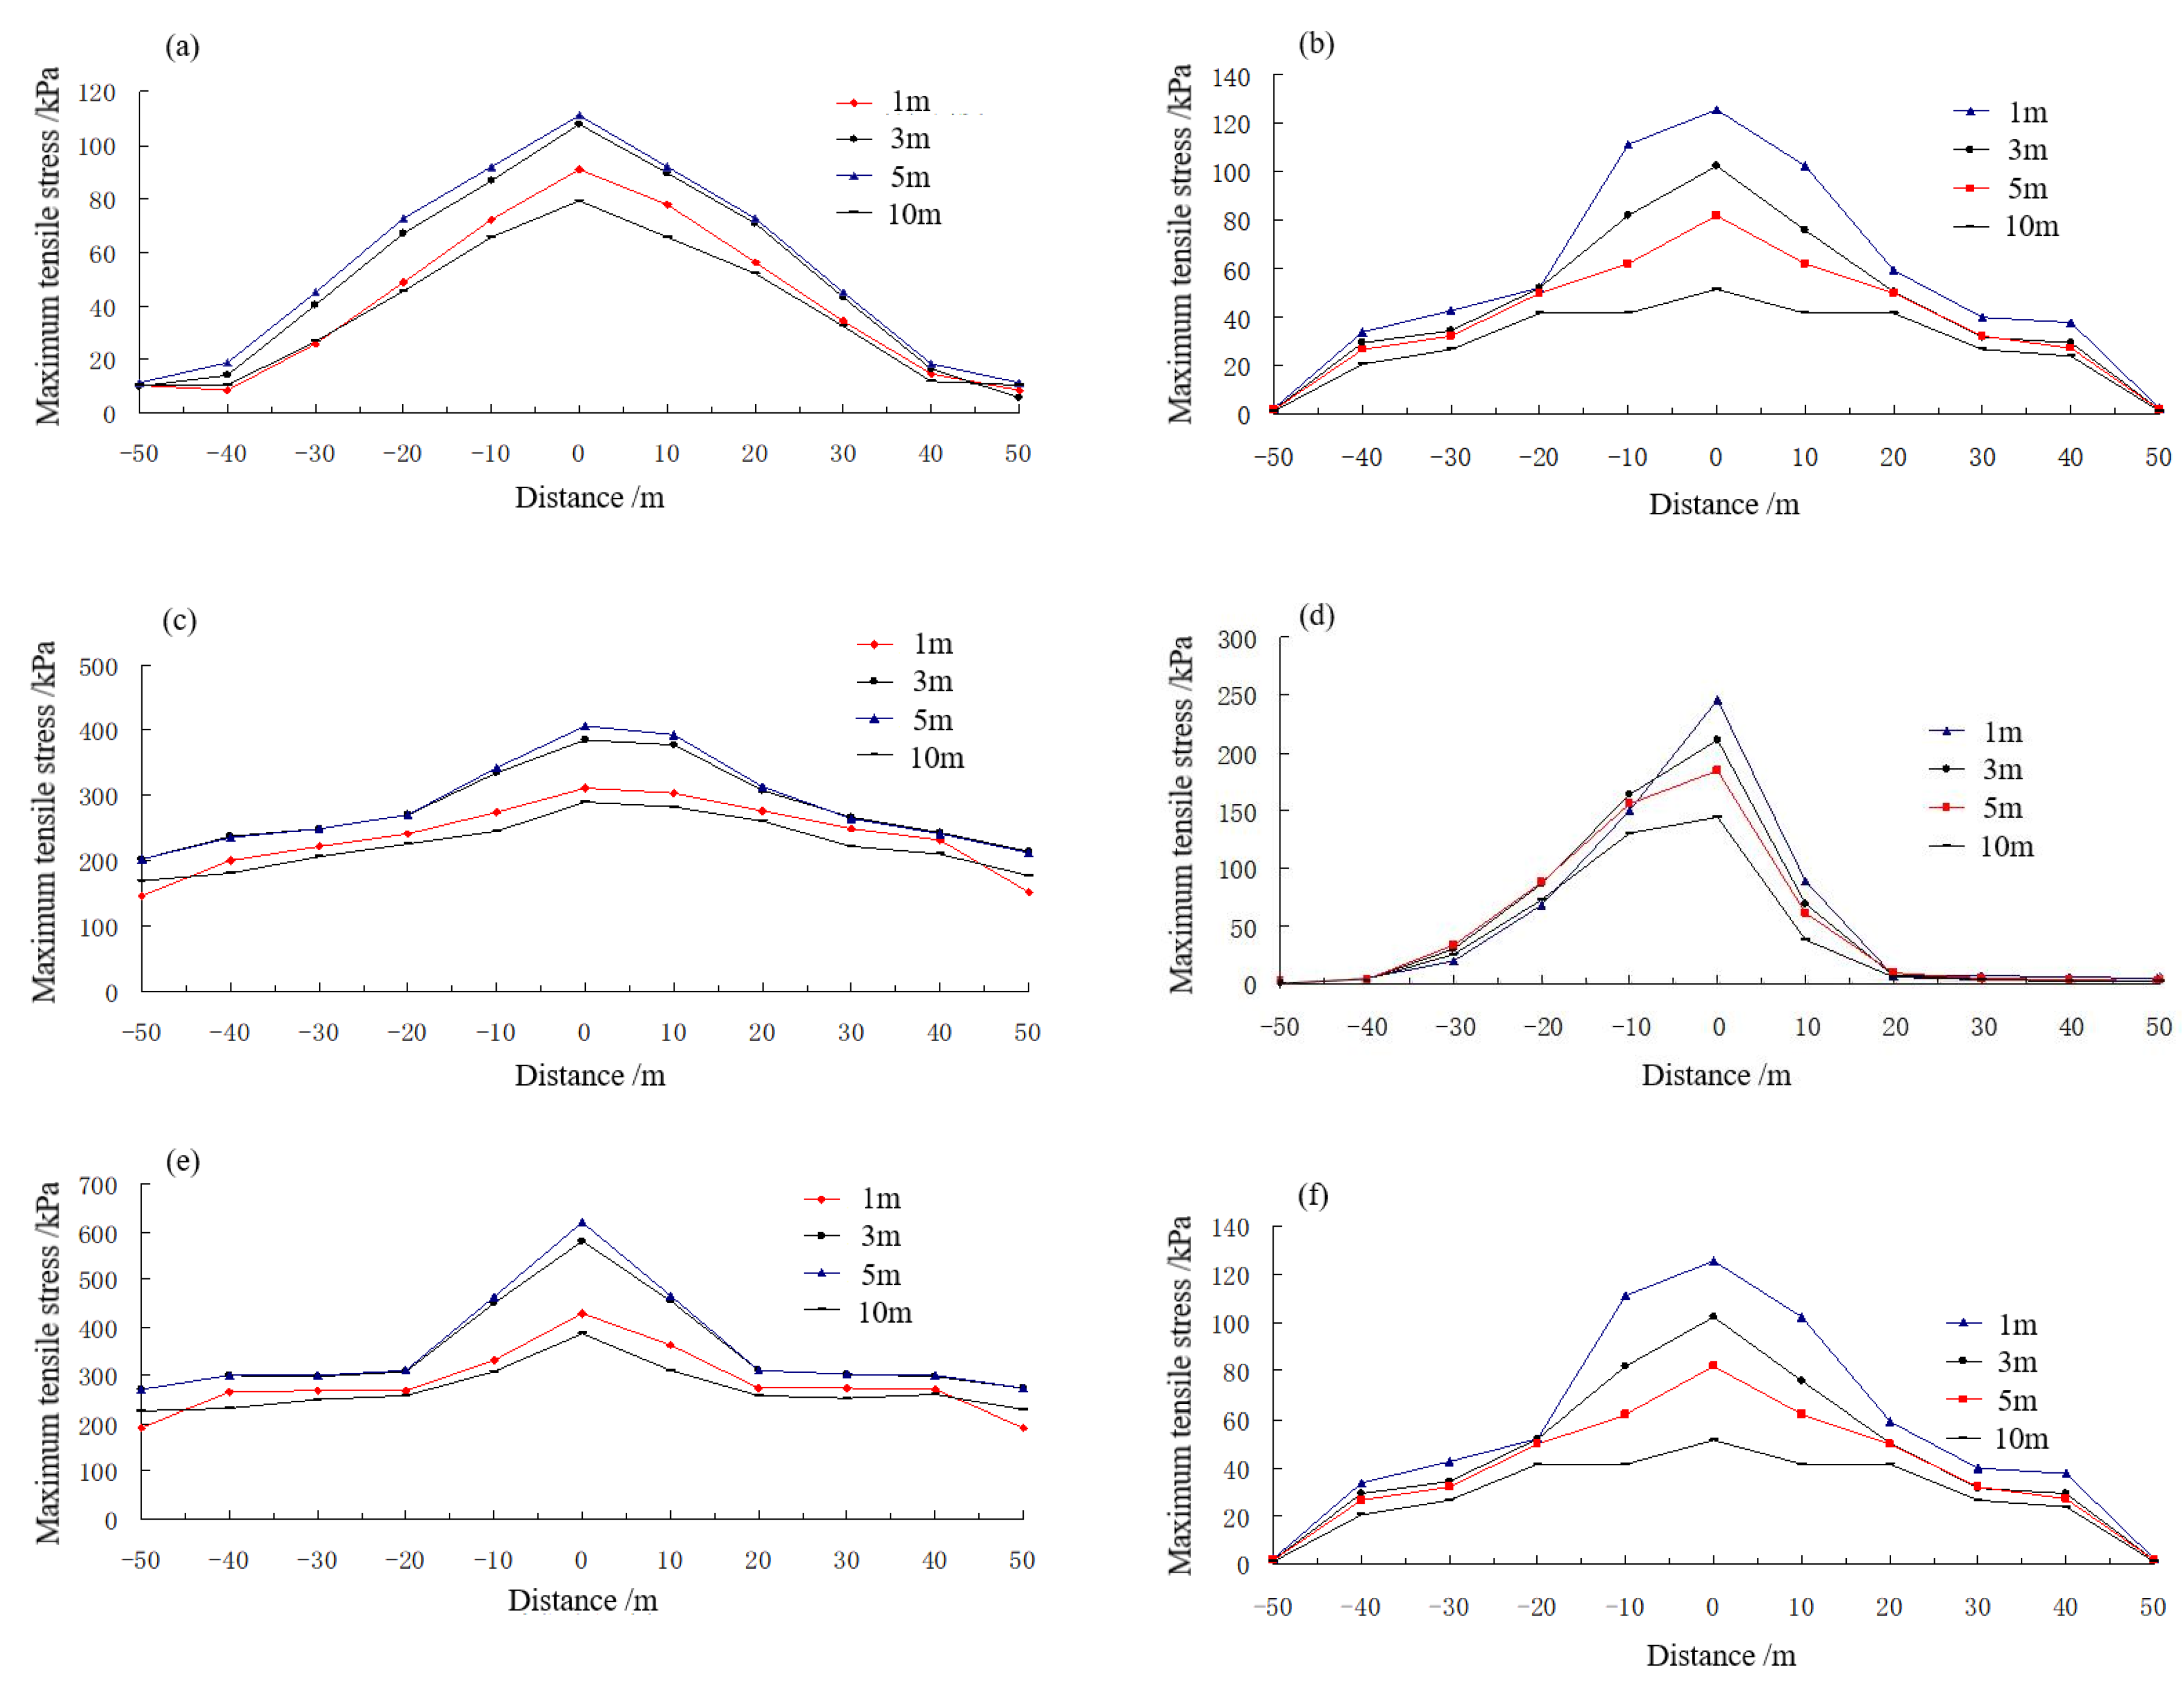
The displacement and stress levels of the tunnel lining are very significant at the cross position than at other positions. The stress increment of the tunnel lining due to dynamic train loads is more likely to induce a break in the tunnel lining at this position. To avoid the damage of the tunnel lining at the cross position, some countermeasures should be introduced, like ensuring the height of the rock column between the upper tunnel and the lower one is greater than 3 m, improving the strength of the rock column to make it superior to the surrounding rock of level Ⅳ, and avoiding the condition of two trains passing through the cross position at the same time.
(2)
The change of structural strain increment amplitude and strain ratio is obvious when the dynamic load stress level is higher, and the tunnel lining would be more easily damaged in the long-term service period. The tunnel inverted arch will be more likely to be intact when the dynamic stress level is 0.6. If the stress level of the dynamic load is higher than this threshold, the strain amplitude increment and strain ratio of the tunnel inverted arch will suffer from three stages during the dynamic loading process—the gradually increasing stage in the early loading period, the stable stage in the middle period, and finally, the breaking stage in the final period. From the perspective of the long-term service of the tunnel, the dynamic stress levels of the tunnel inverted arch should not be higher than 0.6.
(3)
The initial static load has an influence on both the tensile and compressive strain of the tunnel inverted arch, and the tensile strain is the controlling failure factor when the ultimate compressive strain is much small than its ultimate tensile strain. The change of strain amplitude and strain ratio would be more significant if the static stress level is higher, and the tunnel inverted arch would be easily damaged. When the stress level of static load is 0.65, the change of strain amplitude and strain ratio tends to be stable after growth in the early stage. Once the static load is higher than this value, the strain amplitude and strain ratio are significant in the initial stage and the failure stage. In order to ensure that the tunnel has long service capacity, the initial static stress level should be less than 0.65.
It should be noted that the deformation and stress states of a tridimensional tunnel are influenced by many factors such as geological heterogeneity and construction disturbance. In the design of tridimensional cross tunnels, the influence of other factors should also be paid attention to, besides the analysis results in this paper.

Author Contributions

Conceptualization, A.W.; formal analysis, C.Z.; funding acquisition, C.S.; investigation, C.S.; methodology, A.W., C.S., and E.D.; supervision, H.H.; writing—original draft, E.D.; writing—review and editing, A.W., C.S., and W.Y. All authors have read and agreed to the published version of the manuscript.

Funding

This research was funded by National Natural Science Foundation of China, grant number 51978670.

Conflicts of Interest

The authors declare no conflict of interest.

References

  1. Zheng, J.J.; Bao, D.Y.; Gong, Y.F.; Zi, Y. Research on Construction Control Technology for Railway Tunnel Underneath Passing Existing Expressway Tunnel. J. Railw. Eng. Soc. 2006, 8, 80–84. (In Chinese) [Google Scholar]
  2. Sui, C.Y.; Zhou, X.D.; Wang, L.H. The Comparison of Tunnel Engineering Construction Methods for Renhechang Tunnel Crossing Underneath Existing Tunnel on Lanzhou-Chongqing Railway. Appl. Mech. Mater. 2013, 405–408, 1330–1333. [Google Scholar] [CrossRef]
  3. Pan, W.; Gao, Z.; Zheng, C.; Gong, Z. Analysis on the influence of cross tunnel construction on the deformation of the existing high-speed railway tunnel. Geotech. Geol. Eng. 2018, 36, 4001–4013. [Google Scholar] [CrossRef]
  4. Duan, B.; Gong, W.; Ta, G.; Yang, X.; Zhang, X. Influence of small, clear distance cross-tunnel blasting excavation on existing tunnel below. Adv. Civ. Eng. 2019, 2019, 1–16. [Google Scholar] [CrossRef]
  5. Liao, S.M.; Liu, J.H.; Wang, R.L.; Li, Z.M. Shield tunneling and environment protection in Shanghai soft ground. Tunn. Undergr. Space Technol. 2009, 24, 454–465. [Google Scholar] [CrossRef]
  6. Kim, S.H.; Burd, H.J.; Milligan, G.W.E. Model testing of closely spaced tunnels in clay. Géotechnique 1998, 48, 375–388. [Google Scholar] [CrossRef]
  7. Liu, H.Y.; Small, J.C.; Carter, J.P.; Williams, D.J. Effects of tunneling on existing support systems of perpendicularly crossing tunnels. Comput. Geotech. 2009, 36, 880–894. [Google Scholar] [CrossRef]
  8. Lei, M.F.; Lin, D.Y.; Yang, W.C.; Shi, C.H.; Peng, L.M.; Huang, J. Model test to investigate failure mechanism and loading characteristics of shallow-bias tunnels with small clear distance. J. Cent. South Univ. 2016, 23, 3312–3321. [Google Scholar] [CrossRef]
  9. Jin, D.L.; Yuan, D.J.; Li, X.G.; Zheng, H.T. An in-tunnel grouting protection method for excavating twin tunnels beneath an existing tunnel. Tunn. Undergr. Space Technol. 2018, 71, 27–35. [Google Scholar] [CrossRef]
  10. Lai, H.; Zhao, X.; Kang, Z.; Chen, R. A new method for predicting ground settlement caused by twin-tunneling under-crossing an existing tunnel. Environ. Earth Sci. 2017, 76, 726.1–726.12. [Google Scholar] [CrossRef]
  11. Li, X.; Zhang, C.; Yuan, D. An in-tunnel jacking above tunnel protection methodology for excavating a tunnel under a tunnel in service. Tunn. Undergr. Space Technol. 2013, 34, 22–37. [Google Scholar] [CrossRef]
  12. Chen, R.P.; Lin, X.T.; Kang, X. Deformation and stress characteristics of existing twin tunnels induced by close-distance EPBS under-crossing. Tunn. Undergr. Space Technol. 2018, 82, 468–481. [Google Scholar] [CrossRef]
  13. Deng, F.H.; Mo, H.H.; Zeng, Q.J.; Yang, X.J. Analysis of the dynamic response of a shield tunnel in soft soil under a metro-train vibrating load. J. China Univ. Min. Technol. 2006, 16, 509–513. [Google Scholar] [CrossRef]
  14. Yi, H.Y.; Qi, T.Y.; Qian, W.P.; Lei, B.; Pu, B.R.; Yu, Y.Y.; Liu, Y.X.; Li, Z.Y. Influence of long-term dynamic load induced by high-speed trains on the accumulative deformation of shallow buried tunnel linings. Tunn. Undergr. Space Technol. 2019, 84, 166–176. [Google Scholar] [CrossRef]
  15. Wu, Z.R.; Qi, T.Y.; Zhong, L. Three-Dimensional Dynamic Response Analysis of Shield Tunnel under Train Loads. Appl. Mech. Mater. 2011, 90–93, 2062–2067. [Google Scholar] [CrossRef]
  16. Bian, X.C.; Jiang, H.G.; Cheng, C.; Chen, Y.M.; Chen, R.P.; Jiang, J.Q. Full-scale model testing on a ballastless high-speed railway under simulated train moving loads. Soil Dyna. Earthq. Eng. 2014, 66, 368–384. [Google Scholar] [CrossRef]
  17. Bian, X.C.; Jiang, H.G.; Chang, C.; Hu, J.; Chen, Y.M. Track and ground vibrations generated by high-speed train running on ballastless railway with excitation of vertical track irregularities. Soil Dyna. Earthq. Eng. 2015, 76, 29–43. [Google Scholar] [CrossRef]
  18. Wang, M.; Zhao, Y.; Li, Z.; Liu, D.; Yu, L. Fatigue damage of a heavy-haul railway tunnel invert under a 33-tonne axle cyclic load. Proc. Inst. Mech. Eng. 2019, 234, 498–510. [Google Scholar] [CrossRef]
  19. Chiu, Y.C.; Lee, C.H.; Wang, T.T. Lining crack evolution of an operational tunnel influenced by slope instability. Tunn. Undergr. Space Technol. 2017, 65, 167–178. [Google Scholar] [CrossRef]
  20. Huang, L.; Ma, J.; Lei, M.; Liu, L.; Lin, Y.; Zhang, Z. Soil-water inrush induced shield tunnel lining damage and its stabilization: A case study. Tunn. Undergr. Space Technol. 2020, 97, 103290. [Google Scholar] [CrossRef]
  21. Cui, Y.P.; Sun, W.Z.; Dong, J.; Dong, F. Dynamic response analysis of lining structure with primary defects for tunnel under moving train loading. Key Eng. Mater. 2012, 525–526, 573–576. [Google Scholar] [CrossRef]
  22. TB 10077-2019. Code for Rock and Soil Classification of Railway Engineering; China Railway Publishing House Co., Ltd.: Beijing, China, 2019. (In Chinese) [Google Scholar]
  23. Li, Z. Application of MIDAS/GTS in Geotechnical Engineering; Architecture & Building Press: Beijing, China, 2013. (In Chinese) [Google Scholar]
  24. Micelli, F.; Cascardi, A. Structural assessment and seismic analysis of a 14th century masonry tower. Eng. Fail. Anal. 2020, 107, 104198. [Google Scholar] [CrossRef]
  25. Clementi, F.; Gazzani, V.; Poiani, M.; Lenci, S. Assessment of seismic behaviour of heritage masonry buildings using numerical modelling. J. Build. Eng. 2016, 8, 29–47. [Google Scholar] [CrossRef]
  26. Luo, H.; Sun, C. Simulated study on vibration load of high speed railway. J. China Railw. Soc. 2006, 28, 89–94. (In Chinese) [Google Scholar]
  27. GB50010-2010. Code for Design of Concrete Structures; China Architecture & Building Press: Beijing, China, 2015. (In Chinese) [Google Scholar]
  28. Yan, Q.X.; Song, L.Y.; Chen, H.; Chen, W.Y.; Ma, S.Q.; Yang, W.B. Dynamic response of segment lining of overlapped shield tunnels under train-induced vibration loads. Arab. J. Sci. Eng. 2018, 43, 5439–5455. [Google Scholar] [CrossRef]
  29. TB10003-2005. Code for Design of Railway Tunnels; China Railway Press: Beijing, China, 2005. (In Chinese) [Google Scholar]
  30. Tina, T.; Lei, Y.; Qi, F.L.; Li, G.Q. Vibration response transmission of lining arch due to train speed-changing vibration load. Eng. Mech. 2018, 35, 143–151. (In Chinese) [Google Scholar]
  31. Dawn, T.M.; Stanworth, C.G. Ground vibrations from Passing Trains. J. Sound Vib. 1979, 66, 355–362. [Google Scholar] [CrossRef]
  32. Wang, X.Q.; Yang, L.D.; Zhou, Z.G. Dynamic response analysis of lining structure for tunnel under vibration loads of train. Chin. J. Rock Mech. Eng. 2006, 7, 1337–1342. (In Chinese) [Google Scholar]
  33. Peng, L.M.; Tan, C.B.; Shi, C.H.; Huang, C.L. Field test study on the disease treatment of foundation base in railway tunnel. China Railw. Sci. 2005, 3, 39–43. (In Chinese) [Google Scholar]
  34. Huang, J. Vibration response analysis and fatigue life study of high-speed railway tunnels based on damage theory. Ph.D Thesis, Central South University, Changsha, China, 2009. (In Chinese). [Google Scholar]
  35. Beijing Yiyang Strain and Vibration Testing Technology Co., Ltd. Strain Gauge Bx120-3AA. Available online: https://www.gkzhan.com/st87632/product_3589689.html (accessed on 14 June 2020).
  36. GB/T50081-2002. Standard for Test Method of Mechanical Properties on Ordinary Concrete; China Architecture and Building Press: Beijing, China, 2003. (In Chinese) [Google Scholar]
  37. Liu, M. Cyclic Constitutive Modeling of Soft Clays and Long-Term Predictions of Subway Traffic-Load-Induced Settlements; Tongji University: Shanghai, China, 2006. (In Chinese) [Google Scholar]
  38. Xiao, J.; Li, H.; Yang, Z. Fatigue behavior of recycled aggregate concrete under compression and bending cyclic loadings. Constr. Build. Mater. 2013, 38, 681–688. [Google Scholar] [CrossRef]
Figure 1. Stress diagram of the tunnel inverted arch.
Applsci 10 04406 g001
Figure 2. Schematic diagram of cross tunnels.
Applsci 10 04406 g002
Figure 3. Comparison between field tests and corresponding numerical models: (a) Field measuremen; (b) Numerical model; (c) Local model grid; (d) Schematic diagram of measuring point layout.
Applsci 10 04406 g003
Figure 4. Comparison of vibration acceleration between numerical simulation and field measurement: (a) Transverse acceleration; (b) Vertical acceleration.
Applsci 10 04406 g004
Figure 5. Test system: (a) Model diagram of test system: 1, lateral pressure spring; 2, bottom spring plate; 3, hydraulic golden roof; 4, MTS system; 5, contact steel plate; 6, gearbox. (b) Test loading diagram.
Applsci 10 04406 g005
Figure 6. Monitoring and data collection system. (a) IMC dynamic strain collecting instrument, (b) PV80A impedance analyzer, (c) Layout of the monitoring point- 1, upper strain gauge; 2, lower strain gauge; 3, piezoelectric ceramic patch.
Applsci 10 04406 g006
Figure 7. Initial stress distribution: (a) Maximum tensile stress, σ1; (b) maximum compressive stress, σ3.
Applsci 10 04406 g007
Figure 8. Initial displacement of tunnel lining.
Applsci 10 04406 g008
Figure 9. Vertical displacement of measuring points under different rock thickness: (a) arch of upper tunnel, (b) arch of lower tunnel, (c) left side wall of upper tunnel, (d) left side wall of lower tunnel, (e) invert of upper tunnel, (f) invert of lower tunnel.
Applsci 10 04406 g009aApplsci 10 04406 g009b
Figure 10. The maximum tensile stress, σ1; distribution of secondary lining: (a) vault of upper tunnel, (b) vault of lower tunnel, (c) left side wall of upper tunnel, (d) left side wall of lower tunnel, (e) inverted arch of upper tunnel, (f) inverted arch of lower tunnel.
Applsci 10 04406 g010
Figure 11. The maximum compressive stress, σ3; distribution of secondary lining: (a) vault of upper tunnel, (b) vault of lower tunnel, (c) left side wall of upper tunnel, (d) left side wall of lower tunnel, (e) inverted arch of upper tunnel, (f) inverted arch of lower tunnel.
Applsci 10 04406 g011aApplsci 10 04406 g011b
Figure 12. Strain evolutionary characteristics under different dynamic stress levels: (a) strain increment; (b) strain ratio.
Applsci 10 04406 g012
Figure 13. Process of strain evolution.
Applsci 10 04406 g013
Figure 14. Least-square fitting of S-N curve fitting.
Applsci 10 04406 g014
Figure 15. Structural dynamic response with different static loads: (a) compressive strain curves; (b) tensile strain curves.
Applsci 10 04406 g015
Figure 16. Strain and damage curves: (a) damage curve; (b) changing ratio curve.
Applsci 10 04406 g016
Figure 17. Strain evolutionary characteristic: (a) Strain increment; (b) Strain ratio.
Applsci 10 04406 g017
Table 1. Conditions for the numerical model.
ConditionComputing ParameterNotes
1Rock level is V, rock thickness between two tunnels is 1 m, and cross angle is 90°Static analysis
2Rock levelTrain passes through the upper tunnel, tunnel cross angle is 90°, and rock thickness between two tunnels is 1 m.
3
4
5The way of train passesUpper tunnelTrain speed is 350 km/h, rock level is Ⅴ, tunnel cross angle is 90°, and rock thickness between two tunnels is 1 m.
6Lower tunnel
7Simultaneously
8Train speed250 km/hTrain passes through the upper tunnel, rock level is Ⅴ, tunnel cross angle is 90°, and rock thickness between two tunnels is 1 m.
9300 km/h
10350 km/h
11Tunnel cross angleTrain passes through the upper tunnel at a speed of 350 km/h, rock level is Ⅴ, and rock thickness between two tunnels is 3 m.
1230°
1360°
1490°
15Rock thickness between the two tunnels1 mTrain passes through the upper tunnel at a speed of 350 km/h, rock level is Ⅴ, and tunnel cross angle is 90°.
163 m
175 m
1810 m
Table 2. Mechanical parameters of strata.
Rock LevelVolumetric Weight
(kN/m^3)
Elastic Modus (GPa)Passion Ratio
μ
Cohesion (kPa)Internal Friction Angle (φ°)
III2560.3070039
IV220.60.3510030
V19.50.20.355025
Table 3. Measured data of dynamic response of tunnel support structure under train loads.
ReferenceTrain Speed(km/h)Displacement (mm)Tensile Stress (MPa)
NumericalLocationNumericalLocation
Rapid rail transit in the UK [31]20014inverted arch--
Zhuting Tunnel in China [32]1202.3Side wall--
Centipede Tunnel in China [33]120--0.309inverted arch
Model test [34]2005.8inverted arch0.141inverted arch
2507.6inverted arch0.169inverted arch
3009.2inverted arch0.170inverted arch
Table 4. Monitoring equipment.
Equipment NameSensor/ModelSize (mm)AccuracyCollecting Data
IMC dynamic strain collecting instrumentStrain gauge/ BX120-80AA [35]Length × width/ 80 × 32.08 ± 1%Dynamic strain
PV80A impedance analyzerPiezoelectric patch /PZT-5A10 × 10 × 0.3< 1%Cumulative damage
Table 5. Mix proportion of concrete.
ItemWater
Binder Ratio
Cement
(kg/m3)
Fine Aggregate
(kg/m3)
Coarse Aggregate (kg/m3)Fly Ash (kg/m3)Water-reducing Admixture (kg/m3)Water
(kg/m3)
parameter0.4027774710751083.85153
Table 6. The mechanical parameters of the specimen.
Dynamic Mechanical ParameterStatic Mechanical Parameter
Specimen size
(mm)
Elastic modulus
E (GPa)
Shear
modulus
G (GPa)
Poisson’s ratio
µ
Specimen
size
(mm)
Elastic
modulus
E (GPa)
Shear
modulus
G (GPa)
Poisson’s ratio
µ
100 × 100 × 30041.816.90.23100 × 100 × 10031.742.30.23
Table 7. Tensile stress increment of the tunnel lining under different working conditions.
ConditionComputing ParametersThe Maximum Tensile Stress
of Tunnel Lining (MPa)
1Rock level0.357
20.404
30.513
4The way of train passing throughUpper tunnel0.513
5Lower tunnel0.386
6Simultaneously0.789
7Train speed250 km/h0.221
8300 km/h0.343
9350 km/h0.513
10Tunnel cross angle0.378
1130°0.385
1260°0.398
1390°0.461
14Rock thickness between two tunnels1 m0.513
153 m0.461
165 m0.432
1710 m0.348
Table 8. Damage value and strain ratio of the inverted arch under different stress levels.
Stress Level0.60.650.70.75
Damage value0.270.320.330.37
Strain ratio0.300.350.370.40

