Abstract
This paper aims to present the effect of specific operational factors (temperature and humidity) on the selected mechanical properties of a conveyor belt. The tests were conducted in a climatic chamber, simulating the effect of both minus and plus temperatures −30 °C to 80 °C (243 K to 353 K) at specific humidity, and in a thermal shock chamber where a varying number of ageing cycles was applied for a specific range of thermal shocks. Six different tests in the climatic chamber and four different tests in a thermal shock chamber were conducted. The results of the climatic chamber tests demonstrate that many strength parameters have undesired values at a temperature of 10 °C (283 K) and 80 °C (353 K) at a relative humidity of 80%. Interestingly, the results revealed that tensile strength, tensile modulus and yield strength are higher at below 0 °C temperature than at above 0 °C temperature. For example, comparing the temperature −30 °C (243 K) and +30 °C (303 K) obtained a difference of tensile modulus of nearly 10%, and comparing the temperature −30 °C (243 K) and +10 °C (283 K) the differences were 22%.
1. Introduction
The use of primitive versions of conveyor belts by manufacturers dates back to the 19th century. For the purpose of carrying coal, ores and other products, Thomas Robins invented a conveyor belt in 1892. The Swedish company Sandvik invented and started producing steel conveyor belts in 1901. Conveyor belts, invented by Richard Sutcliffe in 1905, were used in coal mines and revolutionized the entire mining industry. Henry Ford introduced assembly lines at his factory in 1913 that used conveyor belts. Mail volumes in the postal system were snowballing, and postal operators had to deal with this situation by installing automatic sorting machines. The first semiautomatic sorting system was installed in the USA in 1957. This Letter Sorting Machine was made of an upper and lower section, a set of five sorting keyboards and a conveyor belt. That was the first usage of a conveyor belt in an automatic postal processing system.
The issue of testing the properties of materials, and thus the conveyor belts (and components of conveyor belts [1,2,3,4,5]) in varying weather conditions and under different loads is not new [6,7,8,9,10]. The conveyor belts are exposed to different factors such as changes in temperature, humidity or air pressure during their service life [9,11,12,13]. Several authors have examined how these factors affect the properties of the materials forming the conveyor belts. Bocko et al. [14], in their article, presented numerical analyses using the component testing of conveyor belts and information about complex materials. Their article contains a definition of methods used for the calibration of materials defined by the user and the building of numerical models. The material tests included the determination of the mechanical properties of plies of rubber cover, textile reinforcements, and plies of textile with adjacent rubber. Goltsev and Markochev [15] described the analysis of fatigue testing methods. In their article, these authors compared the conventional testing methods for fatigue cracking resistance with tests of constant amplitude of stress intensity factor. For the analysis of belt–bulk material interactions and the conveyor belts’ engineering design, the determination of pressure distribution is crucial. This was the objective of the study by Liu, Pang, and Lodewijks [16]. They developed and verified a theoretical model for predicting the distribution of pressure on conveyor belts. An essential process in the transport industry is impact loading, because this causes wear and failure in important components. Conveyor belts are critically important because of their usage in virtually every industry in which quantities of goods must be moved over short or long distances. Molnar et al. [17] investigated the effects of impact loading to the surface of a rubber conveyor belt and the stress levels inside the material. They tested the impact of loading things onto the conveyor belt, but this was only a partial test in an ideal atmospheric condition.
Another problem with conveyor belts is ageing. The rubbers of conveyor belts used during transport age, because during their operation they are exposed to the aggressive characteristics of the external environment. Significant changes caused by the ageing process appear on the surface of the conveyor belts, primarily due to immediate contact with the transported cargo or due to contact with the ambient air. Nedbal et al. [18] used mechanical and dielectric spectroscopy to determine the physical properties of rubbers used for conveyor belts. One way to assess changes is to test the internal structure of the conveyor belt. Barburski [12], in his analysis, which was dedicated to the measurement of the primary parameters that characterize the internal structure of the fabric of conveyor belts, points out that the weave (heat treatment at 160 °C (433.15 K) for 5, 10 and 15 min) affects the degree of the changes in conveyor belts during exposure to high temperatures. Petrikova’s paper [19] presented another numerical and experimental study dedicated to the behavior of the conveyor belt, in which the temperature dependence of the dynamic and tribological behaviors of the belt were investigated.
In summary, none of the authors above tested conveyor belts under changing temperature and humidity conditions. This paper aims to present the effect of these specific operational factors (temperature and humidity) on selected strength parameters of the conveyor belts that comprise the main element of the sorting line in a Slovakian central sorting center. The tests were conducted in a climatic chamber, simulating the effect of both temperatures both above and below 0 °C at specific humidity, and in a thermal shock chamber where a varying number of ageing cycles was applied for a specific range of thermal shocks.
Another important reason for the implementing this test is that the authors see practical benefits. Automated sorting systems currently play a significant role in the environment of postal and logistical businesses. The reason for this is an increase in the volume of shipments originating in e-commerce needing to be processed and delivered to the addressee within a set timeframe. The reliability of sorting systems does not depend only on the selection of the correct sorting program, but also on the construction and functionality of individual technical components of the whole system. In this context, this study examines the effect of various environmental effects (temperature, humidity, pressure, etc.) on a critical part of the sorting system; specifically, the conveyor belt. The test results (which enable the search for dependencies between changes in the mechanical attributes of the belt and changes in atmospheric conditions) are significant in terms of the effective usage and operation of a device in two respects. Firstly, with respect to the organization of activities and the definition of processes within the facility itself. This is mainly related to the setting, for example, of the speed of the conveyor belt during loading, offloading and further handling of shipments relative to the number, weight and frequency of shipments on the belt. Together with other tested attributes, this significantly affects the lifespan and maintenance of the belt, as well as the overall sorting system. Secondly, with respect to the management of costs related to ensuring regular operation and maintenance, but also in terms of additional costs that can be incurred by the operator due to failures of the conveyor belt. These include not only the costs of repairing the damaged or a non-functional belt, or the procurement of replacement belts, but also the significant financial burden occurring due to the non-functionality of the device itself, i.e., the inability to perform sorting and routing of shipments in an automated manner. In this case, manual sorting takes place, which is time-consuming and prone to error, as well as various discrepancies related to human error. In addition to the financial burden related to manual labor, there are also costs related to missing the deadline for transportation, especially in time-warranted shipments, or the costs of damage caused by loss of or damage to the shipment, or its content. The functionality of the conveyor belt (maintaining its mechanical properties or anticipating changes under changing atmospheric conditions) and of course the whole sorting device, is an essential part of guaranteeing the reliability of the whole distribution process.
In many companies, the operation of a conveyor belt is significantly affected by the temperature and humidity of the hall in which the conveyor belt is mounted, as well as by the conveyor’s exposure to variations in temperature. In the studied case, a specific fragment of a conveyor was operated at various temperatures. At parcel loading and unloading, the conveyor belt was operated within a temperature range from −16 °C (257 K) to +30 °C (303 K), with a mean temperature of 11 °C (284 K), and the relative humidity (RH) ranging between 20% and 80%. These conditions are connected with, e.g., season changes.
2. Research Methodology
2.1. Experimental Material
The sorting line, the main element of which is the conveyor belt, is presented in Figure 1. The intended environmental conditions for the operation of the conveyor belt is a temperature range from 0 to +40 °C (273 K–313 K) and RH ranging from 20% to 80%), with no condensation.
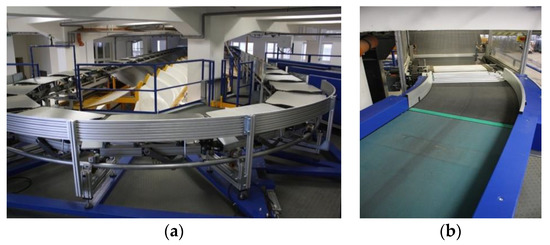
Figure 1.
(a) Sample sorting line; (b) fragment of the conveyor belt in the sorting line.
The parts of the sorting line should not be exposed to corrosive gases, organic solvents or any other chemicals. The weather conditions for the first year of sorting line operations were: average temperature: 11 °C (284 K); minimum temperature: −16 °C (257 K); maximum temperature: 30 °C (303 K); and RH: 20–80%.
The material specifications of the conveyor belt are presented in Table 1 and Table 2. The information applies at approximately 20 °C (293 K). The tested conveyor belt consists of two fabric plies made from polyester (Figure 2). The topside is made from Flexam polyvinyl chloride (PVC), and the bottom side is made from fabric. The conveyor belt was produced by Ammeraal Beltech Company (Heerhugowaard, The Netherlands) [20]. The shape and dimensions of the tested specimens are shown in Figure 3.

Table 1.
The characteristics of the conveyor belt (based on [20]).
Table 2.
Technical belt data (based on [20]).
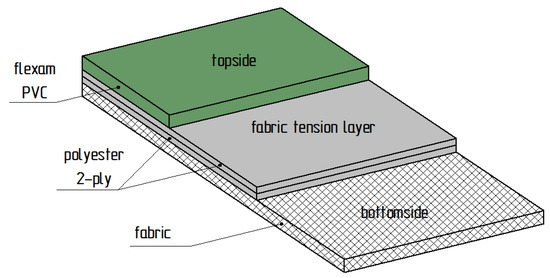
Figure 2.
Structure of the tested conveyor belt.
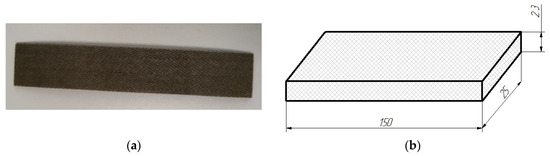
Figure 3.
Test samples: (a) view of a real sample; (b) shape and dimensions of a sample (in mm).
2.2. Testing Specimens
The test samples were exposed to different operational conditions in a climatic chamber SH-661 (product of ESPEC, Klimatest, Poland [21]) and in a thermal shock chamber STE 11 (product of ESPEC, Klimatest, Poland [21]). Detailed information on sample exposure and denotations of test variants in given operational conditions are listed in Table 3 and Table 4. A photograph of the screen showing a tested cycle is shown in Figure 4. The residence time at the temperature below 0 °C was 15 min, and the residence time in the warm chamber at the temperature above 0 °C was 15 min.
Table 3.
Sample exposure data—climatic chamber.
Table 4.
Sample exposure data—thermal shock chamber.
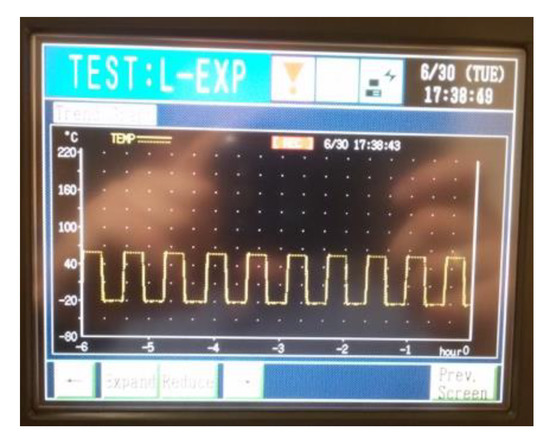
Figure 4.
Photograph of the thermal shock chamber screen showing a test cycle.
Six different tests were carried out in the climatic chamber and four different tests were carried out in the thermal shock chamber. One batch of samples was used as a reference batch and was not exposed to ageing (operational) factors. Each batch of samples subjected to tests contained 10–11 pieces.
Following curing in the chambers, the samples were subjected to exposure under ambient conditions (temperature 20 ± 2 °C (293 ± 2 K), humidity 38–40%) for 24 h. After that, they were subjected to strength tests on a ZWICK/ROELL Z150 testing machine in compliance with the standard DIN EN 10002-1 [22]. The tests were conducted using the following parameters: tensile modulus testing rate, 60 MPa/s; yield strength testing rate, 60 MPa/s; and testing rate, 0.008 MPa/s. To perform strength tests, the prepared samples were mounted in helical-wedge chucks of the testing machine [23]. The fixed joints were then subjected to tensile strength testing until their failure. The STATISTICA software (Timberlake Consultants, Ltd., Warsaw, Poland) was used for preparing adequate statistical results.
3. Results
The following strength test results were evaluated: E—tensile modulus in MPa, Rp 0.5—yield strength in MPa, Rm—maximum tensile strength in MPa, Fm—maximum tensile force in N, Agt—overall elongation at the maximum tensile force in %. For each test, 10–11 repetitions were carried out. To calculate the arithmetic mean of the obtained results, the extreme results were rejected in some variants.
3.1. Reference Specimens
The results obtained for the reference specimens, i.e., the samples that were not subjected to changing climatic ageing factors, like temperature and humidity, are listed in Table 5 and Figure 5. Values that were significantly different from the other results were rejected.
Table 5.
Results for mechanical properties (DIN EN 10002-1) of reference samples.
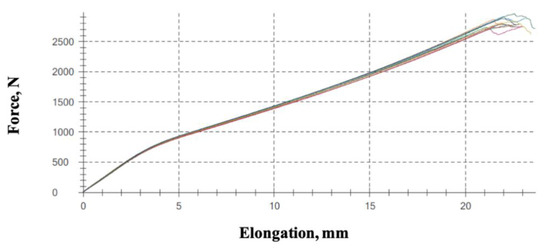
Figure 5.
Force versus elongation of conveyor belt samples.
The results of the reference samples will act as a point of reference for the results of the samples subjected to various climatic factors: temperature and humidity.
3.2. Samples Exposed to the Climatic Chamber
The mean results for the studied mechanical properties of the samples subjected to various temperatures and RH values are given in Table 6, while the force versus elongation results for some of these samples are given in Figure 6.
Table 6.
Results for mechanical properties (DIN EN 10002-1)—climatic chamber (mean values).
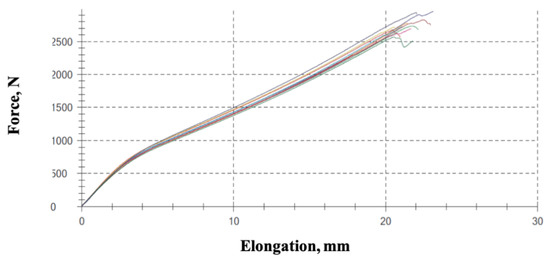
Figure 6.
Force versus elongation of conveyor belt samples, KKA-20-20.
The previous results reveal that the mechanical properties are quite similar, independently of the test conditions.
3.3. Specimens Exposed to the Thermal Shock Chamber
The results of strength tests (mean value) for the samples subjected to thermal shock testing are given in Table 7. The results of force versus elongation are given in Figure 7.
Table 7.
Results for mechanical properties (DIN EN 10002-1)—thermal shock chamber (mean values).
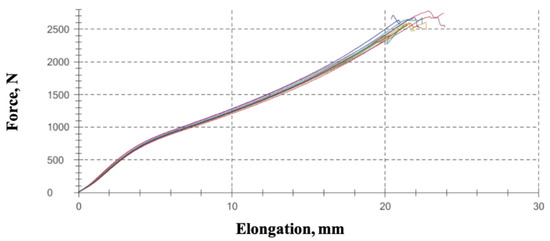
Figure 7.
Force versus elongation of conveyor belt samples, KSZ B, 1200 cycles.
The previous results reveal that the mechanical properties are quite similar, independently of the test conditions.
3.4. SEM Analysis Results
The results of SEM analysis for the selected specimens are presented in Figure 8, Figure 9, Figure 10, Figure 11 and Figure 12. The characteristics of reference samples are presented in the SEM images (Figure 8). The topside is the characteristic view of the Flexam PVC surface (Figure 8a). The bottom side is fabric (Figure 8b), and the cross-section of the conveyor belt sample with two fabric tension layers is presented in Figure 8c.
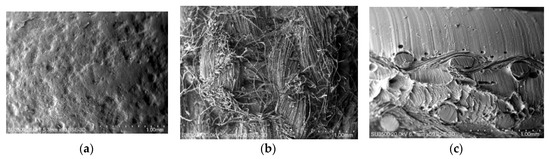
Figure 8.
SEM images of: (a) topside of Flexam PVC surface; (b) bottom side of fabric surface; (c) cross-section of a reference sample.
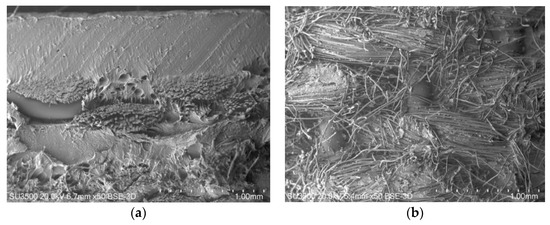
Figure 9.
SEM images of: (a) cross-section, (b) bottom side of material samples for KKA 30-20 test variant.
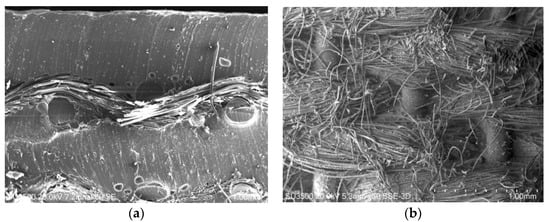
Figure 10.
SEM images of: (a) cross-section, (b) bottom side of material samples for KKA 30-80 test variant.
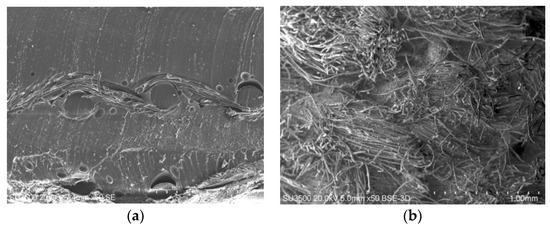
Figure 11.
SEM images of: (a) cross-section; (b) bottom side of material samples for KKA 80-80 test variant.
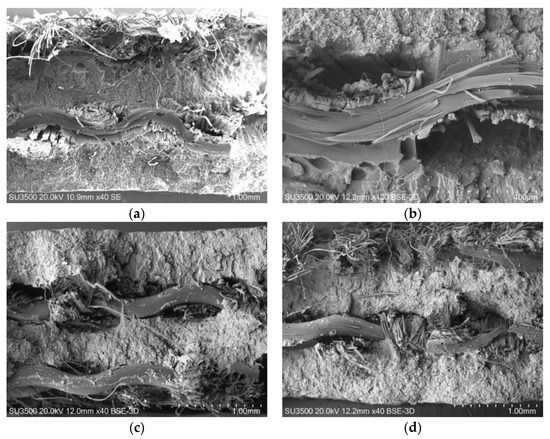
Figure 12.
SEM images view of cross-section after the failure of material samples subjected to the thermal shock chamber tests: (a) KSZA; (b) KSZB; (c) KSZC and (d) KSZD.
The plain weave of polyester fabric can be noticed in Figure 8. In the plain weave, each warp thread is interwoven and intersects with each weft thread, and thus the fabric is tightly bound and rigid. This is crucial information, because the characteristics of the used fabric (the direction of and the position of the fibers) dramatically affects the strength of the composite materials—in this case, the conveyor belt. Such information regarding the type of the polyester fabric weave was not provided by the producer in the characteristics of the conveyor belt.
The SEM images presented in Figure 9, Figure 10 and Figure 11 show the cross-section and bottom side of the samples of the materials of the selected variants subjected to exposure to various temperatures and values of humidity. The destruction of some of the external weft of the fabric can be observed in the bottom side materials in the presented variants. The cross-section presents the weave of the polyester fabric and also the Flexam PVC material. The failure of the polyester material (Figure 10a) can be noticed. Much more destruction of the bottom side of samples subjected to the climatic chamber can be noticed compared with the reference samples.
The SEM images of the cross-section after the failure of the material samples subjected to the thermal shock chamber tests (Figure 12) exhibit much more failure (fiber failure) than the samples subjected to the climatic chamber exposure. The thermal shock affects the failure much more than the climatic conditions. The thermal shock causes more catastrophic failure.
3.5. Views after the Failure
Views of the samples after tensile strength testing are shown in Figure 13 and Figure 14. It can be observed that the failure shown in Figure 13 is almost the same for all the tested samples (except 80-80).
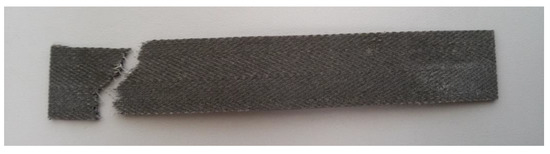
Figure 13.
KKA-20-20 sample after tensile strength testing.
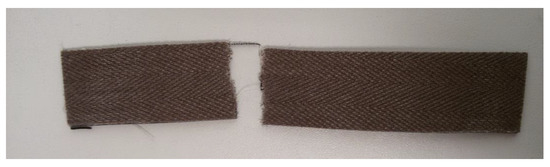
Figure 14.
KKB-80-80 sample after tensile strength testing.
Only the samples exposed to the temperature of 80 °C (353 K) and RH of 80% (Figure 14) have a slightly different type of failure (a failure point and a sample shape) compared to that observed in the samples subjected to other ageing variants.
It can be presumed that further studies should be conducted in this direction (lengthwise direction), even though the conveyor belt tape is not subjected to operation at temperatures exceeding 30 °C (303 K).
4. Comparison of Results and Discussion
4.1. Specimens Exposed in the Climatic Chamber
The test results for the samples exposed to different conditions in the climatic chamber are given in Figure 15.
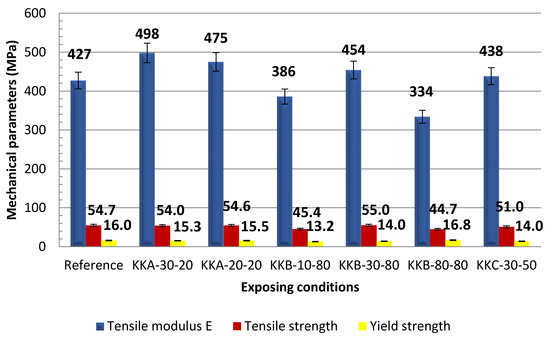
Figure 15.
Mechanical parameters of samples tested in the climatic chamber.
The results of tensile modulus for samples subjected to ageing under different climatic conditions demonstrate that the highest tensile modulus can be observed for the samples exposed to a temperature set to −30°C (303 K) (KKA-30-20). In the case of samples exposed to a temperature of −20 °C (253 K) (KKA-20-20) for 14 days, E decreased by about 5%. It can be observed that below 0 °C temperatures in the Celsius scale have no negative effects on the tensile modulus compared to the tensile modulus of the reference samples.
The lowest E was recorded for the samples subjected to ageing at a temperature of 80 °C (353 K) and a RH of 80% (KKA-80-80): 334 MPa. A higher value of E was obtained for the samples subjected to exposure to the same RH, but at a lower temperature set to 10 °C (283 K) (KKA-10-80). In the case of KKA-10-80, the value of E was 85% of the value of module E of the samples exposed to a higher temperature (KKA-30-80).
It can also be observed that for two cases of ageing at the same temperature of 30 °C (303 K), but at two different RH values: 80% and 50%, the tensile modulus differed by 3%.
Summing up the tensile modulus results, it can be observed that:
- higher values of E were obtained for exposure at below 0 °C temperature in the Celsius scale (decreasing values of the minus temperature does not have a negative effect on tensile modulus),
- among the tested variants, ageing produces the least desired results at a temperature of 80 °C (353 K) and at an RH of 80%;
- an increase in the above 0 °C temperature in the Celsius scale leads to a decrease in tensile modulus,
- a decrease in humidity with the temperature remaining the same leads to a slight decrease in E (KKB-30-80 and KKC 30-50),
- in most cases, the reference samples have a lower E, ranging between 3% and 10%, than samples tested in the climatic chamber, except for two ageing variants—KKB-10-80 and KKB-80-80—where E was lower by 10% and 22% than the reference sample, respectively.
Examining the effect of ageing conditions on tensile strength of the tested conveyor belt samples, it was observed that:
- the highest tensile strength was obtained for three ageing cases, two of them involving exposure at a below 0 °C temperature in the Celsius scale,
- the lowest tensile strength was obtained for samples exposed at a temperature of 80 °C (353 K) and an RH of 80% (KKA-80-80),
- decreasing humidity and maintaining the ageing temperature unchanged (KKC-30-50) leads to a 7% decrease in the tensile strength compared to exposing at a humidity of 80% (KKB-30-80),
- in the majority of cases, the tensile strength is lower compared to the tensile strength of the reference samples; in the three cases KKA-20-30, KKA-20-20 (exposing at minus temperature) and KKB-30-80, the obtained tensile strength had the same value. It can be observed that temperature below 0 °C in the Celsius scale does not have a negative effect on the tensile strength compared to the tensile strength of the reference samples, but it is difficult to determine the effect of temperature or humidity on strength unanimously. The coefficient of correlation (ρ) between the strength and the temperature is ρ = −0.58 while that between strength and humidity is ρ = −0.66, which can indicate that humidity has a higher effect on the belt’s tensile strength than temperature.
- the results for the negative temperature can be explained by the fact that lowering the temperature results in a more exponential behavior of the glassy-brittle state, such as increased stiffness and reduced deformability. A low temperature (above 0 °C) contributes to the fact that polymers behave like vitrified glass bodies with high stiffness, which have already been damaged by a slight deformation and exhibit resilience characteristics, and in particular the presence of reversible deformations, most often increasing proportionally to the increase in stress. The results of this study confirm that the Young’s modulus of polymeric plastics is significantly higher at low temperatures compared to room temperature [24,25,26,27].
As for yield strength (Figure 15), it can be observed that the reference samples (except one case, KKB-80-80) have a higher yield strength Rp0,5. The lowest yield strength was obtained for exposure at a temperature of 10 °C (303 K) and a humidity of 80% (KKA-10-80). Therefore, it can be concluded that exposure under these conditions leads to decreased yield strength, thereby decreasing the plastic properties of the belt. In addition, it was observed that the parameter Agt, i.e., total elongation at the highest tensile force, has similar values for the tested variants of ageing.
Most polymers have low humidity, but there are exceptions. Increased humidity causes the consumption of raw material during processing and exposes the producer to losses. Some polymeric materials absorb water or moisture from the air. An increase in the water content of the material increases the impact strength and elasticity but reduces the strength. However, it should be remembered that the absorption of water is also associated with increasing the volume of the material, and thus the dimensions of the elements, which may lead to incompatibility of construction dimensions, adversely affecting the work of the element. It can be seen (Figure 15) that an increase in humidity causes a decrease or increase in some mechanical parameters, but this is a more complex phenomenon, as it is also associated with the seasoning temperature.
Comparing the results of tensile modulus and tensile strength of the samples exposed to the constant humidity of 80% and at different temperatures—10 °C (283 K), 30 °C (303 K), 80 °C (353 K) (Figure 16)—it can be observed that the highest tensile strength was obtained for exposure at a humidity of 80% and at a temperature of 30 °C (303 K). When both lower and higher temperatures are applied, the tensile strength significantly decreases by 15% and by 26%, respectively.
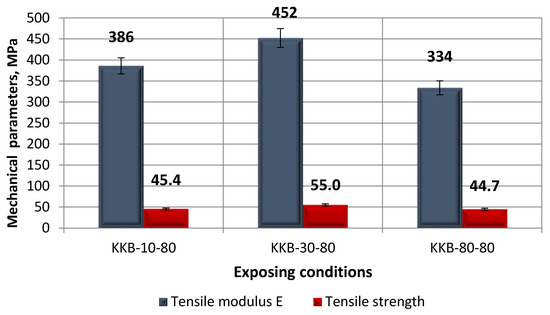
Figure 16.
Tensile modulus and tensile strength of samples exposed to selected ageing variants.
Some statistical results (correlation coefficient) of the tensile modulus for the samples subjected to ageing in different climatic conditions and for reference samples are presented in Table 8. In the analysis, the Pearson correlation coefficient was used. Some information regarding the correlation coefficient was presented in [28].
Table 8.
The correlation coefficient of the tensile modulus obtained in various ageing variants and in the reference condition (for significance coefficient p < 0.05).
Based on the correlation of the coefficient results presented in Table 8, the following observations can be made:
- comparing the results of the tensile modulus for the samples subjected to ageing under different climatic conditions and for reference samples, in the majority of cases, a correlation between the value of tensile modulus and the ageing conditions (considering both temperature and humidity) could not be observed,
- in some cases, a correlation (both positive and negative) was observed, but the correlation is not strong. For example, the negative correlation of the tensile modulus for the samples KKB-10-80 and KKB-80-80 subjected to ageing at the same relative humidity (80%), but at different temperatures (10 °C (283 K) and 80 °C (353 K)); the correlation coefficient here was −0.7128, indicating the negative influence of the higher temperature on the value of the tensile modulus. This means that an increase in the temperature leads to a decrease in the tensile modulus in the case of high humidity (80%).
The obtained results indicate that in most comparisons between variants of ageing, a correlation between the tensile modulus results in the various test variants was not observed. In some cases, a correlation was observed, but it was not strong.
The statistical results of the tensile strength for the samples subjected to ageing in different climatic conditions and for the reference samples are presented in Table 9.
Table 9.
The correlation coefficient of the tensile strength obtained under various ageing variants and in the reference condition (for significance coefficient p < 0.05).
The following observations can be made based on the statistical results presented in Table 9:
- a strong positive correlation (the correlation coefficient is 0.9190) was observed for KKB-30-80 and KKC-30-50, where the samples were exposed to the same temperature (30 °C-303 K), but in different humidities (50% and 80%).
- a correlation between the value of tensile strength and the ageing conditions (considering both temperature and humidity) in the majority of variants of ageing in different climatic conditions cannot be observed.
4.2. Samples Exposed in the Thermal Shock Chamber
A comparison of the results obtained for the samples tested in the thermal shock chamber with the application of a varying number of cycles is shown in Figure 17.
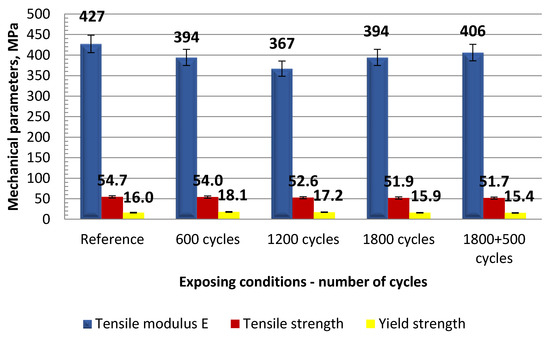
Figure 17.
Strength parameters of samples exposed in the thermal shock chamber.
The results (Figure 17) demonstrate that the tensile modulus is similar in the majority of the tested cases. Only when the samples were exposed to 1200 cycles, did this lead to the lowest value of E being achieved, amounting to 367 MPa, which is 90% of the highest tensile modulus obtained for variant IV (1800 cycles and 500 cycles). In other cases, the difference is about 3%. It can, therefore, be observed that the number of curing cycles does not affect the tensile modulus of the tested materials. Nonetheless, compared to the reference samples (i.e., those that were not exposed to varying temperature), the exposure to thermal shock led to a decrease in E by 8%, 14%, 8% and 5%, respectively. In other words, the test samples exposed to thermal shock had lower properties (tensile modulus) compared to the reference samples.
Analyzing the results, it can also be observed that the tensile strength results do not differ much in terms of the number of curing cycles of the samples in the thermal shock chamber. The maximum tensile strength is 54 MPa, and the lowest is 51.7 MPa, which is a difference of over 4%. However, one can see that tensile strength tends to decrease with the increasing number of curing cycles of the samples in the thermal shock chamber, particularly when compared to the tensile strength of the reference samples. It was observed that the tensile strength of the reference samples was higher than that of the samples exposed to thermal shocks. Although the differences were not significant, the above-mentioned trend could be observed.
Concerning the yield strength, a trend can be observed whereby the yield strength decreases with increasing numbers of cycles of the samples exposed in the thermal shock chamber. The difference between the highest and the lowest yield strength is 3.6 MPa, which amounts to almost 20% of the maximum value. The highest yield strength, 18.1 MPa, was obtained for the ageing of the samples in the climatic chamber for 600 cycles (−20 °C/+60 °C) (253–333 K), while the lowest was obtained for KSZ D (1800 + 500 cycles). Comparing these results with those of the reference samples, it can be observed that the yield strength of the samples exposed to a reduced number of cycles was lower, while the yield strength of the test samples is lower than that of the reference samples with increasing numbers of cycles.
The correlation coefficient results of the tensile modulus for the samples subjected to ageing under different thermal shock conditions and for reference samples are presented in Table 10, and in Table 11 the results refer to the tensile strength.
Table 10.
The correlation coefficient of tensile modulus obtained in various ageing variants under thermal shock conditions and in the reference condition (for significance coefficient p < 0.05).
Table 11.
The correlation coefficient of tensile strength obtained in various ageing variants under thermal shock conditions and in the reference condition (for significance coefficient p < 0.05).
The following observations can be made based on the statistical results presented in Table 10:
- in comparison to the correlation between the value of tensile modulus in the thermal shock conditions and the reference variant, the strongest correlation can be seen in the case of KSZ B; in this case, a strong negative correlation (the correlation coefficient is 0.9888) was observed for KSZ B and the reference variant. This means that an increase in the number of cycles (1200 cycle variant of thermal shock) leads to a decrease in the tensile modulus,
- in the majority of variants of ageing under the tested thermal shock conditions, the correlation or strong correlation between the value of the tensile modulus and the thermal shock conditions cannot be observed, although in some cases, some correlation (albeit not strong) can be seen; for example, this case is presented in the variant KSZ A and KSZ B (the correlation coefficient is 0.9089).
The correlation or strong correlation between the value of the tensile strength and the thermal shock condition cannot be observed in the majority of ageing variants in the tested thermal shock conditions based on the correlation coefficient results of presented in Table 11.
Temperature, humidity and thermal shock are some of the factors that degrade polymer materials. Degradation, as defined, is a process of structural change that can be the result of physical or chemical changes occurring in polymer materials under the influence of the long-term action of various external factors. It should be noted, however, that in some cases, in the first phase of degradation, the degradation agent improves specific properties of the material, especially mechanical strength. This is done by additional cross-linking of the material structure under the influence of, for example, heat. It is only during the further action of degradation factors that the properties deteriorate due to various processes, e.g., excessive cross-linking or molecular weight reduction.
5. Conclusions
A comparison of the experimental results for the samples subjected to various ageing conditions reveals different relationships regarding the climatic chamber and the thermal shock chamber results, as well as different strength parameters.
The results indicate that:
- at various values of temperature and humidity, the observed relationships were different from those observed for the reference samples.
- many strength parameters were undesirable with respect to the required values (in the tested variants) at temperatures of 10 °C (282 K) and 80 °C (353 K) at a humidity of 80%.
- tensile strength, tensile modulus and yield strength (and other variables) were higher at below 0 °C temperatures than at above 0 °C temperatures in the Celsius scale. It can, therefore, be concluded that below 0 °C temperatures do not have a negative effect on the mechanical properties of the conveyor belt samples. However, it is difficult to unequivocally determine the effects of temperature and humidity with respect to the reference samples, although temperature can have a more significant effect than humidity.
- thermal shocks affect some of the mechanical properties of the conveyor belt; for example, some mechanical properties of the tested materials decreased with the increasing number of cycles. A trend could be observed in which the mechanical properties decrease with increasing exposure time of the samples to thermal shock. The observed trend of an increase in the tensile modulus can lead to lower elastic deformation of the tested conveyor, which can be reflected in changes in its dimensions, affecting the operation of the conveyor belt throughout the entire line, and also with respect to other devices.
- the SEM analysis of the cross-section and surface of the bottom side of the fabric indicates that thermal shock affects the failure much more than climatic conditions.
In summary, thermal shock had a more significant effect on the mechanical properties of the samples than temperature and humidity combined. It is worth emphasizing the known fact that a temperature below 0 °C does not lead to a decrease in the mechanical properties of the conveyor belt.
It is recommended that further studies be conducted to determine the effect of higher ranges of factors such as changes in temperature and humidity and thermal shock.
The resulting research could serve as input and impetus for further research and subsequent innovations of the material composition of belts used in similar conditions, such as halls of distribution or logistical centers. The presented research results will also help the users of test belts to regulate atmospheric conditions in a suitable way on their own premises on which conveyor belts are installed, in order to achieve the optimum functionality and lifespan of the conveyor belt.
Author Contributions
Conceptualization, A.R. and R.M.; methodology, A.R.; validation, A.R., L.M. and P.D.; investigation, A.R.; resources, R.M. and L.M.; writing—original draft preparation, A.R.; writing—review and editing, R.M.; visualization, A.R. and P.D.; supervision, A.R.; project administration, L.M.; funding acquisition, R.M. All authors have read and agreed to the published version of the manuscript.
Funding
This research was funded by VEGA, grant number 1/0721/18.
Acknowledgments
The authors thank the Direct Parcel Distribution SK s.r.o. for providing the testing samples and for the technical assistance.
Conflicts of Interest
The authors declare no conflict of interest.
References
- Andrejiova, M.; Grincova, A.; Marasova, D. Measurement and simulation of impact wear damage to industrial conveyor belts. Wear 2016, 368, 400. [Google Scholar] [CrossRef]
- Anand, S.C.; Brunnschweiler, D.; Swarbrick, G.; Russell, S.J. Mechanical bonding. In Handbook of Nonwovens; Russell, S.J., Ed.; Woodhead Publishing Limited: Cambridge, UK, 2007; pp. 255–294. [Google Scholar]
- Montgomery, D.C. Design and Analysis of Experiments, 6th ed.; Willey: Hoboken, NJ, USA, 2005. [Google Scholar]
- Hicks, C.R. Fundamental Concepts in the Design of Experiments, 4th ed.; Oxford University Press: Oxford, UK, 1993. [Google Scholar]
- Wootton, D.B. The Application of Textiles in Rubber; Rapra Technology Ltd.: Shawbury, UK, 2003. [Google Scholar]
- Rudawska, A. Influence of the thickness of joined elements on lap length of aluminium alloy sheet bonded joints. Adv. Sci. Technol. Res. J. 2015, 9, 35. [Google Scholar] [CrossRef]
- Ambrisko, L.; Marasova, D.; Grendel, P. Determination the effect of factors affecting the tensile strength of fabric conveyor belts. Eksploat. Niezawodn. Maint. Reliab. 2016, 18, 110. [Google Scholar] [CrossRef]
- Tausif, M.; Russell, S.J. Characterisation of the z-directional tensile strength of composite hydroentangled nonwovens. Polym. Test. 2012, 31, 944. [Google Scholar] [CrossRef]
- Koo, H.-J.; Kim, Y.-K. Reliability assessment of seat belt webbings through accelerated life testing. Polym. Test. 2005, 24, 309. [Google Scholar] [CrossRef]
- Rudawska, A. Strength of adhesive joint of epoxy composites with dissimilar adherends. Int. J. Fract. Fat. Wear 2014, 2, 25. [Google Scholar]
- Wang, S.; Li, Q.; Zhang, W.; Zhou, H. Crack resistance test of epoxy resins under thermal shock. Polym. Test. 2002, 21, 195. [Google Scholar] [CrossRef]
- Barburski, M.; Goralczyk, M.; Snycerski, M. Analysis of changes in the internal structure of pa6.6/pet fabrics of different weave patterns under heat treatment. Fibres. Text East. Eur. 2015, 23, 46. [Google Scholar]
- Drozdziel, P.; Komsta, H.; Krzywonos, L. An analysis of the relationships among selected operating and maintenance parameters of vehicles used in a transportation company. Transp. Probl. 2011, 4, 93. [Google Scholar]
- Bocko, P.; Marada, O.; Bouda, T. Material and Component Testing of Conveyor Belts and its Numerical Analyses. In Proceedings of the 54th International Conference of Machine-Design-Departments, Hejnice, Czech Republic, 10–12 September 2013; pp. 565–571. [Google Scholar]
- Goltsev, V.Y.; Markochev, V.M. Comparative Analysis of Methods for Testing Materials for Fatigue Cracking Resistance. Atom. Energy 2015, 118, 17. [Google Scholar] [CrossRef]
- Liu, X.; Pang, Y.; Lodewijks, G. Theoretical and experimental determination of the pressure distribution on a loaded conveyor belt. J. Int. Measur. Confed. 2016, 77, 307. [Google Scholar] [CrossRef]
- Molnar, W.; Nugent, S.; Lindroos, M.; Apostol, M.; Varga, M. Ballistic and numerical simulation of impacting goods on conveyor belt rubber. Polym. Test. 2015, 42, 1. [Google Scholar] [CrossRef]
- Nedbal, J.; Neubert, M.; Velychko, V.; Valentova, H. Conveyor belt rubber aging measured by dielectric spectroscopy. In Proceedings of the 11th International Multidisciplinary Scientific Geoconference, Albena, Bulgaria, 20–25 June 2011; Volume I, pp. 751–757. [Google Scholar]
- Petrikova, I.; Marvalova, B.; Tuan, H.S.; Bocko, P. Experimental evaluation of mechanical properties of belt conveyor with textile reinforcement and numerical simulation of its behavior. In Proceedings of the 8th European Conference on Constitutive Models for Rubbers, San Sebastian, Spain, 25–28 June 2013; pp. 641–644. [Google Scholar]
- Ammeraal Beltech’s Specific Brochure. Available online: http://www.ammeraalbeltech.com (accessed on 2 September 2018).
- Klimatest. Available online: http://www.klimatest.eu/katalog/leaflets/espec/ESPEC_seria_S_v2_2.pdf (accessed on 2 September 2018).
- DIN EN 10002-1. Tensile Testing of Metallic Materials. Method of Test at Ambient Temperature; European Committee for Standardization: Brussels, Belgium, 2001.
- Rudawska, A.; Warda, T. Test System for Lap-Joints Testing. PL Patent W.123189; filled 23 June 2014, 1 March 2016. [Google Scholar]
- Fu, S.-Y. Cryogenic Properties of Polymer Materials Chapter 2. In Polymers at Cryogenic Temperatures; Kalia, S., Fu, S.-Y., Eds.; Springer: Heidelberg, Germany, 2013; pp. 9–39. [Google Scholar]
- Yano, O.; Yamaoka, H. Cryogenic properties of polymers. Prog. Polym. Sci. 1995, 20, 585. [Google Scholar] [CrossRef]
- Gradt, T.; Borner, H.; Hubner, W. Low Temperature Tribology at the Federal Institute for Materials Research and Testing (BAM). Available online: http://esmats.eu/esmatspapers/pastpapers/pdfs/2001/gradt.pdf (accessed on 25 October 2018).
- Perepechko, I. Low-Temperature Properties of Polymers; Pergamon: Moscow, Russia, 1980. [Google Scholar]
- Rudawska, A.; Danczak, I.; Müller, M. The effect of sandblasting on surface properties for adhesion. Int. J. Adhes. Adhes. 2016, 70, 176. [Google Scholar] [CrossRef]
© 2020 by the authors. Licensee MDPI, Basel, Switzerland. This article is an open access article distributed under the terms and conditions of the Creative Commons Attribution (CC BY) license (http://creativecommons.org/licenses/by/4.0/).