Abstract
Among various carbon capture and storage technologies to mitigate global warming and ocean acidification due to greenhouse gases, ocean geological storage is considered the most feasible for Korea due to insufficient inland space to store CO2. However, the risk of CO2 leakage and the behavior and environmental effects of the leaked CO2 need to be assessed for its successful implementation. Therefore, the behavior of CO2 bubbles/droplets dissolving into the surrounding seawater and the diffusion of dissolved CO2 by ocean flows should be accurately predicted. However, finding corresponding research has been difficult in Korea. Herein, the behavior and convection-diffusion of CO2 that was assumed to have leaked from the seafloor near the southeastern coast of Korea were numerically predicted using a multi-scale ocean model for the first time. In the simulation region, one of the pilot projects of CO2 ocean geological storage had started but has been temporarily halted. In the ocean model, hydrostatic approximation and the Eulerian–Lagrangian two-phase model were applied for meso- and small-scale regions, respectively. Parameters for the simulations were the leakage rate and the initial diameter of CO2. Results revealed that all leaked and rising CO2 bubbles were dissolved into the seawater before reaching the free surface; further, the change in the partial pressure of CO2 did not exceed 500 ppm during 30 days of leakage for all cases.
1. Introduction
Carbon capture and storage (CCS) is one of the technologies used to mitigate global warming and ocean acidification. Various CCS methods are available and can be categorized into inland or ocean geological storage, direct injection and so on. Among these, only inland and ocean geological storage are considered viable following the prohibition of the direct injection method due to its uncertain environmental impacts. CO2 geological storage is a method for capturing CO2 from power plants or industrial processes without releasing it into the atmosphere, transporting it to sites suitable for geological storage, and storing it stably underground for the long term. Furthermore, it has the advantage of large-scale CO2 reduction. Geological storage has been mainly carried out in countries with sufficient inland storage space. However, for countries with limited inland space such as Korea, Japan, Norway, and the United Kingdom, ocean geological storage is considered the most feasible option.
The Sleipner CO2 injection project in Norway was the world’s first industrial offshore CO2 ocean geological storage project, through which more than 16 Mt of CO2 was injected from 1996 to 2014. The injection rate was approximately 0.9 Mt/y during the early years and reduced slightly during later years due to reduced gas flow from the Sleipner Vest [1,2]. From 2008 to 2012, 1.6 Mt of CO2 was injected into the Snøhvit gas field. Although the injection was occasionally halted due to operational challenges at the LNG plant during that period, approximately 0.5 Mt of CO2 was stored in the well, and injection has continued since 2011 [3]. A large-scale CCS demonstration project in Japan’s Tomakomai area, which can store 0.1 Mt/y of CO2 in two reservoirs that lie 1100 m and 2400 m below the seabed, is being undertaken by the Japanese government [4]. In the case of Korea, a CO2 storage project that can store 1 Mt/y was being constructed near the southeastern coast of Korea, but was temporarily stopped in 2018.
To utilize any kind of CCS technology, public acceptance must be ensured through the risk assessment of CO2 leakage, monitoring the behavior of leaked and dissolved CO2 (DCO2), and environmental assessment of the leaked CO2. The Quantifying and Monitoring Potential Ecosystem Impacts of Geological Carbon Storage (QICS) project in the UK was created to assess the environmental impact of CO2 release experiments in Ardmucknish Bay [5]. Sellami et al. [6] investigated the dynamics of leaked CO2 bubbles in a plume in the bay through observational data obtained from the QICS project. Because of the limitations of field experiments, studies utilizing computational fluid dynamics (CFD) have been carried out to estimate the behaviors of leaked CO2 and DCO2. The highly complex phenomena that occur when liquid CO2 is injected into the deep ocean was numerically studied by Eulerian-Eulerian two-phase CFD simulations by Alendal and Drange [7] and Eulerian–Lagrangian simulations by Sato and Sato [8]. Jeong et al. [9] developed a multi-scale ocean model, which builds a bridge between smaller near-field scale and larger regional-scale models to predict the fate of DCO2 in the deep ocean. Kano et al. [10] conducted numerical simulations on the behavior of CO2 bubbles and droplets leaked from the seafloor into water columns in uniform flows perpendicular to the leakage band. They showed that CO2 dissolved in seawater before returning to the air under their simulation conditions, which indicates that the ocean can play the role of a buffer that does not allow CO2 to return to the atmosphere. Kano et al. [11] developed a multi-scale numerical method to predict the behavior of dissolvable CO2 bubbles leaked from the seafloor and dissolved mass in the ocean. A simulation using this model was conducted with real topography and tidal currents near the Japanese coastline. Mori et al. [12] used the model developed by Kano et al. [11] and conducted case studies in which the ratio of CO2 seepage in the dissolved phase and the proportion remaining in the sediment were changed to predict CO2 concentration distributions in Ardmucknish Bay. However, in Korea, finding corresponding research has been difficult, and the few studies, such as that by Kang et al. [13], have only focused on the behavior inside CO2 reservoirs and interactions between the reservoir and the surface of seabed through the fault. Such studies cannot be applied to consider ocean flows nor assess environmental impacts in the ocean.
In this study, the behavior and convection-diffusion of CO2, which was assumed to have leaked from the seafloor near the southeastern coast of Korea, where a pilot project of CO2 ocean geological storage started but was temporarily stopped, were numerically predicted using a multi-scale ocean model for the first time. In the ocean model, hydrostatic approximation and Eulerian–Lagrangian two-phase models were applied for the meso- and small-scale regions, respectively. Numerical simulations involving changes in the main parameters, such as the initial diameter of CO2 and leakage rate, were carried out to investigate its effects on the simulation results, especially regarding environmental impacts.
2. Methodology
The multi-scale ocean model used in this study is an improved version of the original Maritime Environment Committee (MEC) ocean model developed by the Japan Society of Naval Architecture and Ocean Engineers (JASNAOE). In the MEC model, hydrostatic approximation and non-hydrostatic (i.e., full-3D) models are applied for the meso- and small-scale domains, respectively. In the mesoscale domain, tidal flow is generated under hydrostatic (pressure) approximation to reduce the computational time. The applicability and accuracy of the hydrostatic model of the MEC model can be found in the research of Kano et al. [11], Lee et al. [14], and so on. A full-3D small-scale model is necessary when the vertical flow component cannot be ignored. The spatial connection between the two models is such that the full-3D model domain matches one grid-column of the hydrostatic model. Kano et al. [11] modified the MEC model by adopting a two-phase model for the small-scale domain, where the continuous liquid phase (seawater) and dispersed gas/liquid phase (individual CO2 bubble/droplet) are solved using Eulerian and Lagrangian methods, respectively. This model, hereafter termed the “MEC-CO2 model”, was used in the present study.
The governing equations of the mesoscale model adopting the hydrostatic approximation are as follows.
where , and are the velocity components in the , , and directions, respectively. , , , and f are the pressure, density of seawater, gravity acceleration, and Coriolis force coefficient, respectively. and are the horizontal and vertical eddy viscosities, respectively.
The transport equations of scalar properties (i.e., temperature (T), salinity (S), and DCO2 (C)) are as follows:
where and are the horizontal and vertical eddy diffusivities, respectively.
As mentioned earlier, the Eulerian–Lagrangian two-phase model is applied for small-scale full-3D regions. The continuity and Navier–Stokes equations for the continuous phase are as follows:
where,
where is the volume fraction and is the velocity vector. , , and are the number of bubbles in a computational cell, volume, and the volume of a computational cell, respectively. is the mass transfer from a bubble at the interface and is the pressure. and are the thermal diffusivity and kinematic viscosity, respectively. The subscripts c and d denote the continuous water phase and dispersed CO2 bubble phase, respectively. and are given by Pitzer and Sterner [15] and Alendal and Drange [7], respectively, and is determined by Smagorinsky’s model [16].
The transport equations of , , and are also solved as given below:
where and are at the bubble surface and in a computational cell, respectively. is the diffusion coefficient. and are the turbulent Prandtl and Schmidt numbers, respectively. Hirai et al. [17] found that matches the solubility of CO2, which was measured by Weiss [18]. The mass transfer rate is modeled as in Chen et al. [19] and is the equivalent diameter of a bubble.
For the dispersed phase, the mass conservation and motion equation are solved for each bubble in the Lagrangian frame as:
where,
where is the coefficient of the added mass of a bubble and is the gravity vector. , , and , are the drag and lift forces and the coefficients of a bubble, respectively. is the relative velocity of the dispersed phase to the continuous phase, and is the vorticity of a bubble. and are both set to 0.5. The details on the modeling of a bubble can be found in [19].
The governing equations were discretized by the finite volume method using orthogonal and staggered grids: velocity components were defined at the cell faces, and the other variables were defined at the cell centers. For spatial discretization, third-order up-winding and second-order central differencing schemes were adopted for the advection and diffusion terms, respectively. The second-order Adams–Bashforth method was used for the time integration in the full-3D model.
3. Simulation Conditions
Figure 1 shows the target area of the present simulations near the southeastern coast of Korea, where one of the candidate sites for CO2 ocean geological storage is located. The data for inland and seafloor topographies were obtained from the Global 30 Arc-Second Elevation Dataset (GTOPO30) of the United States Geological Survey’s Earth Resources Observation and Science Center and the JODC-Expert Grid Data for Geography-500m (J-EGG500) of the Japan Oceanographic Data Center, respectively. Grid systems for the mesoscale domain were generated using the preprocessor of the MEC model with these data. The dimensions of the computational domain were approximately 100 km × 50 km × 1 km, and the number of grid cells were 50 × 50 × 63 in the x, y, and z directions, respectively, as shown in Figure 2a. The vertical cell column contains the full-3D small-scale domain, of which the size is 2 km × 1 km × 0.18 km with 100 × 100 × 28 grid cells and is shown by a closed cell in Figure 2b. The vertical grid levels are listed in Table 1, where layers 1 and 28 match the free surface and the depth of CO2 leakage, that is, 190 m, respectively.
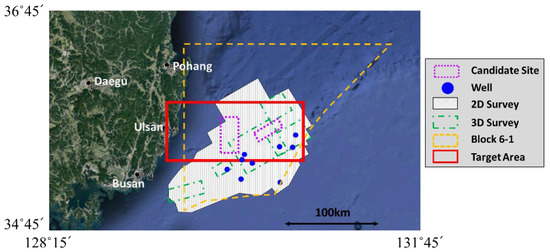
Figure 1.
Target area for numerical simulation (source: https://www.google.com/maps).
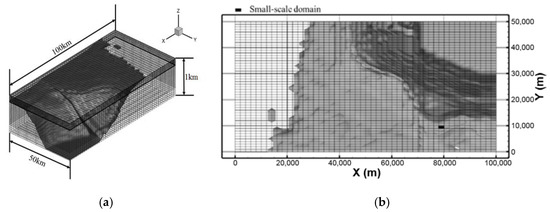
Figure 2.
(a) Perspective and (b) horizontal view of grid systems (one cell filled with black color in the mesoscale domain is the computational domain for the full-3D small-scale domain).

Table 1.
Layer numbers, thicknesses, and depths of vertical grids.
To reproduce proper ocean flows, the major tidal components of M2, O1, K1, and S2, which were obtained from the NAO99b model [20] and listed in Table 2, were interpolated and imposed on the open boundaries of the mesoscale model domain with nonreflecting boundary conditions by Hino and Nakaze [21].

Table 2.
Tidal components used for open boundary conditions.
Figure 3 shows the initial conditions of T, S, and DCO2 obtained from the data of the Array for Real-time Geostrophic Oceanography project by the National Institute of Meteorological Sciences of Korea (http://argo.nims.go.kr).
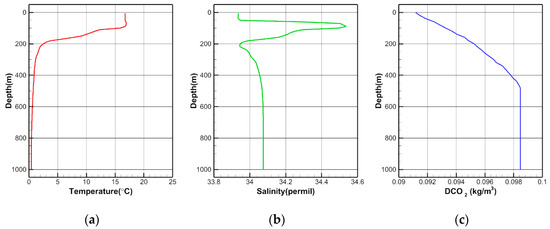
Figure 3.
Initial conditions of (a) temperature, (b) salinity, and (c) DCO2.
To calculate the fluxes of temperature and salinity at the free surface, climate data, which were the temporal average of observed data by the National Aeronautics and Space Administration (NASA, https://power.larc.nasa.gov/data-access-viewer/), were used, as depicted in Table 3.

Table 3.
Climate conditions.
The leakage rate and initial diameter of the CO2 bubble were selected as the main parameters. The assumed leakage rates for the present study were 3800, 50,000, and 100,000 t/y, based on the study of Kano et al. [11], where two cases for the leakage rate were studied: an extreme case, 94,600 t/y, which assumed that a large fault accidentally connected the CO2 reservoir and the seafloor; and a reasonable case, 3800 t/y, based on the seepage rate of an existing enhanced oil recovery (EOR) site [22]. The initial diameters of the CO2 bubble were set to 5, 10, and 20 mm. The simulation cases and leakage are listed and illustrated in Table 4 and Figure 4, respectively.

Table 4.
Simulation cases.
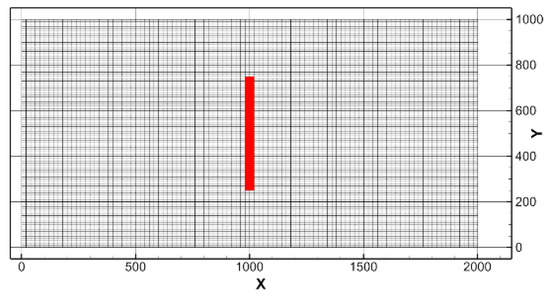
Figure 4.
Distribution of leakage area at the bottom surface of the small-scale domain, of which the horizontal grid sizes are 20 m × 10 m.
Quantitative criteria are needed to assess the environmental impact when CO2 leakage occurs. Kikkawa et al. [23] elucidated that the biological impacts of CO2 in the ocean should not be related solely to pH, but also to the partial pressure of CO2 (pCO2). Kita and Watanabe [24] collected LC50 and LT50 data against pCO2 for various marine species and proposed that the change in pCO2 (ΔpCO2) of 5000 ppm is the no-observed effect concentration (NOEC) and that 500 ppm is the predicted no-effect concentration (PNEC). Although these values have not been authorized, we refer to them as tentative standards in this study.
4. Results
Figure 5 shows the temporal change of the estimated tidal level in the full-3D domain, which is one cell of the mesoscale domain. The upper and lower envelopes are similar, and periodic patterns are observed. Inside the computational domain, complicated flows are generated owing to the interaction between tidal flows from three open boundaries and the bottom topography, as shown in Figure 6.
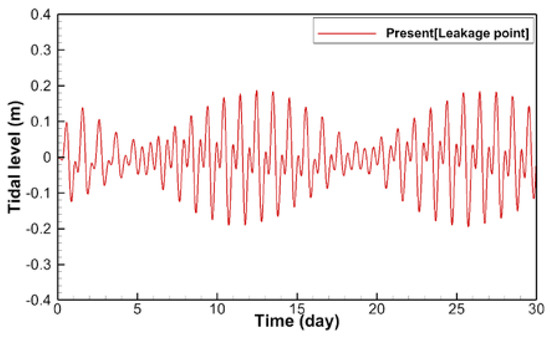
Figure 5.
Time history of calculated tidal level in a small-scale domain.
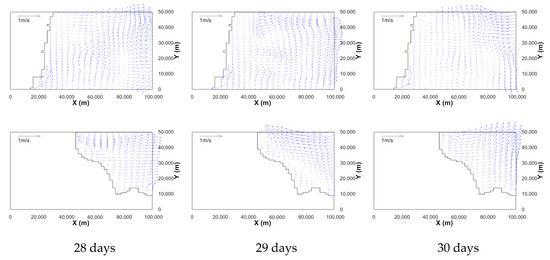
Figure 6.
Velocity vector fields on the horizontal planes (upper rows: near free surface, lower rows: z = –187 m) at 28, 29, and 30 days after the start of simulation (data are skipped by 2).
4.1. Effect of Leakage Rate (Cases 1, 2, and 3/Bubble Size = 20 mm, Leakage Area = 20,000 m)
Figure 7 shows contour maps of some variables on the center plane in the x direction (x = 1000 m) of the small-scale domain, 30 days after the start of leakage. From the distribution of void rate and cell-averaged number densities of CO2 bubbles, it can be seen that all CO2 bubbles leaking from the depth of 190 m would be dissolved at a depth of 70 m before reaching the free surface. Because the initial diameter of the CO2 bubbles are the same, but the leakage rates are different for these cases, the void rates of the bubbles near the leakage depth are higher than other depths and become lower as the depth becomes shallower due to the rising and dissolution of the bubbles to the surrounding seawater. The reason for the higher values of the number densities near the depth of 100 m is that the density of the bubbles is almost the same as that of seawater, and the volume of the bubbles is very small, which makes the buoyant force zero. Although the velocity vector fields or contour maps of the velocities are not presented, one may know that complex flows exist owing to the rising of the CO2 bubbles with surrounding seawater and tidal flows from the distribution of the DCO2 shown in Figure 7c. Since more bubbles exist and dissolution lasts for a longer time as the leakage rate increases, relatively higher values and wider areas of dispersed DCO2 are observed, as shown in the figure. Comparing the contour maps of DCO2 with those of the changes in DCO2 (ΔDCO2) due to the dissolution of the bubbles, no large discrepancy is observed because the background DCO2 is much smaller.
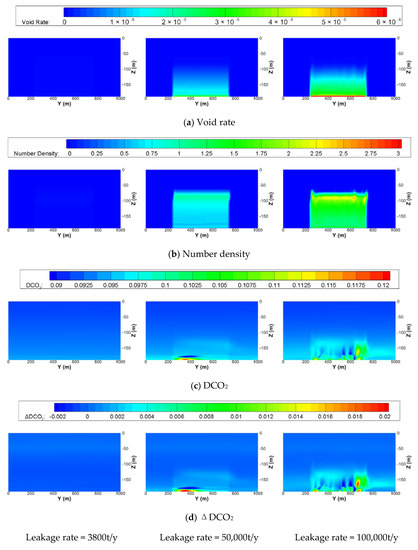
Figure 7.
Contour maps of (a) void rate, (b) number density of undissolved CO2 bubbles, (c) DCO2, and (d) ΔDCO2 on the center plane in the x direction (x = 1000 m) of the small-scale domain at 30 days after the start of leakage with the same initial diameter of bubble of 20 mm and leakage area of 20,000 m2 but different leakage rates.
The contour maps of ΔpCO2 on the center planes of the x, y, and z directions of the small-scale domain are depicted in Figure 8, where not only the diffusion but also the advection of ΔpCO2 by the tide are clearly shown. A high ΔpCO2 is observed near the leakage depth, and the maximum ΔpCO2 is lower than 200 ppm and does not exceed the PNEC. It can also be seen that the distributions of ΔpCO2 shown in Figure 8a are similar to those of ΔDCO2 on the same plane (Figure 7c).
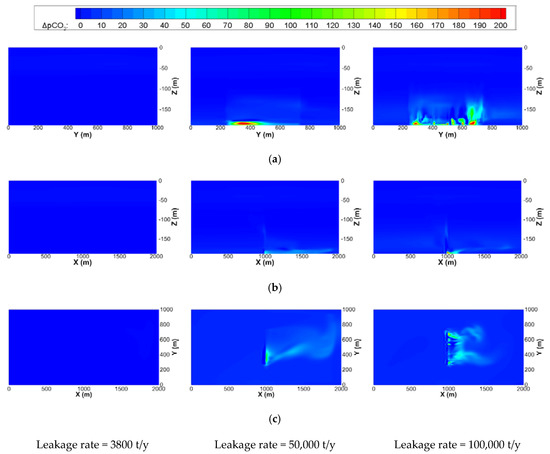
Figure 8.
Contour maps of ΔpCO2 on the center planes of the x, y, and z directions of the small-scale domain at 30 days after the start of leakage with the same initial diameter of bubble of 20 mm and leakage area of 20,000 m2 but with different leakage rates. (a) Center plane in x direction (x = 1000 m); (b) Center plane in y direction (y = 500 m); (c) xy plane near leakage area (z = –180 m)
The contour maps of ΔpCO2 on the constant z planes of the mesoscale domain with respect to depths and elapsed time after leakage for the most extreme case are illustrated in Figure 9 and Figure 10, respectively, where the black rectangular box indicates the full-3D small-scale domain including the leakage area. Both figures show that high ΔpCO2 regions are placed at depths between 150 and 170 m, not in the leakage depth. This might be due to the convection of DCO2 by the geostrophic flows. It can also be found that diffusion is more dominant than convection as water depth becomes deeper. The time change of maximum ΔpCO2 in the mesoscale domain is not significant, as shown in Figure 10. The maximum ΔpCO2 is lower than 50 ppm and does not exceed the PNEC.
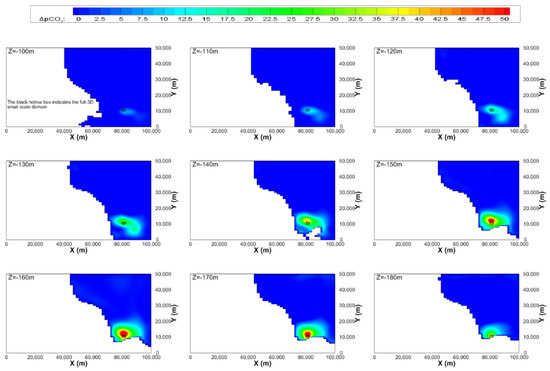
Figure 9.
Contour maps of ΔpCO2 in the constant z planes of the mesoscale domain at 30 days after the start of leakage for case 3 (leakage rate = 100,000 t/y).
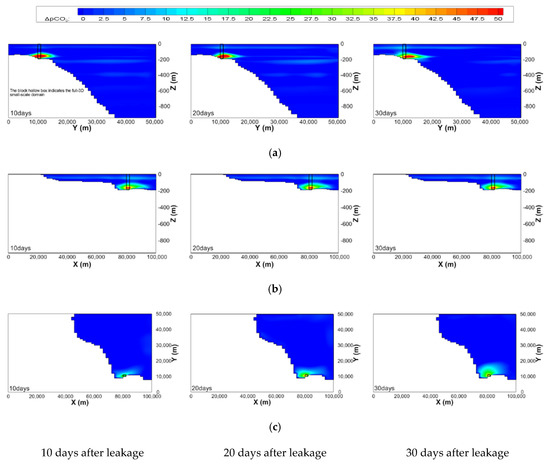
Figure 10.
Time change of contour maps of ΔpCO2 on the planes, where the full-3D small-scale domain is located, of the mesoscale domain for case 3 (leakage rate = 100,000 t/y). (a) yz plane (x = 81,000 m); (b) zx plane (y = 10,500 m); (c) xy plane (z = 180 m)
4.2. Effect of Initial Diameter of CO2 Bubble (Cases 5, 4, and 3/Leakage Rate = 100,000 t/y, Leakage Area = 20,000 m)
Contour maps of some variables on the center plane in the x direction (x = 1000 m) of the small-scale domain at 30 days after the start of leakage are shown in Figure 11. As seen in the distribution of void rate and cell-averaged number densities of CO2 bubbles, as the initial diameter of the bubbles increases, the rising distance of the bubbles increases, which results from the larger buoyant force of the relatively large volume of the bubble. Because the leakage rates are the same for these cases, the number of bubbles is high within the short band when the initial diameter is 5 mm. Comparing the distributions of DCO2 or ΔDCO2 among the cases, one can find that the distribution when the diameter is 10 mm is quite different from those of 5 and 20 mm. The reason for this phenomenon is that the mass transfer rate of a CO2 bubble is largely affected by the shape of the bubble. The total mass transfer per unit volume decreases as the diameter of a bubble decreases. However, if the diameter exceeds a certain value and changes to the spherical cap, there is a sudden jump, and it decreases as the diameter increases. The threshold is approximately 18 mm. Therefore, the mass transfer rates when the diameters are 5 and 20 mm are similar, but the rate becomes smaller when the diameter is 10 mm, as discussed by Kano et al. (2009). The lower dissolution of the bubbles results in a low DCO2 and ΔDCO2 when the diameter is 10 mm.
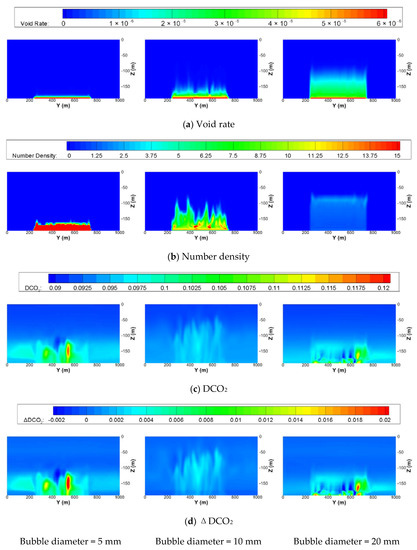
Figure 11.
Contour maps of (a) void rate, (b) number density of undissolved CO2 bubbles, (c) DCO2, and (d) ΔDCO2 on the center plane in the x direction (x = 1000 m) of the small-scale domain at 30 days after the start of leakage with the same leakage rates of 100,000 t/y and leakage area of 20,000 m2 but different initial diameter of bubble.
Figure 12 shows the contour maps of ΔpCO2 on the center planes of the x, y, and z directions of the small-scale domain. The maximum ΔpCO2 for cases 5 and 3 are similar but do not exceed 500 ppm, which is also clearly seen in Figure 13, where those on the constant x, y, and z planes of the mesoscale domain are illustrated.
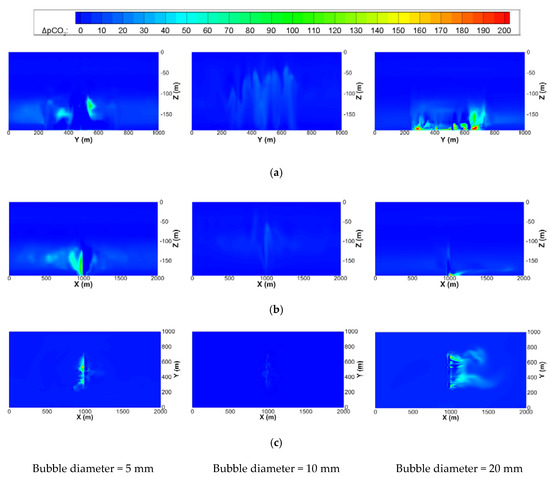
Figure 12.
Contour maps of ΔpCO2 on the center planes of the x, y, and z directions of the small-scale domain at 30 days after the start of leakage with the same leakage rates of 100,000 t/y and leakage area of 20,000 m2 but different initial diameters of the bubble. (a) Center plane in x direction (x = 1000 m); (b) Center plane in y direction (y = 500 m); (c) xy plane near leakage area (z = −180 m).
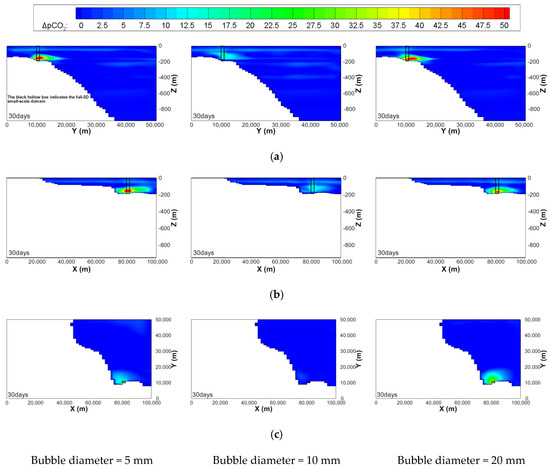
Figure 13.
Contour maps of ΔpCO2 on the planes, where the full-3D small-scale domain is located, of the mesoscale domain at 30 days after the start of leakage with the same leakage rates of 100,000 t/y and leakage area of 20,000 m2 but different initial diameters of the bubble. (a) yz plane (x = 81,000 m); (b) zx plane (y = 10,500 m); (c) xy plane near leakage area (z = 180 m)
5. Conclusions
In this study, the behavior and diffusion of CO2, assumed to have leaked from the seafloor, were numerically predicted for the first time near the one of the candidate sites for CO2 ocean geological storage in Korea. The behavior of leaked CO2 bubbles were analyzed numerically using a multi-scale ocean model to assess its environmental impacts, which is essential for obtaining public acceptance. The main parameters chosen for the simulation were leakage rates and initial diameters of CO2 bubbles. The former was assumed to be 3800, 50,000, and 100,000 t/y and the latter to be 5, 10, and 20 mm, respectively. A total of five simulations were carried out by combining these parameters.
From the simulation results, it was found that all CO2 bubbles were dissolved into the seawater before reaching the free surface in all cases. As the leakage rate increased, relatively higher values were concentrated near the leakage depth, and wider areas of ΔpCO2 were observed because more bubbles existed and dissolution lasted for a longer time. As the initial diameter of the bubbles increased, the rising distance of the bubbles also increased due to the larger buoyant force of the relatively large volume of the bubble. However, small ΔpCO2 values were estimated when the diameter was 10 mm. For the mass transfer rates, though they were similar for the 5 and 20 mm diameters, they were reduced when the diameter was 10 mm.
The estimated maximum ΔpCO2 for the extreme case was approximately 200 ppm during 30 days of leakage under the present simulation conditions. Therefore, it can be said that the environmental impact caused by the leakage of CO2 was not significant.
The present numerical model is expected to be useful and applicable not only for estimation of the behaviors and environmental impact of leaked CO2 but for various purposes, such as determination of the proper location for leakage monitoring devices during ocean geological storage of CO2.
Scenario-based simulations and parametric studies will be performed in the near future. The main parameters, such as the leakage depth closely related to the phase of the leaked CO2, the vertical distributions of the scalar properties according to the seasonal change, and the shape of the leakage area, will be considered. Furthermore, validation and improvement of adopted sub-models will be continued as uncertainties and assumptions remain, although well-known or validated ones were implemented in the present model.
Author Contributions
Conceptualization, S.-M.J. and W.-Y.S.; Methodology, S.-M.J. and W.-Y.S.; Validation, S.K.; Formal Analysis, S.K.; Investigation, W.-Y.S. and S.-M.J.; Resources, S.-M.J. and S.K.; Writing—Original Draft Preparation, S.-M.J.; Writing—Review and Editing, S.-M.J. and W.-Y.S.; Visualization, S.K.; Supervision, S.-M.J. and W.-Y.S.; Funding Acquisition, S.-M.J. All authors have read and agreed to the published version of the manuscript.
Funding
This research was supported by the Basic Science Research Program through the National Research Foundation of Korea (NRF) funded by the Ministry of Education (No. 2017R1D1A3B03030031).
Conflicts of Interest
The authors declare no conflict of interest.
References
- Furre, A.-K.; Eiken, O.; Alnes, H.; Vevatne, J.N.; Kiær, A.F. 20 Years of Monitoring CO2-injection at Sleipner. Energy Procedia 2017, 114, 3916–3926. [Google Scholar] [CrossRef]
- Bentham, M.; Kirby, M. CO2 Storage in Saline Aquifers. Oil Gas. Sci. Technol. 2006, 60, 559–567. [Google Scholar] [CrossRef]
- Hansen, O.; Gilding, D.; Nazarian, B.; Osdal, B.; Ringrose, P.; Kristoffersen, J.-B.; Eiken, O.; Hansen, H. Snøhvit: The History of Injecting and Storing 1 Mt CO2 in the Fluvial Tubåen Fm. Energy Procedia 2013, 37, 3565–3573. [Google Scholar] [CrossRef]
- Tanase, D.; Sasaki, T.; Yoshii, T.; Motohashi, S.; Sawada, Y.; Aramaki, S.; Yamanouchi, Y.; Tanaka, T.; Ohkawa, S.; Inowaki, R. Tomakomai CCS Demonstration Project in Japan. Energy Procedia 2013, 37, 6571–6578. [Google Scholar] [CrossRef]
- Blackford, J.C.; Stahl, H.; Bull, J.M.; Berges, B.J.P.; Cevatoglu, M.; Lichtschlag, A.; Connelly, D.; James, R.H.; Kita, J.; Long, D.; et al. Detection and impacts of leakage from sub-seafloor carbon dioxide storage. Nat. Clim. Chang. 2014, 4, 1011–1016. [Google Scholar] [CrossRef]
- Sellami, N.; Dewar, M.; Stahl, H.; Chen, B. Dynamics of rising CO2 bubble plumes in the QICS field experiment. Int. J. Greenh. Gas. Control 2015, 38, 44–51. [Google Scholar] [CrossRef]
- Alendal, G.; Drange, H. Two-phase, near-field modeling of purposefully released CO2 in the ocean. J. Geophys. Res. Oceans 2001, 106, 1085–1096. [Google Scholar] [CrossRef]
- Sato, T.; Sato, K. Numerical prediction of the dilution process and its biological impacts in CO2 ocean sequestration. J. Mar. Sci. Tech.-Jpn. 2002, 6, 169–180. [Google Scholar] [CrossRef]
- Jeong, S.M.; Sato, T.; Chen, B.; Tabeta, S. Numerical simulation on multi-scale diffusion of CO2 injected in the deep ocean in a practical scenario. Int. J. Greenh. Gas. Control 2010, 4, 64–72. [Google Scholar] [CrossRef]
- Kano, Y.; Sato, T.; Kita, J.; Hirabayashi, S.; Tabeta, S. Model prediction on the rise of pCO2 in uniform flows by leakage of CO2 purposefully stored under the seabed. Int. J. Greenh. Gas. Control 2009, 3, 617–625. [Google Scholar] [CrossRef]
- Kano, Y.; Sato, T.; Kita, J.; Hirabayashi, S.; Tabeta, S. Multi-scale modeling of CO2 dispersion leaked from seafloor off the Japanese coast. Mar. Pollut. Bull. 2010, 60, 215–224. [Google Scholar] [CrossRef] [PubMed]
- Mori, C.; Sato, T.; Kano, Y.; Oyama, H.; Aleynik, D.; Tsumune, D.; Maeda, Y. Numerical study of the fate of CO2 purposefully injected into the sediment and seeping from seafloor in Ardmucknish Bay. Int. J. Greenh. Gas Control 2015, 38, 153–161. [Google Scholar] [CrossRef]
- Kang, K.; Huh, C.; Kang, S.-G. A numerical study on the CO2 leakage through the fault during offshore carbon sequestration. J. Korean Soc. Mar. Environ. Energy 2015, 18, 94–101. [Google Scholar] [CrossRef]
- Lee, H.S.; Lee, B.H.; Kim, K.; Kim, S.Y.; Park, J.C. Tidal current simulation around the straits of korea and its application to a speed trial. Int. J. Nav. 2019, 11, 474–481. [Google Scholar] [CrossRef]
- Pitzer, K.S.; Sterner, S.M. Equations of state valid continuously from zero to extreme pressures for H2O and CO2. J. Chem. Phys. 1994, 101, 3111–3116. [Google Scholar] [CrossRef]
- Smagorinsky, J. Some historical remarks on the use of nonlinear viscosities. Large Eddy Simulation of Complex. Engineering and Geophysical Flows. In Large Eddy Simulation of Complex Engineering and Geophysical Flows; Galperin, B., Orszag, S.A., Eds.; Cambridge University Press: Cambridge, UK; New York, NY, USA; Melbourne, Australia; Madrid, Spain; Cape Town, South Africa; Singapore; São Paulo, Brazil; Delhi, India; Dubai, UAE; Tokyo, Japan, 1993; pp. 3–36. [Google Scholar]
- Hirai, S.; Okazaki, K.; Tabe, Y.; Hijikata, K. Mass transport phenomena of liquid CO2 with hydrate. J. Waste Manag. 1997, 17, 353–360. [Google Scholar] [CrossRef]
- Weiss, R.F. Carbon dioxide in water and seawater: The solubility of a non-ideal gas. Mar. Chem. 1974, 2, 203–215. [Google Scholar] [CrossRef]
- Chen, B.; Song, Y.; Nishio, M.; Someya, S.; Akai, M. Modeling near-field dispersion from direct injection of carbon dioxide into the ocean. J. Geophys. Res. 2005, 110, C09S15. [Google Scholar] [CrossRef]
- Matsumoto, K.; Takanezawa, T.; Ooe, M. Ocean tide models developed by assimilating TOPEX/POSEIDON altimeter data into hydrodynamical model: A global model and a regional model around Japan. J. Oceanogr. 2000, 56, 567–581. [Google Scholar] [CrossRef]
- Hino, M.; Nakaza, E. Tests of a new numerical scheme on a “non-reflection and free-transmission” open-sea boundary for longwaves. Fluid Dyn. Res. 1989, 4, 305. [Google Scholar] [CrossRef]
- Klusman, R.W. Rate measurements and detection of gas microseepage to the atmosphere from an enhanced oil recovery/sequestration project, Rangely, CO, USA. Appl. Geochem. 2003, 18, 1825–1838. [Google Scholar] [CrossRef]
- Kikkawa, T.; Kita, J.; Ishimatsu, A.J.M.P.B. Comparison of the lethal effect of CO2 and acidification on red sea bream (Pagrus major) during the early developmental stages. Mar. Pollut. Bull. 2004, 48, 108–110. [Google Scholar] [CrossRef]
- Kita, J.; Watanabe, Y. Impact assessment of high-CO2 environment on marine organisms. In Proceedings of the 8th International Conference on Greenhouse Gas Control Technologies, (GHGT-8), Trondheim, Norway, 19–22 June 2006. CD-ROM. [Google Scholar]
© 2020 by the authors. Licensee MDPI, Basel, Switzerland. This article is an open access article distributed under the terms and conditions of the Creative Commons Attribution (CC BY) license (http://creativecommons.org/licenses/by/4.0/).