1. Introduction
Recently, structural health monitoring (SHM) has become a necessary tool to evaluate the condition of important structures, such as bridges, buildings, tunnels, and so forth. The SHM systems are categorized into short and long-term monitoring systems. Long-term systems are used for a continuous monitoring of the structures that need real-time performance analysis, on the other hand, short-term monitoring systems are mostly low-cost monitoring systems used to evaluate the performance of existing structures for a short period of time.
Many researchers developed low-cost monitoring techniques in order to decrease the costs of the long- and short-term assessment of structures. For example, a system was developed by Zhao et al. [
1] using smartphone application for structures monitoring; however, the accuracy of the developed system is limited. Gulgec et al. [
2] employed a deep learning algorithm to decrease the cost of SHM by estimating the strain responses from acceleration responses. Furthermore, image processing has been used to reduce the monitoring cost [
3] where the displacement can be estimated from real time image monitoring systems [
4]. Jo et al. [
5] presented a low-cost monitoring technique using global positioning system (GPS) sensors by using four low-cost sensors for estimating the dynamic behavior of structures; the results of this study showed low accuracy, 20–30 cm. In addition, compared to accelerometers and strain sensors, GPS sensors are expensive and their sampling frequency is low, 10–100 Hz [
6,
7]. Therefore, to accurately estimate the performance of structures, accelerometers, displacement or strain sensors are usually used [
8,
9,
10]. These sensors are used to estimate the accurate dynamic and static behavior of structures, as well as the fatigue can be extracted using strain measurements [
11]. The present study introduces a low-cost monitoring system to extract the full behavior of a monitoring point, including the accurate dynamic performance, of highway steel bridges using only strain measurements.
Strain sensors have proven to be effective tools to measure the fatigue of structures, particularly bridges [
11,
12,
13,
14]. Moreover, strain sensors have been widely used to estimate the behavior of bridges under environmental effects [
14,
15] and traffic loads [
13], as well as to assess traffic volume over bridges [
16]. However, the possibilities to estimate bridges’ deflection and acceleration from strain measurement remain limited, as it is very sensitive for the measurement noises [
17]. Yen and Lai [
18] calculated natural frequencies of the first 10 mode shapes of a bridge, and their results showed that the computed first mode shape was 5.32 Hz compared to that extracted from strain measurements, 4.92 Hz. Furthermore, Koss and Karczub [
19] used experimental models and the frequency response function to estimate the strain performance of beams using acceleration measurements. Their study used two accelerometers sensors and the frequency response functions between them were estimated based on different positions of these sensors to a fixed one. They found that the correlation between the acceleration measurements and strain prediction was high. In addition, Lee [
17] proposed a method to estimate the strain from acceleration and displacement sensors; however, the proposed method depends on the transformation matrices and the methods of analysis used. Anders et al. [
20] utilized mode shapes changes to estimate displacement from strain. Wang et al. [
21] used the cross-correlation matrix of a modal coordinates to estimate the mode shapes of the beam element though strain measurements. Gevinski and Pederiva [
22] used a hybrid modal analysis to transfer displacements to strains and assess the dynamic behavior of steel structures. Additionally, when the frequency response function was used to convert the acceleration to strain for an experimental steel bar, the accuracy observed was less than 10% [
23]. In addition, Sweitzer and Ferguson [
24] proposed a nonlinear transfer function between displacement and strain measurements. They found that this method was reasonably useful in dynamic behavior evaluation. Massone et al. [
25] estimated a nonlinear transformation function for a shear wall that can be used to transform displacement to strain, and the error of the model was around 10%. In another study that introduced and applied double filtration method to the evaluation of the acceleration from GPS measurements, Moschas and Stiros [
26] noted that this method can be used to estimate the full behavior of structures. From these studies, it is concluded that the transformation functions can be used to accurately estimate strains from displacement and acceleration measurements. Based on the literature review presented above, predicted real-time measurements for steel structures have not been thoroughly investigated yet.
The present study proposes a novel integrated model to predict displacement and acceleration of highway steel plate girder bridges using time domain strain measurements. The proposed model uses a transformation function based on simple polynomial prediction and double filtration methods to estimate the full behavior of a given monitored point through a direct field strain measurement. The model is applied to estimate the full behavior of the WonHyo bridge and extract its dynamic characteristics. The displacement and acceleration prediction ability of the model are evaluated and tested using different cases of loadings for the studied bridge. Limitations of the proposed model are then presented.
2. Theory Background and Methodology
This study investigates the use of strain measurements to estimate displacement and acceleration of structures members and determine their dynamic characteristics, frequency and damping. The monitoring theory and the design of strain sensors were presented in [
27]. The main SHM concepts of strain, displacement and acceleration measurements and analyses are presented in [
28,
29,
30]. Herein, local response measurements of structures’ members are a major advantage of strain measurements [
31,
32]. Where, local strains can be estimated through the relationship between strain and displacement [
17,
33]. As well as, dynamic acceleration can be detected from dynamic strain measurements through a transfer function.
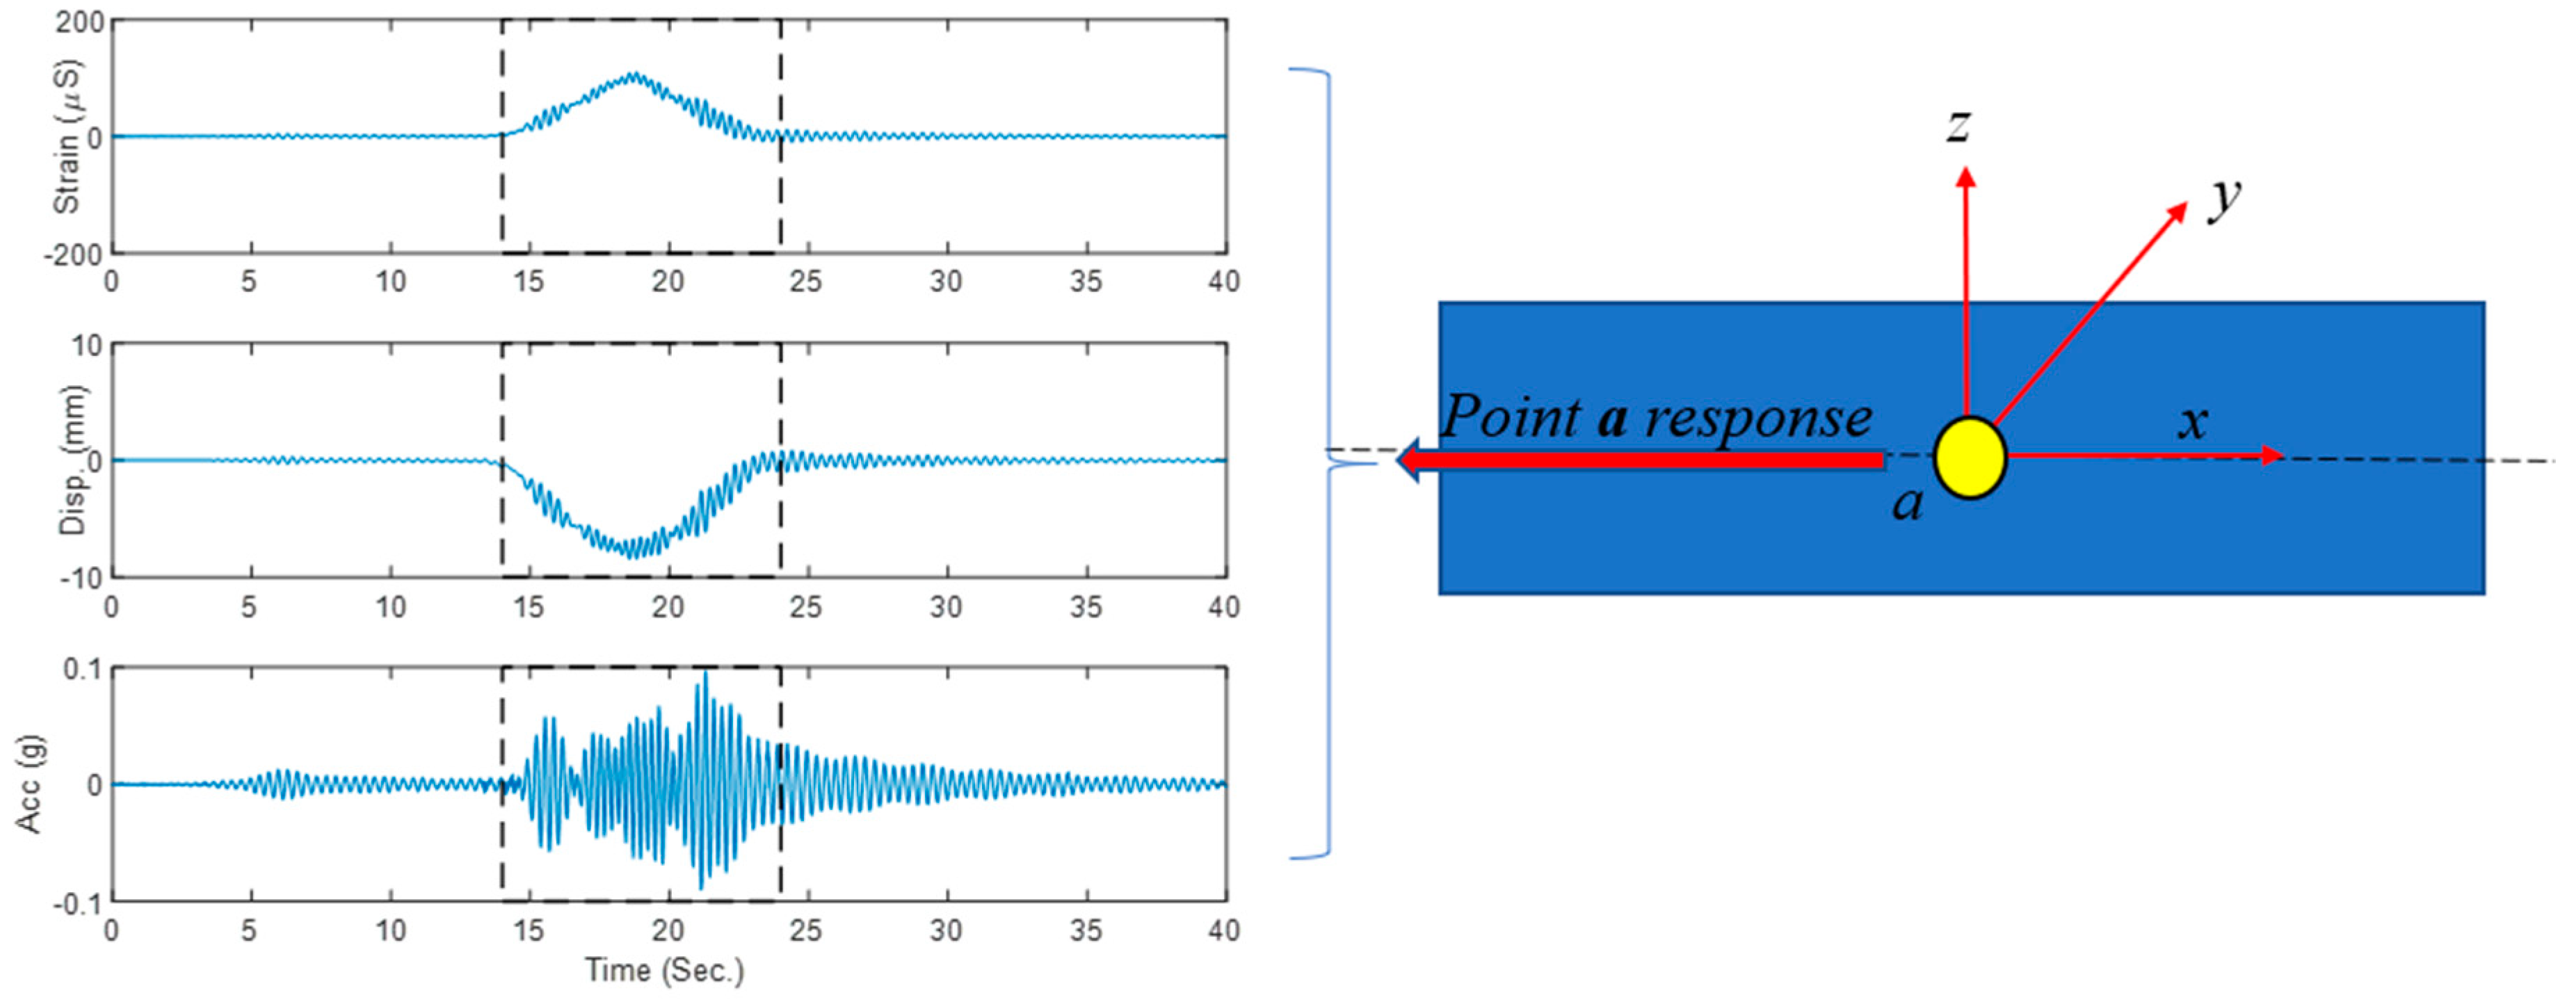
Figure 1 presents the displacement, acceleration and strain responses of point (
a) using three sensors. This study aims to estimate accurately three responses of point
a using strain measurements only. The relationship of displacement and strain for a given monitored point
a along the vertical axis (
z) of a beam during monitoring time
t,
Figure 1, can be simply expressed as follows [
17]:
where the semi-static strain (
) and displacement (
) vectors are real-time measurements for one monitoring point, and
T is the transformation matrix between the semi-static strain and displacement responses’ vectors.
Additionally, the transformation matrix is used to transfer the acceleration to dynamic strain as follows [
34]:
where, the dynamic strain (
) and acceleration (
) of the monitoring point are measured, and
D is the transformation matrix between the dynamic strain and acceleration responses’ vectors.
Thus, the inverse of the transformation matrices was used to calculate the displacement and acceleration of the monitored point from strain measurement.
Herein, T and D represent the mode shapes or modal matrices of the vibration mode of point
a. Thus, to estimate the acceleration and displacement from Equations (1) and (2), the modal matrices are obtained analytically or experimentally. Lee [
17] obtained the modal matrices experimentally by using displacement frequency response functions; while Wang et al. [
21] used the finite element to calculate the modal matrices.
In this study, to overcome the complexity of the theoretical and experimental calculations of the frequency responses of structures, the polynomial function was used to transfer the strain measurements to displacement and acceleration responses in the time domain. A polynomial function was used to transform the semi-static displacement and dynamic acceleration responses of strain measurements in the time domain, as follows [
35,
36]:
where N is the polynomial model order and
and
are the semi-static and dynamic parameters of the model, respectively.
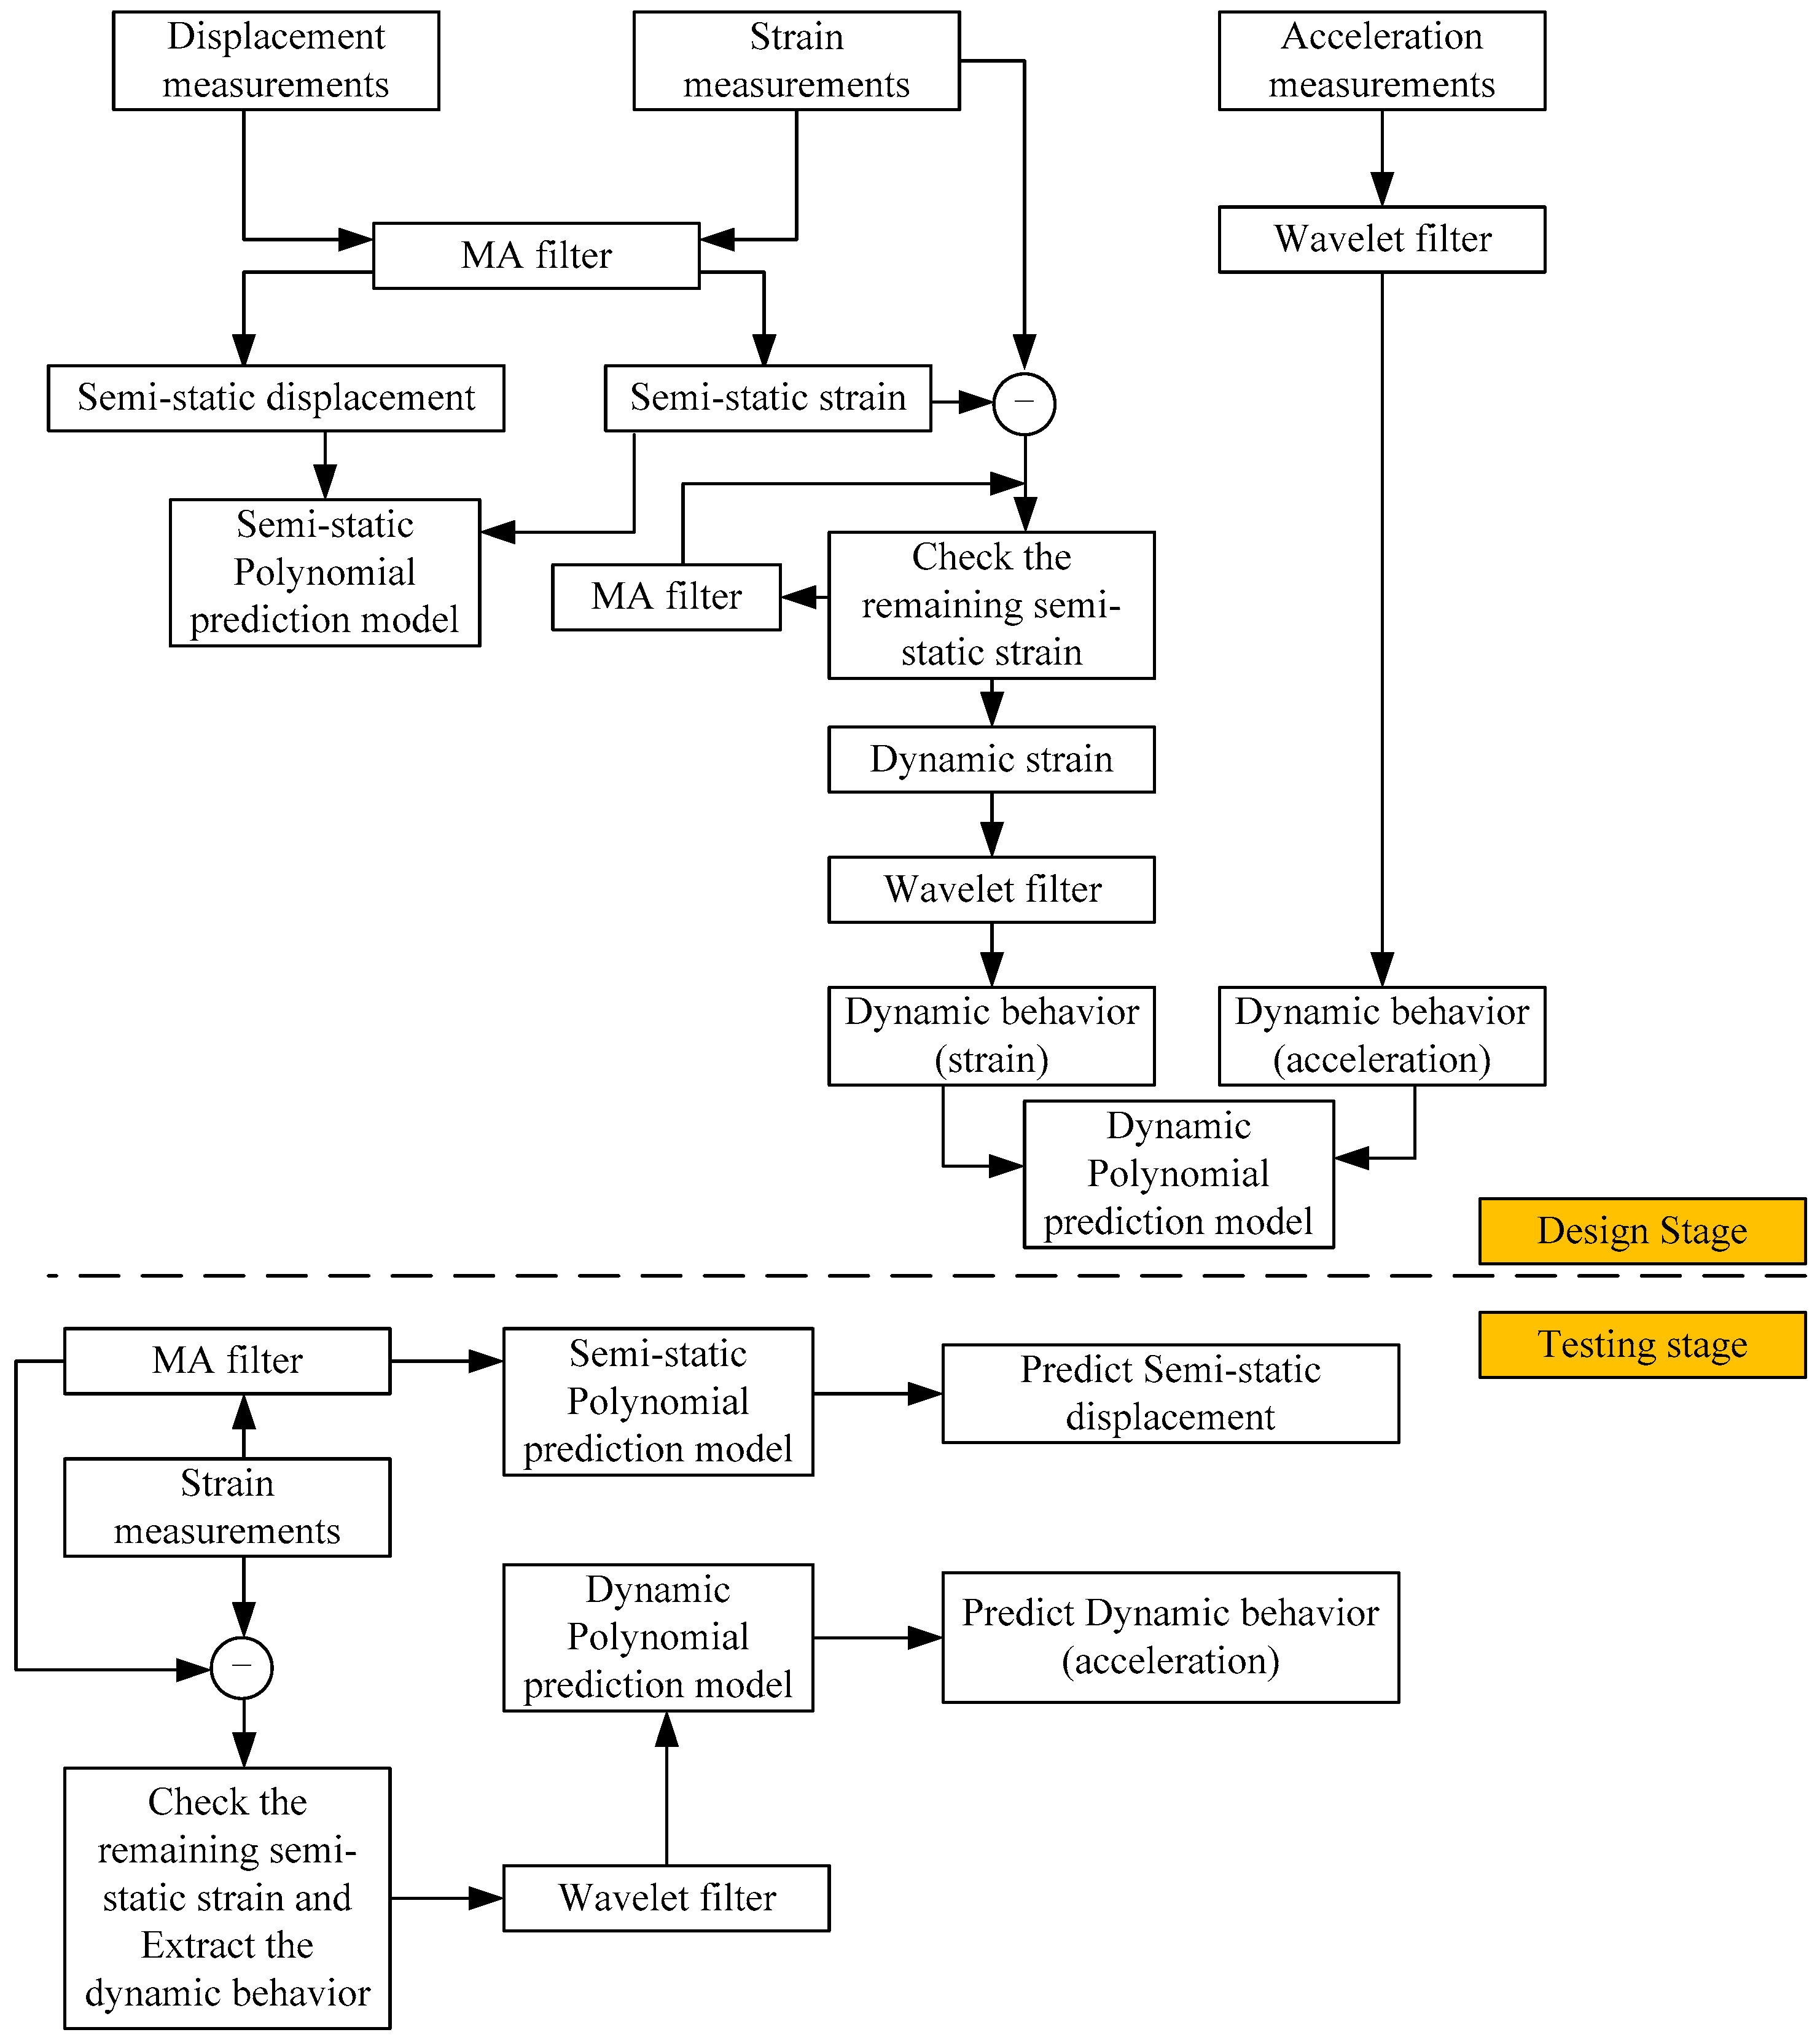
Figure 2 proposes the model design for estimating the semi-static displacement and dynamic accelerations responses from strain measurements. Hence, since dynamic noises and sensors errors affect sensors measurements, filtration methods are applied to remove the unsuitable noises [
7,
17]. The moving average (MA) filter is widely used to extract semi-static responses of structures, and the wavelet method is used to improve dynamic signals [
7,
26]. Further details on the two filters’ theories and their design can be found in [
26,
34,
37]. In the present study, the MA and wavelet denoising methods are applied to extract accurate semi-static and dynamic behavior of bridges. To design the MA filter, the filter’s window is selected through trial and error, and the mother-wavelet name and wavelet order are selected based on previous studies and the signal noise ratio for the measurements. In the current study, a 70-point MA filter was used to remove strains’ noises. The Wayne’s theory of the MA filter is applied to decrease the shift between the measured and smoothed responses [
31]. For the wavelet denoising, the discrete wavelet transform (DWT) was used to transform measured strain signals into decomposition levels, as follows [
38]:
where k and j are integer numbers;
is the discrete wavelet coefficient of scale
, while
is scale or frequency factor and
is a time factor.
represents the complex conjugate function of mother wavelet (
), where, the Daubechies (db) wavelet function is utilized.
The DWT generated two sets of functions viewed as high-pass and low-pass filters. Thereby, the measured data was separated into one containing its trend (the approximate (A)) and one comprising high frequencies contents (the detail (D)) using Equation (5). The detail coefficient was reconstructed to estimate the dynamic response of strain and acceleration measurements. The MA filter was used to extract semi-static strain and displacement measurements; and the wavelet method was applied to extract accurate dynamic measurements. In both filters, the double filtration process was applied to extract the dynamic strain measurements. In this respect, the filtration cycle can be increased based on the performance of structures. The filtration and prediction methods were used to extract time-series displacement and acceleration of steel bridges using strain measurements.
Figure 2 illustrates the developed model flow chart to extract the behavior of steel bridges in time and frequency domains using strain measurements. The displacement and acceleration responses were used for model design, while the strain measurements were used to extract the displacement and acceleration in the testing stage. The following steps were considered to design the model. First, the MA filter was used to estimate the semi-static strain and displacement responses from the measured strain and displacement, respectively. From both semi-static responses, the regression model was designed for the semi-static displacement responses of the bridge. Second, the dynamic strain responses were detected by subtracting the semi-static response from the measured strain signals. Then, the dominant frequency of dynamic strains and acceleration responses of bridge elements were calculated and assessed. If both frequencies are the same, then the wavelet filter can be applied to remove the remaining noises, else, the MA filter should be applied again to remove the remaining semi-static response. At the same time, the wavelet filter can be used to extract the filtered acceleration response. Finally, from the relation between the extracted dynamic strain and acceleration, the dynamic transformation function can be estimated.
To assess the performance of the model design, statistical indices were used. The coefficient of determination (R
2), root mean square error (RMSE) and mean absolute error (MAE) values were calculated and assessed. The R
2 was used to measure the relation between observed and predicted values, where low values of RMSE and MAE reflect high accuracy of the model. These indices are expressed as follows:
where
are the predicted and measured values, respectively; N is the number of samples and
denotes the mean value of the observed response.
On the other hand, to estimate the dynamic characteristics (frequency and damping ratio), fast Fourier transformation (FFT) was used to extract the dominant frequency mode of the signals’ measurements. FFT theory and its applications are presented in [
35,
36]. In the present study, the acceleration signals measurements and the predicted dynamic strains were used to evaluate the performance of the developed method. In addition, the Hilbert transform method was used to extract the instantaneous frequency and measurements phase and to predict accelerations [
36]. The instantaneous signals frequency and phase were extracted to evaluate the performance of the presented method. The instantaneous frequency and phase of complex signals (
) can be extracted using Hilbert transform as following Equation (9) [
36]:
For the systems that can be used to extract complex signals using input (
) and output (
) [
36]:
where
is the signal instantaneous amplitude, and
is the instantaneous phase. Therefore, the instantaneous frequency,
was calculated. The measurement and predicted acceleration were used as an input to the Hilbert system.
In addition, Shin and Hammond [
36] found that the autocorrelation function can be used to estimate the damping ratio of signals measurements. The authors observed high correlation between the normalized autocorrelation and the impulse response function (IRF) of the structures’ responses. Equation (8) was used to select the signal value of time (
t) for two response channels (
x1 and
x2) of the dynamic response.
The autocorrelation function is shown in Equation (11).
where
is a random variable with a uniform probability density function, and
is the time lag. Then, the least square method was used to estimate the coefficients of a polynomial fit for the signals’ IRF. The linear regression was used to calculate the slope of the IRF. Then, the damping ratio was calculated as follows Equation (12):
where
is the first coefficient or slope of the IRF bridge response and
is the structure natural frequency.
3. Bridge and Monitoring System Descriptions
In the present study, the developed model was used to evaluate the WonHyo bridge (steel plate girder) in Seoul, Korea. The monitoring system was designed to observe the bridge behavior under traffic loads. A three-wheel truck was used to assess the bridge performance. The monitoring system was designed and implemented by the A-Best Company.
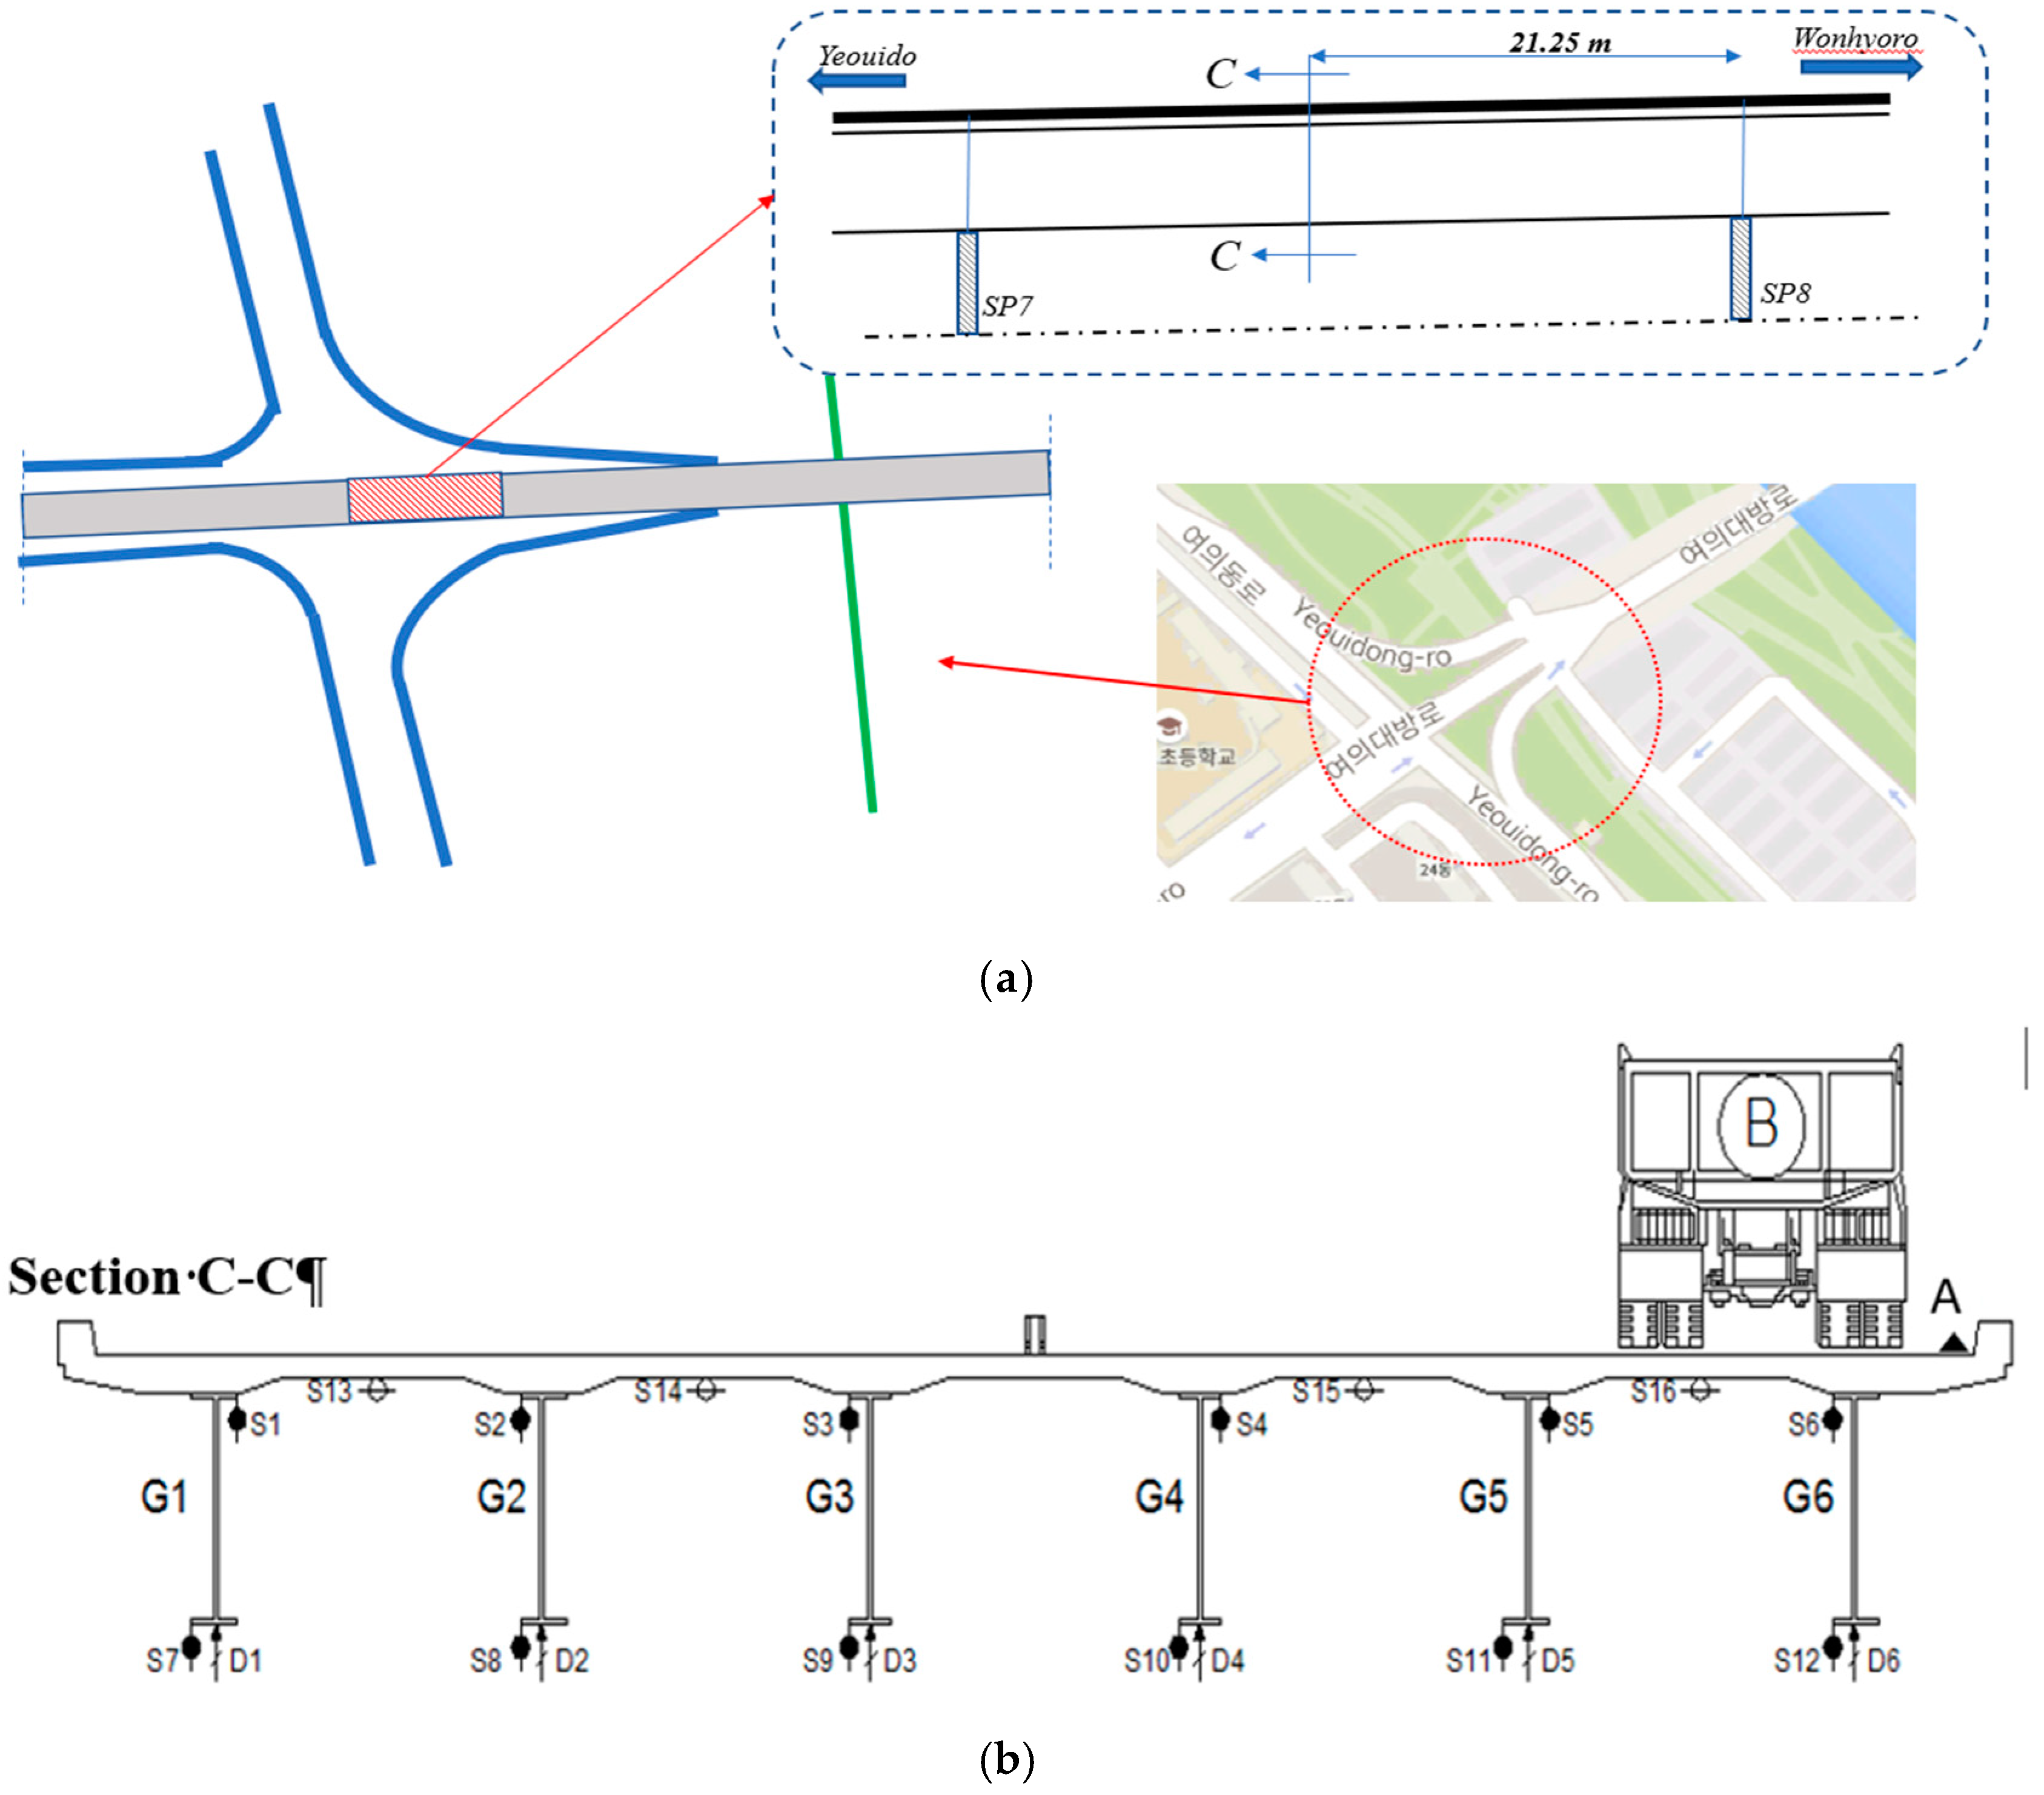
The WonHyo bridge is one of longest bridges crossing the Han river in Seoul.
Figure 3 shows the plan of the studied span, the bridge cross section, the loading cases used and the monitoring system. The total length of the bridge is 1470 m, and its width varies between 14.0 to 20.0 m. In different sections, the bridge consists of different construction materials, such as reinforced concrete, pre-stressed concrete and steel. In the present study, the span between piers 7 and 8 (42.5 m long) was investigated. The main supporting elements of this span were six continuous steel plate girders (
Figure 3a). The measurements were taken at the middle of the studied span. The bridge width at the mid-section was 14.0 m. Waterproof strain gauge sensors, a sampling frequency of 200 Hz (type WFLA-6-11-1L; TML Co., Tokyo Measuring instruments Lab., Japan, (
https://tml.jp/eng/documents/strain_gauge/WFseries.pdf), a high precision CDP-50 displacement meter, Tokyo Measuring instruments Lab., Japan (
https://tml.jp/eng/documents/transducers/CDP.pdf) and an ARF-10A accelerometer, Tokyo Measuring instruments Lab., Japan, (
https://tml.jp/eng/documents/transducers/ARF-A_ARF-A-T.pdf) were used to observe the strain (S), displacement or deflection (D) and acceleration (A) of the bridge girders, respectively.
The dynamic test was first performed to investigate and measure the dynamic characteristics of the bridge by measuring and recording the actual impact frequency and the natural frequency (
Figure 3b). To evaluate the performance of the bridge under static and dynamic loads, 16 strain sensors, 6 displacement sensors and 1 accelerometer sensor were attached at section A-A to monitor the bridge girders. The measurements of girder G6 were used to evaluate the model.
The monitoring system was designed to measure the movements of the girders and the slab during a short time period (24 pm to 5 am, on 2015.09.04).
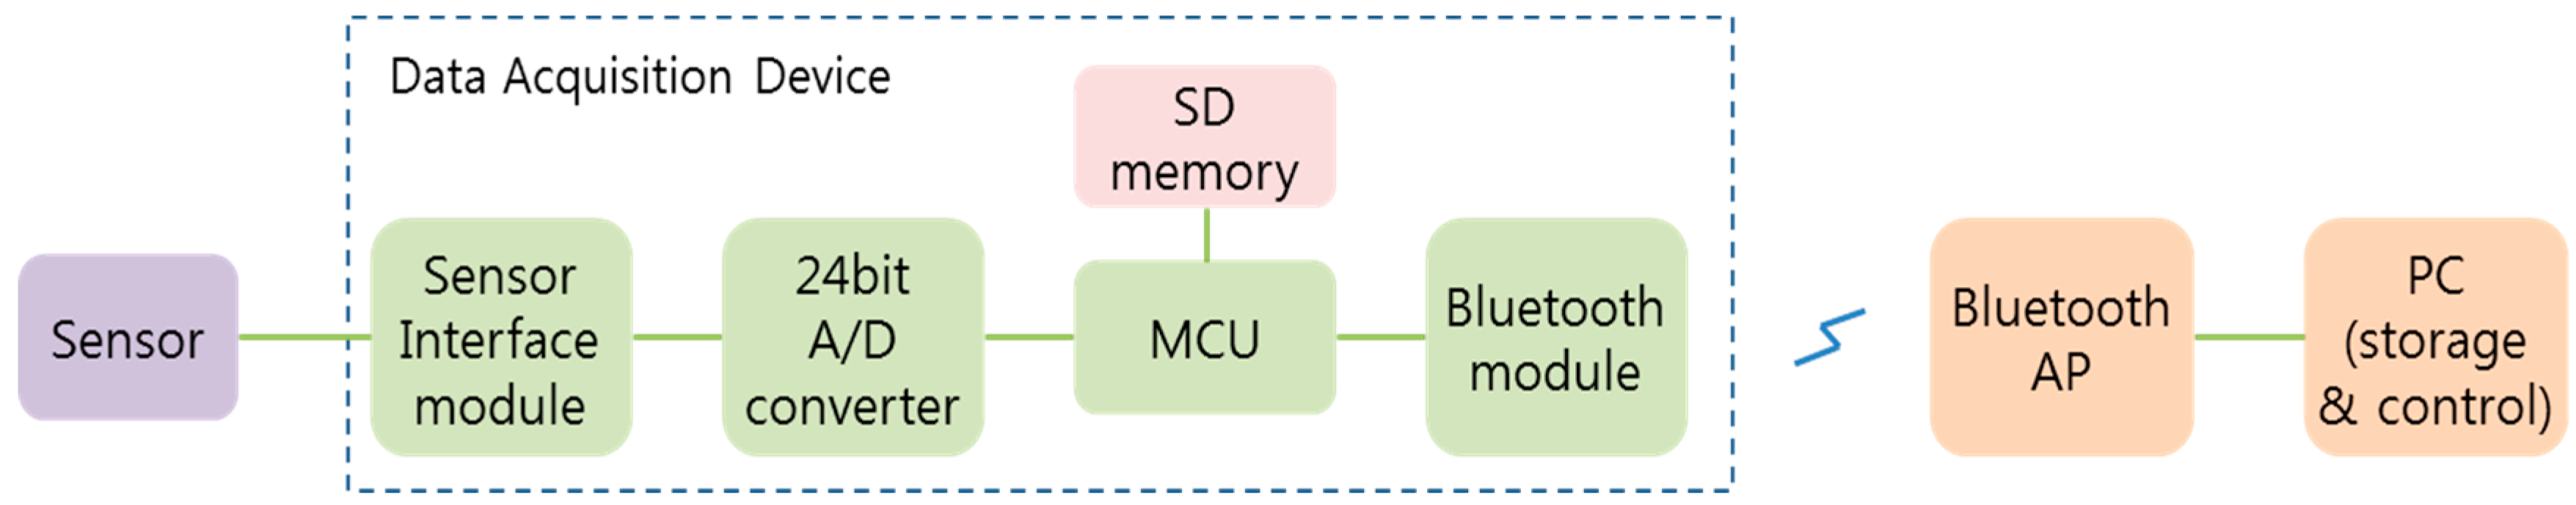
Figure 4 shows the monitoring system components used to collect the data. The sensors were connected to the data acquisition devices. Then, the measured data were digitized in an AD converter and delivered through the Bluetooth module and access point (AP). The data acquisition device used in this study had one channel; each device was synchronized each time by a signal sender. A personal computer was used to store the data in real time and to control the sensor nodes (data acquisition devices).
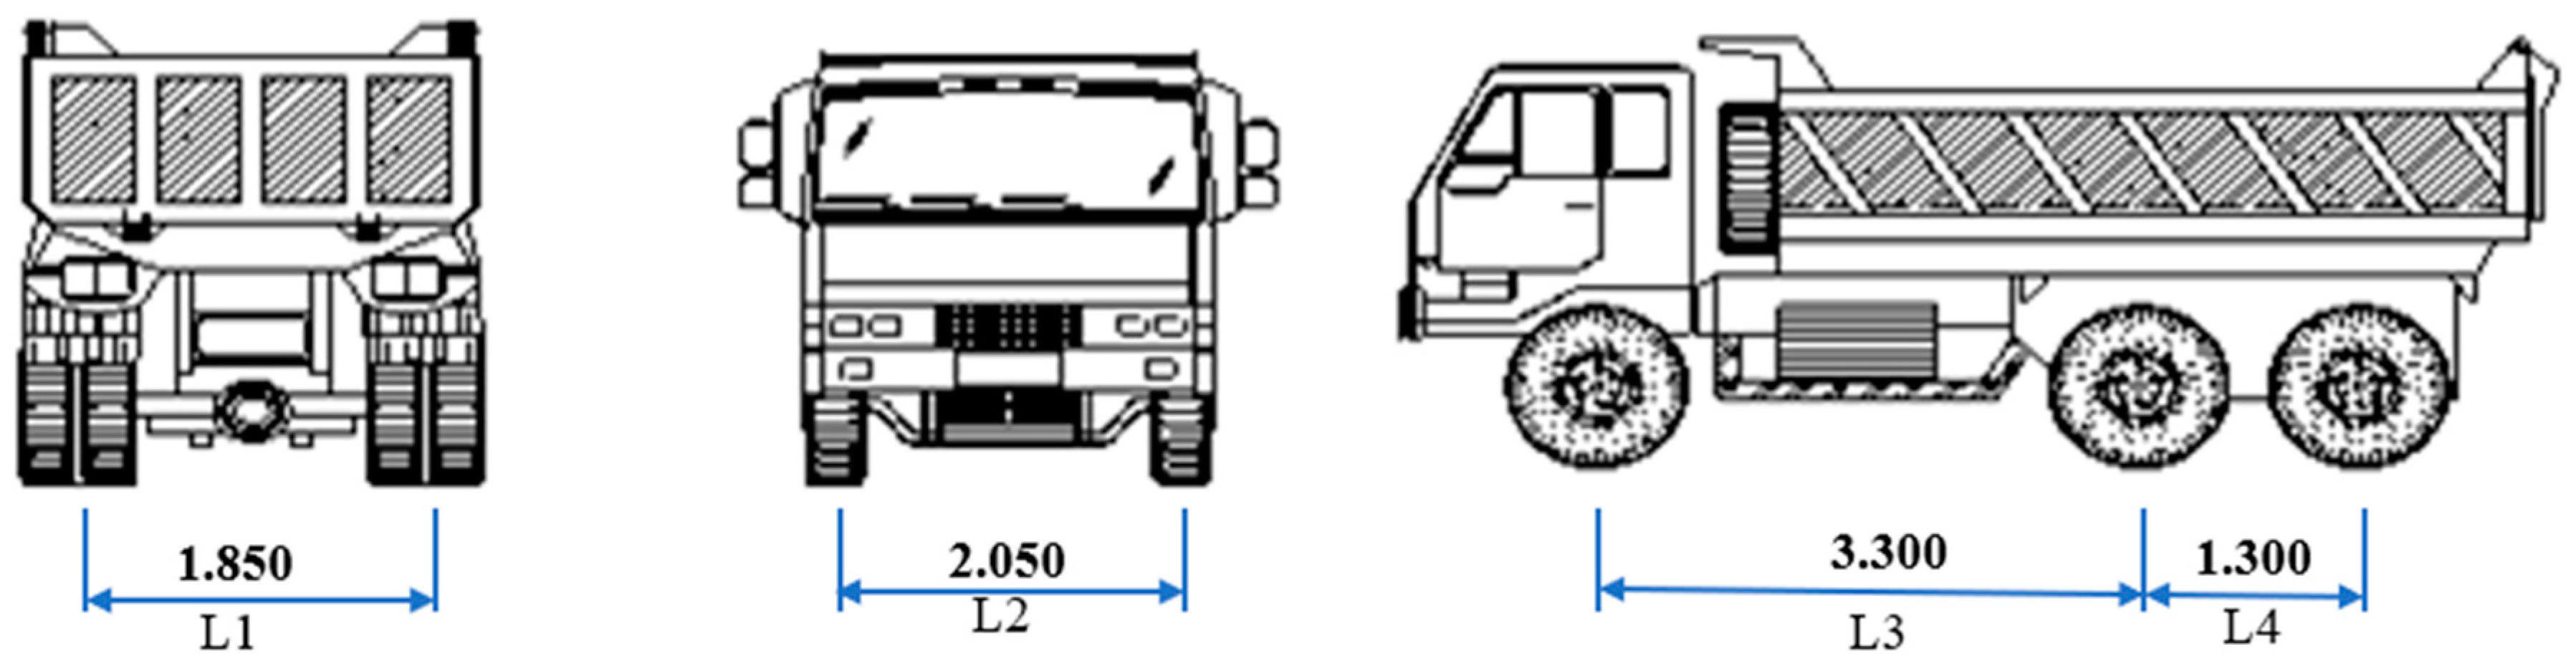
The loading vehicle used was two-dump trucks with a total weight of about 27 tons loaded with soil (see
Table 1 and
Figure 5 for the specifications and loading capacity of the test vehicle). Two different truck weights, A and B, were used with different speeds.
Table 2 illustrates the trucks’ speeds.
4. Results and Discussion
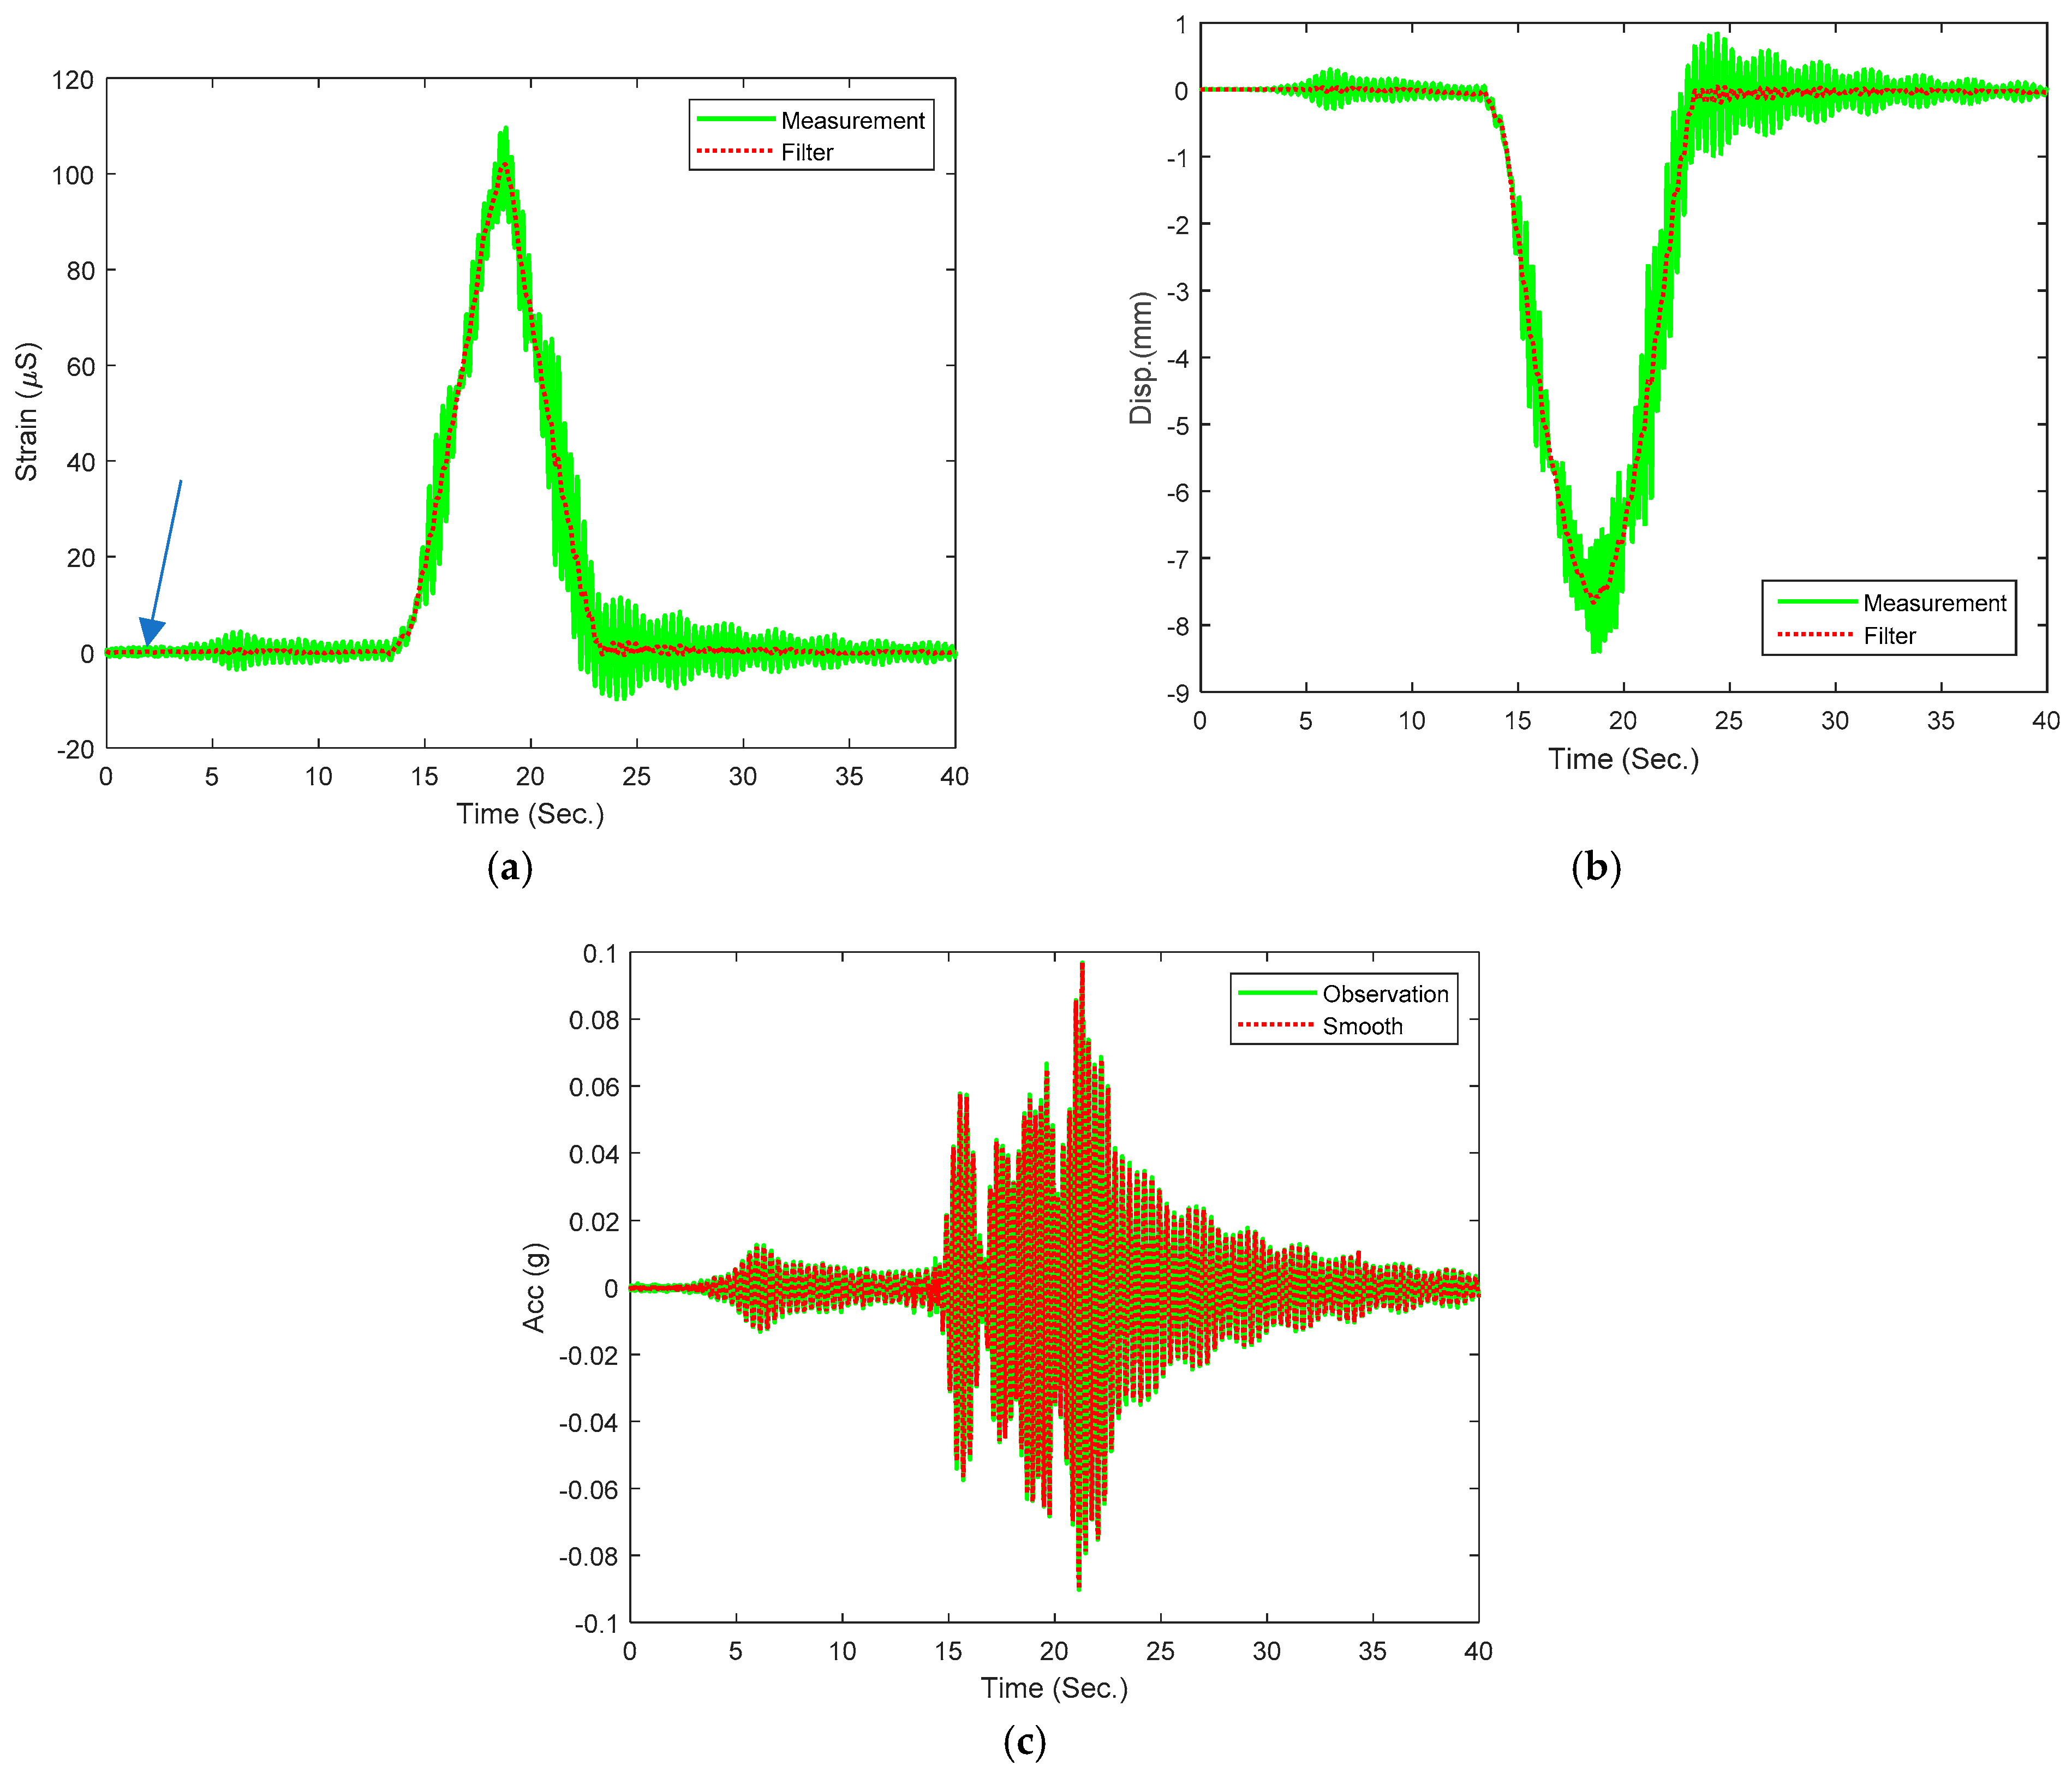
The strain, displacement and acceleration of the bridge under 20 km/h truck speed during the model design stage are shown in
Figure 6. The maximum response of the bridge was recorded when the truck passed over the monitoring point (between the 13th and the 23rd sections). As shown in
Figure 6, the strain and displacement values before loading were around zero; some dynamic response was observed by the accelerometer. The remaining dynamic response of the bridge was measured after the truck left the test span. In general, the strain and displacement sensors were used to measure the static and semi-static responses of the bridge, while the accelerometer was used to measure the dynamic response. Meanwhile, the three measurements contained some errors (refer to the arrow in
Figure 6a). Therefore, filtering or smoothing of the measurements was processed.
Figure 6, also, shows the filtered measurements. The MA filter based on Wayne’s theory with 70 windows was used to estimate the semi-static strain and displacement responses.
Figure 6a,b presents the semi-static strain and displacement responses, respectively. The standard deviations of observed and filtered strains were 25.875 µS and 25.526 µS, respectively. In addition, the correlation coefficient between both signals was 0.99. Additionally, the MA filter was used to estimate the semi-static displacement responses of the bridge. The standard deviation of the observed and filtered displacements was 2.265 mm and 2.236 mm, respectively; and the correlation coefficient between them was 0.99. These results indicate that there was no information loss from the original signals and the filtered strain and the displacement reflects the semi-static stress and deflection responses of the bridge, respectively. Moreover, the wavelet filter was applied by using db3 wavelet and two wavelet levels. The wavelet level was calculated based on the signal length. The performance of wavelet filter is shown in
Figure 6c. The standard deviations of the measured and filtered acceleration responses were approximately the same (0.018 g); and the correlation coefficient approached one. Thus, the MA and wavelet filters performed well when estimating the semi-static and dynamic responses of the bridge. Additionally, there was no information loss from the original data, which accurately reflects the bridge behavior under dynamic load effects.
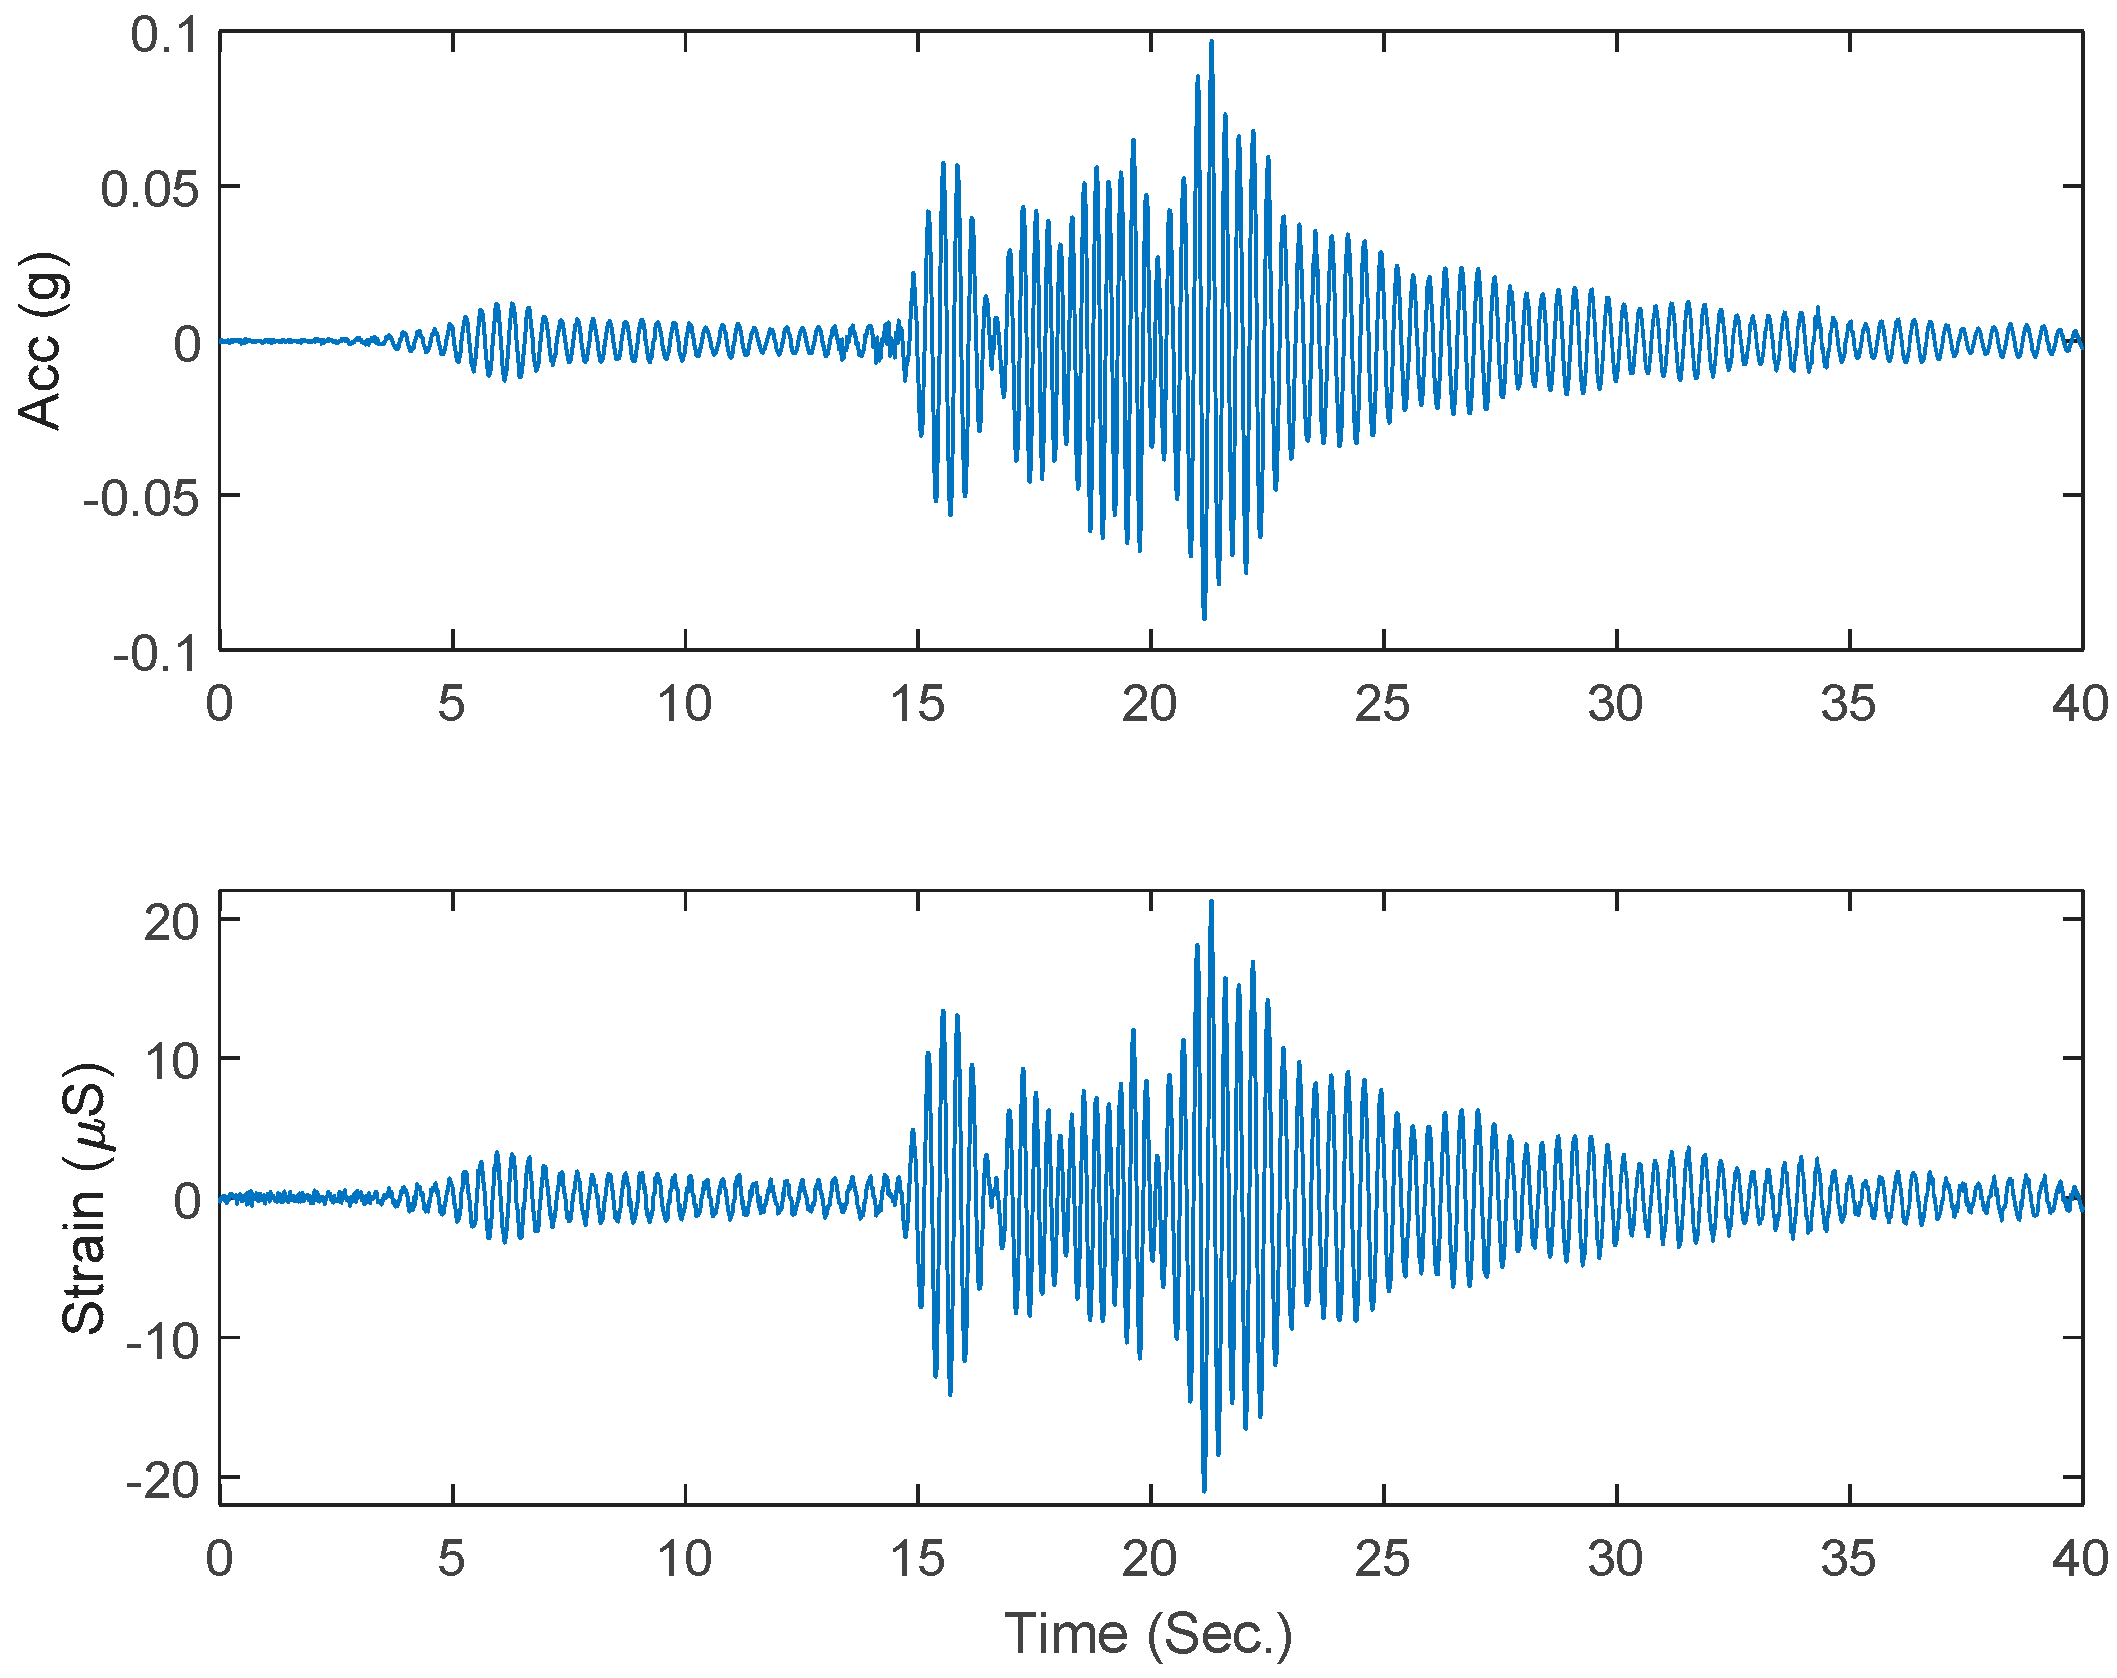
Figure 7 shows the smoothed signals of the acceleration and the extracted dynamic responses for the accelerometer and strain (dynamic strain) measurements, respectively. The dominant frequency of both signals was the same (2.88 Hz); thus, the wavelet filter was directly applied to estimate the dynamic strain of the bridge.
Figure 7, also, shows that the dynamic strain did not contain any semi-static responses with one filter applied in this case. Accordingly, the double filters were sufficient for this kind of bridges to extract the dynamic behavior from strain measurements. Furthermore, the relationship between the semi-static behaviors of the strain and displacement measurements are shown in
Figure 8a; where the second polynomial fitting model (
D = 5.69 × 10
−4 ×
S2 − 0.133 ×
S + 0.31 × 10
−2) was able to demonstrate the relation between these responses. The linear polynomial fitting (
A = 4.5 × 10
−3 ×
S − 7.57 × 10
−5) represents well the relationship between the dynamic responses collected and extracted from the acceleration and strain measurements (
Figure 8b). Therefore, the second and first degrees of polynomial models were used to estimate the displacement and acceleration performances of the bridge from strain observation, respectively. The two polynomial models were used to convert the semi-static strain and extracted dynamic responses to displacement and acceleration, respectively. Therefore, after eliminating the noises of the semi-static and dynamic strain measurements, the two models were applied to predict or extract the bridge responses.
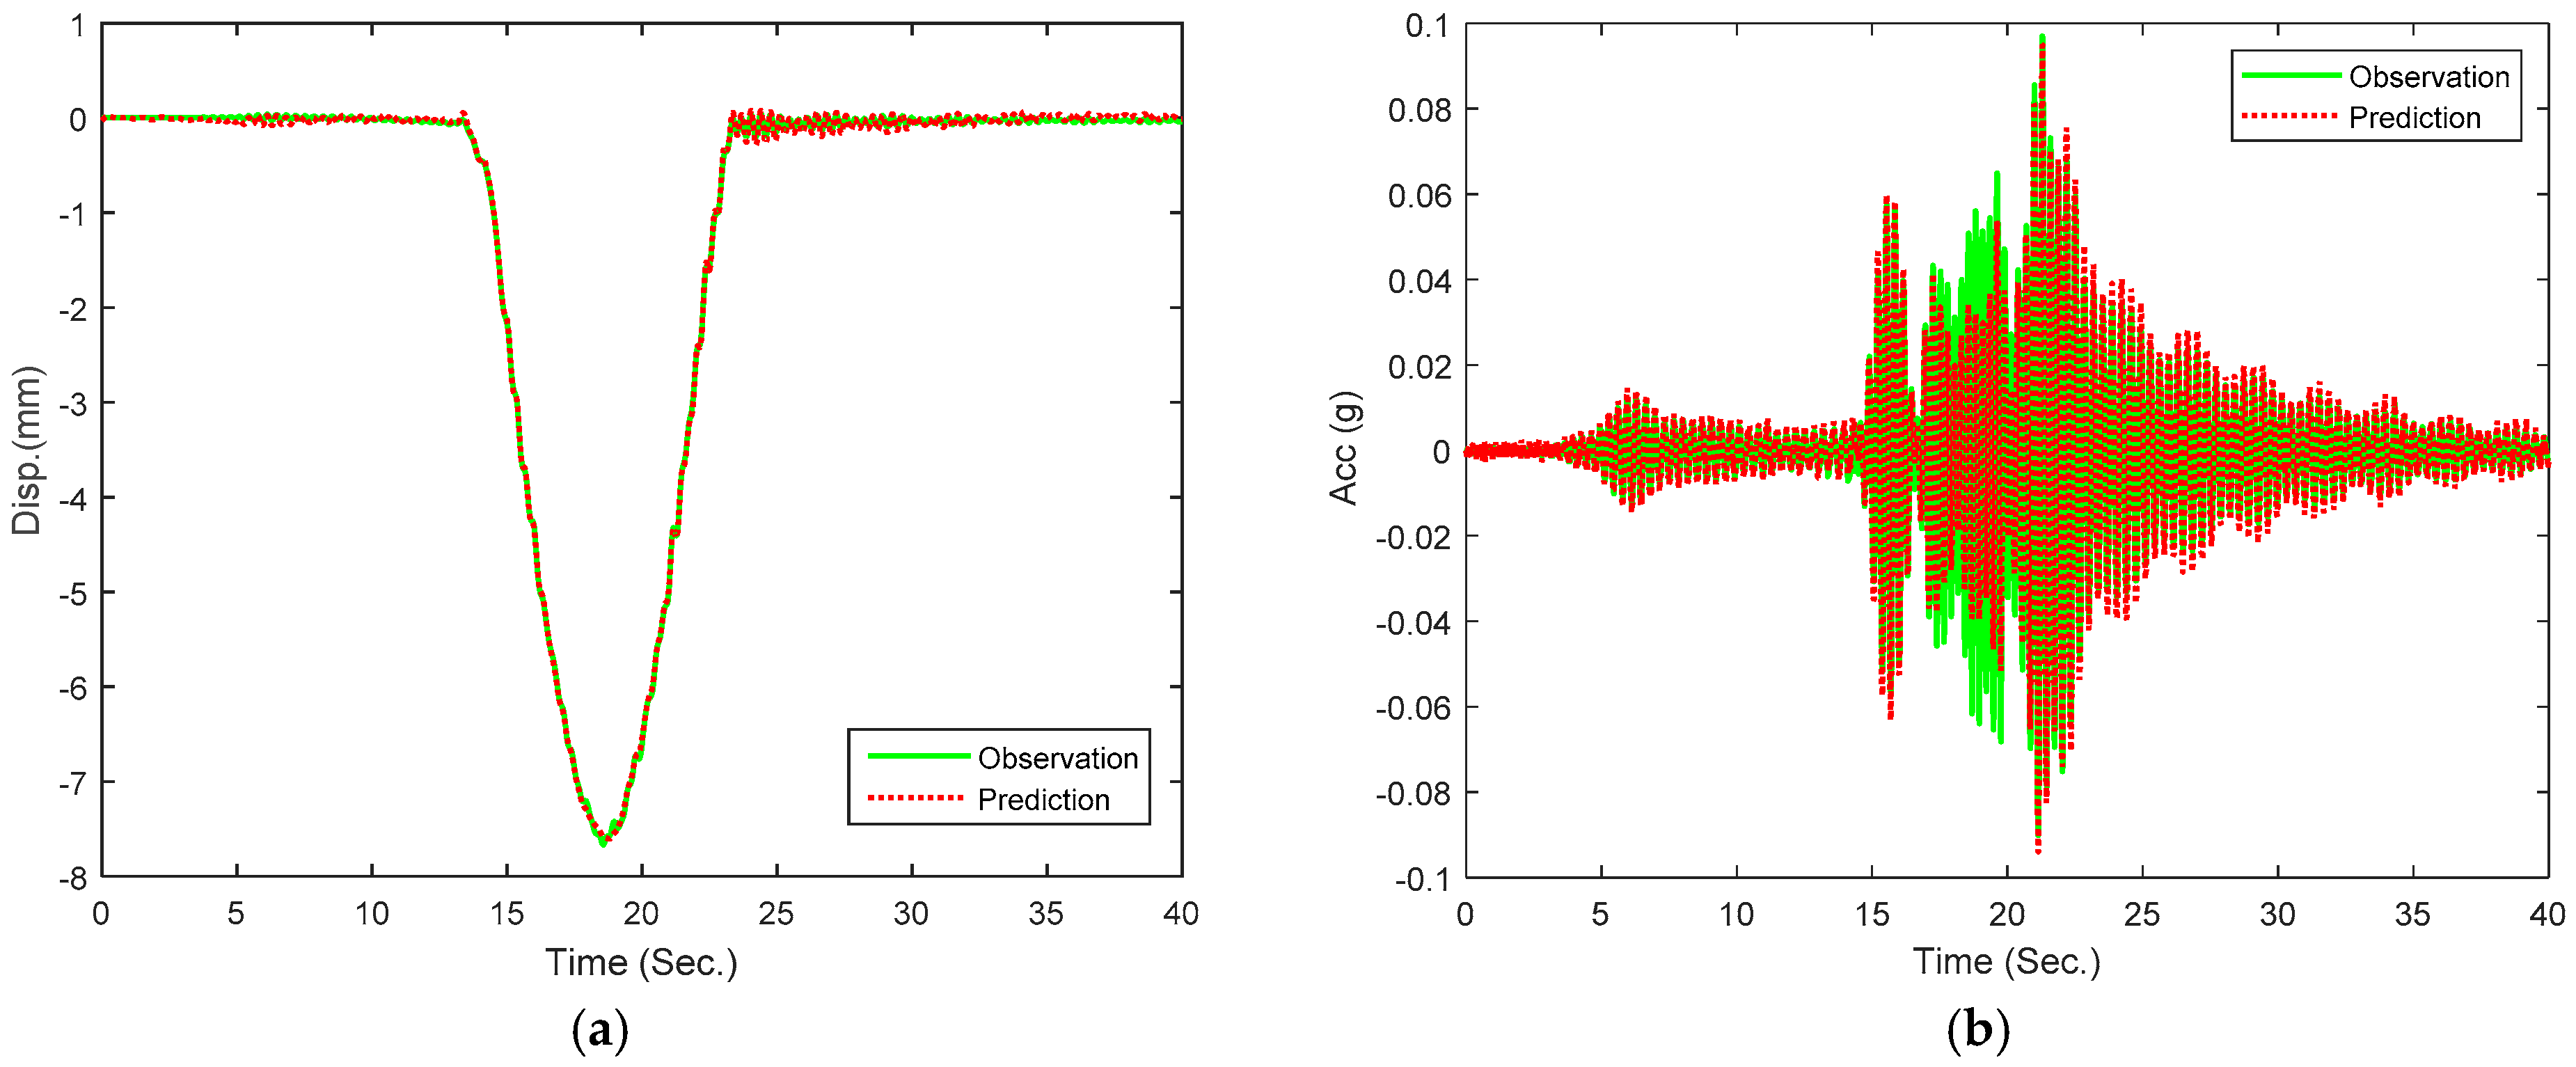
Then, the two models were evaluated using the strain, displacement and accelerometer measurements of the sensors under 20 km/h truck speed. The prediction values were assessed to estimate the accuracy of the developed models during the design stage.
The predicted displacement and acceleration responses of the bridge were evaluated (
Figure 9). The R
2 of the displacement and acceleration models were 0.99 and 0.95, respectively. The RMSE values of the models’ displacement and acceleration errors were 0.029 mm and 0.0042 g, respectively. In addition, the MAE values of the models’ displacement and acceleration errors were 0.024 mm and 0.0024 g, respectively. From these results, it can be concluded that the performance of two models was accurate and thus could be used to predict the displacement and acceleration of the bridge. Moreover, to check the performance of the two models, the strain sensors’ measurements for the same point under different conditions were evaluated as well.
For the frequency domain evaluation and estimation, the FFT, Hilbert transform and autocorrelation function methods were used to extract the dynamic characteristics (frequency and damping ratio) of the bridge from the acceleration and dynamic strain measurements.
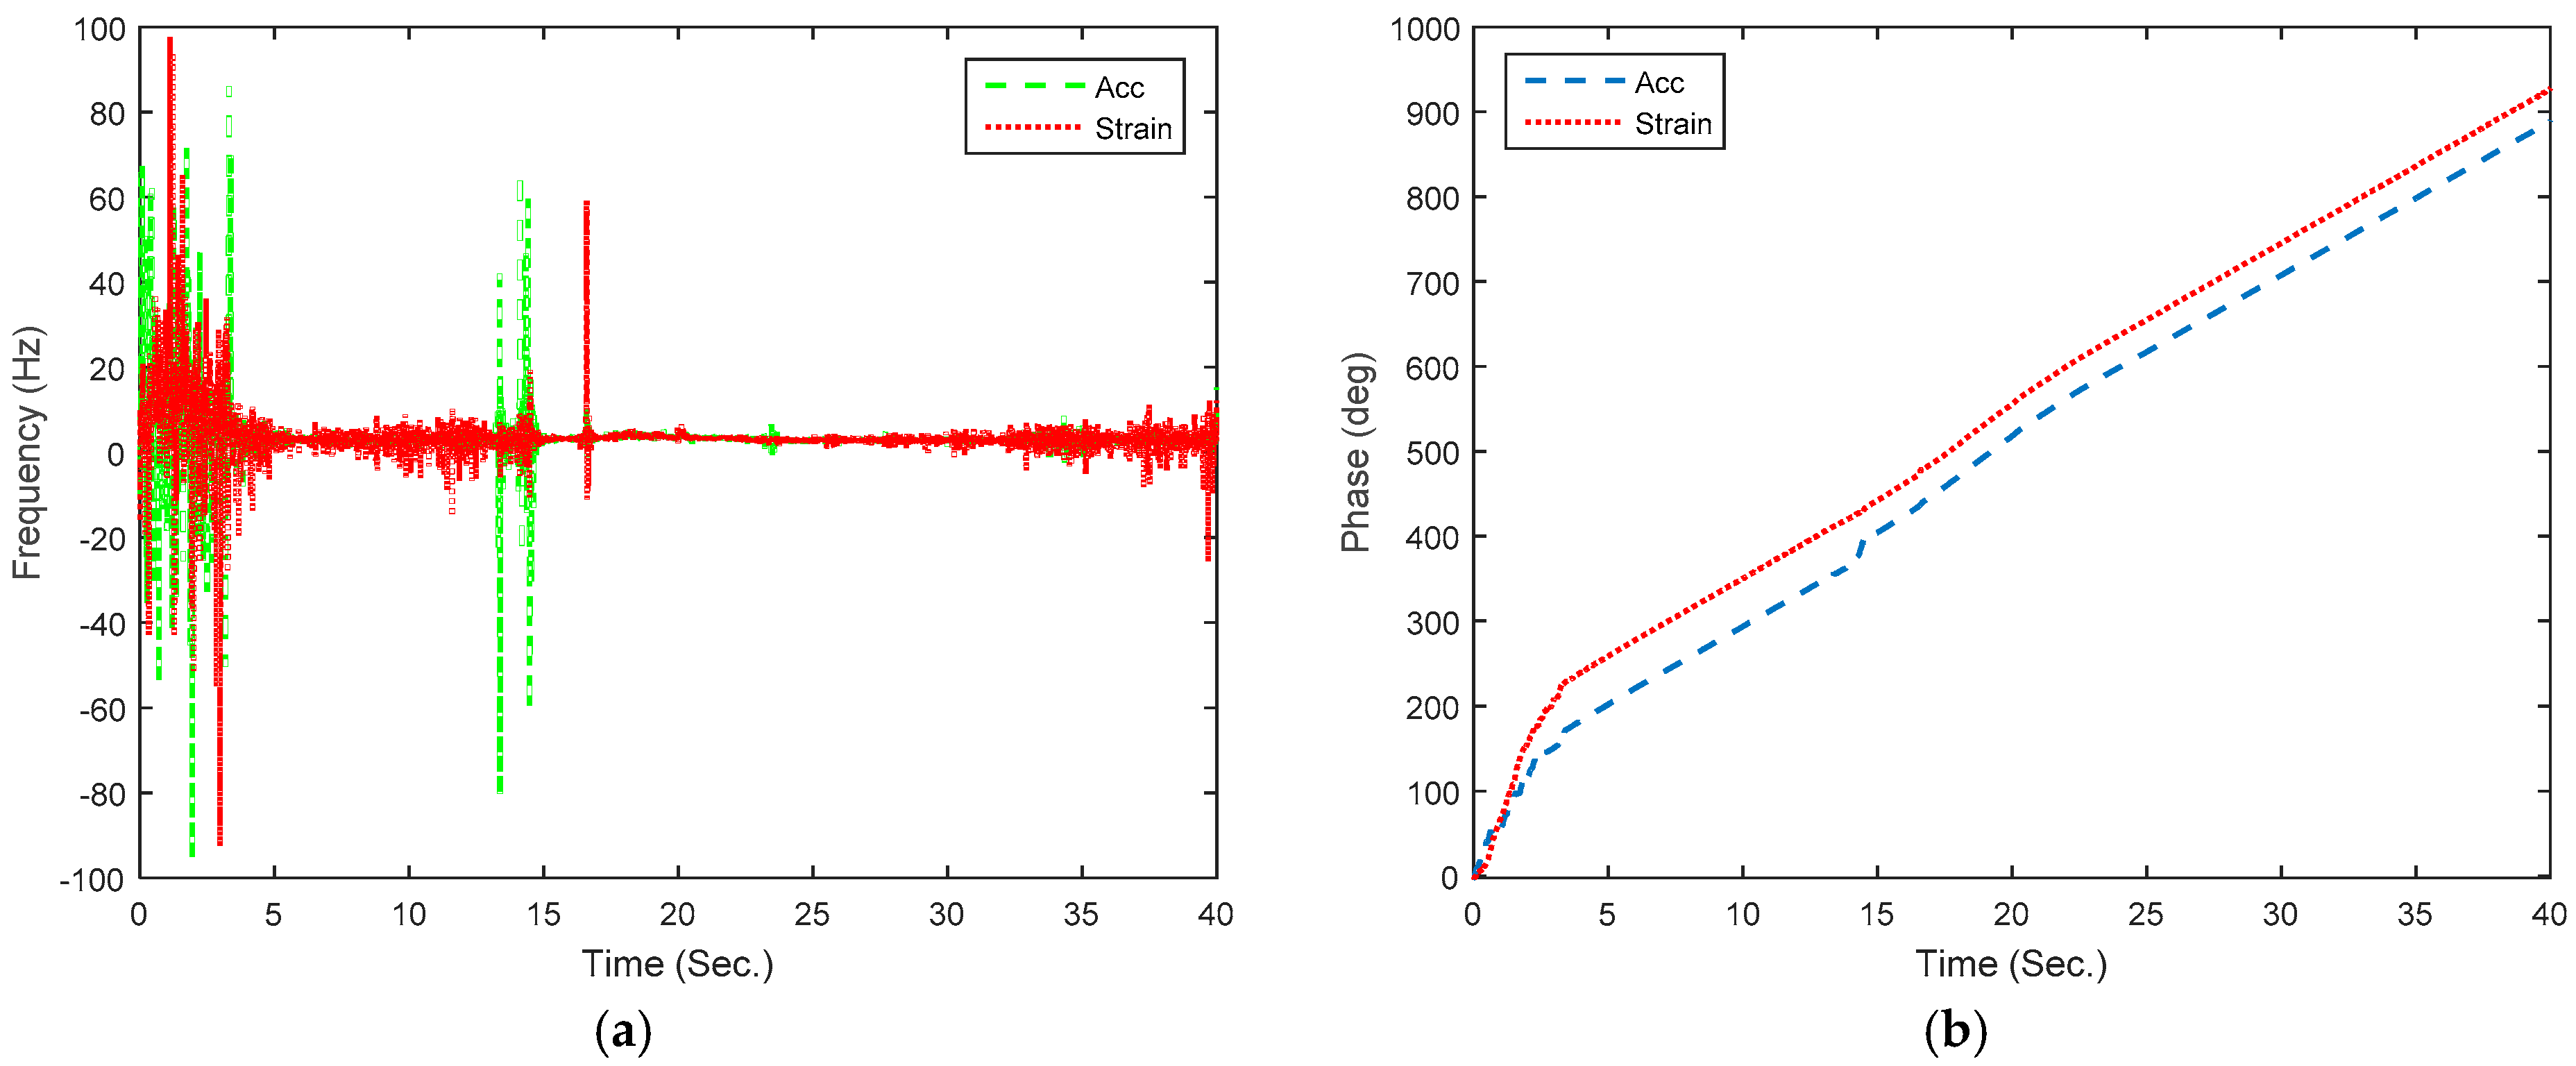
Figure 10 demonstrates the dynamic response of the bridge with 20 km/h truck using strain and acceleration measurements. The time series of the frequency during the measurement time is shown in
Figure 10a. As shown in the figure, the performance of the two sensors was almost similar (the mean frequency calculation for acceleration and dynamic strain was 3.54 and 3.69 Hz, respectively). Moreover, the frequency phase was highly correlated with the constant shift (
Figure 10b). These results indicate that the frequency contents during the measurement time could be accurately detected using strain observations. The fundamental frequency of the bridge is shown in
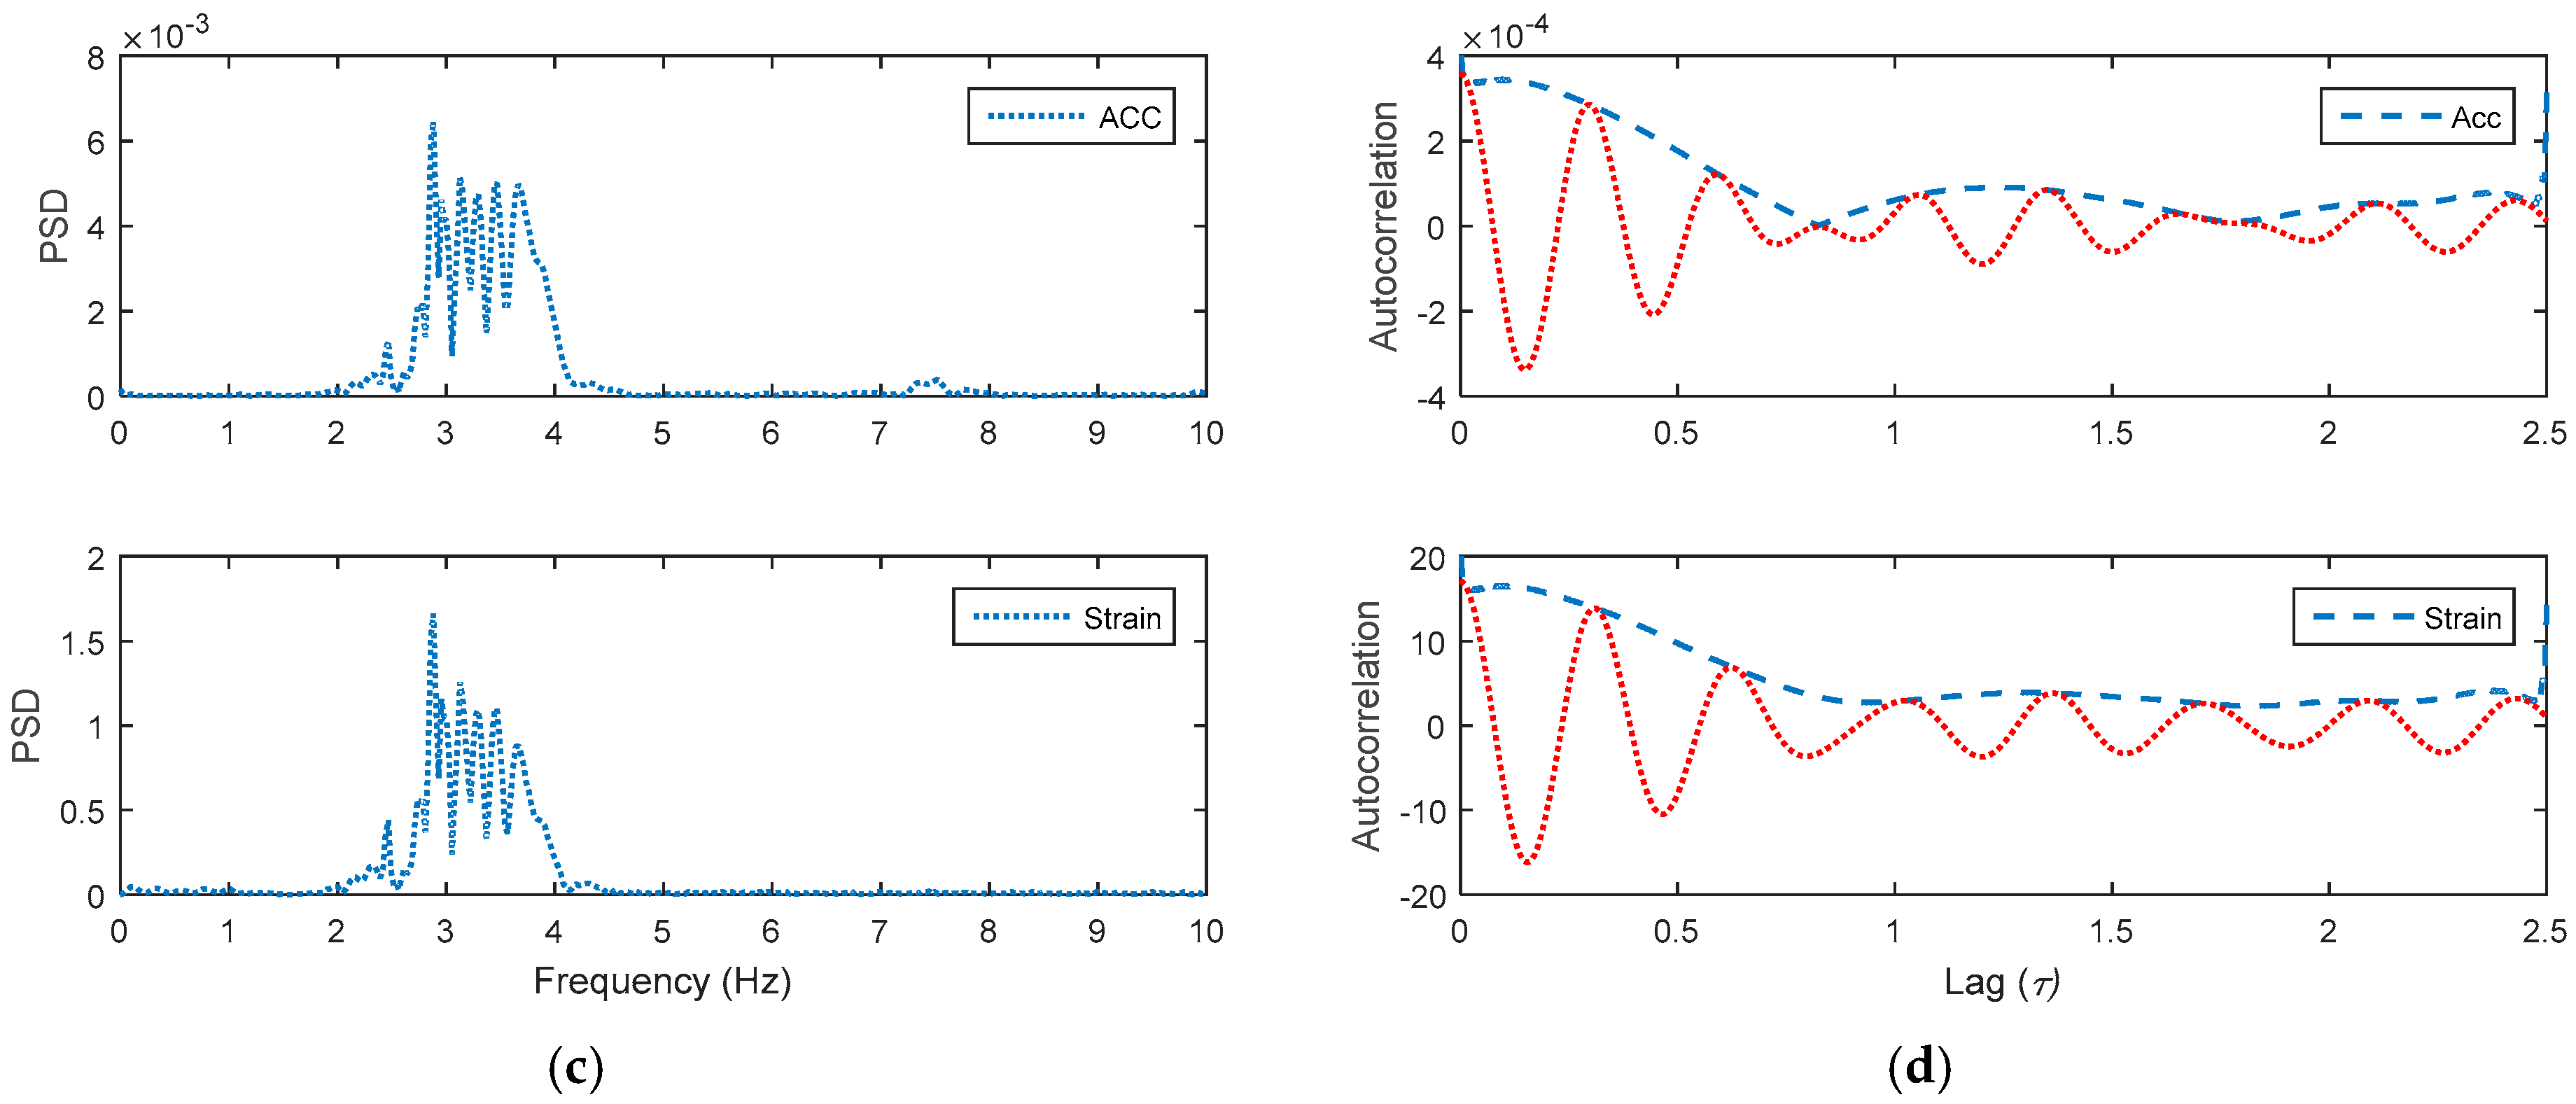
Figure 10c, and the results suggest that the dominant frequency of the bridge was 2.88 Hz for both the acceleration and dynamic strain measurements. Finally, the autocorrelation function (AF) was used to estimate the damping ratio (
Figure 10d), which showed a high correlation of 0.95. In addition, the calculated damping ratio was 0.32, and 0.37 of the dynamic strain and acceleration measurements, respectively. The accuracy of the designed model when estimating the damping ratio was 86.5%. The results show that the developed model could be used to accurately detect the bridge responses in both the time and frequency domains.
To estimate and check the designed model, the displacement and acceleration values of the bridge were predicted, and the identification models were assessed using the truck speeds of 30, 40 and 50 km/h for the same monitoring point (testing stage). The strain measurements were used to estimate the semi-static displacement and dynamic acceleration using the developed model.
Figure 11 and
Figure 12 show the performance of the designed models in the time and frequency domains, respectively, for truck A with a speed of 40 km/h. In this stage, the strain measurements were used only to estimate the semi-static and acceleration; then, the displacement and acceleration measurements were compared with the predicted values.
Figure 11 presents the observed and predicted values for the semi-static and acceleration of the bridge. The evaluation of the displacement shows that the R
2, RMSE and MAE were 0.98, 0.066 mm and 0.054 mm, respectively. Moreover, the R
2, RMSE and MAE of the acceleration model were 0.87, 0.0036 g and 0.0018 g. These results show a high correlation between the observed and the predicted values, which means a high accuracy in estimating the bridge’s responses in the time domain.
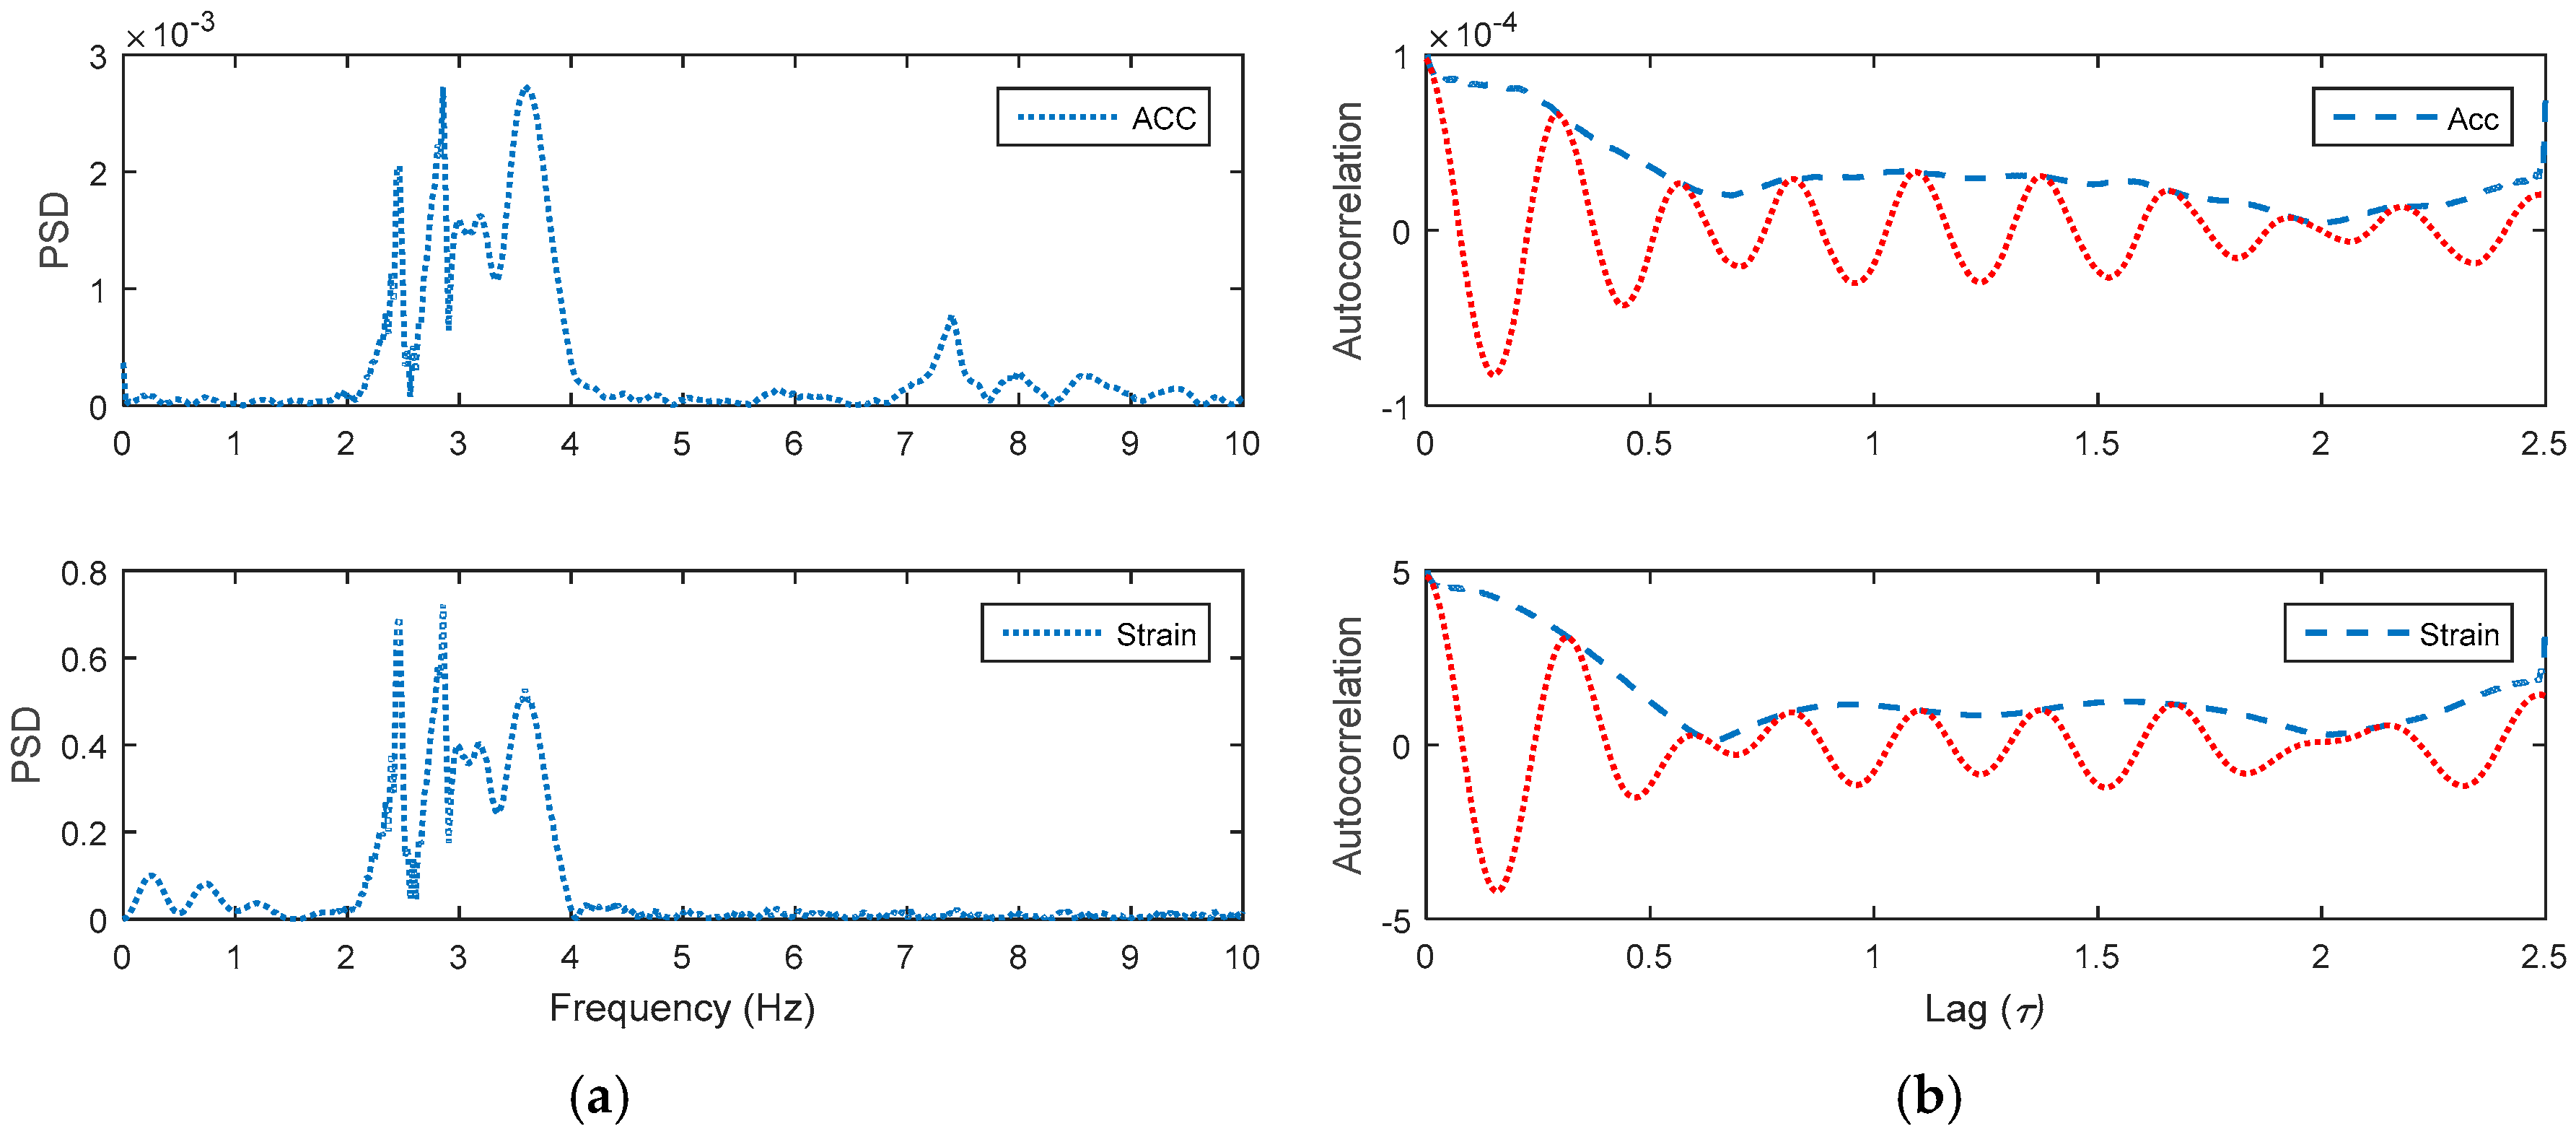
The dominant frequency and damping ratio were calculated and presented for the testing stage (
Figure 12). The dominant frequency with 40 km/h truck speed was identical (2.86 Hz) to the dynamic strain and acceleration measurements. In addition, the damping ratios were 0.79 and 0.59 for the strain and acceleration measurements, respectively. This indicates an accurate performance of the model in assessing this kind of bridge in the frequency domain. Accordingly, the model can be used with strain measurements only to estimate the future behavior of the bridge, thereby leading to a decrease of the monitoring system cost.
Table 3 summarizes the load cases, including the maximum semi-static absolute displacement and acceleration and the dominant frequency and damping ratio. From
Table 3, it can be seen that the variation between the observed and estimated semi-static displacements was very small (maximum variation was 0.07 mm), which means very high model accuracy (99%). Meanwhile, the maximum change of acceleration was 0.02 g (accuracy was 72.6%), indicating that the model accuracy in the time domain was acceptable and could be used to assess the bridge behavior under different kinds of dynamic loads. On the other hand, the dominant frequency estimations for both observed and predicted accelerations were equal. The maximum damping ratio variation change was 0.24 (with accuracy 69%). Therefore, the developed model could be used to precisely estimate the semi-static displacement and frequency with acceptable dynamic acceleration and damping ratio changes using a low-cost monitoring system.
On the other hand, the model was tested to check its capacity to estimate the displacements of other points not considered in the design stage. In this part, the displacements of girders G1 to G5 were evaluated.
Table 4 shows the maximum absolute values of the extracted and the observed semi-static displacements of the girders under the speeds of 20, 30, 40 and 50 km/h.
As presented in
Table 4, the accuracy of the model decreased with the position of the measured girder relative to girder G6. The R
2, RMSE and AME were 0.99, 0.16 mm and 0.08 mm, respectively for the predicted displacement of girder G5; while R
2, RMSE and AME were −1.41, 0.25 mm and 0.16 mm, respectively, for girder G1 with 20 km/h speed. The R
2, RMSE and AME were 0.98, 0.14 mm and 0.07 mm, respectively for the predicted displacement of girder G5; while R
2, RMSE and AME were −1.84, 0.10 mm and 0.06 mm, respectively, for girder G1 with 50 km/h speed. Furthermore, the model error increased with the low speeds, the range of error was 1.26 mm and 1.08 mm under 20 km/h and 50 km/h, respectively. The difference between the observed and predicted displacements reached its maximum values with the far girder from G6. Therefore, for accurate performance estimation, a separate model should be designed for each girder. Furthermore, it can be seen that the estimated displacement values were greater than the actual one; thus, the designed model could be used as an early safety alarm.
5. Conclusions
In the present study, a filtration-prediction model was proposed to decrease the short-period monitoring system cost of monitoring points of plate girder steel bridges. A double filter with polynomial prediction models was designed and evaluated in the time and frequency domains. In addition, a real monitoring system under different cases of dynamic loadings for the WonHyo highway bridge was used. The developed model performance was then evaluated by comparing its results with real measurements. The results of this study revealed the following.
The filtration cycle process was used to eliminate the strain, displacement and acceleration measurements’ noises in time domain. A double filter process was used; however, if the semi-static signals were contaminated, the cycle process of the filtration should be increased. In addition, the polynomial selection depends on the shape of the relationship between the measured and extracted responses of the bridge. In the present study, the second and first polynomial degrees were selected to illustrate the bridge behavior. This model was found to be suitable for the studied bridge, and it should be evaluated before being applied for other types of bridges.
The application of this model to the WonHyo bridge shows that the moving average and wavelet filters were suitable to eliminate the dynamic noises of the measurements. On the other hand, the design stage of the model showed that the correlation between the observed and predicted values was high (R2 = 0.95), while the model error was low for the semi-static (RMSE = 0.029 mm) and acceleration (RMSE = 0.0042 g) predictions in the time domain. In the testing stage, the model performance was low when estimating the acceleration (R2 = 0.87), while the performance was still high (R2 = 0.98) to predict the semi-static displacement. Moreover, the model error for the semi-static displacement and acceleration were small. The bridge frequency for the measured and predicted accelerations was equal in the model design and testing stages. In addition, the signals’ time–frequency and time phase were highly correlated. The accuracy of the developed model in extracting the bridge damping ratio was 86.5% and 69% for the design and testing stages, respectively. These results indicate that the developed model could be effectively used to estimate the full behavior of the bridge using strain measurements only. Furthermore, the predicted displacement values were generally greater than the measured values, this implies that the model could be used as an early safety alarm. Finally, the capability of using the model for the entire bridge was evaluated and tested in the time domain of the semi-static displacement. The results of this evaluation show that the model was suitable to predict the performance of the design point only.


