Abstract
Environmental concerns and growing energy costs raise the importance of sustainable development and energy conservation. The building sector accounts for a significant portion of total energy consumption. Passive cooling techniques provide a promising and cost-efficient solution to reducing the energy demand of buildings. Based on a typical residential case in Hong Kong, this study aims to analyze the integration of various passive cooling techniques on annual and hourly building energy demand with whole building simulation. The results indicate that infiltration and insulation improvement are effective in regard to energy conservation in buildings, while the effectiveness of variations in building orientation, increasing natural ventilation rate, and phase change materials (PCM) are less significant. The findings will be helpful in the passive house standard development in Hong Kong and contribute to the further optimization work to realize both energy efficiency and favorably built environments in residential buildings.
1. Introduction
Resource exhaustion and increasing energy costs have become the shackles of social development, raising the importance of energy conservation. In most countries, the building sector behaves as important energy consumer: it accounts for about 40% of the total world energy consumption [1]. In the US, the building sector consumed 72% of electricity and 36% of natural gas [2]. In mainland China, the building sector also accounts for about 28% of the annual national energy consumption [3]. Governments and professionals around the world have demonstrated the potential and necessity of energy conservation in buildings [4,5]. Notably, some countries proposed green building certification standards, such as the Leadership in Energy and Environmental Design (LEED) as well as the Building Environmental Assessment Method (BEAM), to promote energy-efficient buildings [6,7,8,9]. In addition to the promotion of sustainable behavior in the operation stage [10,11], improving building energy efficiency is the mainstream approach to reducing energy use in buildings.
There are two main strategies to enhance building energy efficiency: (1) active systems, and (2) passive design. The active solutions mainly focus on the employment of energy-efficient building service systems to reduce energy waste in the operation stage of buildings [12,13]. The passive approaches, however, harness the internal environment conditions by taking advantage of the building design items, such as layout and form, rather than mechanical systems. The passive energy-saving solutions maximize the use of environmental sources, such as heating, cooling, ventilation, and lighting to create a comfortably built environment with a minimized energy demand [14,15,16]. Building envelop design can affect 20–60% of the building energy input, making it crucial for high-performance, sustainable buildings [17]. Compared with the active solutions, the passive designs generally require less life cycle cost [18], and present more significant energy-saving effects [19] as well as longer lifespans. For example, a proposed passive adaption solution for a residential case showed an 8.18-year payback and a carbon dioxide emission reduction of 11.674 million kilograms [20]. Essah et al. [21] reported a passive design solution for a residential case in Beijing, which reduced the working time of the mechanical heating and cooling system by half, thereby saving 50% of energy consumption.
In Hong Kong, a densely populated city, the electric energy consumption of the building sector accounts for over 90% of the total electricity consumption. [22,23]. There are approximately 7.50 million residents in Hong Kong, where 44.8% of them live in high-rise public housing [24]. Hong Kong’s extremely high-density space utilization [25] and hot and humid subtropical (HHS) climate pose significant challenges for constructing buildings that are both energy efficient as well as comfortable. Due to the heavy dependence on the heating, ventilation, and air conditioning (HVAC) system, Hong Kong’s buildings are not designed in a sustainable way. Recently, passive design can be found in add-in features in buildings, but has not yet emerged as the main method to achieve building sustainability. Future buildings will need to focus on large energy reduction for global sustainable targets, which may pose a challenge for solely active design. Previous studies have proposed various passive design solutions and discussed their implications and potential benefits for buildings [26,27]. For example, Yu et al. [28] developed phase change material (PCM) solutions for buildings in different climate zones in China. Liu and Lee [29] discussed the window opening degree for natural ventilation in the residential case in Hong Kong. However, only a few published works focused on the comprehensive assessments of these passive cooling strategies in Hong Kong.
This study aims to compare the energy use reduction when using several passive building design technologies, so as to understand how to use such technologies in the HHS climate regions, such as in Hong Kong. The study first searched for common and useful passive building design techniques in a similar climate via a literature review. Then, such techniques were compared based on a typical high-rise residential prototype building with a whole building simulation software for the Hong Kong climate. The study employs EnergyPlus, a widely-employed tool developed by by a team composed of the US Department of Energy (DOE), the US army construction engineering research laboratories (CERL), University of Illinois, Lawrence Berkeley National Laboratory and other institutions. This study compares the energy-saving effects of passive cooling techniques by discussing the annual consumption reduction and the hourly saving characteristics of the case with different passive design strategies. The findings will be helpful in the passive house and green building standard development in Hong Kong and contribute to further works to realize both energy efficiency and favorably built environments in residential buildings. A better understanding of passive design techniques in Hong Kong will guide the use of passive design technologies to reduce energy load. Moreover, new passive design methods and technologies emerged and were found to be helpful in other regions with similar climates.
2. Literature Review
Hong Kong is hot and humid for most of the year and has a long cooling period [30]. Passive building systems are fundamental to achieve high energy efficiency and comfort in built environment [31,32,33]. The current development of the passive cooling design shows high potential for it to achieve high energy efficiency in buildings with access to its proper use [34,35]. The Hong Kong climate, however, is not optimal for many techniques such as direct natural ventilation due to occupancy comfort. The average temperature is around 33 °C with 80% relative humidity in summer and 12 °C in winter. The temperature in winter can reach 3 °C in extreme conditions. The climate is cooling-dominated. According to the local sustainable building design guide, BEAM Plus [6,7,8], the air conditioning period is for seven months from April to October. Several pieces of research focusing on passive design techniques in a climate with a warm temperature, a dry winter and a hot summer show potential energy-saving with acceptable occupancy comfort [30,36,37]. Features such as window to wall ratio and orientation can be crucial for success in passive design. The widely employed passive design technologies can be categorized into four groups: (1) geometry, (2) passive envelope, (3) solar shading, and (4) natural ventilation.
A building’s geometry determines its self-shading, daylight availability, solar gain, natural ventilation, noise control, and pollutant dissipation [38]. For residential buildings, a certain amount of self-shading can improve the total energy performance, as the cooling load reduction outweighs the slight increase in lighting energy [30]. Geometry also affects the availability of natural ventilation inside the building, especially the wind-driven ventilation. An unobstructed layout is favorable as it can effectively drive the airflow through the building [32]. Carefully chosen building orientation and location can maximize wind availability. Comparisons of simulation results among different public residential buildings in Hong Kong show clearly that certain types of layout (e.g., concord type) have fewer hours of discomfort in Hong Kong, even under the free-running condition [33]. Additionally, passive design in geometry and layout involves the early stage of design and thus usually requires no extra investment.
The properties of building envelopes significantly affect the building thermal performance [38]. Three passive building envelope design techniques are widely-employed: (1) thermal insulation layer, (2) PCM, and (3) fenestration. The thermal insulation layer is made from materials with low thermal conductance, such as wool and polystyrene. Thermal insulation reduces the energy intake from the envelope by reducing the U-value of the external wall. Zhang et al. [39] found in an experiment that the best insulation performance occurs when the innermost layer on the external wall shows a 35–86% reduction in heat flow rate. The optimum thickness for insulation varies largely depending on the building location and materials [40]. In addition, PCM is also widely used in passive building envelope design and presents strong high energy-saving potential in a warm climate. For example, a case in Ankara improved energy efficiency by 7.2% [41]. In Hong Kong, PCM might save 2.9% of annual energy consumption under 28 °C with a long energy payback period of 23.4 years [42,43]. However, PCM might add energy load to the AC at night. Precise PCM enthalpy curve simulation is required to present a more accurate result. Tabares-Velasco et al. [44] validated the method of conduction finite difference (CondFD) to the simulation of PCM in EnergyPlus with empirical results, and they suggested that considerable savings can be achieved with PCM. Fenestration takes up a large amount of heat input to of building’s cooling system [30]. Through fenestration, both beam and diffuse solar irradiation heat the room air as well as the internal thermal masses, increasing both sensible and latent cooling loads. A common way to restrict the heat gain from the window is to reduce the window-to-wall ratio. However, this method also blocks the view of the occupants and reduces the efficiency of natural ventilation. Another way to reduce the heat gain from the window is to use glazing with higher performance, such as tinted glasses and low-E glazing etc. This glazing can restrict the heat gain from the window. Tian et al. [45] compared clear, tinted, reflective and low-e glazing for their energy-saving in regard to both HVAC and artificial lighting electricity use in Hong Kong. Low-e glazing is the most energy efficient due to its good thermal performance and high visible light transmittance, reducing both HVAC energy and lighting energy use. Though considered as an energy-saving measure, tinted glazing was the less favorite as it reduces visible light transmittance thus consuming more energy to maintain an environment with good lighting. Low-e glazing would be an appropriate passive technique for a good-performance building in Hong Kong.
Two types of devices (fixed or movable) can be installed as external shading devices, and internal shading devices are commonly used to control the solar radiation in the conditioned space [46]. These devices partially block solar radiation and reflect it to the outdoor environment. Additionally, they can control glaring from the outdoors when used properly. Popular fixed shading devices in Hong Kong include horizontal overhangs and vertical side fins outside windows. Both devices can block the direct solar beam radiation from certain angles. Their characteristics are defined by overhang projection factor (OPF) and side-fin projection factor (SPF) (Equation (1) and (2)), which are at an average of 0.34 and 0.31, respectively, in Hong Kong [38]. Devices with larger factors can block direct sunlight from more angles and achieve low solar heat gain. However, the devices can also block the view from inside, affecting the visual comfort [47]. A fixed external shading device may block solar energy from entering and heating up rooms, subsequently increasing the heating load in winter.
where OPF—overhang projection factor; Lo—length of overhang; Hwin—height of window (assuming overhangs are directly above the top of windows).
where SPF—side-fin projection factor; Lf—length of overhang; Wwin—width of window (assuming side fins are directly on both sides of windows).
Ventilation and infiltration are also important parts of the cooling load to buildings. Infiltration largely increases the total cooling load by 9.4%, where 56% is latent load. In the summer cooling condition, the outdoor air entering a building from both paths leads to a large cooling load increase. The satisfactory infiltration rate for a passive-designed building should be less than 0.6 ach (i.e., air changes per hour) [36]. Natural ventilation is one of the most efficient and traditional approaches to achieve indoor comfort [48]. It can provide good indoor quality without energy consumption and increase thermal comfort by increasing air movement in summer [49]. In modern buildings, natural ventilation can also be used to reduce energy consumption. The most common types are free cooling and night ventilation. Free cooling happens when the outdoor air can be used to directly offset the indoor cooling demand without affecting thermal comfort. Night cooling uses air with a lower temperature to offset the cooling demand at nighttime.
3. Methodology
In Hong Kong, high rise public rental housing accommodates 44.8% of the population [24,31]. These public housings generally share a similar building layout model called concord type. The concord type includes one core structure and four wings extending in four directions. The core structure part generally hosts building service functions such as duct wells and lifts. Therefore, the core part is usually unconditioned. The wings connect to the core and are the main occupancy area. Concord-type buildings present the advantages of a better building thermal performance and less hours of discomfort [33]. The concord-type layout is a common starting point for passive design analysis in Hong Kong. The concord-type public residential buildings generally present higher building information availability and homogeneous characteristics in building design and room conditioning setups, which makes them satisfactory cases for building performance study. As a baseline for comparison, the energy use for public housing is 528 MJ/m2/annum [32].
This study employs the whole building simulation to reveal the predicted building performance throughout a year with local predicting climate data. Building information including geometry and material is inputted in the energy simulation software to generate the performance data for a detailed analysis. The data can reveal performance differences in different scales including annual energy-saving data, detailed hourly energy use and comfort, and even detailed surface temperature. EnergyPlus v8.8.0 is adopted for whole building simulation. EnergyPlus is an energy simulation software developed by the National Renewable Energy Laboratory (NREL) of the United States. It is widely used in research to study building energy use and occupancy comfort. The data analysis will focus on the annual consumption reduction and the saving characteristics of different hours of the day. Input values from research, design standards, and local practices are used for building modeling. This study sets variables for passive cooling techniques to discrete values for comparison based on the recommended range, and employs the local benchmarks on residential buildings to compare energy efficiency.
The basic model building layout is shown in Figure 1, which shows the typical floor layout and conditioned zone of high-rise public housing in Hong Kong. The original building has eight flats per floor with 40 floors. Each flat is about 45 m2. Each floor is 2.75 m in height. From the study of Kwok et al. [33], the concord type has a better thermal performance than other types of public housing layout. The windows follow the construction layout. The windows are 1.2 m in height and are situated 0.8 m above the floor. Originally, the windows of conditioned zones have overhangs directly above the windows with an OPF at 0.3. The fixed condition for simulation is refers to research and the Chartered Institution of Building Services Engineers (CIBSE)-recommended value. The occupancy density is 0.08 people/m2 assuming 3–4 people per flat. The internal heat source from occupants is 100 W per person. The lighting load density and equipment load density is 15 W/m2. The cooling setpoint is assumed at 25 °C as the balanced value for common settings in Hong Kong. The conditioned area will have the same air conditioning operation schedule as in Figure 2. The construction and building materials are modeled based on common practice and real building data. Table 1 presents the typical building construction in public residential housing in Hong Kong and summarizes the U-value of building material data in detail. The U-values of the materials refer to Kwow et al. [33]. Table 2 and Table 3 illustrate the material properties of glazing and PCM, respectively. The data in this study refer to Tian et al. [45] and PLUSS [50]. Especially, the enthalpy–temperature characteristics of the SavE phase change material are extracted from its technical data sheet [50]. Clear low-e glazing was found to provide the best performance in Hong Kong according to Tian’s study [45]. Both “LoE 6 mm” and “LoE Spec Sel 6 mm” are two types of clear double plane fenestration systems with low-e coating.
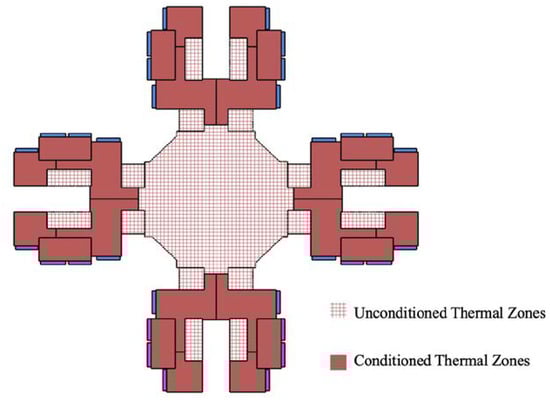
Figure 1.
Typical floor layout and modelled thermal zones.
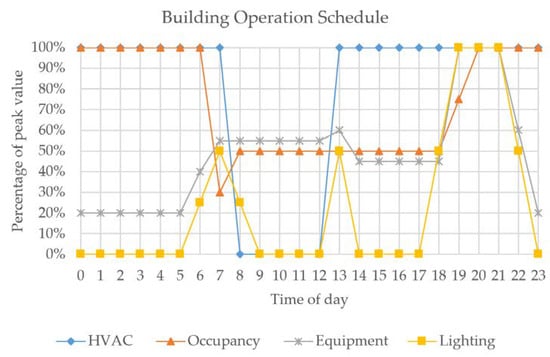
Figure 2.
Building operation schedules.

Table 1.
General construction and building material data.
Table 2.
Material properties of glazing.
Table 3.
Material properties of PCM.
All floors in this building with boundary conditions can be categorized into three different types of floor, i.e., ground (G), typical (TYP), and top (TOP). The G floor is the floor directly contacting the ground surface. The TOP floor is that with a rooftop which is directly exposed to the sun and wind. The TYP floor is the floors among these two floors. For this study, the context is not modelled and simulated. Suggested by an initial test, the performance difference between floors should mostly be incurred by different boundary conditions. The floors between TOP and G have identical geometry and boundary conditions thus can be generally represented by a TYP floor in the middle of the building. This sandwich modelling method may reduce some accuracy, but it significantly reduces the computational complexity as well as the simulation time for this 40-floor building. Modeling the three types of floors and adding multipliers can generate a similar result to the actual building consumption. Thus, the alternative modeling approach is used, and the simulation model is as shown in Figure 3. Two intermediate floors are added between these floors to offset the inter-influence of types of floor models when directly placed adjacent to each other. A multiplier at 36 is added to the typical floor to calculate the energy consumption of the whole building.
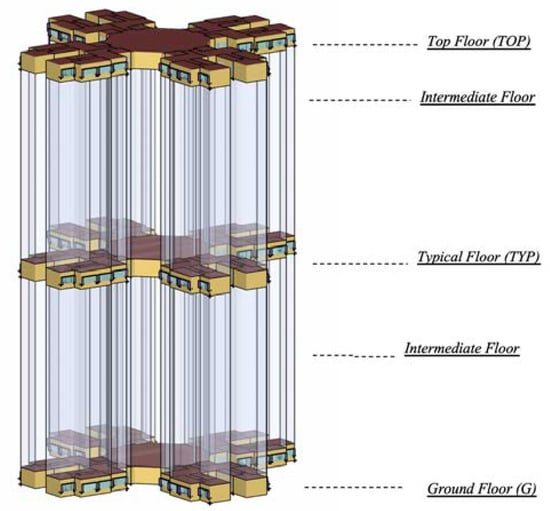
Figure 3.
The sandwiched EnergyPlus Simulation Building Model. Note: top floor (TOP), ground floor (G) and typical floor (TYP). TOP—zone roofs and exterior walls exposed to outdoor condition; G—zone floors in contact with the earth, exterior walls to outdoor; TYP—zone exterior walls exposed to outdoor condition. Intermediate floors—the buffer zone between TOP and TYP as well as G and TYP to limit the heat flows and increase TYP floor accuracy.
In Hong Kong, the common type of HVAC system in residential buildings is the window type unitary unit. Thus, the “unitary system” is applied in this model. The model is calibrated and validated based on its cooling load and zone air temperature, and is compared to the local benchmark to ensure the accuracy of the simulation result. Buildings’ HVAC systems are turned off completely from 1 November to 31 March in accordance with the cooling period in Hong Kong. The simulation of other components is achieved by specifying the specific inputs in EnergyPlus. The HVAC system coefficient of performance (COP) is at 3 for cooling. As heating is not provided in Hong Kong, heating power is set to 0, i.e., no heating. During the HVAC off time, the ventilation setting is increased to simulate the effect of opening windows. The ventilation has an upper limit on the outdoor temperature of 32 °C and a lower limit on indoor temperature of 18 °C, simulating people closing their windows in hot or cold weather. The infiltration rate was set at 2 ach for the whole run period. The infiltration value initially referred to other researchers’ studies and the Building Energy Code, and was fine-tuned in the validation run [36,51].
EnergyPlus allows the simulation of the selected passive cooling techniques by adding geometry, changing materials or altering parameter setting. The reference value is based on the common practice in Hong Kong and original construction. The recommended value and test range of passive cooling techniques are based on the findings in the literature review. The material properties for the insulation and glazing are directly extracted from the built-in libraries of EnergyPlus, which are based on the American Society of Heating, Refrigerating and Air-Condition Engineering (ASHRAE) handbooks. SavE OM29 has a melting point of 29 °C and may be more suitable for use in Hong Kong. The data regarding its properties are extracted from the manufacturers’ specification of the selected PCM [50]. The inputs for passive cooling techniques are shown in Table 4.
Table 4.
Passive cooling techniques simulation inputs in EnergyPlus v8.8.0.
In total, 22 sets of simulations were conducted to compare the annual energy performance and reveal the continuous performance characteristics of the techniques. For each set, at least one verification run was conducted, in which the EnergyPlus inputs, warning messages, simulated model, and the hourly result data were checked to ensure that the simulation is reasonable and matches real-world characteristics and other researchers’ findings. The simulation timestep was set to three minutes. The weather data for Hong Kong was taken from the EnergyPlus website. It was developed from typical annual weather data by Dr Chow and Chan of the City University of Hong Kong. The solar radiation was measured at 22.32 N, 114.17 E, 65 m above mean sea level. The data are originally presented in a spreadsheet in International Weather for Energy Calculations (IWEC) format [52].
4. Results and Analysis
4.1. Annual Electricity Consumption
A number of simulations were conducted to generate results for each passive cooling techniques under the same building condition. Table 5 summarize annual building electricity consumption of all simulations. The energy-saving potential for passive cooling is not substantial but still provides a considerable amount of energy-saving. The equation to calculate the percentage difference is calculated as in Equation (3) for each timestep (hourly). The reference building consumes 3,162,523 kWh/annum. The electricity consumed per gross floor area is 127.97 kWh/m2/annum. Due to the invalidity of the raw building use data, the energy simulation data were validated by comparing them to others finding and the average electricity use data for public residential buildings in Hong Kong [32,33]. The electricity intensity figure of the simulated baseline prototype building is 13% less electricity than the average of a public rental house (147 kWh/m2), which corresponds to the study of Kwok et al. [33] that the concord-type layout is more energy efficient than average. This suggested that the modelled prototype building is in line with the general building energy performance in Hong Kong. The analysis results are suitable as indicators for public residential buildings in Hong Kong.
where, %diff—percentage difference; N—the inputted value or result value of the tested parameter; N,ref—the baseline value of the tested parameter inputted in or resulted from the baseline simulation model.
Table 5.
Annual electricity consumption results.
The most effective passive cooling design is that which has a reduction in infiltration and additional envelope insulation. The reduction in the infiltration rate substantially mitigates the heat gain from the hot outdoor air. When the outdoor air infiltration rate is reduced from 2 ach to 0.6 ach, 237,580 kWh of electricity per annum is saved. If the infiltration rate can be further reduced to 0.3 ach, the annual energy consumption saving can be 9.63% and 304,693 kWh in total. The insulation has a great saving potential by limiting the heat flux penetrating the external wall. By adding a 10-mm mineral wool insulation layer at the inner surface of the external layer, the annual energy consumption is reduced by 2.09% and 65,958 kWh. By increasing the thickness to 50 mm, the energy-saving in annual building energy consumption is only doubled to 4%. An increase in the thickness of the insulation layer is linearly related to energy-saving, which indicates that a critical thickness exists for balancing cost and saving potential.
Alternation in building orientation does not effectively influence the energy consumption of the model building in this study. When the building is at a 30-degree axis to the north, the total energy consumption is slightly higher than the reference building. As building orientation is related to self-shading, the result indicates that the self-shading effect is related to the building geometry. However, a more sophisticated analysis of the relationship between building shapes and self-shading effects as well as the saving potential should be further determined. Besides, PCM does not show large saving potential in this study. The result corresponds to the research of Chan [43]. The Hong Kong climate is not optimal for the application of PCM, which achieves its maximum saving in the climate with large day/night temperature differences. Moreover, cooling schedules in residential buildings, especially bedrooms areas, cover the nighttime period when the PCM is releasing the energy. Instead of reducing the cooling load, the cooling system is used to cool down the PCM, which leads to unfavorable performance in residential buildings.
Only a marginal saving of 0.66% is achieved by halving of the window size (WWR from 17.88% to 14.31%). However, improving window properties from clear glass to low-e glazing shows a higher energy-saving potential. Low-e glazing is more effective in blocking the solar heat gain in the conditioned areas than reducing the window size. When glazing is further improved to the low-e Spec Sel type, around 50,000 kWh of energy can be saved annually. Adding solar shading devices is another feasible way to reduce the cooling load. Extending the overhang to 0.5 OPF from 0.3 OPF reduces the annual energy consumption by 0.37%. However, if the overhang is further extended to 1.0 OPF, the annual energy-saving is 1.25%. Vertical shading devices are not as effective as the overhangs. When side fins are added at both sides of the windows to match original overhang with OPF 0.3, the annual saving percentage is only 0.24%. If the overhang remains the same and the side fins are extended to have an SPF of 1.0, the saving percentage is only 0.63%. However, the combination of vertical shading devices and overhangs shows a high saving potential. If both overhangs and side fins are extended to have OPF 1.0 and SPF 1.0, respectively, the annual energy-saving is 1.75%.
4.2. Hourly Electricity Consumption
Because of the large size of profile data, the hourly analysis for the cooling load is divided into several steps to filter out the outstanding data to better analyze and compare the saving characteristics of the passive cooling techniques. The day where non-conditioning hours (7:00 AM to 13:00 PM every day between 1 November and 31 March) are excluded. First, the saving percentage of each passive cooling technique for each floor is plotted on three box-and-whisker charts based on the type of floor. The box-and-whisker charts show the median and the range of distribution of data over the hours and leave out points with large errors. The boxes show where 75% of points in a dataset act as an indicator for the variation pattern of the % difference. Next, the outstanding datasets are located, and their raw data are extracted for further analysis. The median value of the data (excluding the raw data) is calculated to exam the characteristics of these passive cooling techniques in hourly basics. The box-and-whisker graphs are attached in Appendix A, Appendix B, and Appendix C. The natural ventilation case is left out as the annual consumption result shows that it does not save energy. The detailed box-chart for the annual percentage difference distribution of cooling load vs. hours of days on ground floor for each test case can be found in Append A for Ground floor, Appendix B for Typical Floor, Appendix C for Top Floor. The analysis for the hourly characteristics of passive cooling techniques was mainly based on these charts for a general energy-saving potential in each hour of day.
PCM shows a heating effect for the residential building during the nighttime on all three floors as in Figure 4. PCM can save around 3% of the cooling load in the afternoon from the melting of PCM. However, during the night, especially after 02:00, PCM increases the cooling load by 1–4%, which offsets the saving benefits in the afternoon. Shown in the box-and-whisker chart, the reduction in infiltration also shows a night-heating effect in certain periods. Unlike PCM, the night-heating effect for the reduction in infiltration only happens during the spring and autumn when a large daily temperature difference occurs. In this time, the infiltrated cool air in the nighttime provides natural ventilation to cool down the conditioned zones. The reduction in infiltration blocks this source of free cooling, subsequently increasing the cooling load in the nighttime on these particular dates. However, the median of %diff in Figure 5 shows that the impact on the effectiveness of this method is marginal for annual energy reduction. If natural ventilation can be coupled with the reduction in infiltration to be the new source of free cooling, this particular increase in cooling load can be offset, further increasing the building’s energy efficiency.
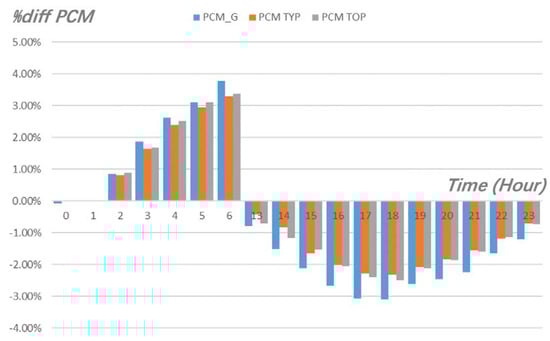
Figure 4.
Hourly median for energy performance on different floors presented in percentage difference from benchmark after applying PCM. Note: PCM_G—the difference for ground floor; PCM_TYP—the difference for typical floor; PCM_TOP—the difference for top floor.
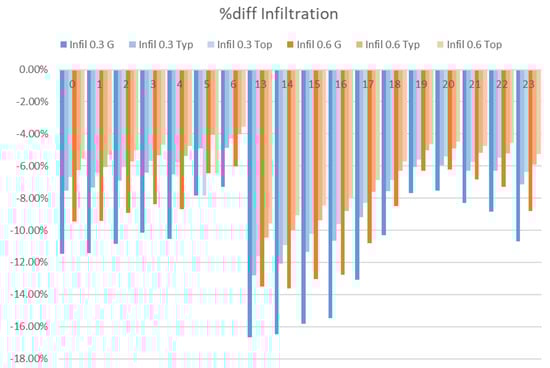
Figure 5.
Hourly Median of percentage difference in total electricity after applying infiltration parameters. “Infil 0.3 G”—the data of the ground floor for the simulation run with 0.3 ach infiltration rate; and so on.
As for insulation, the range of data shows an increase in cooling load from 13:00 to 15:00 for some days. The increase in cooling load also happens in spring and autumn. Similar to the infiltration, the reason for the increase in cooling load is the blockage of the source of cooling. In spring and autumn, the outdoor air is still not hot, and is cooler than the indoor air. The insulation layer reduces the U-value of the external wall, subsequently reducing the heat loss through the external wall on these cool days. After the cooling system is turn off at 07:00, the heat is accumulated in the conditioned zones, leading to a large increase in cooling load when the cooling system is turned on again at 13:00. The ground floor has the least influence as the heat gains can be conducted to the ground instead of being accumulated in the zones.
The improvement in glazing types, window to wall ratio, and solar shading increase building energy performance in both the daytime and nighttime. As solar radiation is reduced by these methods, the thermal storage from solar heat gain is reduced, which reduces the cooling load at night. Moreover, these methods show no increase in cooling load, as shown in all three charts in Appendix A, Appendix B, and Appendix C. This may indicate that no adverse effects in building energy performance are caused by these methods. Again, the charts show that the vertical shading devices are not as effective as overhangs in Hong Kong, as peak load reduction is less than that of the OPF. The best case for solar shading is to combine both vertical and horizontal shading devices.
From the charts, the patterns of hourly analysis figures for all three types of floors in this residential building are quite similar. The pattern for individual technologies does not change much across the different types of floor and follows a similar peak pattern, indicating that time variation of these technologies does not change with floor boundary condition. This might correspond to the operation schedule of the building model. However, when comparing the %diff in cooling load among the three types of floors, the ground floor shows the largest saving potential in almost all types of passive cooling techniques, while the top floor has the least. For instance, the change in building orientation does not affect the energy consumption on the ground floor, but increases that on the top floor by around 1%. The result is related to the heat transfer characteristics and boundary conditions of these floors. The top floor receives more heat gain from the rooftop of the building, which is directly exposed to the outdoor condition. The proportion of heat gain from the roof is larger than that of the other two, as the passive cooling techniques in this study mainly focus on the heat gain from the envelope, solar radiation, and infiltration. With a large reference cooling load rate, the percentage of difference is less than that of the typical floor and ground floor. For the ground floor, the ground acts as a way of heat loss as the ground temperature is usually lower than the room air temperature.
5. Conclusions
This study utilizes simulation software, EnergyPlus, to simulate the annual energy consumption of models with different passive cooling techniques applied to a public rental building in Hong Kong so as to comparatively analyze the impact of these technologies on building energy performance. In general, the most effective passive cooling techniques are the reduction in infiltration rate and addition of insulation. The alternation in building orientation, PCM, and a simple increase in ventilation rate are not effective for Hong Kong residential buildings. Combining the findings in the review of the literature and analyses of both annual energy consumption and the hour-based percentage of saving, the following is a summary of the findings in our analysis of the characteristics of the tested passive cooling techniques:
- PCM is not suitable for the Hong Kong climate and residential sectors due to the night-heating effect.
- In terms of energy-saving, reducing the infiltration rate is highly effective in reducing annual electricity use for cooling purposes. In a small amount of days when the outdoor temperature is lower than indoor temperature, the low infiltration rate reduced effectiveness of free cooling, subsequently increasing cooling energy. Noticeably, over-reducing infiltration rates in residential units is not favorable in Hong Kong. In the cooling period, people may not intentionally open windows for fresh air, because this action is generally considered to be waste of cooling energy. In such cases, acceptable indoor air quality is maintained by infiltration. Further studies could aim to find a balanced infiltration rate of energy-saving and indoor air quality.
- Insulation is effective in saving annual energy. However, insulation layers can reduce heat loss through external walls during the cool seasons, i.e., spring and autumn. A critical thickness exists.
- The percentage of energy-saving is not linearly proportional to the thickness of insulation. Doubling the thickness of insulation cannot double the percentage of energy-saving.
- The improvement of glazing effectively reduces the cooling load during both the day and night throughout the year. Reducing the window to wall ratio is not effective in annual energy-saving.
- The combination of an overhang and side fin provides the highest saving. When used separately, the vertical shading devices are not as effective and horizontal shading devices under the same value of OPF or SPF.
- Alternatives in building orientation are not effective for the concord-type public rental house.
- Tested passive cooling techniques present no bias on different floor boundary conditions in terms of time characteristics, but some achieve higher saving on the ground floor or top floor in regard to saving potential.
The study also has some limitations. While the validation of each type of passive cooling design would further improve the accuracy of the data, they could not all be included in this study due to financial, time, and knowledge constraints. Validation for all simulations will be considered in an early stage in further research. A detailed analysis of the time difference, parametric energy reduction model of each technology, and the impact on human comfort is yet to be performed due to time constraints and computer calculation limitations. Moreover, the analysis focused on annual consumption, and the improvement in the thermal performance of the building has not yet been fully tested. The box-and-whisker charts and median values only show the range of distribution and cannot analyze the time profile in detail. In short, more detailed and sophisticated studies including comprehensive affecting factors and full validations are required to show a more comprehensive examination of the characteristics and impact of these passive cooling techniques on the building’s energy demand.
Author Contributions
Conceptualization, C.-R.Y., H.-S.G. and Q.-C.W.; methodology, C.-R.Y. and Q.-C.W.; case study, H.-S.G. and R.-D.C.; original draft preparation, H.-S.G., and Q.-C.W.; writing—review and editing, H.-S.G., Q.-C.W. and R.-D.C; project administration, R.-D.C. All authors have read and agreed to the published version of the manuscript.
Funding
The research project is partially supported by the China Scholarship Council (CSC).
Acknowledgments
The authors would like to thank Cao Sunliang and Meng Ni from the Hong Kong Polytechnic University.
Conflicts of Interest
The authors declare no conflict of interest.
Abbreviations
AC—air conditioning; BEAM—building environmental assessment method; CO2—carbon dioxide; GBRT—green building rating tools; NZEB—net zero energy building; OPF—overhang projection factor; OTTV—overall thermal transfer value; PCM—phase change material; Ref—reference; SPF—side fin projection factor; %diff—percentage of difference comparing to reference value.
Appendix A


Figure A1.
Annual percentage difference distribution of cooling load vs. hours of days on ground floor. Note: The unit for the x-axis is %diff, the unit for the y-axis is hour.
Appendix B


Figure A2.
Annual percentage difference distribution of cooling load vs. hours of days on typical floor. Note: The unit for the x-axis is %diff, the unit for the y-axis is hour.
Appendix C


Figure A3.
Annual percentage difference distribution of cooling load vs. hours of days on top floor. Note: The unit for the x-axis is %diff, the unit for the y-axis is hour.
References
- Liu, D.; Zhao, F.-Y.; Tang, G.-F. Active low-grade energy recovery potential for building energy conservation. Renew. Sustain. Energy Rev. 2010, 14, 2736–2747. [Google Scholar] [CrossRef]
- Efficiency, Energy. In Energy Efficiency Trends in Residential and Commercial Buildings; US Department of Energy: Washington, DC, USA, 2008.
- Liu, Z.; Liu, Y.; He, B.-J.; Xu, W.; Jin, G.; Zhang, X. Application and suitability analysis of the key technologies in nearly zero energy buildings in China. Renew. Sustain. Energy Rev. 2019, 101, 329–345. [Google Scholar] [CrossRef]
- Crawford, R.H.; Bartak, E.; Stephan, A.; Jensen, C.A. Evaluating the life cycle energy benefits of energy efficiency regulations for buildings. Renew. Sustain. Energy Rev. 2016, 63, 435–451. [Google Scholar] [CrossRef]
- Huang, B.; Mauerhofer, V.V.; Geng, Y. Analysis of existing building energy saving policies in Japan and China. J. Clean. Prod. 2016, 112, 1510–1518. [Google Scholar] [CrossRef]
- Iliopoulos, A.; Konstantinos, K.; Emmanouil, D. Deciding to Go Green: Challenges and Benefits of the Leed Green Building Rating System. In Proceedings of the 7th International Symposium and 29th National Conference on Operational Research The contribution of Operational Research, New Technologies and Innovation in Agriculture and Tourism, Crete, Greece, 14–16 June 2018. [Google Scholar]
- Wu, P.; Song, Y.; Shou, W.; Chi, H.; Chong, H.-Y.; Sutrisna, M. A comprehensive analysis of the credits obtained by LEED 2009 certified green buildings. Renew. Sustain. Energy Rev. 2017, 68, 370–379. [Google Scholar] [CrossRef]
- Chen, X.; Yang, H.; Zhang, W. A Proposed New Weighting System for Passive Design Approach in BEAM Plus. Energy Procedia 2017, 105, 2113–2118. [Google Scholar] [CrossRef]
- Chang, R.; Wang, Q.; Ding, Z. How is the Energy Performance of Buildings Assessed in Australia?—A Comparison between four Evaluation Systems. Int. J. Struct. Civ. Eng. Res. 2019, 8, 133–137. [Google Scholar] [CrossRef]
- Liu, X.; Wang, Q.; Wei, H.-H.; Chi, H.-L.; Ma, Y.; Jian, I.Y. Psychological and Demographic Factors Affecting Household Energy-Saving Intentions: A TPB-Based Study in Northwest China. Sustainability 2020, 12, 836. [Google Scholar] [CrossRef]
- Chen, J.; Taylor, J.; Wei, H.-H. Modeling Building Occupant Network Energy Consumption Decision-Making: The Interplay between Network Structure and Conservation. Energy Build. 2012, 42, 515–524. [Google Scholar] [CrossRef]
- Ma, H.; Zhou, W.; Lu, X.; Ding, Z.; Cao, Y. Application of Low Cost Active and Passive Energy Saving Technologies in an Ultra-low Energy Consumption Building. Energy Procedia 2016, 88, 807–813. [Google Scholar] [CrossRef]
- Chang, S.; Wang, Q.; Hu, H.; Ding, Z.; Guo, H. An NNwC MPPT-Based Energy Supply Solution for Sensor Nodes in Buildings and Its Feasibility Study. Energies 2019, 12, 101. [Google Scholar] [CrossRef]
- Gou, S.; Nik, V.M.; Scartezzini, J.-L.; Zhao, Q.; Li, Z. Passive design optimization of newly-built residential buildings in Shanghai for improving indoor thermal comfort while reducing building energy demand. Energy Build. 2018, 169, 484–506. [Google Scholar] [CrossRef]
- Omrany, H.; Marsono, A.K. Optimization of Building Energy Performance through Passive Design Strategies. Br. J. Appl. Sci. Technol. 2016, 13, 1–16. [Google Scholar] [CrossRef]
- Uddin, M.N.; Wei, H.H.; Chi, H.L.; Ni, M. An Inquisition of Envelope Fabric for Building Energy Performance Using Prominent Bim-Bps Tools—A Case Study in Sub-Tropical Climate. In Proceedings of the 2019 International Conference on New Energy and Future Energy System, Macao, China, 21–24 July 2019. [Google Scholar]
- International Energy Agency. Technology Roadmap Energy Efficient Building Envelopes; International Energy Agency: Paris, France, 2013. [Google Scholar]
- Singh, D.; Tiwari, G.; Al-Helal, I.; Dwivedi, V.; Yadav, J. Effect of energy matrices on life cycle cost analysis of passive solar stills. Sol. Energy 2016, 134, 9–22. [Google Scholar] [CrossRef]
- Dahlstrøm, O.; Sørnes, K.; Eriksen, S.T.; Hertwich, E. Life cycle assessment of a single-family residence built to either conventional- or passive house standard. Energy Build. 2012, 54, 470–479. [Google Scholar] [CrossRef]
- Short, C.A.; Song, J.; Mottet, L.; Chen, S.; Wu, J.; Ge, J. Challenges in the low-carbon adaptation of China’s apartment towers. Build. Res. Inf. 2018, 46, 899–930. [Google Scholar] [CrossRef]
- Essah, E.A.; Yao, R.; Short, A. Assessing stack ventilation strategies in the continental climate of Beijing using CFD simulations. Int. J. Vent. 2017, 16, 61–80. [Google Scholar] [CrossRef]
- Jing, R.; Wang, M.; Zhang, R.; Li, N.; Zhao, Y. A study on energy performance of 30 commercial office buildings in Hong Kong. Energy Build. 2017, 144, 117–128. [Google Scholar] [CrossRef]
- Yeo, J.; Wang, Y.; An, A.K.; Zhang, L. Estimation of energy efficiency for educational buildings in Hong Kong. J. Clean. Prod. 2019, 235, 453–460. [Google Scholar] [CrossRef]
- Lee, L.S.; Jim, C.; Zhang, H. Tree density and diversity in Hong Kong’s public housing estates: From provision injustice to socio-ecological inclusiveness. Urban For. Urban Green. 2019, 46, 126468. [Google Scholar] [CrossRef]
- Tang, W.; Lee, J.W.-Y.; Hui, T.W.; Yip, M.K.-C. The “Urban density” question in Hong Kong: From absolute space to social processes. City Cult. Soc. 2018, 17, 46–53. [Google Scholar] [CrossRef]
- Short, C.A.; Lomas, K.; Giridharan, R.; Fair, A. Building resilience to overheating into 1960’s UK hospital buildings within the constraint of the national carbon reduction target: Adaptive strategies. Build. Environ. 2012, 55, 73–95. [Google Scholar] [CrossRef]
- Alan, S.C. A Typology of Design Strategies for Low-Energy, Efficient, Deep-Plan Public Building in Various Climate. World Archit. 2004, 8, 20–33. [Google Scholar]
- Yu, J.; Yang, Q.; Ye, H.; Huang, J.; Liu, Y.; Tao, J. The Optimum Phase Transition Temperature for Building Roof with Outer Layer PCM in Different Climate Regions of China. Energy Procedia 2019, 158, 3045–3051. [Google Scholar] [CrossRef]
- Liu, T.; Lee, W.L. Influence of window opening degree on natural ventilation performance of residential buildings in Hong Kong. Sci. Technol. Built Environ. 2020, 26, 28–41. [Google Scholar] [CrossRef]
- Gupta, N.; Tiwari, G. Review of passive heating/cooling systems of buildings. Energy Sci. Eng. 2016, 4, 305–333. [Google Scholar] [CrossRef]
- Transport and Housing Bureau. Housing in Figures; Transport and Housing Bureau: Hong Kong, 2017.
- EMSD. Residential—Energy Utilization Index; EMSD: Hong Kong, 2016.
- Kwok, Y.T.; Lai, A.K.L.; Lau, K.K.-L.; Chan, P.W.; Lavafpour, Y.; Ho, J.C.K.; Ng, E. Thermal comfort and energy performance of public rental housing under typical and near-extreme weather conditions in Hong Kong. Energy Build. 2017, 156, 390–403. [Google Scholar] [CrossRef]
- Deng, S.; Wang, R.; Dai, Y. How to evaluate performance of net zero energy building—A literature research. Energy 2014, 71, 1–16. [Google Scholar] [CrossRef]
- To, C.; Li, J.; Kam, M. Towards Zero Carbon in a Hot and Humid Subtropical Climate. Procedia Eng. 2017, 180, 413–422. [Google Scholar] [CrossRef]
- Chen, X.; Yang, H.; Zhang, W. Simulation-based approach to optimize passively designed buildings: A case study on a typical architectural form in hot and humid climates. Renew. Sustain. Energy Rev. 2018, 82, 1712–1725. [Google Scholar] [CrossRef]
- Attia, S.; Gratia, E.; De Herde, A.; Hensen, J.L. Simulation-based decision support tool for early stages of zero-energy building design. Energy Build. 2012, 49, 2–15. [Google Scholar] [CrossRef]
- Chen, X.; Yang, H.; Lu, L. A comprehensive review on passive design approaches in green building rating tools. Renew. Sustain. Energy Rev. 2015, 50, 1425–1436. [Google Scholar] [CrossRef]
- Zhang, L.; Luo, T.; Meng, X.; Wang, Y.; Hou, C.; Long, E. Effect of the thermal insulation layer location on wall dynamic thermal response rate under the air-conditioning intermittent operation. Case Stud. Therm. Eng. 2017, 10, 79–85. [Google Scholar] [CrossRef]
- Adamczyk, J.; Dylewski, R. The impact of thermal insulation investments on sustainability in the construction sector. Renew. Sustain. Energy Rev. 2017, 80, 421–429. [Google Scholar] [CrossRef]
- Saffari, M.; De Gracia, A.; Ushak, S.; Cabeza, L.F. Passive cooling of buildings with phase change materials using whole-building energy simulation tools: A review. Renew. Sustain. Energy Rev. 2017, 80, 1239–1255. [Google Scholar] [CrossRef]
- Kuznik, F.; Virgone, J.; Noël, J. Optimization of a phase change material wallboard for building use. Appl. Therm. Eng. 2008, 28, 1291–1298. [Google Scholar] [CrossRef]
- Chan, A. Energy and environmental performance of building façades integrated with phase change material in subtropical Hong Kong. Energy Build. 2011, 43, 2947–2955. [Google Scholar] [CrossRef]
- Tabares-Velasco, P.C.; Christensen, C.; Bianchi, M.; Booten, C. Verification and Validation of Energyplus Conduction Finite Difference and Phase Change Material Models for Opaque Wall Assemblies; National Renewable Energy Lab (NREL): Golden, CO, USA, 2012.
- Tian, C.; Chen, T.; Yang, H.; Chung, T.-M. A generalized window energy rating system for typical office buildings. Sol. Energy 2010, 84, 1232–1243. [Google Scholar] [CrossRef]
- Kirimtat, A.; Koyunbaba, B.K.; Chatzikonstantinou, I.; Sariyildiz, S. Review of simulation modeling for shading devices in buildings. Renew. Sustain. Energy Rev. 2016, 53, 23–49. [Google Scholar] [CrossRef]
- Sharma, L.; Lal, K.K.; Rakshit, D. Evaluation of impact of passive design measures with energy saving potential through estimation of shading control for visual comfort. J. Build. Phys. 2018, 42, 220–238. [Google Scholar] [CrossRef]
- Rinaldi, A.; Roccotelli, M.; Mangini, A.M.; Fanti, M.P.; Iannone, F. Natural Ventilation for Passive Cooling by Means of Optimized Control Logics. Procedia Eng. 2017, 180, 841–850. [Google Scholar] [CrossRef]
- Schulze, T.; Eicker, U. Controlled natural ventilation for energy efficient buildings. Energy Build. 2013, 56, 221–232. [Google Scholar] [CrossRef]
- PLUSS. Technical Data Sheet of Save® Om29. Available online: https://www.pluss.co.in/downloads/TDS/Doc%20457%20TDS%20OM%2029.pdf (accessed on 7 May 2020).
- EMSD. Guidelines on Performance-based Building Energy Code. Available online: https://citeseerx.ist.psu.edu/viewdoc/download?doi=10.1.1.304.1728&rep=rep1&type=pdf (accessed on 7 May 2020).
- EnergyPlus. Weather Data. Available online: https://energyplus.net/weather/ (accessed on 7 May 2020).
© 2020 by the authors. Licensee MDPI, Basel, Switzerland. This article is an open access article distributed under the terms and conditions of the Creative Commons Attribution (CC BY) license (http://creativecommons.org/licenses/by/4.0/).