Abstract
Nowadays, global warming is a big challenge for human beings; since the Kyoto Protocol became effective, greenhouse gas emissions have been an important environmental evaluation index in all industries. Construction is a big contributor to greenhouse gas emissions. The greenhouse gas emissions in the construction stage are mainly from the construction materials and the construction activities. The purpose of this paper is to quantitatively calculate the carbon dioxide emissions in the construction process, and provide a method of controlling the CO2 emissions effectively by converting into cost. In this study, the authors selected the tunnel construction as the research object, and chose the primary greenhouse gas-CO2 to estimate emissions. The authors did a research based on BIM (Building Information Modeling) technology, to calculate CO2 emission during the construction process. It considered the CO2 emissions from main materials and equipment. Finally, the authors used the recent carbon emission trading price to convert the CO2 emission into cost, and did the economic analysis. The method proposed in this paper can effectively evaluate the CO2 emissions in the construction process; it has a good reference significance for the selection of low-carbon emission materials in the design process, and it provides a case reference and direction for research of low-carbon equipment. By using the EU emissions trading system, the economic conversion of CO2 emissions will provide an economic evaluation index for the CO2 emissions of tunnel construction activities. Meanwhile, based on the method of this study, a BIM-based automated performance evaluation system could be developed.
1. Introduction
According to the United Nations Framework Convention on Climate Change (UNFCCC), industrialized countries must reduce their greenhouse gas emissions (GHG) [1]. South Korea also announced a voluntary action plan to reduce greenhouse gas emissions by 37% from the business-as-usual (BAU) level of 851 million by 2030 [2]. Therefore, all industries should join efforts to lower their greenhouse gas emissions. Energy is needed to manufacture construction products, and is “invested” in the construction, modernization and renewal measures of new buildings. Energy consumption occurs in the process of transportation and construction, as well as in the demolition and disposal of buildings and materials [3]. Construction is a significant sector for emitting greenhouse gas [4]. In particular, South Korea’s construction industry accounts for about 48% of the national material consumption, and 40% of the national energy consumption [5,6]. In order to reduce the GHG emissions of construction, at first we need to know exactly how much is being emitted. The purpose of this paper is to quantitatively calculate the CO2 emissions during the construction process and to provide a method of controlling the CO2 emissions effectively by converting them into cost. There are several phases during a building’s lifecycle that emit greenhouse gas, including materials production, construction, use, maintenance, and the end of life [5,7]. As the materials production stage and construction stage are directly related to the construction process, this study selected the first two stages as study stages. It mainly considered GHG emissions from the main materials and equipment. Meanwhile, the building information modeling (BIM) technology has been gaining more and more attention in the Architecture, Engineering and Construction (AEC) industry. One of the main advantages of BIM is its ability for the user to quickly get relevant information about materials and parts which have already been created in the modelling phase [8]. Depending on the stage of the project and the complexity of the model, estimates can be made from details stored in the model. This study made full use of the quantity take-offs function of Revit (a BIM software).
Almost 80% of global warming gas emissions by volume are carbon dioxide (CO2). Of that 80%, approximately a third arises from sectors relevant to tunneling, including transport, cement and steel manufacture and commercial energy consumption [9]. So, this study selected a tunnel as a study object. It used BIM to calculate the CO2 emission during the tunnel construction process, including CO2 emission caused by tunnel materials and construction activities. It aimed to make the tunnel environmental assessment work simpler, and to offer a good basis for developing BIM-based automated performance evaluation system in the future.
2. Literature Review
2.1. Related Research
J. Kim [10] did a study of reliability-based quantity estimation error analysis, applying for a road BIM project. It showed the detailed method of how to use the Revit structure to make a 3D tunnel model and proved that the BIM based design is becoming more useful, because of a more exact quantity estimation, considering effects of vertical curve and superelevation. In the construction industry, various efforts have been made to evaluate environmental impacts; M. Yang [11] suggested a methodology to calculate the CO2 emission quantity from major construction materials of a steel box girder railway bridge project, along with a system to calculate it automatically. B. Kim et al. [4] presented a comparative analysis on how much greenhouse gas is generated by various equipment types are used in different construction activities. It showed a detailed method of how to calculate the fuel consumption of equipment. M. Oh et al. [12] did a study to evaluate CO2 of a building in the early design stage, as well as to assess its impacts on the environment. J. Araujo et al. [7] analyzed the importance of the use phase of a road in the LCA of different paving alternatives, namely by evaluating energy consumption and gaseous emissions throughout the road pavement’s life. K. Jun et al. [13] did a study on the CO2 emission cost for different kinds of tile work types in the construction phase. Y. Lee et al. [14] did a study to develop a system for the BIM-based estimation of CO2 emissions, for apartments utilizing Autodesk Revit, by using the national Life Cycle Inventory Database (LCI DB). Through the above investigation, we can see that BIM has the advantage of accurate evaluation in quantity estimation. Meanwhile, in order to evaluate the environmental impact in the field of construction, a variety of studies have been carried out. Some studies calculate CO2 emission from construction material, while others calculate the CO2 emissions associated with various equipment in different construction activities. At the same time, there are also studies on the calculation of CO2 emission costs related to various types of work during the construction process. However, there is a lack of comprehensive evaluation on the cost of CO2 emissions associated with various influencing factors in construction activities, which comes both from materials and equipment. In this search, based on previous studies’ use of BIM for quantity estimates and CO2 emissions calculation, the authors propose a method to convert CO2 estimates to an economic indicator, by using EU emission trading system.
2.2. LCA (Life-Cycle Assessment)
Life-cycle assessment (LCA) is a technique to assess the environmental impacts associated with all the stages of a product’s life from-cradle-to-grave (i.e., from raw material extraction through materials processing, manufacture, distribution, use, repair and maintenance, and disposal or recycling) [5,15].
For LCA CO2 emission evaluation of tunnel project, the authors divided the life cycle of tunnel into four stages. (Materials production; construction; use and maintenance; and end of life), each of which consists of the following:
- (1)
- Materials production: this phase includes the process of the manufacturing and processing of raw materials; the building materials to be charged into the building consume resources, and the energy required for production, such as the production of products [5].
- (2)
- Construction: this phase includes all the activities necessary for tunnel construction, such as earthworks, concrete pouring, material transport etc.
- (3)
- Use and maintenance: this phase includes the operation for using, repairing and manage the tunnel project until it is demolished, such as, repairment of tunnel road pavement, maintenance of lighting and ventilation condition inside the tunnel, etc.
- (4)
- End of life: the last phase occurs when the tunnel reaches the end of its useful life. According to the tunnel management strategy, the tunnel may be recovered or demolished, and removed materials may be recycled or left in the field, increasing the burden on the environment [7].
The life-cycle assessment (LCA) of tunnel CO2 emission includes four stages, as shown in Figure 1.
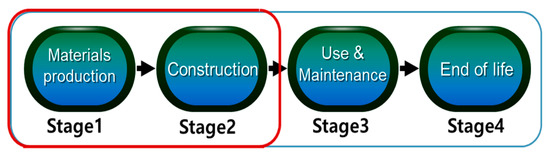
Figure 1.
The four stages of tunnel CO2 emission.
In this study, the authors selected stage 1 and stage 2 as the research scope, which are directly related with construction process.
3. Research Scope and Method
This research attempts to find the CO2 emission calculation method during the tunnel construction process, and takes a 10-m tunnel section as an analysis object (While only one of the cross sections is selected for research, there could be many different cross sections in the tunnel project. This study mainly focuses on the research of calculation method and used the calculated amount of 10-m tunnel section as a representative case study), and other necessary research data was based on assumption similar to the actual project. The process of this study is as follows:
- (1)
- In the aspect of BIM model, the authors used CAD to draw the tunnel cross section, then imported it to the Revit, and used the Revit family to create the 3D model of each part, then gave material information to each part, and finally combined them together.
- (2)
- With respect to tunnel materials, the authors investigated the related CO2 emission factors, and did a survey about the main engineering equipment used in the construction process.
- (3)
- The authors inputted the CO2 emission factors to the Revit, and set the calculated value formula for the CO2 emission. Finally, through the function of Revit, the authors could derive the quantity of each part of the tunnel and calculate the related CO2 emission automatically.
- (4)
- With regard to the quantity derived from the Revit, and referring to the national standard estimating reference, published by the Korea Institute of Construction Technology (KICT), the authors calculated the fuel consumption for the main construction equipment, and then multiplied it by the CO2 emission factors. The authors obtained the CO2 emission for the main equipment in the process of tunnel construction.
- (5)
- The authors analyzed the CO2 emission during the tunnel construction process, including the CO2 emission from the material, and the CO2 emission produced by the main equipment used in the construction process. By using the EU emissions trading system, the authors calculated the CO2 emission cost, and economic analysis was also carried out.
4. CO2 Emission Calculation for a Tunnel Project
4.1. Creating the 3D Tunnel Section by BIM Tool
Project A is a highway tunnel project located in South Korea, of which the overall length is 1477.6 m, as shown in Figure 2. It was designed as four lanes and built by NATM (New Austrian Tunnelling method).
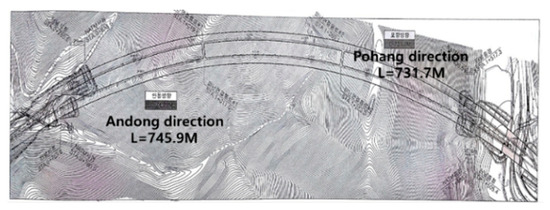
Figure 2.
Longitudinal section of project A.
In order to find a method to calculate the CO2 emissions from the tunnel project, the authors selected a 2D tunnel cross section drawing, and assumed the length of the tunnel section to be 10-m as an analysis object, as shown in Figure 3.
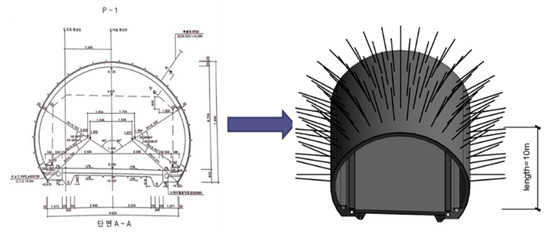
Figure 3.
2D tunnel cross on drawings (left), 3D tunnel model section (right).
The process of creating the 3D tunnel section is shown in Figure 4.
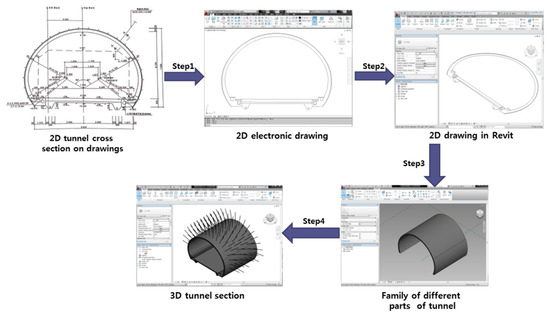
Figure 4.
The process of creating the 3D tunnel section.
4.2. Survey for CO2 Emission Factor and Main Equipment
4.2.1. Survey for CO2 Emission Factor
The authors investigated the CO2 emission factors of materials from different resources. The result is listed in Table 1.

Table 1.
CO2 emission factors of materials.
Because the quantity derived from the Revit exists as volume form, so some units above need to be changed. The changed CO2 emission factors are listed in Table 2.
Table 2.
The changed CO2 emission factors.
4.2.2. Survey for Main Equipment
As the objective of the research was to develop a method to quantify the impact of CO2 emissions as an economic cost, the complexity of the actual construction process was simplified. In this study, the primary excavation method used was blasting, but the scope of the analysis was limited to the primary construction equipment used, listed in Table 3.
Table 3.
Main construction equipment research scope.
4.3. Extracting Materials Quantity and Calculating CO2 Emission
The process of calculating CO2 emission is as follows:
Step 1: Editing parameter of CO2 emission factor
As there is no input parameter related with CO2 in Revit, we edited the shared parameters and made a new input parameter of CO2 emission factor named “CO2 emission [kg per m3]”, as shown in Figure 5.
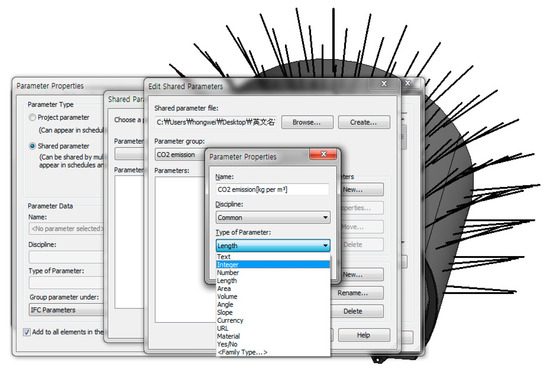
Figure 5.
Editing parameter of CO2 emission factor.
Step 2: Selecting parameter we needed
The next step was to select the parameters we needed from the Revit.
Step 3: Making CO2 emission computing formula
The authors used the calculated value function of Revit. Through making a computing formula (CO2 emission [kg per m3]*Material: Volume), it was possible to calculate the CO2 emission by Revit itself, without any plugin, as shown in Figure 6.
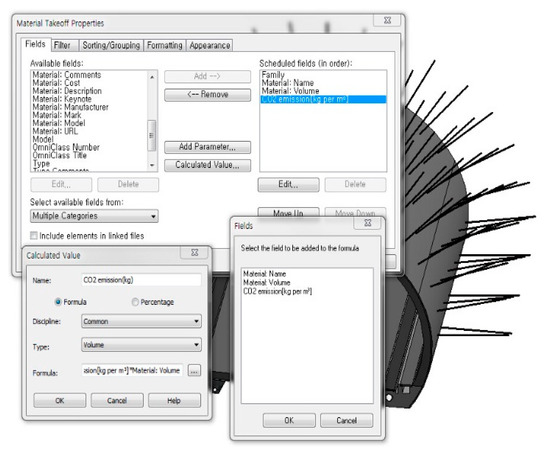
Figure 6.
Making a CO2 emission computing formula.
Step 4: Inputting CO2 emission factor
The authors specified CO2 emission factors to each part of the tunnel.
Step 5: Extracting materials quantity and CO2 emission
After selecting the needed parameters, materials quantity and CO2 emission can be automatically extracted, as shown in Figure 7.
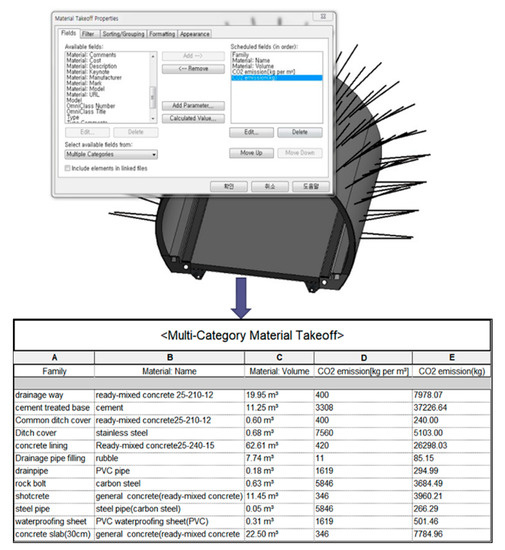
Figure 7.
The materials quantity and CO2 emission.
4.4. CO2 Emission Calculation of the Main Equipment
4.4.1. The Process of Calculating CO2 Emission for the Main Equipment is Illustrated for the Wheel Loader Used for Earthwork Below
Step 1: Getting the earthwork quantity
The authors used Revit to draw the excavation scope to get earthwork quantity; the volume from the Revit is 748.4 m3, as shown in Figure 8.
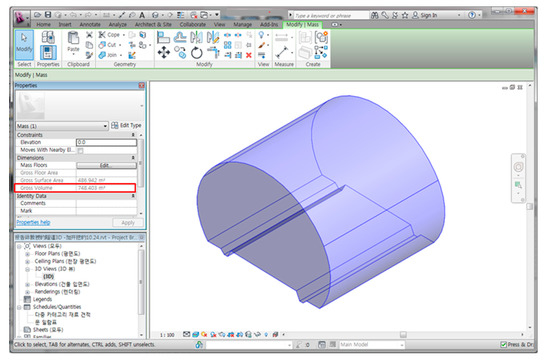
Figure 8.
Tunnel excavation scope.
Step 2: Calculating the CO2 emission of the wheel loader
Referring to the national standard estimating reference by the Korea Institute of Construction Technology (KICT), and assuming the necessary data, which is listed in Table 4, the authors can calculate the fuel consumption for wheel loader.
Productivity per hour (Wheel loader): Q = 3600·q·k·f·e/(m·l + t1 + t2) (m3/h)
Table 4.
Wheel loader variable data.
To better understand the calculation process, consider the following situation. A hauling activity requires a volume of 748.4 m3 of earthwork. A wheel loader with a bucket capacity of 1.72 m3 loads the earth into a dump truck. Authors suppose that the bucket coefficient is 100%. That is, the loader has an output of 1.72 cubic meters of the earth per cycle. Meanwhile, it has a total cycle time for the activity, as follows: m × L + t1 + t2 = 1.8(s/m) × 8.0(m) + 6(s) + 14(s) = 34.4 s, where m (second per meter) is the reciprocal of the velocity of the wheel loader, L (meter) is the average distance, and t1 (second) and t2 (second) are load time and idle time, respectively. Cycles of equipment per hour are calculated as 3600(s)/34.40(s) = 104.65 cycles per hour. The soil conversion factor (f) and production efficiency (e) are assumed as 77% and 60%, respectively. Such values are applied to Equation (1), resulting in the working hours of the loader for the hauling activity [4].
So, the hours of the work are: 748.4/(1.72 × 104.65 × 0.77 × 0.60) = 9 h.
The fuel consumption is: 9.8 L/h × 9 h = 88.2 L
Referring to the LCI DB, the CO2 emission factor is 2.6 kg/L, The CO2 emission of the wheel loader is: 2.6 kg/L ×88.2 L = 229.32 kg
4.4.2. Calculating the CO2 Emission for Other Equipment
Finding the volume needed from the materials quantity extracted by Revit, as shown in Table 5, and referring to the national standard estimating reference by KICT, and assuming the necessary data, it can calculate the fuel consumption for the dump truck and mixer-truck. The equipment CO2 emission of mixer-truck and dump truck is calculated shown as follows:
Table 5.
Quantity of work.
Calculation for CO2 emission of mixer-truck:
Productivity per hour (mixer-truck): Q = 60·w·e/[t1 + 60·(l/v1 + l/v2) + t3 + t4]
(m3/h)
(m3/h)
Applying variable data in Table 6 to Equation (2); Q(Mixer-truck) = 9.37 m3/h, Q(Mixer-truck for concrete lining) = 5.95 m3/h, Q(Mixer-truck for shot concrete) = 4.36 m3/h.
Table 6.
Mixer-truck variable data.
So, the hours of the work are: (19.95 + 22.5 + 11.25)/9.37 + 62.61/5.95 + 11.45/4.36 = 18.88 h.
The fuel consumption is: 13 L/h × 18.88 h = 245.44 L.
Referring to the LCI DB, the CO2 emission factor is 2.6 kg/L, the CO2 emission of the mixer-truck is: 2.6 kg/L × 245.44 L = 638.14 kg.
Calculation for CO2 emission of dump truck:
Productivity per hour (dump truck): Q = 60(T/rt·L) f·E/[Cms·T·L/(60·Es·q·k·rt) +
(l/v1 + l/v2)·60 + t3 + t4 + t5)] (m3/h)
(l/v1 + l/v2)·60 + t3 + t4 + t5)] (m3/h)
Applying variable data in Table 7 to Equation (3); Q (Dump truck) = 8.34 m3/h.
Table 7.
Dump truck variable data.
So, the hours of the work are: 748.4/8.34 = 89.74 h.
The fuel consumption is: 15.9 L/h × 89.74 h = 1426.87 L.
Referring to the LCI DB, the CO2 emission factor is 2.6 kg/L, the CO2 emission of the dump truck is: 2.6 kg/L × 1426.87 L = 3709.86 kg.
5. The Result Analysis
5.1. CO2 Emission Factors of Materials and the Proportion of Quantity of Each Section in Tunnel
From the CO2 emission factors of materials, as shown in Figure 9, it can be seen that different materials have different CO2 emission factors, therefore, during the design process, we could choose the materials with lower CO2 emissions, according to needs.
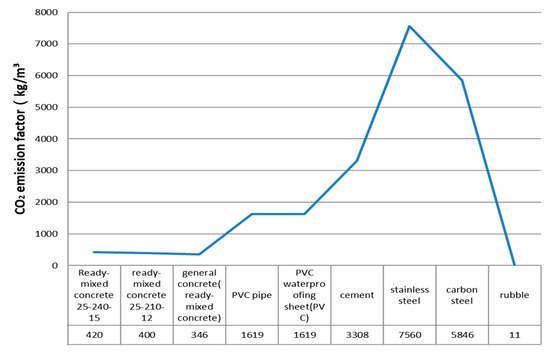
Figure 9.
CO2 emission factors of materials in tunnel.
From the circle graph, as shown in Figure 10, it can be seen that the proportion of quantity of each section in tunnel, concrete lining, concrete slab (30 cm) and drainage way account for a large proportion; the three sections take over 76 percent.
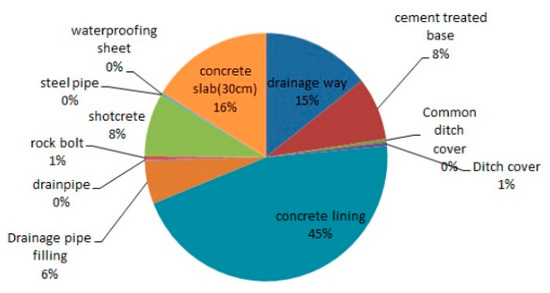
Figure 10.
Proportion of quantity of each section in tunnel.
5.2. Economic Analysis of CO2 Emission during the Tunnel Construction Process
In order to convert the CO2 emission into cost, this study used the recent carbon emission trading price. The main developed countries are trying to reduce the emission of atmospheric pollutants, and they have established a variety of trading systems for carbon emissions exchange. In this study, we used the global trading system named EU ETS (EU emissions trading system) [21]. The EU ETS is a cornerstone of the European Union’s policy to combat climate change, and its key tool for reducing industrial greenhouse gas emissions cost-effectively. The study used EU Allowances—carbon credits used in the EU ETS.
Based on the calculation of CO2 European emission allowances, historical prices provided by ‘Makers Insider’, the average price in 2019 is 0.02472 eur/kg [22]. In addition, as the unit provided by ‘Markets Insider’ is in Euros, according to the 2019 average exchange rate of Euro to KRW (Korean Won) 1305.86 [23], the unit is subject to be changed. The calculation formula of the CO2 emission fee is as follows:
CO2 emission fee (KRW) [13] = CO2 emission (kg) × Average price of CO2 emission (eur/kg) × Annual average exchange Rate
According to the formula above, the calculation process for project A is shown in Table 8 (The CO2 emission of project A was estimated approximately by using the calculated amount of 10-m tunnel section as the average value in this study).
Table 8.
Calculation process of CO2 emission fee during tunnel construction process for Project A.
5.3. Results and Discussion
- (1)
- From the results in Table 9, we can see that the CO2 emission fee of tunnel material is 467,445,245 won, and the CO2 emission fee of main equipment is 21,832,991 won. The tunnel material takes over 95.32% of the total CO2 emission fee; in order to reduce the tunnel CO2 emission cost, the researchers should focus on the development of low carbon materials.
Table 9. Proportion of CO2 emission fee during the construction process of project A.
- (2)
- For the tunnel material, the CO2 emission fee of cement treated base, concrete lining, drainage way and concrete slab (30 cm) is very high. Four of them take over 84.9% of the tunnel material CO2 emission fee. Areas for further research would be to reduce the CO2 emission factor of cement and concrete, for example, by developing new types of cement and concrete, or using a replacement with lower CO2 emission factor.
- (3)
- Even though, compared with the tunnel material, the CO2 emission fee of the main equipment is not very high, it is a large expense for the whole tunnel project. According to the results, we can see that most of the CO2 emission fee comes from the dump truck. During the tunnel construction, the quantity of earthwork is very high, so there is more use of the dump truck. As a consequence, we should take the reduction of earthwork as an important consideration in the tunnel design. We can also design a reasonable construction route to reduce the transportation distance and improve the equipment, to reduce the fuel consumption of the dump truck.
6. Conclusions
In order to reduce the CO2 emission in the construction area, it is necessary to estimate the emission first. In this paper, taking a tunnel project as an example, combined with the BIM software’s automated calculation function, the CO2 emission of tunnel material and the main equipment during the construction process were calculated. The economic calculation was also carried out through using the EU emissions trading system.
Through the analysis of the tunnel material’s CO2 emission calculation, it has a good reference significance for the selection of low-carbon emission materials in the design process, and it could play a practical role in guiding the research direction of developing low-carbon materials.
Through the calculation of equipment’s CO2 emission and the analysis of the results, it shows a clear calculation example for calculating CO2 emission from the equipment, and it provides a case reference and the direction for low-carbon equipment research.
Through using EU emissions trading system, the economic conversion CO2 emissions will provide an economic evaluation index for the CO2 emissions of tunnel construction activities. By linking with cost, it can provide an environment-friendly guidance for selecting the construction material and construction equipment.
However, because this paper mainly focuses on the research for methodology, a tunnel section and related main equipment which are powered by fuel are selected as the research object, some of the necessary research data was assumed. The calculation results could not accurately reflect the actual situation of tunnel construction, but the calculation and analysis methodology mentioned in this paper could be referred to.
In this research, we added CO2 emission factors into the BIM models as a field; the EU ETS related values could also be added as field and internal calculations could be made within Revit. Based on the calculation process provided in this paper, BIM-based automated calculation system of CO2 emissions during tunnel construction process can be further developed. It can contribute to the expansion of BIM technology in the field of civil engineering. Meanwhile, there are various performance evaluation indexes in the field of AEC, many of which are related to quantity calculation. The methodology mentioned in this paper can also provide a good reference role for developing related evaluation systems based on BIM. It can make evaluation work simpler and more efficient.
Author Contributions
Conceptualization, methodology and writing, H.S.; guidance and review, Y.P. All authors have read and agreed to the published version of the manuscript.
Funding
This research received no external funding.
Conflicts of Interest
The authors declare no conflict of interest.
References
- United States Environmental Protection Agency (EPA). Greenhouse Gas (GHG) Emissions. Available online: https://www.epa.gov/ghgemissions (accessed on 22 May 2020).
- Ministry of Foreign Affairs Republic of Korea, Korea’s Efforts to Address Climate Change. Available online: http://www.mofa.go.kr/eng/wpge/m_5655/contents.do (accessed on 22 May 2020).
- Röck, M.; Saade, M.; Balouktsi, M.; Rasmussen, F.; Birgisdottir, H.; Frischknecht, R.; Habert, G.; Lützkendorf, T.; Passer, A. Embodied GHG emissions of buildings: The hidden challenge for effective climate change mitigation. Appl. Energy 2020, 258, 114107. [Google Scholar] [CrossRef]
- Kim, B.; Lee, H.; Park, H.; Kim, H. Greenhouse gas emissions from onsite equipment usage in road construction. J. Constr. Eng. Manage. 2012, 138, 982–990. [Google Scholar] [CrossRef]
- Cho, S.; Chae, C. A study on life cycle CO2 emissions of low-carbon building in South Korea. Sustainability 2016, 8, 579. [Google Scholar] [CrossRef]
- Cho, S.H.; Chae, C.U. The comparative study on the environmental impact assessment of construction material through the application of carbon reducing element-focused on global warming potential of concrete products. Korea Inst. Ecol. Archit. Environ. 2015, 33, 149–156. [Google Scholar]
- Araujo, J.; Oliveira, J.; Silva, H. The importance of the use phase on the LCA of environmentally friendly solutions for asphalt road pavements. Transp. Res. Part D 2014, 32, 97–110. [Google Scholar] [CrossRef]
- Eastman, C.; Teicholz, P.; Sacks, R.; Liston, K. BIM Handbook: A Guide To Building Information Modeling: For Owners, Managers, Designers, Engineers, and Contractors.; John Wiley & Sons: Hoboken, NJ, USA, 2011. [Google Scholar]
- Duarte, P.; Cooke, M. Sustainability and the Tunnelling Industry, TunnelTECH. 2013. Available online: https://www.tunneltalk.com/TunnelTECH-Dec2013-Sustainability-and-the-tunnelling-industry.php (accessed on 22 May 2020).
- Kim, J. A Study of Reliability-Based Quantity Estimation Error Analysis Apply. Master’s Thesis, Hanyang University, Seoul, Korea, 2013. [Google Scholar]
- Yang, M. IFC-BIM based Calculation of CO2 Emission from Major Construction Materials of Steel Box Girder Railway Bridge. Master Thesis, Yonsei University, Seoul, Korea, 2012. [Google Scholar]
- Oh, M.; Na, S. Building Information Modelling (BIM) Based CO2 emissions assessment in the early design stage. Int. J. Civ. Eng. Technol. 2017, 8, 1411–1425. [Google Scholar]
- Jun, K.; Hong, J.; Yun, S. Comparison of construction cost of tile work including CO2 emission cost. Assoc. Korean Archit. Soc. J. Acad. Present. Conf. 2011, 233–236. [Google Scholar]
- Lee, Y.J.; Jun, H.J. Development of a BIM-based carbon dioxide emission estimation system -focus on an apartment in Korea. Archit. Res. 2016, 18, 145–149. [Google Scholar] [CrossRef]
- Krishna, I.V.; Manickam, V.; Davergave, A. Chapter five life cycle assessment, environmental management. Sci. Eng. Ind. 2017, 57–75. [Google Scholar]
- Korea LCI DB-Building Materials. Available online: http://epd.or.kr/lci/nationalDb.do?category=7 (accessed on 22 May 2020).
- 2017 Environmental Performance Indicators Certification Guide Volume 1. Available online: http://www.epd.or.kr/ information/bbs/filedown.do?bbsCode=6&file_idx=1480 (accessed on 22 May 2020).
- Korea LCI DB-Plastic. Available online: http://epd.or.kr/lci/nationalDb.do?category=15 (accessed on 22 May 2020).
- Korea LCI DB-Metal. Available online: http://epd.or.kr/lci/nationalDb.do?category=9 (accessed on 22 May 2020).
- Development of LCA Evaluation Tool at Design Stage Using BIM. Available online: http://www.prism.go.kr/homepage/researchCommon/downloadResearchAttachFile.do?work_key=001&file_type=CPR&seq_no=001&pdf_conv_yn=Y&research_id=1480000-201200241 (accessed on 22 May 2020).
- EU Emissions Trading System (EU ETS). Available online: https://ec.europa.eu/clima/policies/ets_en (accessed on 22 May 2020).
- CO2 European Emission Allowance in EUR-historical Prices. Available online: https://markets.businessinsider.com/commodities/historical-prices/co2-european-emission-allowances/ eur/1.1.2019_31.12.2019 (accessed on 22 May 2020).
- 2019 Average Exchange Rate of Euro to KRW. Available online: https://spot.wooribank.com/pot/Dream?withyou=FXXRT0016 (accessed on 22 May 2020).
© 2020 by the authors. Licensee MDPI, Basel, Switzerland. This article is an open access article distributed under the terms and conditions of the Creative Commons Attribution (CC BY) license (http://creativecommons.org/licenses/by/4.0/).