Article

Geohydrology of a Reference Mediterranean Catchment (Cilento UNESCO Geopark, Southern Italy)

1
Department of Civil Engineering, University of Salerno, Via Giovanni Paolo II, 132, 84084 Fisciano (SA), Italy
2
C.U.GR.I (University Centre for Research on Major Hazards)—Via Giovanni Paolo II, 132, 84084 Fisciano, Italy
*
Authors to whom correspondence should be addressed.
Appl. Sci. 2020, 10(12), 4117; https://doi.org/10.3390/app10124117
Submission received: 30 April 2020 / Revised: 6 June 2020 / Accepted: 8 June 2020 / Published: 15 June 2020
(This article belongs to the Special Issue Advances in Geohydrology: Methods and Applications)

Abstract

:
In this paper, we studied the geo-hydrological structure and behavior of a reference catchment, located in the Cilento UNESCO Global Geopark, southern Italy, representative of the hilly, terrigenous and forested headwaters of the Mediterranean eco-region. Based on detailed hydrogeological and hydro-geomorphological surveys and geomorphometric analysis, starting in 2012, a hydro-chemical monitoring activity at the catchment and sub-catchment scale started, and a hydro-chemical dataset was progressively recorded at daily and sub-hourly time steps. Based on this dataset, the authors performed an original procedure to identify different runoff components, derived by applying cascade mass balance filtering. The integration of hydrological and geomorphological approaches allowed us to obtain an interesting conceptualization of the storm flow generation using hydro-chemical signatures related to different runoff components produced during the increasing–decreasing cycle of the flood event magnitude. The hydro-system activated progressively different runoff sources (i.e., groundwater, riparian corridor, hillslope and hollow) and involved various mechanisms (i.e., groundwater ridging, saturation-excess, infiltration-excess and soil pipe exfiltration). The geo-hydrological conceptualization was validated using a hysteresis Q-EC loop analysis performed on selected events that showed how hysteretic indices could be used to characterize the events in respect to their origins, mechanisms and pathways in similar catchments.

1. Introduction

The Mediterranean river eco-system equilibrium greatly depends on aquifer feedings and surface–groundwater functional interactions [1]. The assessment of their ecological services requires interdisciplinary approaches, the integration of monitoring systems and inter-institutional planning and management. This complexity is particularly evident in protected areas, where institutional protocols (e.g., derived from the European Water Framework Directive WFD, [2]) require the implementation of appropriate activities related to geodiversity–biodiversity relationships [3]. In these areas, the biodiversity protection and conservation have to be guaranteed by the structural integrity and functionality maintenance of the hydro-geodiversity, addressed toward integrated actions in best practice management, effective disaster mitigation and human health preservation.
In order to support the institutional issues for the risks and resources assessment and management of the Cilento, Vallo Diano and Alburni National Park, in the 2015 recognized UNESCO Global Geopark, a research program was planned based on extensive hydro-geomorphological surveying and hydro-chemical monitoring activities. The above integrated activity was first set up in the highly karst-conditioned Upper Bussento river basin by the interdisciplinary research group of the Department of Civil Engineering and C.U.G.RI., working at the University of Salerno [4,5,6,7,8]. Successively, the research areas were extended to other selected catchments located in different landscapes of the Geopark, focusing on the complex karst carbonate systems and small, forested, no-karst (sandstone and marly clayey complexes) headwater catchments of the Geopark.
The first results of this research program were illustrated in [7,9], highlighting promising aspects in further studies and addressing a few case studies that were managed as experimental catchments. One of these was the 3-km2 Ciciriello Torrent experimental catchment (Caselle in Pittari Municipality), where, since December 2012, hydro-geomorphological surveying has been performed and a hydro-chemical monitoring program started and is currently ongoing [4,5,6,7,8,10,11,12].
The basic tool for studying the response of basins or catchments to precipitation events is a two-component—surface and base flow—analysis of the total stream discharge variation over time, plotted as a storm flow hydrograph. However, there is increasing evidence that observed hydrograph patterns can be explained as a complex of hydrological processes where both new and old waters are collected from the hillslopes, conveyed into the drainage network and delivered to the stream channels through an extension and reduction mechanism of the contributing areas, which progressively provide contributions from different source areas [13]. Therefore, the separation of surface runoff from the observed hydrograph depends on several physiographic and meteorological variables (i.e., watershed area and morphology, soil and rock properties, storm recurrence and seasonality, antecedent moisture conditions, vegetation and land use).
In order to separate the streamflow components and identify components of the above sources and pathways, many authors have extensively employed chemical and isotopic tracers in experimental parcels or small watershed. The underlying idea is to use the geochemical or isotopic signature of the water at the small catchment scale. Among others, basic physical–chemical parameters including electrical conductivity (EC) were extensively used as proxy parameters for the total dissolved solids (TDS) in the streamflow [14,15]. While EC in the streamflow is not considered a conservative tracer [16], it has been used as a tracer for hydrograph separation for decades [17,18,19], due to its practical and effective advantages.
EC-based estimates of the event water contributions to streamflow components have low measurement uncertainty [20] because, in contrast to the isotopic composition of the event and pre-event water, the difference in the EC of event and pre-event water can be very large, frequently two orders of magnitude and, occasionally, even three [21]. In addition, EC-based hydrograph separation is possible for nearly every event, and measurements of EC are still much cheaper and can be recorded continuously in the stream flow at a very high frequency [22].
This last advantage matches with one of the principal criteria suggested by the UNESCO’s Biosphere2 Program, based on the simplicity and effectiveness of the techniques and monitoring system to be adopted in protected areas, moreover for that recognized as the Biosphere Reserve by UNESCO [3]. Following this suggestion, for complex catchments in terms of geology, geomorphology and hydrology and with a size over 1 km2, the use of cheaper methods than the site-specific tracer, such as the EC method, are recommended. Clearly, EC-based hydrograph separations must be based on a well-defined (object-oriented) hydro-geomorphological identification of the source areas and flow pathways [4,8].
The researchers in [8] suggested a modified mass balance method, applied to daily EC data, by using a “cascade approach” allowing the separation of the runoff in more than two components, performing a useful and simple daily hydro-geochemical analytic chart. The daily hydro-geochemical analytic chart was used also in [4] for the objective variable source area identification and mapping, using the GmS_UNISA object-based procedure applied to the research catchments.
The low frequency hydro-geochemical data analysis in space and time does not allow for the full understanding of the biochemical and geochemical streamflow processes, which can only be characterized by high-frequency monitoring and real-time monitoring systems [23]. The high temporal resolution allows a more feasible detailed catchment analysis [18] helping to identify sources and pathways of nutrients [24]. From this perspective, after a daily-monitoring training period (2013–2014), from 2015 the Ciciriello catchment was further equipped with instrumentations for discharge (Q) and electrical conductivity (EC) measurements at 5-min intervals, in order to improve it as a reference experimental Mediterranean headwater catchment.
The high frequency dataset was used for event scale analysis and it provided new insights on the geo-hydrologic behavior of the reference catchment. To this end, a comparative analysis was performed between the event hydro-chemograph at five-minute intervals and the location of the event data on the daily chart was used to characterize the event with respect to the runoff components and flow pathways. To improve the identification and the classification of runoff event types, an event scale hysteresis analysis was carried out. In fact, as for many natural phenomena, the EC more clearly featured nonlinear behavior when compared only to discharge (Q) or stage (H) data.
This specific behavior, that was not described by linear models, is typically described with a hysteretic loop that, for such phenomenon, allows the identification of the events past history. Recent studies were focused on the hysteresis analysis to identify different source areas of solute contents in the runoff [25,26,27], sediment dynamics in the catchment [1] or the timing of the runoff component [22,28]. The hysteretic relations can be analyzed with indices that allow the comparison of hysteretic loops at various space- and time-scales, to develop a classification of hysteretic patterns, to detect changes in hysteretic loops or to test the ability of models to reproduce the observed hysteretic behavior [29,30,31].
This paper aims at identifying a perceptual model of the experimental Ciciriello headwater catchment by using the hydro-geomorphologic surveys and monitoring system and the hydro-chemical analysis. The hydro-geomorphologic surveys allowed to delimit the source areas [4] and the hydro-chemical characterization of each runoff mechanism using the hydro-chemical dataset. To obtain the end-members of each runoff mechanism, the hydro-chemical monitoring stations were localized on the hydro-geomorphologic knowledge-based. The hysteresis analysis was employed to characterize the events with a similar hydro-chemograph signature but different origins.
This paper is structured in two parts: the first part, where a geomorphological and hydrogeological setting of the catchment is described (Section 2.1) and the description of the 5-min Q-EC dataset (Section 2.2) are summarized, and the second part, where the adopted methods are described. In particular, we focused on the methods adopted for the geomorphometric parameters derivation (Section 2.3), using the digital elevation model (DEM) with a 5 m cell size. The basic formulation for the hysteretic indexes deriviration (Section 2.4) derivation adopted the method of [25]. The final discussion (Section 3) on the geomorphometric and hydrologic results and their interpretation in geo-hydrologic terms allowed us to derive a perceptual model of the experimental catchment.

2. Materials and Methods

2.1. The Study Area

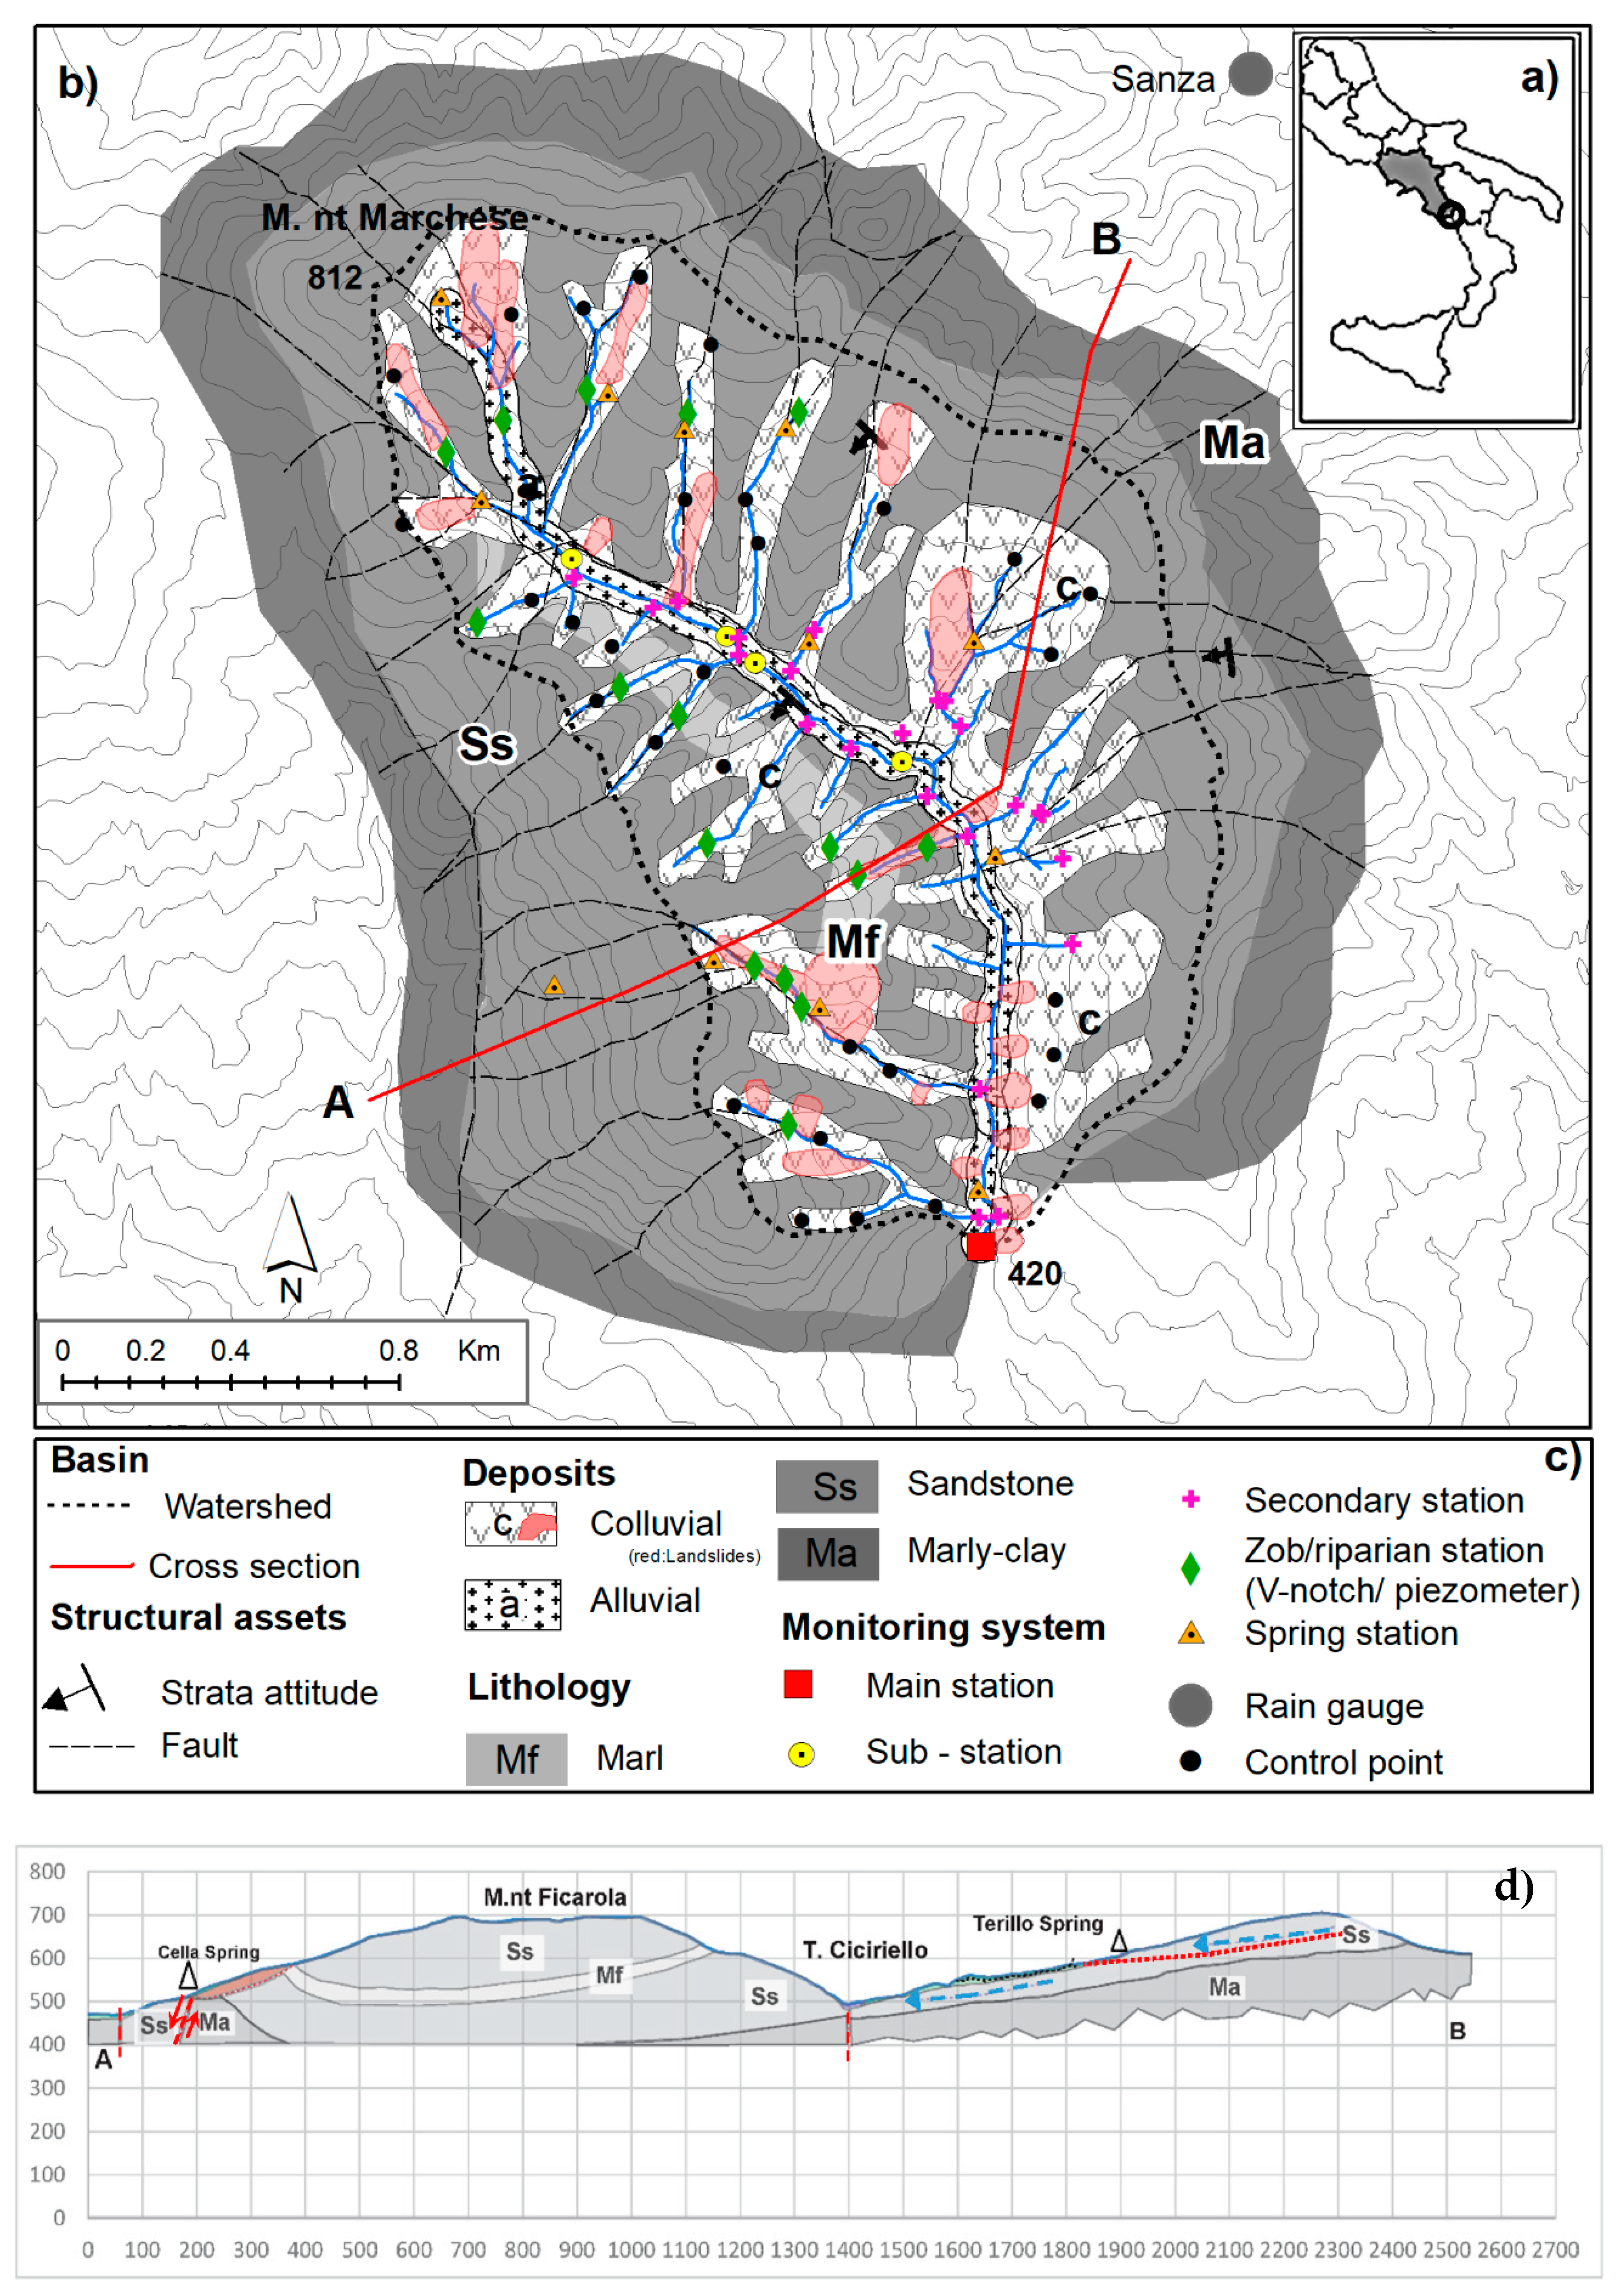
The Ciciriello study area (LAT 40.1957 LONG 15.5379) is located in the Cilento and Vallo di Diano National Park-UNESCO Global Geopark, southern-east of Campania, Southern Italy. The area of the watershed is about 3 km2 and it is a dominantly forested area, with a presence of few farms, without relevant human impacts (Figure 1), such as burning fossil fuels or deforestation. Elevation in the watershed ranges from 420 to 812 m asl (Marchese Mount).
From a hydro-geomorphological point of view, the Cilento and Vallo di Diano Geopark (Figure 1) consists of carbonate massifs, terrigenous reliefs and alluvial plain aquifers [32].
The conglomerate-arenaceous and sandstone-arenaceous hydrogeological complexes in Figure 1 are distributed over approximately 15% of the territory (1497 km2) and form the typical hilly landscapes of the central part of the Cilento Geopark, except for the mountainous massifs of Mount Sacro (1705 m asl), Mount Centaurino (1433 m asl) and Mount Stella (1130 m asl). They are constituted by terrigenous sedimentary formations (sandstone and conglomerates) in turbidite facies (Lower- Mid Miocene) and are generally laying on older alternate beddings of marly-calcareous and/or silicoclastic arenites beds, with interbedded fissile mudrocks (silt shale, clay shale and marls).
Previous hydrogeological studies [33] revealed that the effective infiltration in these units was about the 19% of the net annual precipitations (excepting the evapotranspiration). This value has to be expected to be lower for rock-mass that has a prevalent clayey component, such as the basal formations. In these, the weathering process and the fracturing of the regolith induce to the surficial part of the flysch rock-mass a relatively higher permeability, allowing the formation of a shallow groundwater flow [34]. Such groundwater circulation occurs by means of groundwater bodies that are generally discontinuous and ephemeral and whose spatial and temporal distribution reflect the development of the weathering profile and slope morphology, as well as the occurrence of precipitations. Groundwater flow is mainly oriented downstream or toward small springs located along the slopes.
Due to such a hydrogeological framework, water issues are generally attributable to both the diffuse scarcity of groundwater for regional domestic and agricultural uses and to the limited or null relevance of these units to represent aquifers of strategic regional relevance. Small springs fed by this type of groundwater circulation, with discharges that are variable from a few liters per minute, represent significant local groundwater resources, especially for the hilly areas distant from the water feeding by streamflow.
An exception from this general hydrogeological behavior is represented by the lithostratigraphic units of the Cilento Group [35]. In these parts of the sedimentary series, the prevalence of sandstone beds and conglomerates banks and the lateral discontinuity or the lack of interbedded mudstone layers, to the aquifer rock-mass, a relative medium rate of permeability. Therefore, for these units, the effective infiltration is higher, with values of up to 30% of the net precipitations, as was demonstrated by hydrogeological studies carried out on the stream flows data of the western side of the Mount Sacro [33]. In these units, the groundwater circulation is deeper and characterized by an outflow less controlled by the slope morphology and more influenced by the stratigraphic and structural aquitard/aquiclude setting, as well as by the lateral juxtaposition with units that have a lower relative rate of permeability. A large number of springs can be correlated to this type of groundwater circulation [36] and the several local hydro-domestic systems in the area feeding by them. Within this sub-regional hydrogeological framework, the experimental catchment is characterized by terrigenous bedrock units, and surficial deposits (colluvial and alluvial) characterizing the geological setting of the catchment (Figure 2 and related cross-section). At the base, an Upper Tertiary, marly-clayey formation (Saraceno formation, Auct.) passes in unconformity upward to the middle Miocene sandstone formations of the Cilento–Albidona Group [35]. It generally dips westward with an interbedded 10 m thick marly layer (“Fogliarina Marl”) outcropping along the right valley side. The underlying rock beds is in a dip slope (cataclinal slope) along the left valley side where shallow flow-like landslides occurred (Figure 2). Otherwise, the anti-dip slope (anaclinal slope) is detected along the right valley side that is less influenced also by deep-seated mass movements.
Thick regosols, regolite horizons and gravelly, clino-stratified colluvial slope deposits up to 5 m thick cover the bedrock formations. The main stream bed is rectilinear and subsequent to the main faults and dipping strata and is incised partly in alluvial, gravelly, smoothed deposits and on bedrock; the secondary streambed is exclusively in bedrock or colluvium, subsequent to minor convergent fault systems.
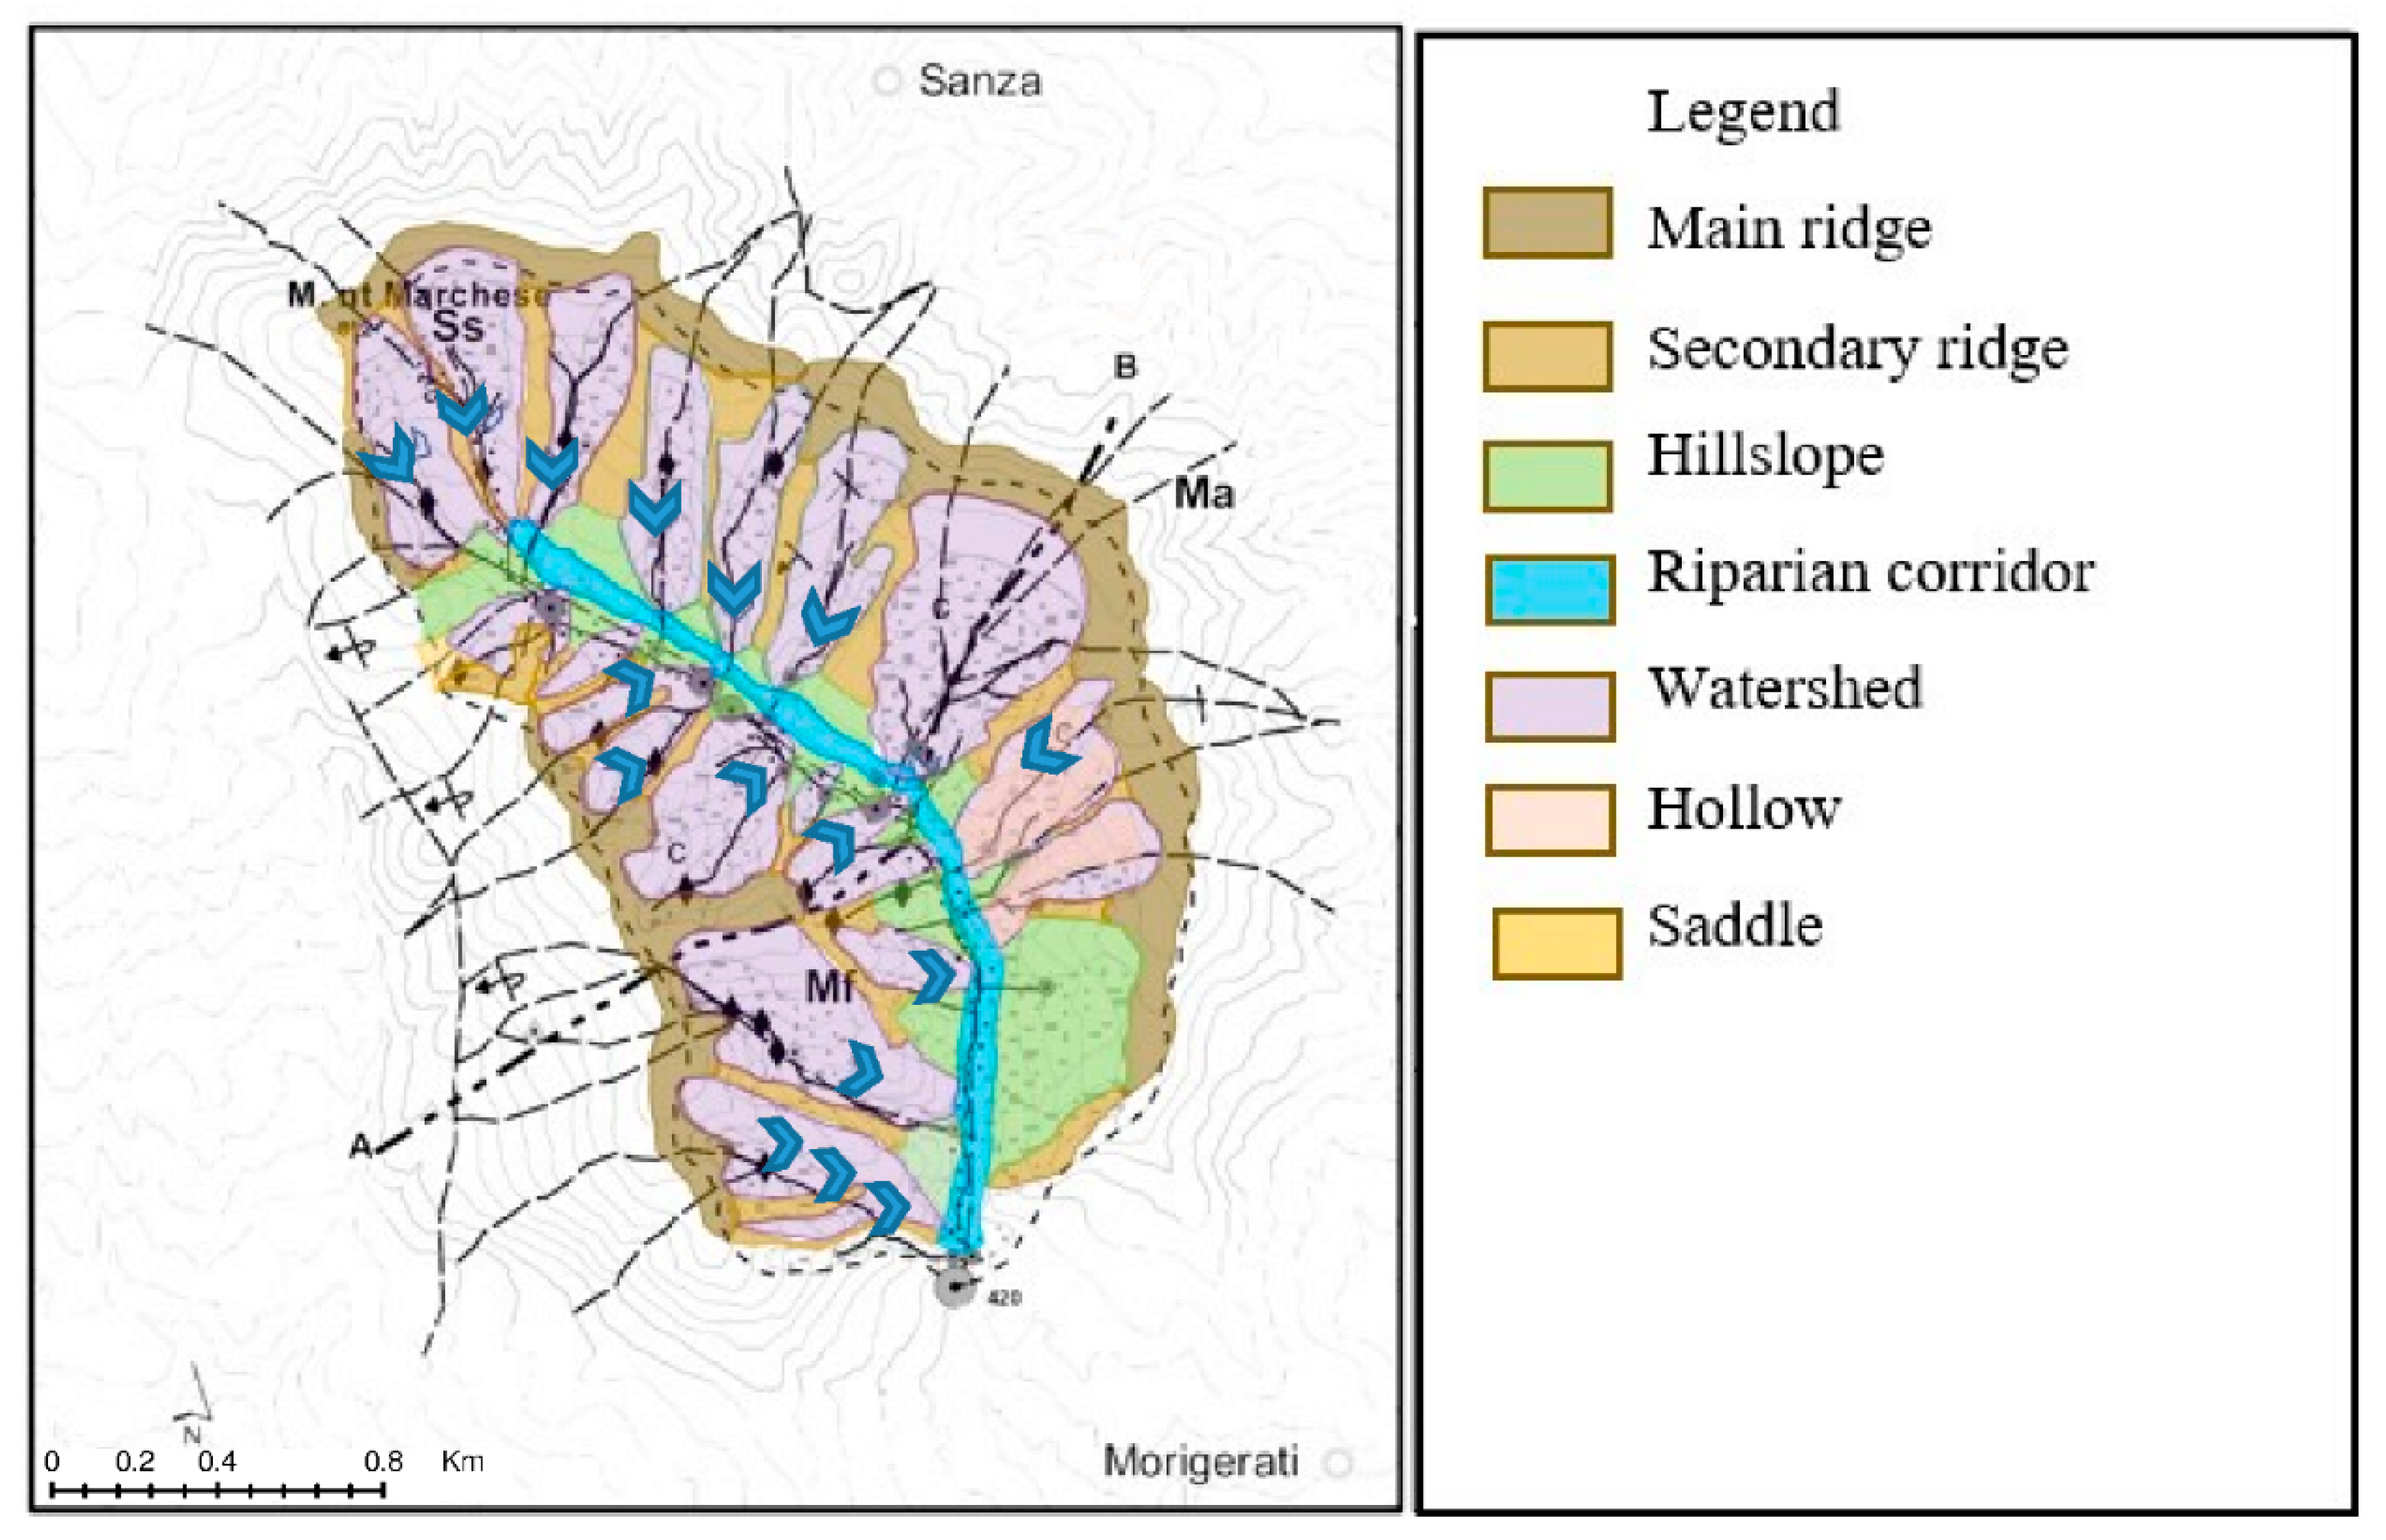
From a geo-hydrological perspective, the groundwater circulation is controlled by the litho-structural arrangement on the above cited bedrock formations. The marly-clayey formation constitutes the local aquitard below the sandstone aquifer. The westward dipping of the permeability boundary induces a general, consequent, westward groundwater flow, convergent toward the lower apex of the wedge-like aquitard hydro-structures (“hydro-wedge”) [37], where the main permanent springs are located. In the headwaters, colluvial hollows represent the bottom component of the zero order basin (referred to as the main headwater hydro-geomorphotypes by [38]) where dominant sub-surficial flow, during the wet season, occurs. Both permanent springs from the bedrock aquifers and the seasonal one from colluvial headwater increase the stream flow down-valley. Figure 3 shows the sketch of the hydro-geomorphological map of the upper Ciciriello catchment and in Table 1 the correspondence between the landforms, the hydrologic behavior and the EC signature.

2.2. Hydro-Chemical Dataset

Since 2013, the EC has been monitored at the main station (outlet) and at various stations located just upstream of the main tributary junctions and downstream from the perennial bedrock springs and seasonal outlets from the zero-order basins, with the aim of identifying the runoff and spring flow components and their chemical characteristics (Figure 2). The location of the monitoring activity was based on direct, detailed, multi-temporal hydro-geomorphological surveys and field measurements (hydro-geomorphologic monitoring system), which were oriented by the “variable source areas” concept [39] and the “hydro-geomorphic paradigm” [40]. In particular, the Q and EC data were recorded as end-member signature at: permanent springs for the groundwater component, seasonal outlets of the zero-order basins for the subsurface flow component, soil pipes and gullies for the direct runoff component. In addition, shallow piezometers were located along the riparian corridor, taluses and the colluvial hollows. A summary of the monitored points with the collected parameters and time-steps is in Table 2.
Since December 2015, water depth (D), discharge (Q), electrical conductivity (EC) and temperature (T) have been measured at five-minute intervals with the multi-parameter datalogger of the solution pressure transmitter and level sensor (STS) at the main monitoring station located at the catchment outlet (420 m a.s.l.).
The daily Q, measured with a Swoffer 3000 current meter (Swoffer Inc., Sumner, WA, USA) since 2013, was used to calibrate the stage-discharge rating curve at the main station. The EC was measured continuously during the floods and on a daily basis during low-flow periods at the same station, using a multi-probe HI9828 (Hanna Instruments Inc., Romania, 1% errors) and was used to calibrate the continuous data detected with the STS data logger.
For this study, only data obtained from the main station and from the 2015–2017 (Figure 4) hydrological years were analyzed, as they were of particular interest due to their brief rainy periods.

2.3. Geomorphometric Analysis

To objectively characterize the overall asymmetry of the headwater catchment, sub-catchments and hydro-geomorphotypes mapped in Figure 3, a basic geomorphometric analysis was carried out. This analysis focused on the basic parameter distribution useful for streamflow source areas and pathways that control the different behavior of the left and right valley side and, for each one, the response of a distinctive hydro-geomorphotype.
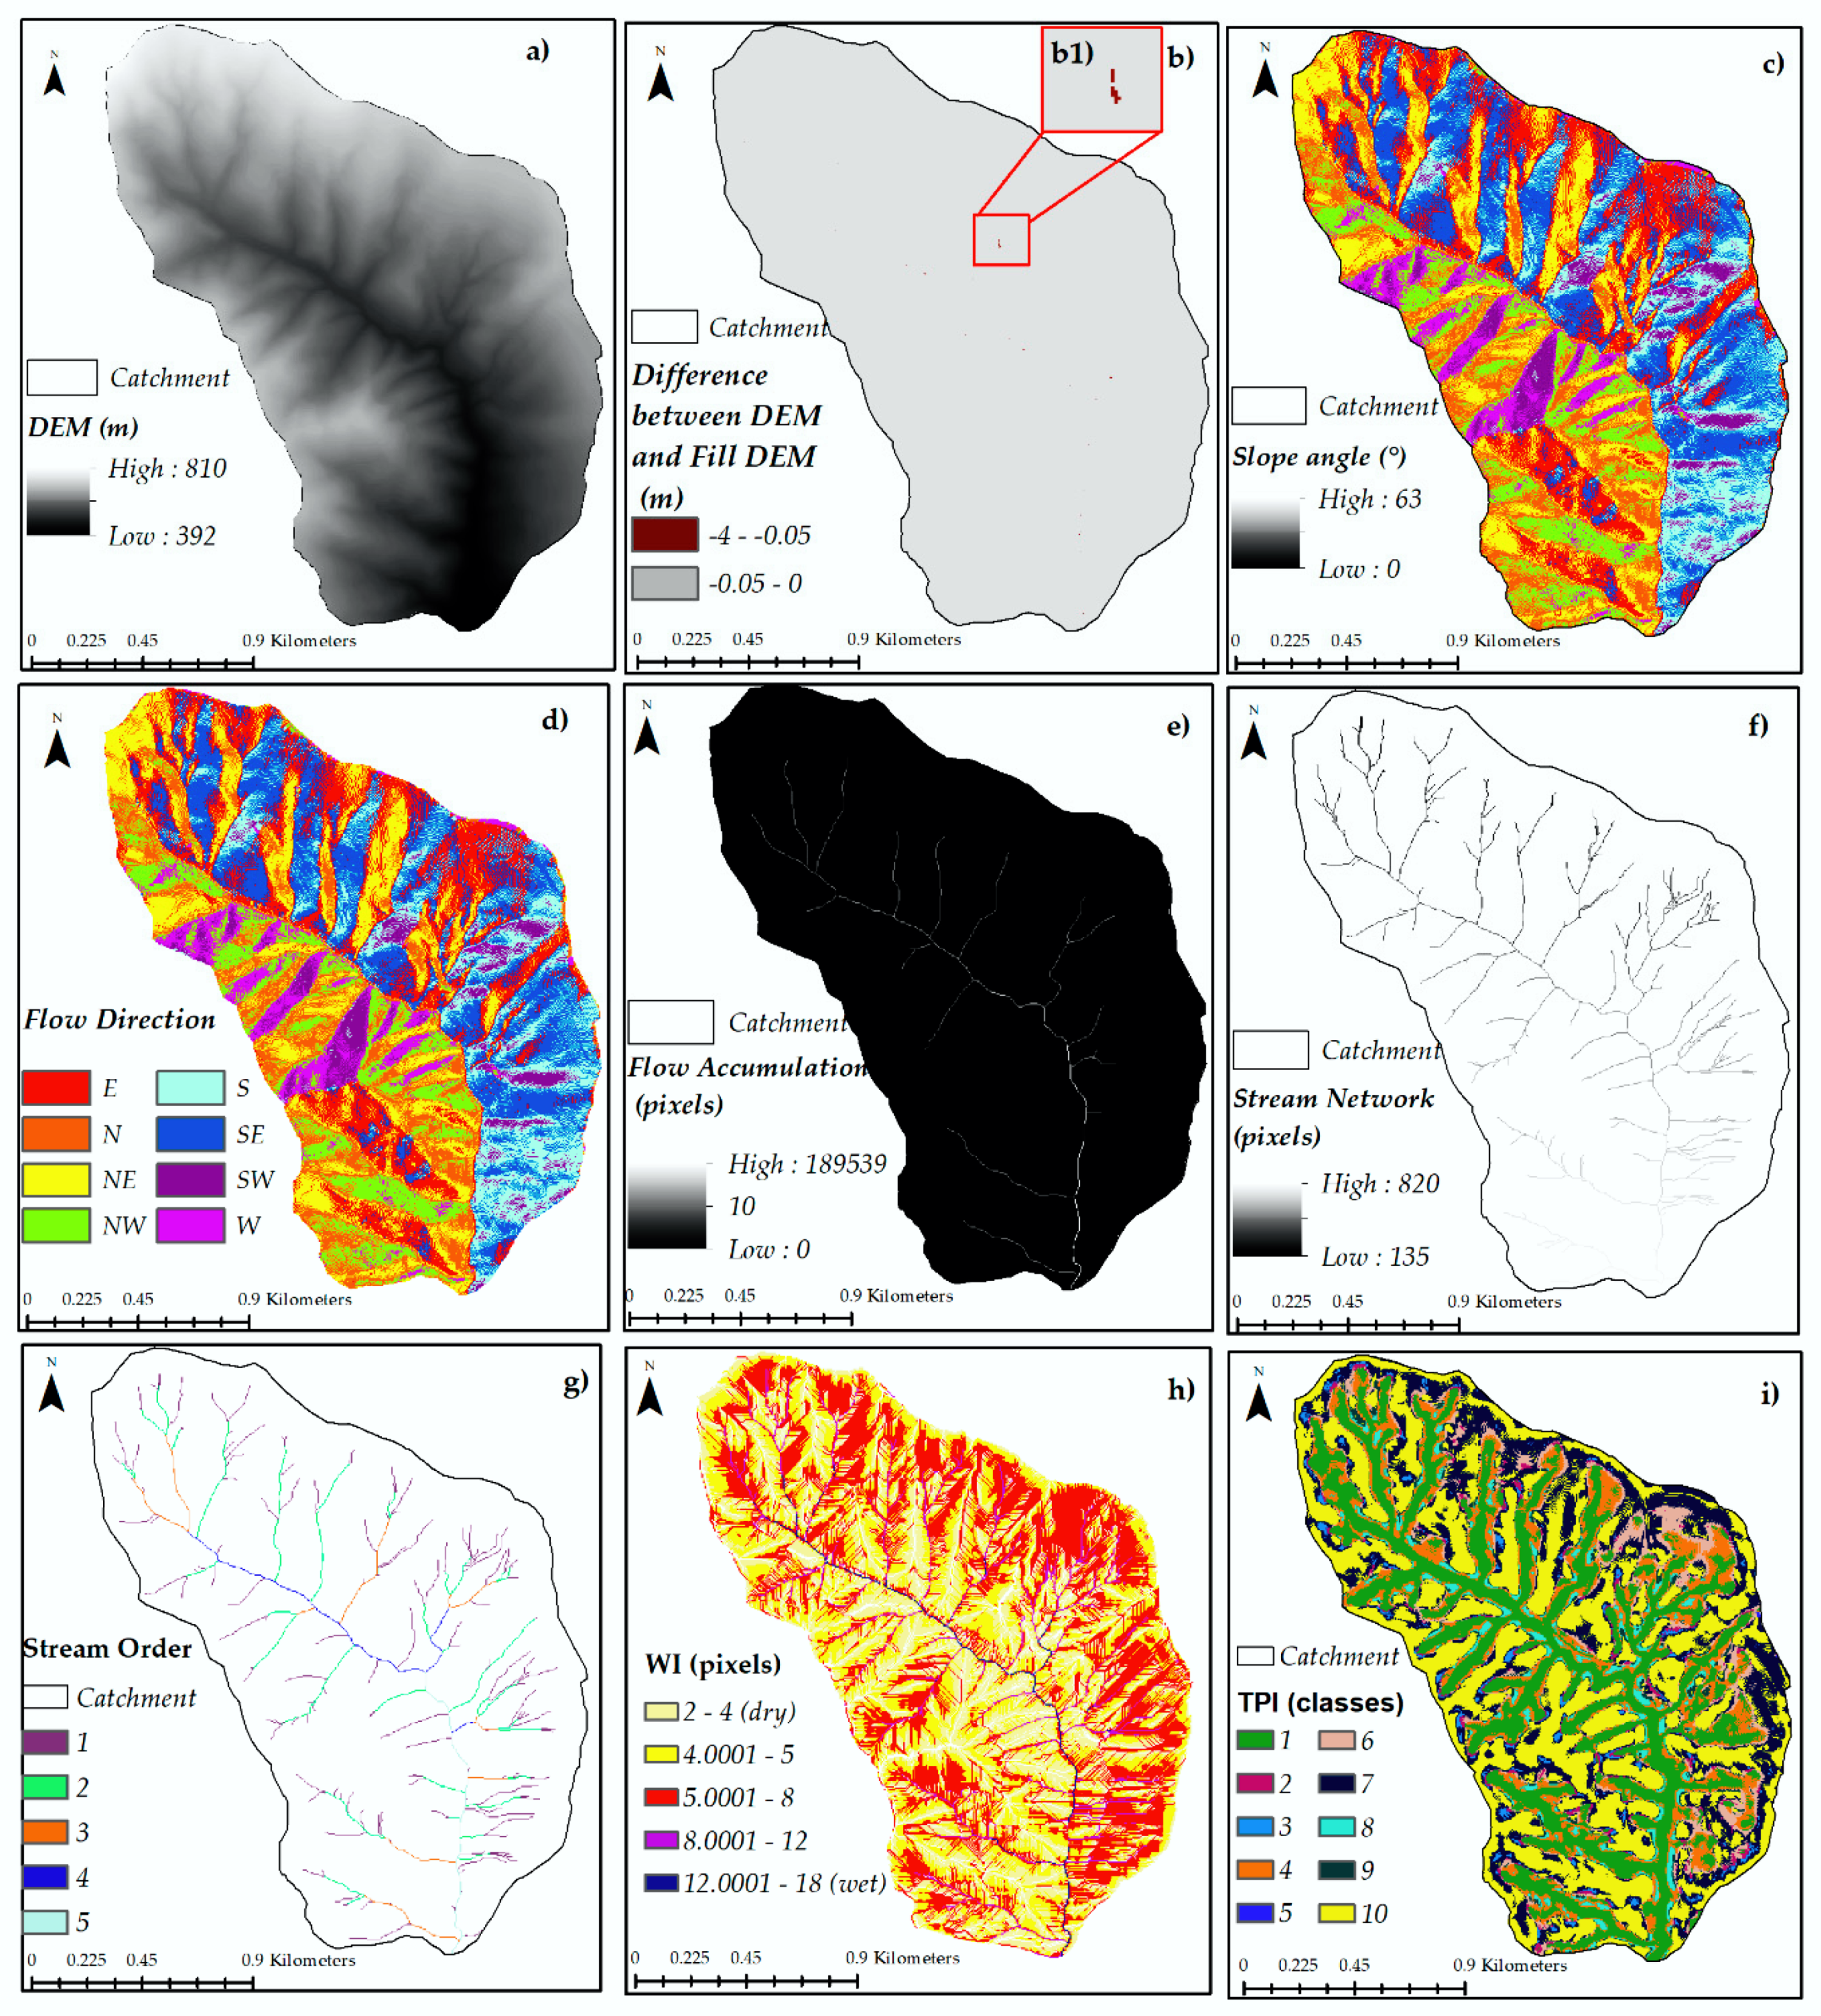
The analysis was performed in ARCGIS© software using specific tools to derived the digital elevation model (DEM) with a 5 m cell size (Figure 5a) from the regional technical map (CTR) of the Campania Region, at a scale of 1:5.000. A correction of DEM was set to eliminate the errors due the DEM extraction procedure, such as pits, applying the “pit removal” tool of the ArcGIS10 (Figure 5b). This procedure allowed us to obtain a hydrologically corrected DEM in order to clearly extract significant hydrological parameters, such as: slope (Figure 5c), flow direction (Figure 5d), flow accumulation (Figure 5e) and stream network (Figure 5f). Other geo-morphometric significant parameters were extracted, such as stream order (Figure 5g), wetness index (Figure 5h) and landforms (Figure 5i), using the Spatial analyst, Grid Calculator and ArcHydro tools in ArcGIS10. The extracted maps were projected to the regional reference system (WGS 1984 UTM Zone 33 N).
The classification and distribution of the elevation and slope parameters [41] are basic but important for analysis in all hydro-morphometric studies as they are strongly controlled by lithology and geological structures, such as the strata attitude, discontinuities and joints, climate and morphogenetic processes and the landform evolution stage.
The concept of stream order was introduced by [42] and it is a widely applied method for stream classification in a river basin, as a measure of the position of a stream in the hierarchy of tributary network [43].
The wetness index (WI) was calculated (Figure 5h) as proposed by [44]:
WI = ln(As/tan β),
where As is the upslope area derived from the flow accumulation and tan β is a tangent function of slope as the percent-rise. The wetness index has been proposed as an integrative parameter describing the potential distribution of soil moisture within a landscape [44] and was highly correlated with soil water contents [45].
Finally, the topographic position index (TPI) was used as a simple, but effective morphometric parameter to obtain morphological comparison with an expert-based morphological map. TPI is defined as the difference from the mean elevation (DIFF), as proposed by [46], measuring the relative topographic position of the central point as the difference between the elevation at this point (z0) and the mean elevation (zmean) within a predetermined neighborhood. The TPI tool returns a landforms map classification in ten classes (Figure 5h): 1 incised stream; 2 midslope drainages, shallow valley; 3. upland drainages, headwater; 4 U-shaped valley; 5 plains; 6 open slopes; 7 upper slopes, mesas; 8 local ridges/hills in valleys; 9 midslope ridges, small hills in plains; and 10 mountain tops, high ridges. In this study, the 10 classes were reduced into five classes based on the classification of Table 1: the number 1 is the riparian corridor; the numbers 2, 3 and 4 are classified as hollow; the numbers 5, 6, 7and 8 are classified as hillslope; and the numbers 9 and 10 as ridge. TPI is only one of a vast array of grid-based morphometric properties based on neighboring areas that can be useful in topographic and DEM analysis for hydro-geomorphological analysis [46].

2.4. Hysteretic Analysis

In the scientific literature, numerous studies have been carried out on the chemical parameters of waters to enhance our knowledge of catchment transport pathways and source areas during storm events. The non-linear correlation between the discharge and the chemical parameters, described by the hysteretic loops, led the researchers to develop a synthetic index for the characterization of the hysteresis in terms of size and shape. The researchers in [25] proposed a new hysteretic index (h) that can be used for a wide range of variables and can be applied to datasets where the dependent variable decreases during an event. The method is based on the computation of definite integrals on the increasing and decreasing rating curve of the independent variable [25]. The authors defined the rising curve as the part of the curve of the independent variable related to the beginning of the dilution phase on the chemograph up to the minimum EC value. The falling limb is on the part of the curve of the independent variable, which corresponds with the recovery phase of the chemograph. The procedure proposed by [25] for h index calculation involves the following steps:
1. Normalization of the two variables for each single event, ranging between 0 and 1:
u ( t ) = x ( t ) x min x max x min ,
v ( t ) = y ( t ) y min y max y min ,
where x(t) and y(t) are the two variables at time t; xmin, xmax, ymin and ymax are the minimum and maximum values of the independent and dependent variables, respectively; and u(t) and v(t) are the normalized values of x(t) and y(t), respectively.
2. Computation of the definite integrals Ar[i, j] and Af[i, j] of the functions vr(u) and vf(u) on intervals [i, j] for the rising (r) and the falling (f) curve:
A r [ i , j ] = i j v r ( u ) d u ,
A f [ i , j ] = i j v f ( u ) d u ,
where i and j represent the lower and upper limits of integration, respectively, and can assume any value from u = 0 to u = 1. The integrals can be computed on intervals of different widths delimited by selected points, i and j, of the independent variable u. The choice of the intervals of integrations should depend on the quality and resolution of the data and the rate at which the dependent variable changes with respect to the independent variable.
3. Determination of the differences between the definite integrals on the rising and falling curves computed for the same intervals, [i, j]:
Δ A [ i , j ] = A r [ i , j ] A f [ i , j ]
Clockwise loops have all ΔA[i, j] > 0, anticlockwise loops have all ΔA[i, j] < 0, linear relations (no hysteresis) have all ΔA[i, j] = 0, while eight-shaped hysteretic patterns are characterized by ΔAmin < 0 and ΔAmax > 0.
4. Quantification of the h index of the event:
h = k = 1 n Δ A [ i , j ]
where n is the number of intervals. Clockwise hysteresis is characterized by h > 0, and anticlockwise loops have h < 0, while h ≈ 0 indicates no hysteresis or a symmetrical eight-shaped or complex loop. For complex eight-shaped loops, the dominant direction is defined by the relative size of the two (or more) loops. The value of the index is also a measure of the size of the hysteretic loop: the larger the hysteretic loop, the further h is from 0.
The h index is used in this paper for characterizing the hysteresis loop for significant events, selected as will be explained in the following. In particular, the hysteretic indexes h, ΔAmin and ΔAmax proposed by [25] were used to quantify the direction and the size of the loops. In order to quantify the integrals, the variables Q and EC were normalized in u(t) and v(t), respectively, and equal-width intervals of 0.02 for the variable u (t) (from u = 0 to u = 1) were set for the computation of h.

3. Results

3.1. Geomorphometric Analysis Aesults

The derived maps, computed from the DEM with a 5 m cell size and obtained using the Arc Hydro and Spatial analyst tools of ARCGIS 10, were used for the geomorphometric characterization of the reference catchment, performing it on the right and left side of the catchment to highlight the geologic differences between them.
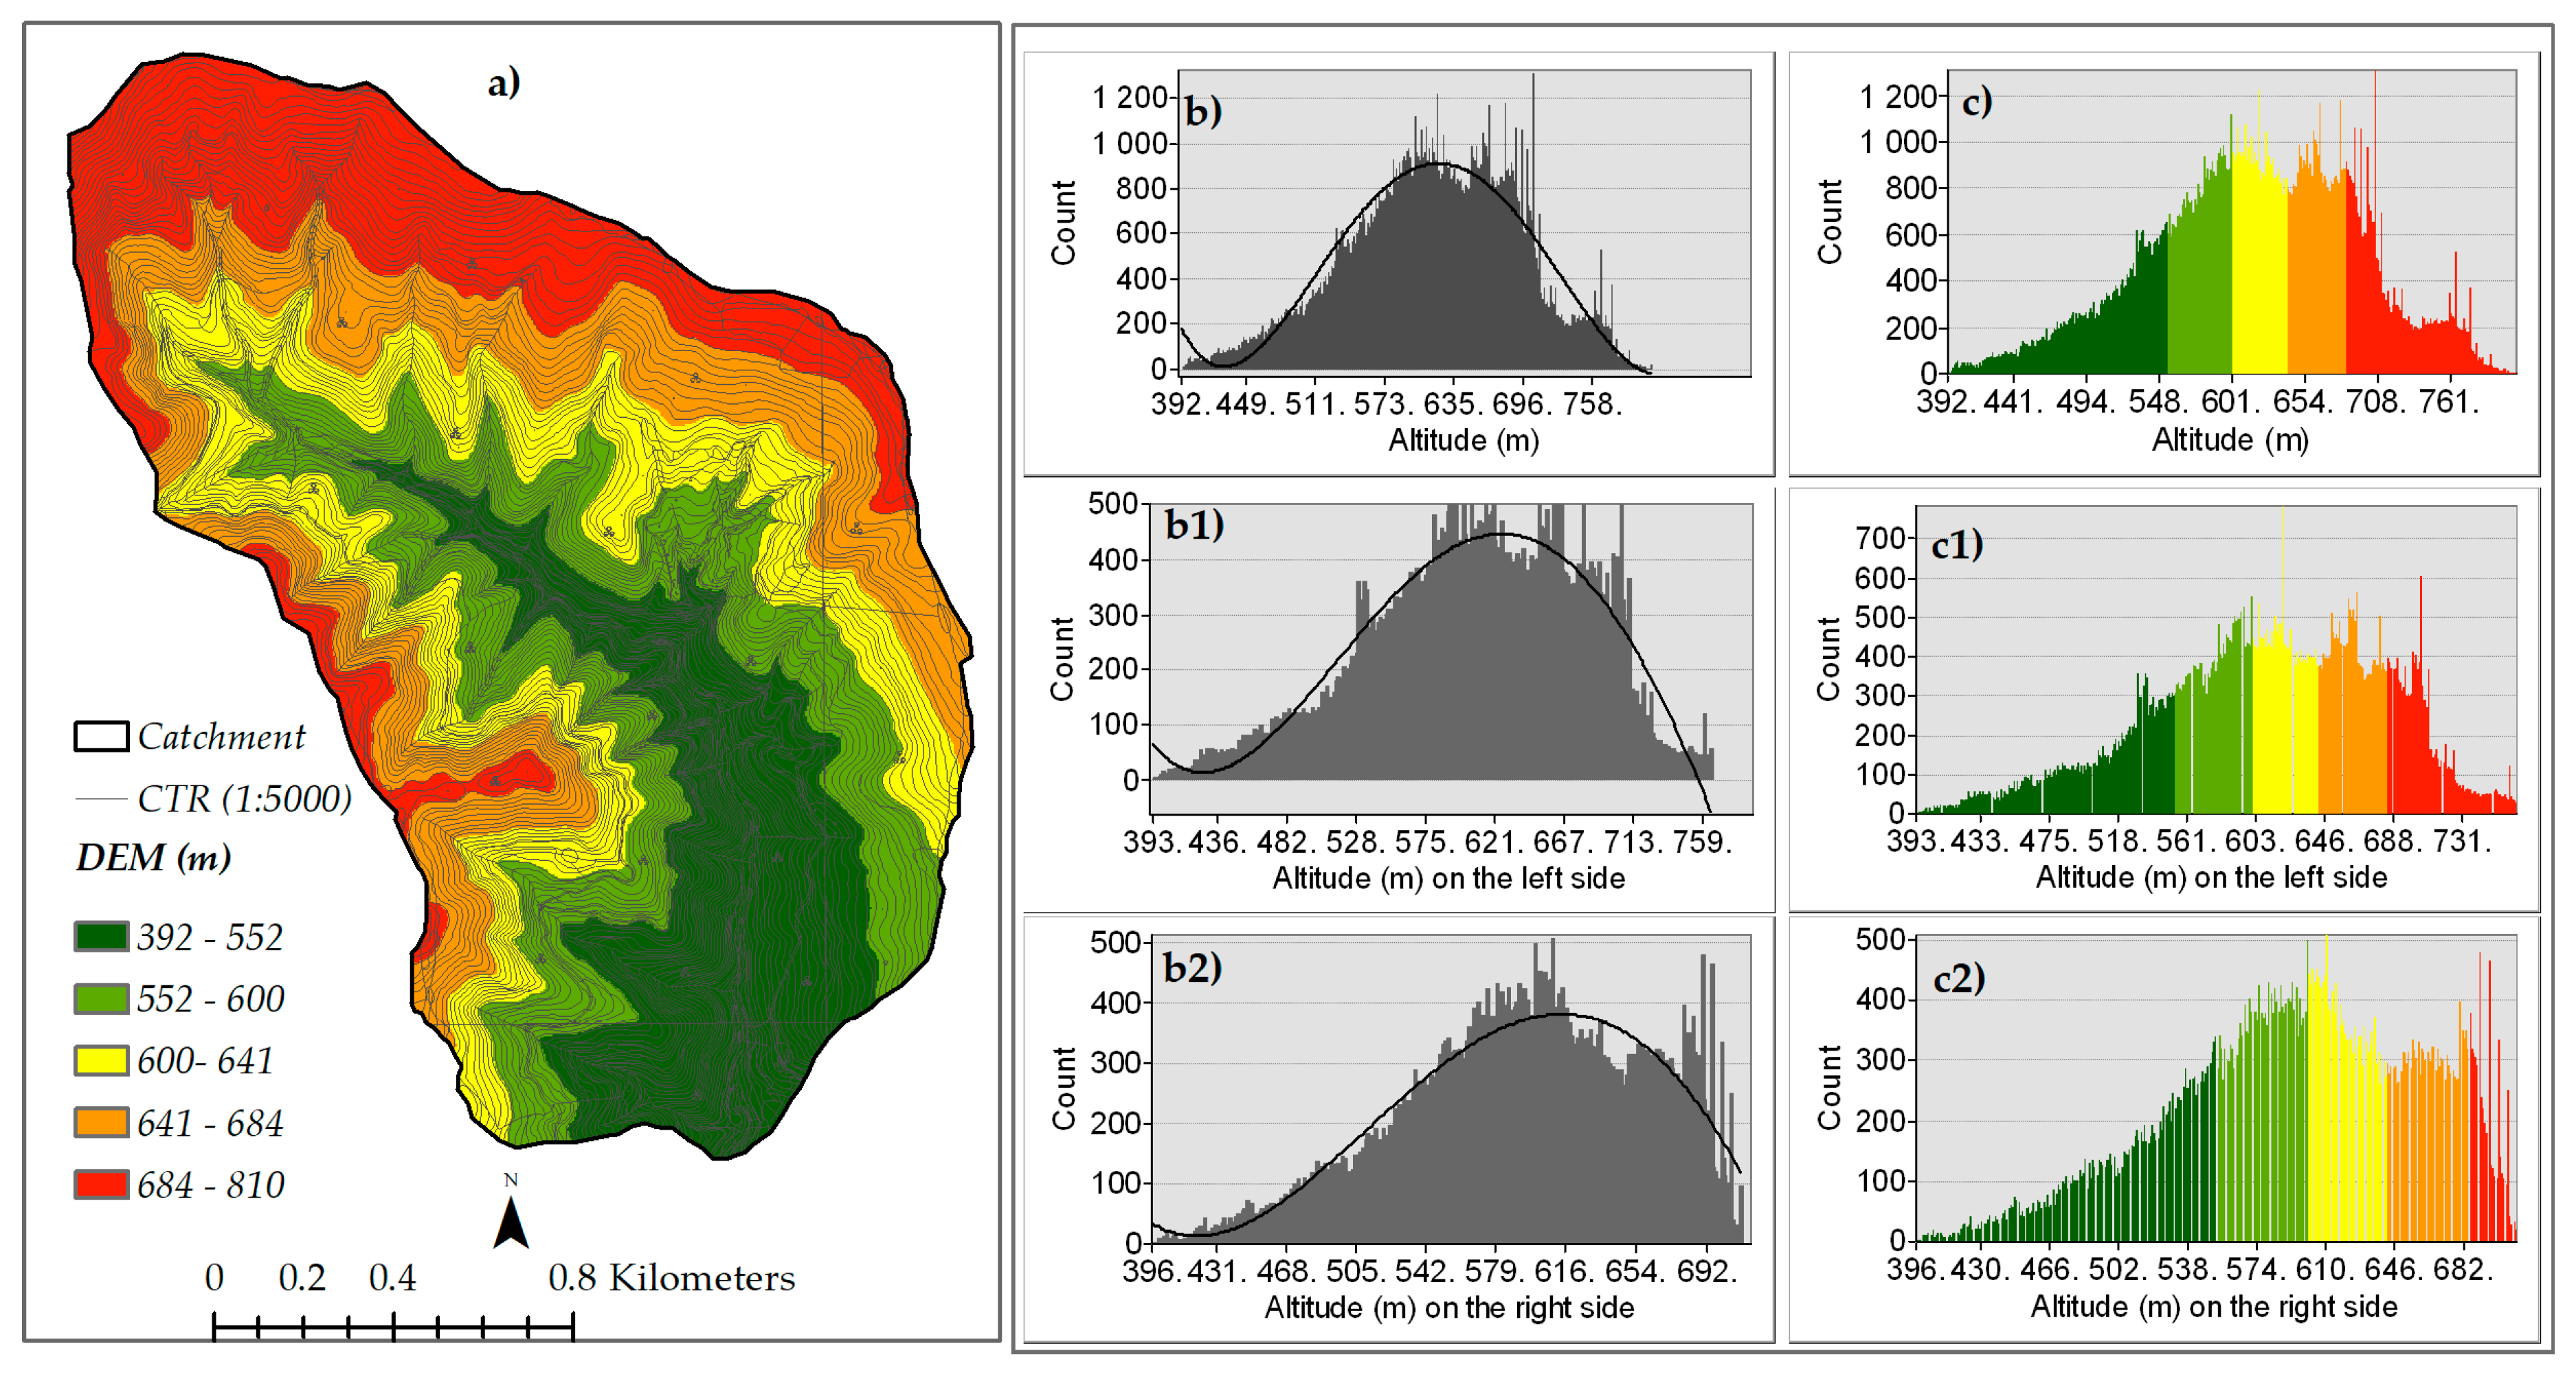
Figure 6a shows the elevtion analysis of the catchment. The elevation of the catchment ranged between 392 m asl at the outlet and 810 m asl at the summit of Marchese Mount. The frequency distribution of the unclassified elevation map is shown in Figure 6b. The data distribution on the whole catchment and on the right and left valley was negative skewed (Figure 6b1,b2). The average, maximum and minimum values did not differ much between the two sides of the basin. Indeed, the elevation map was classified as adopting, at break points, the quantiles of distribution.
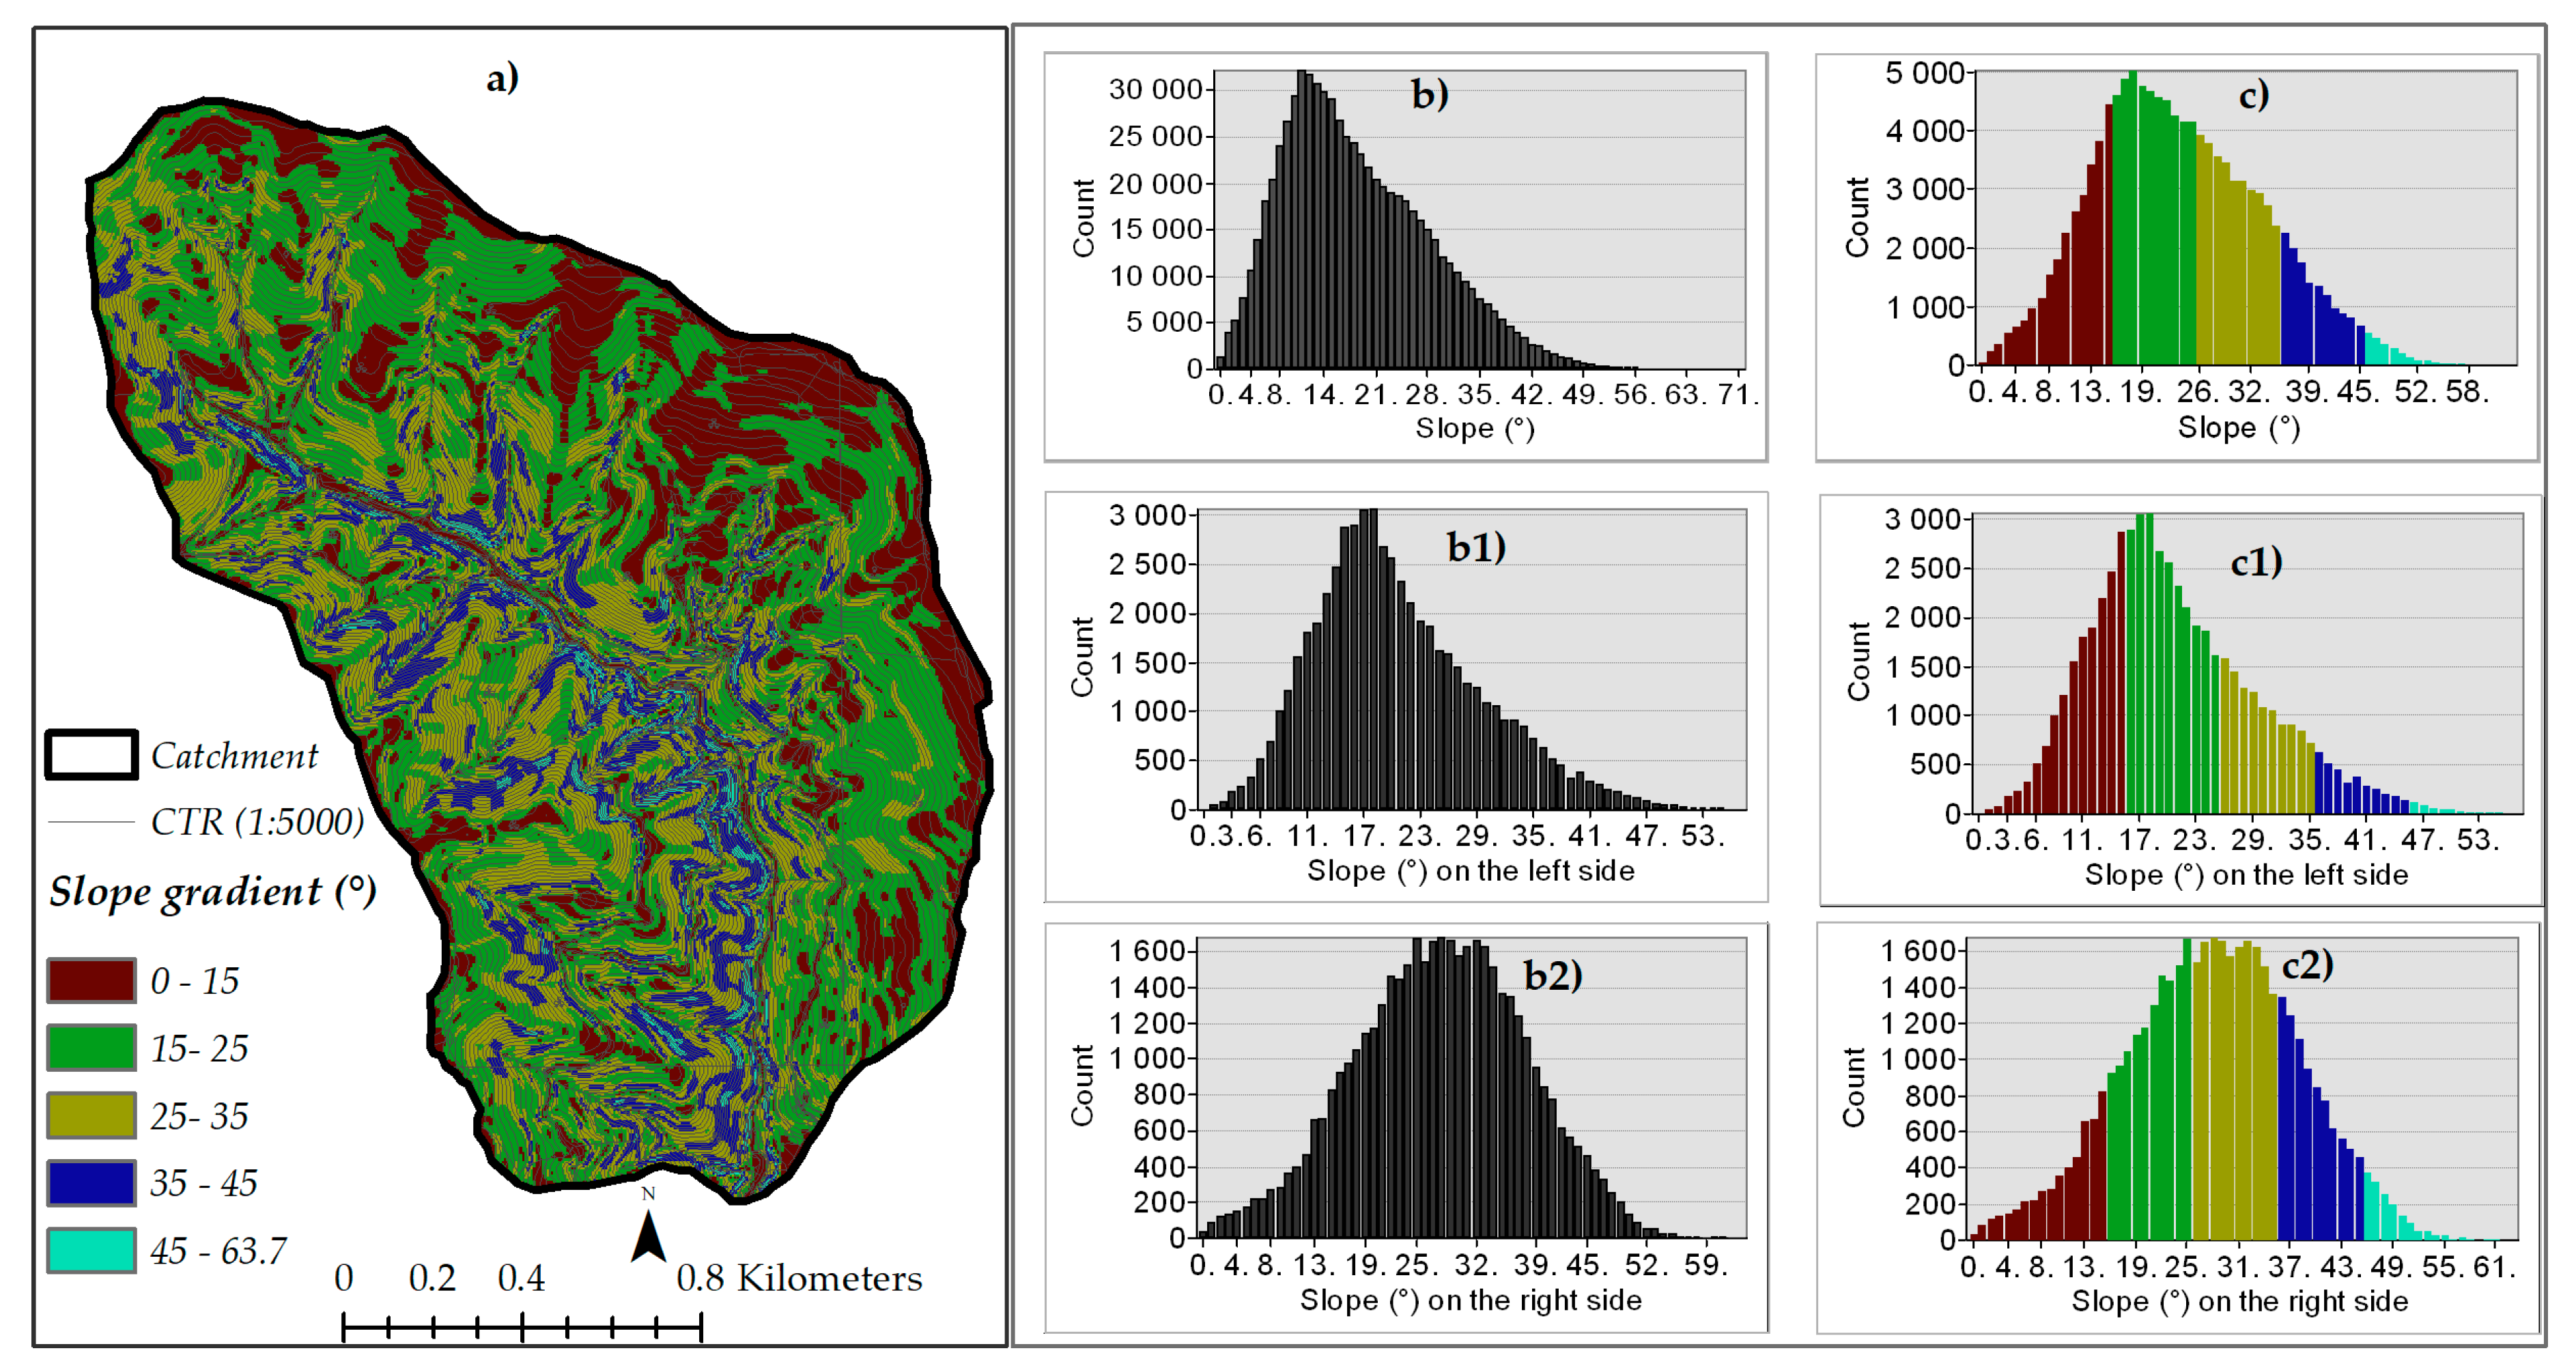
The degree of slope exhibited by Ciciriello river basin headwater varied from 0 to 64, as shown in Figure 7. The slope map distribution of the whole catchment (Figure 7b) and of the left side (Figure 7b1) were positive skewed. A normal distribution, instead, is shown in Figure 7b2 for the right side. The slope map is quite different between the right and left side, where the detected maximum values were, respectively, 57 and 63 degrees, and the average ones were 21 and 28, respectively. The classified map (Figure 7c) shows a major presence of lands with a slope between 15 and 25 degrees. The left side (Figure 7c1) shows a high presence of hillslope with a slope between 14 and 20 degrees, while the major slope on the right hand (Figure 7c2) ranged between 25 and 35 degrees.
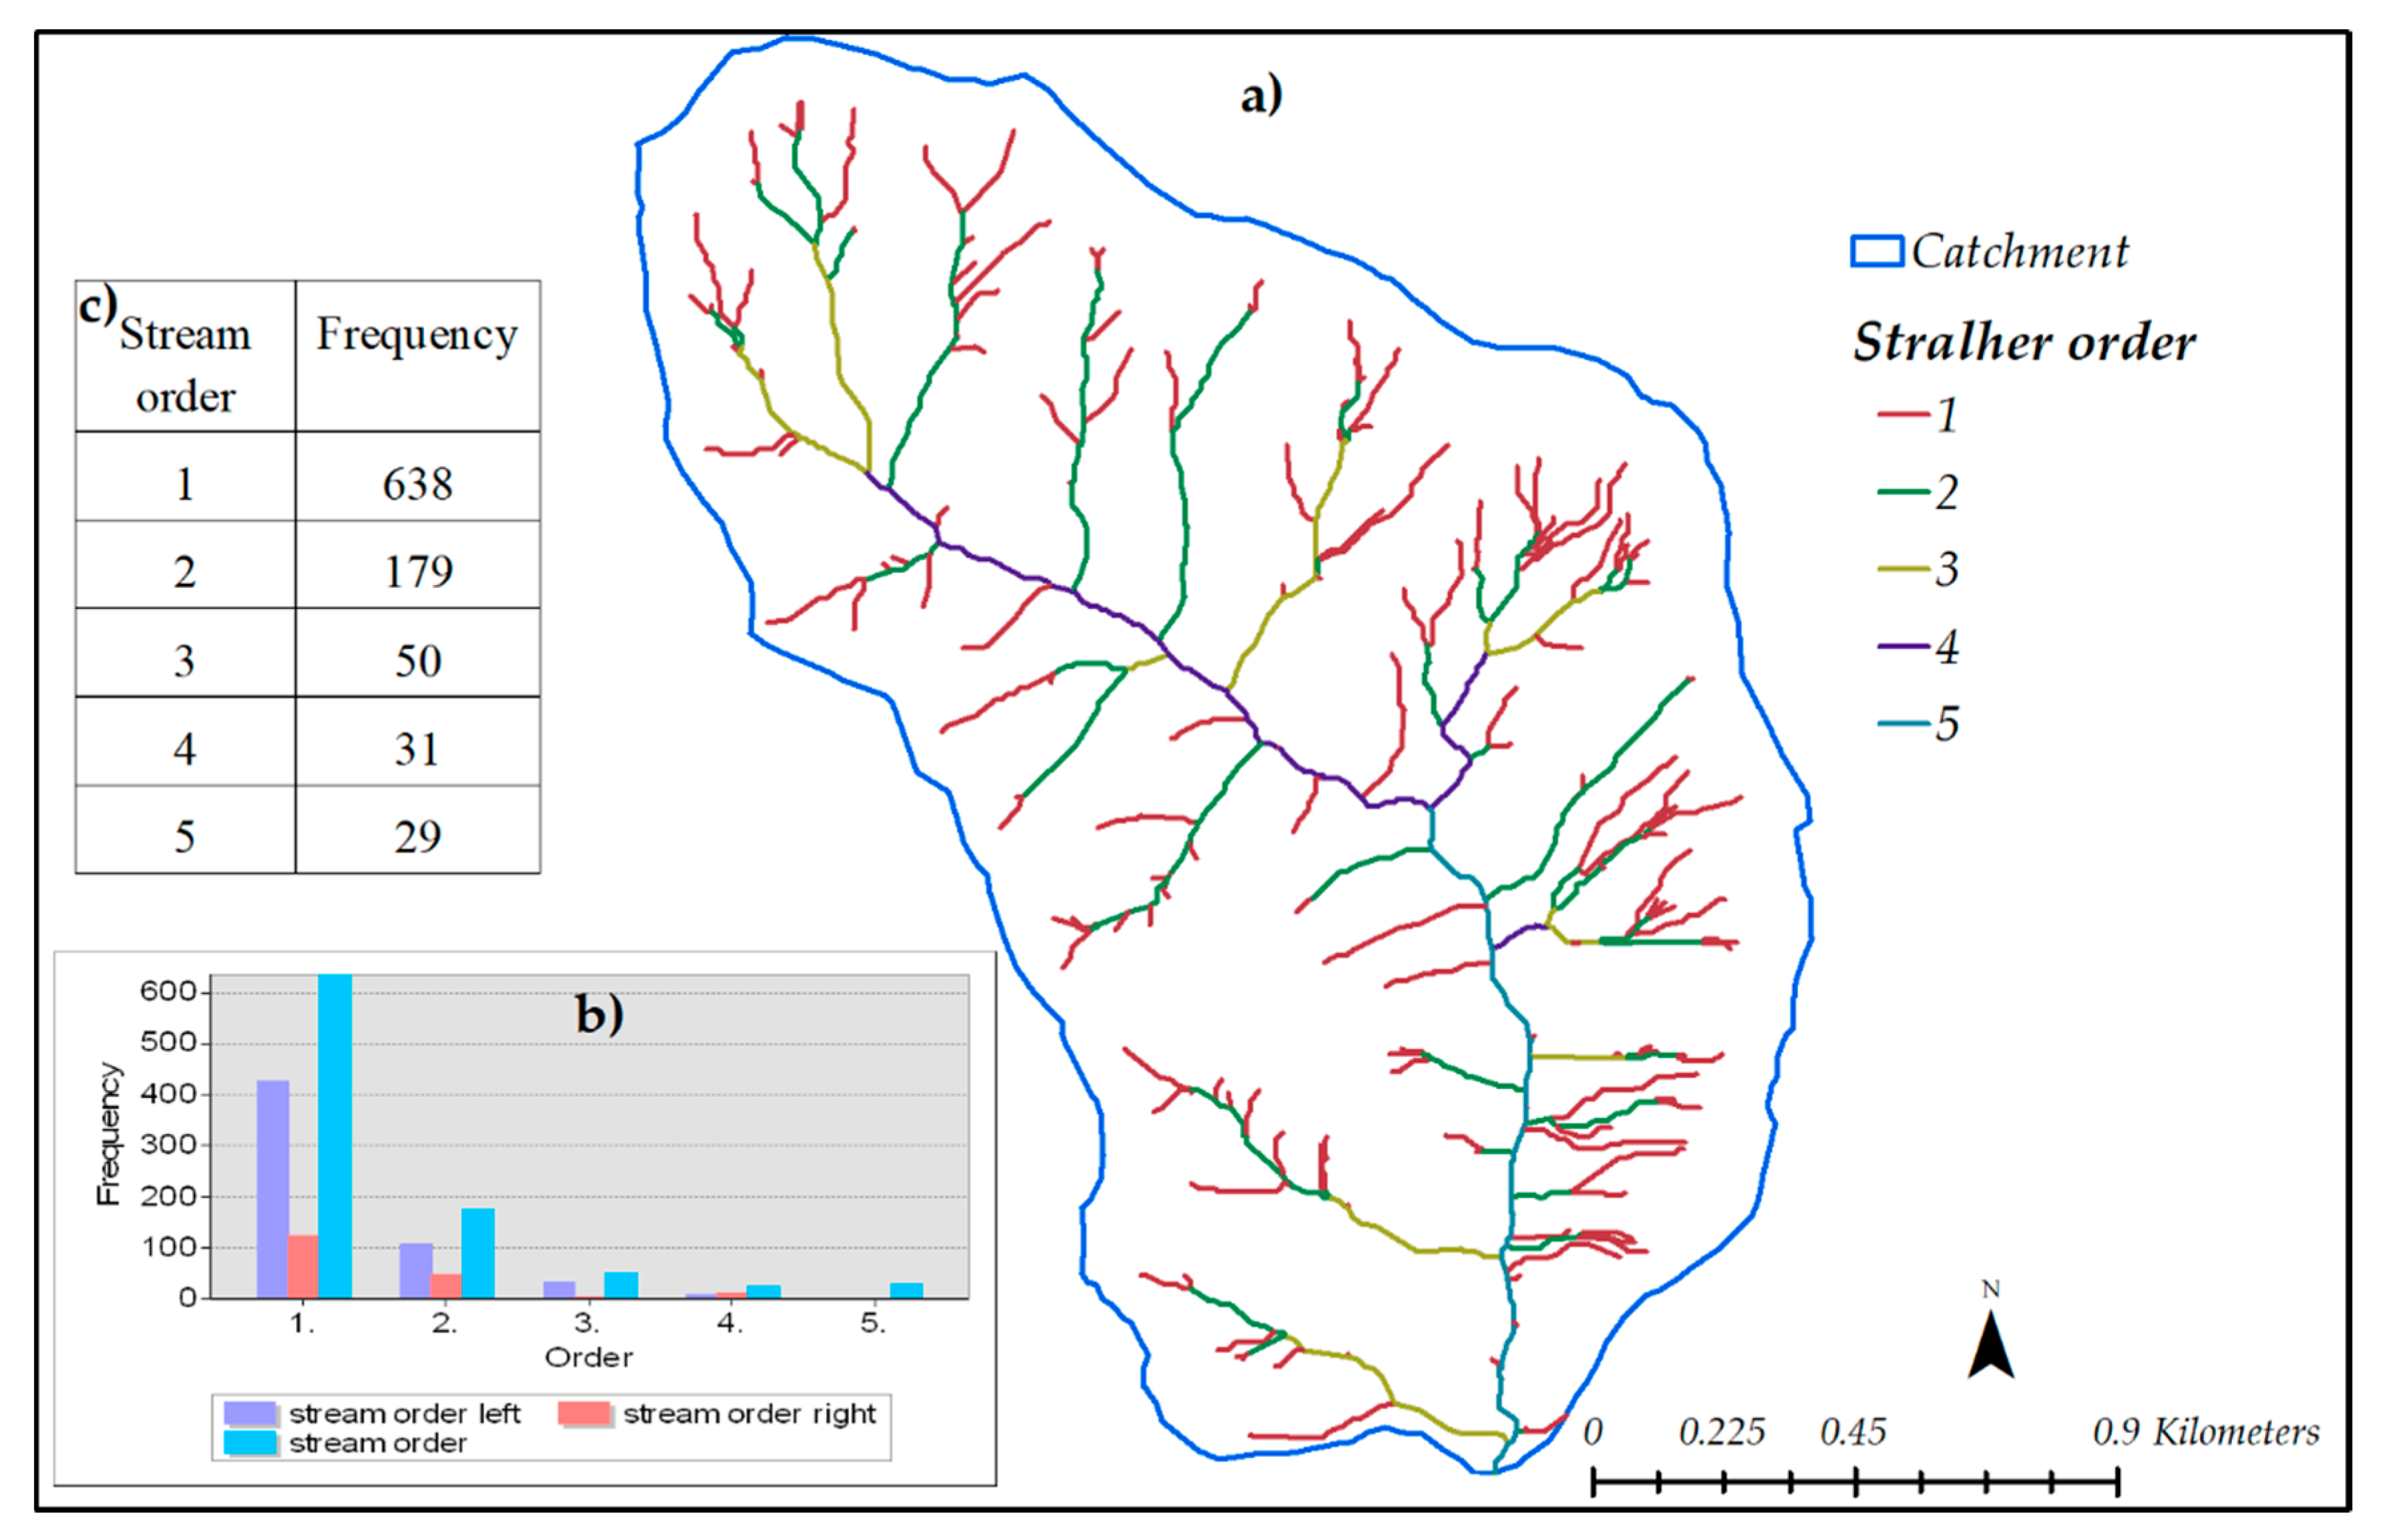
Based on Strahler’s system of stream ordering, the basin was designated as a fifth-order basin (Figure 8a), and, according to [47], the total number of streams gradually decreases as the stream order increases. In the present investigation, the maximum frequency (Figure 8b) was observed in the first-order streams (638 counts). Figure 8c shows the different stream ordering between the right and the left side, where we highlighted that the 67% of the left side stream is the first order and only 33% is for the right side.
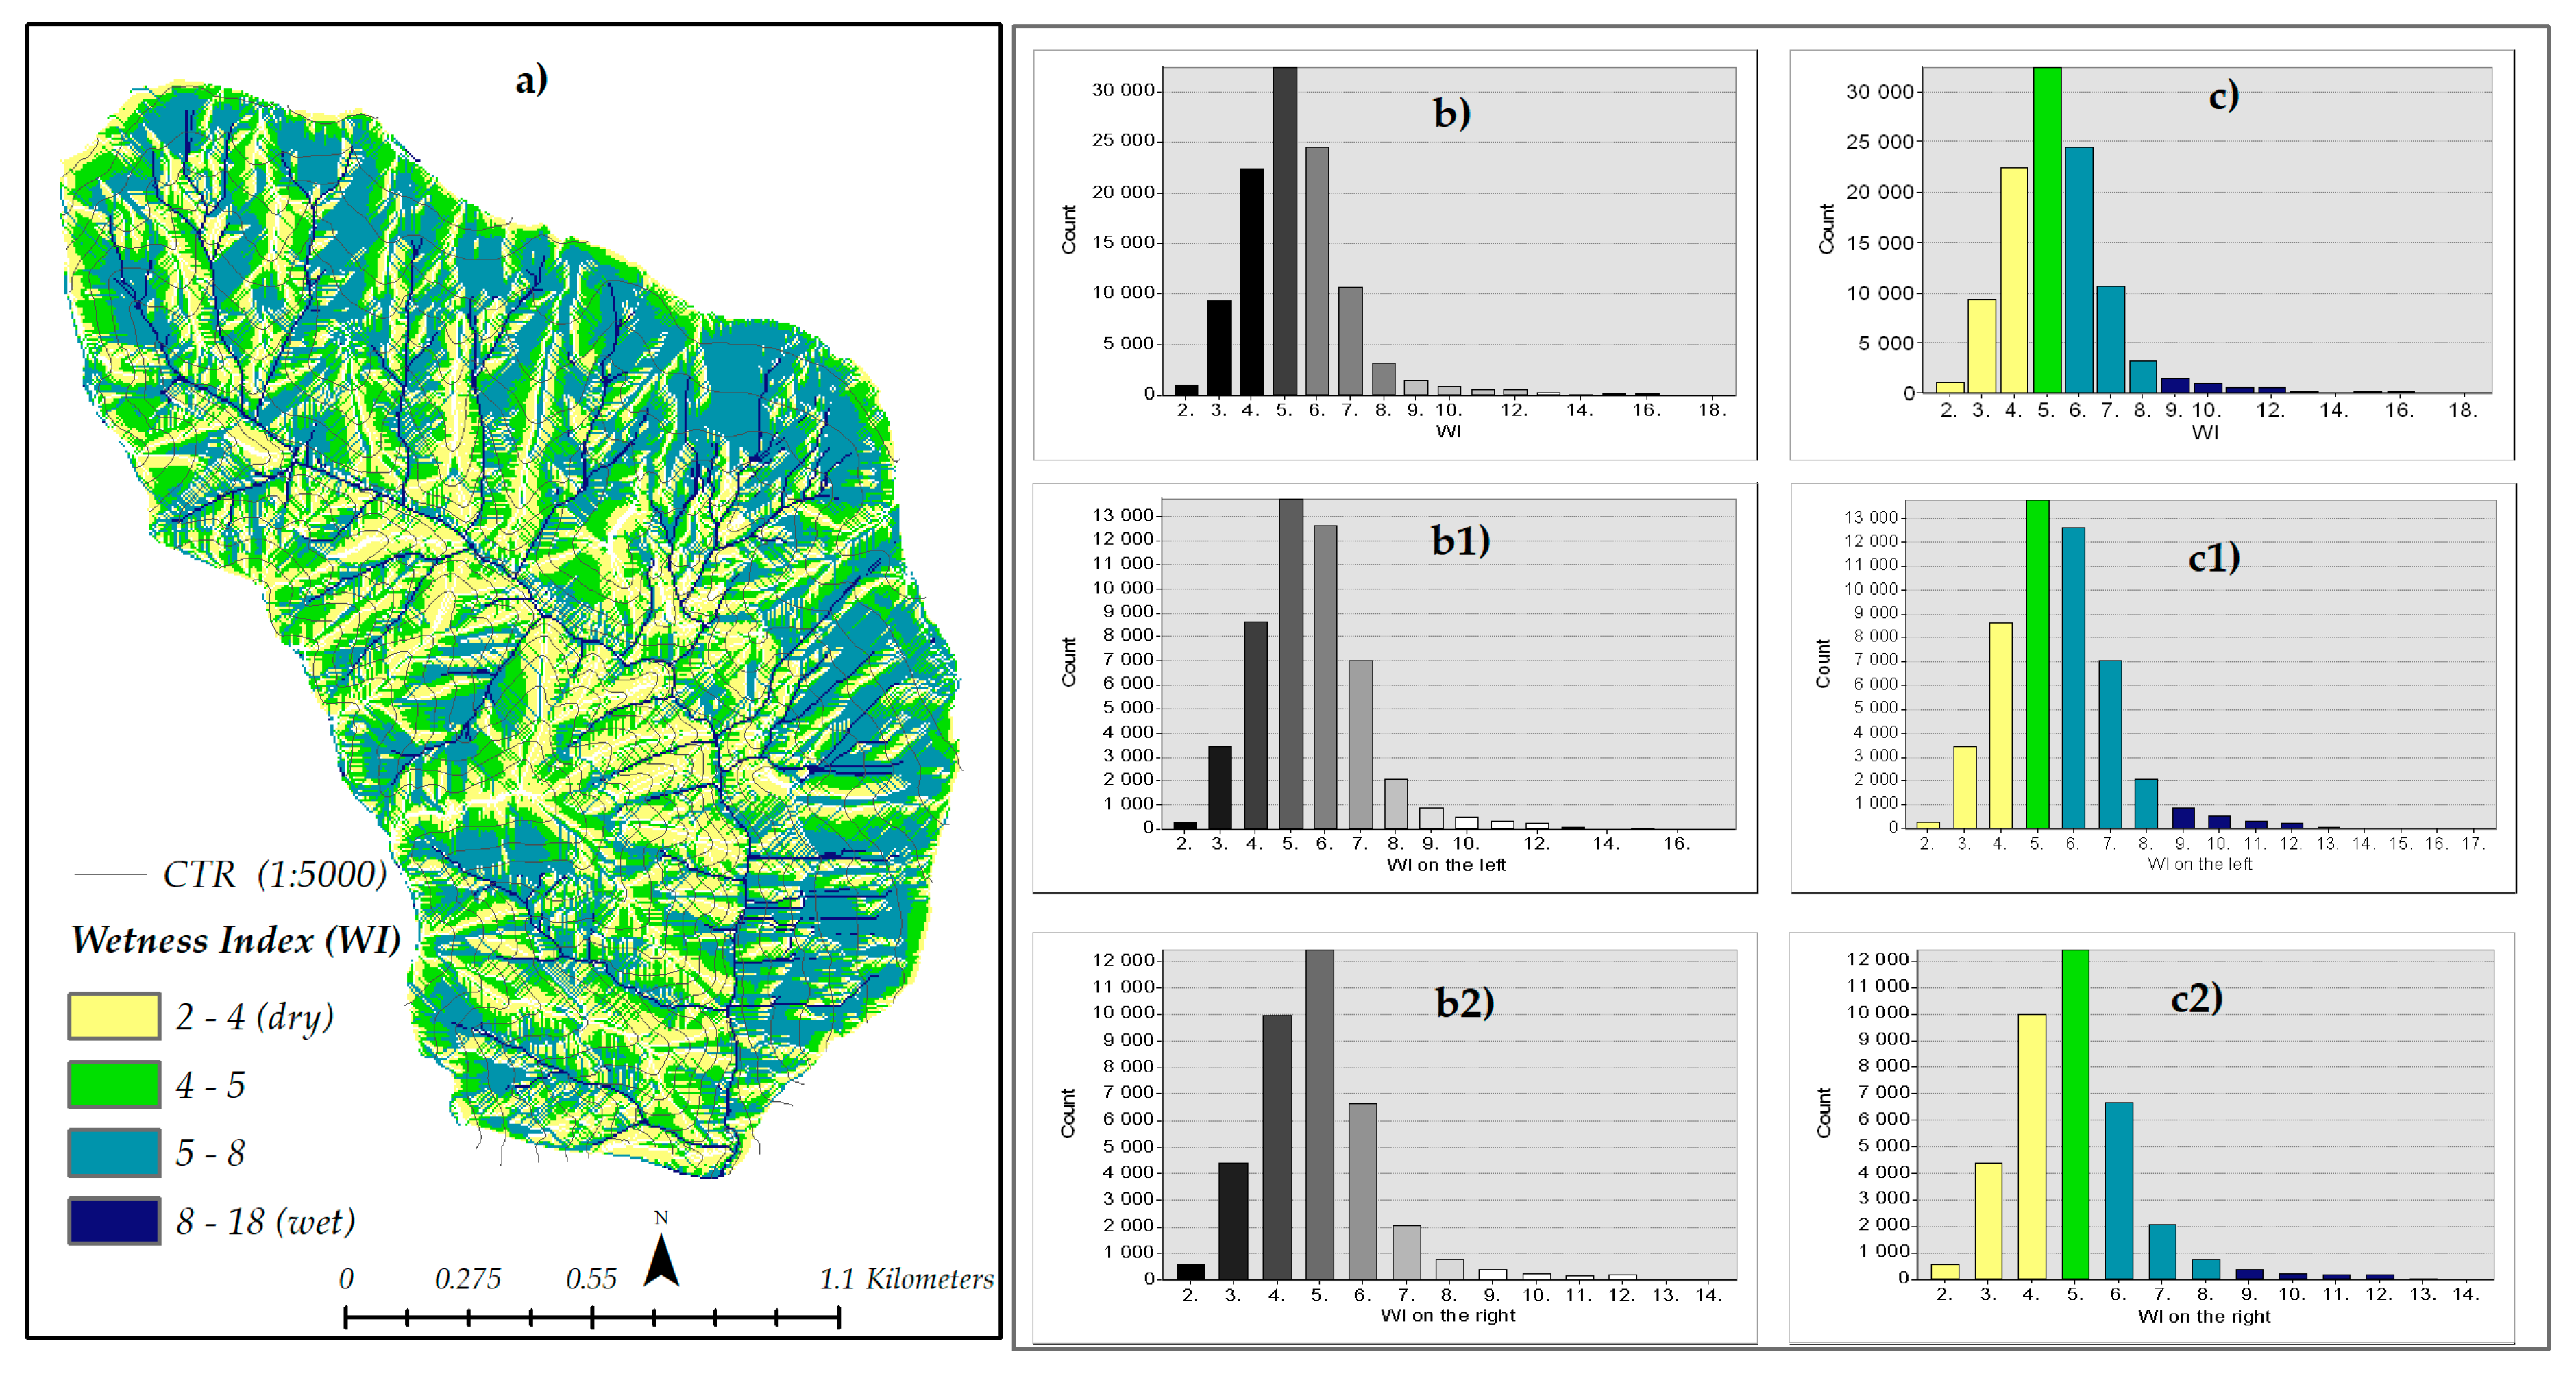
In Figure 9a, the classified WI map is shown. In this investigation, the catchment has a positive skewed distribution (Figure 9b) and the same appears on the left (Figure 9b1) and right sides of this (Figure 9b2). The classified WI map exhibits the highest frequency in the range of 5–7 on the whole catchment (28%) (Figure 9c) and the left hand of it (36%) (Figure 9c1), while for the right side (Figure 9c2) the highest frequency is within the range of 4–5 (31.5%).
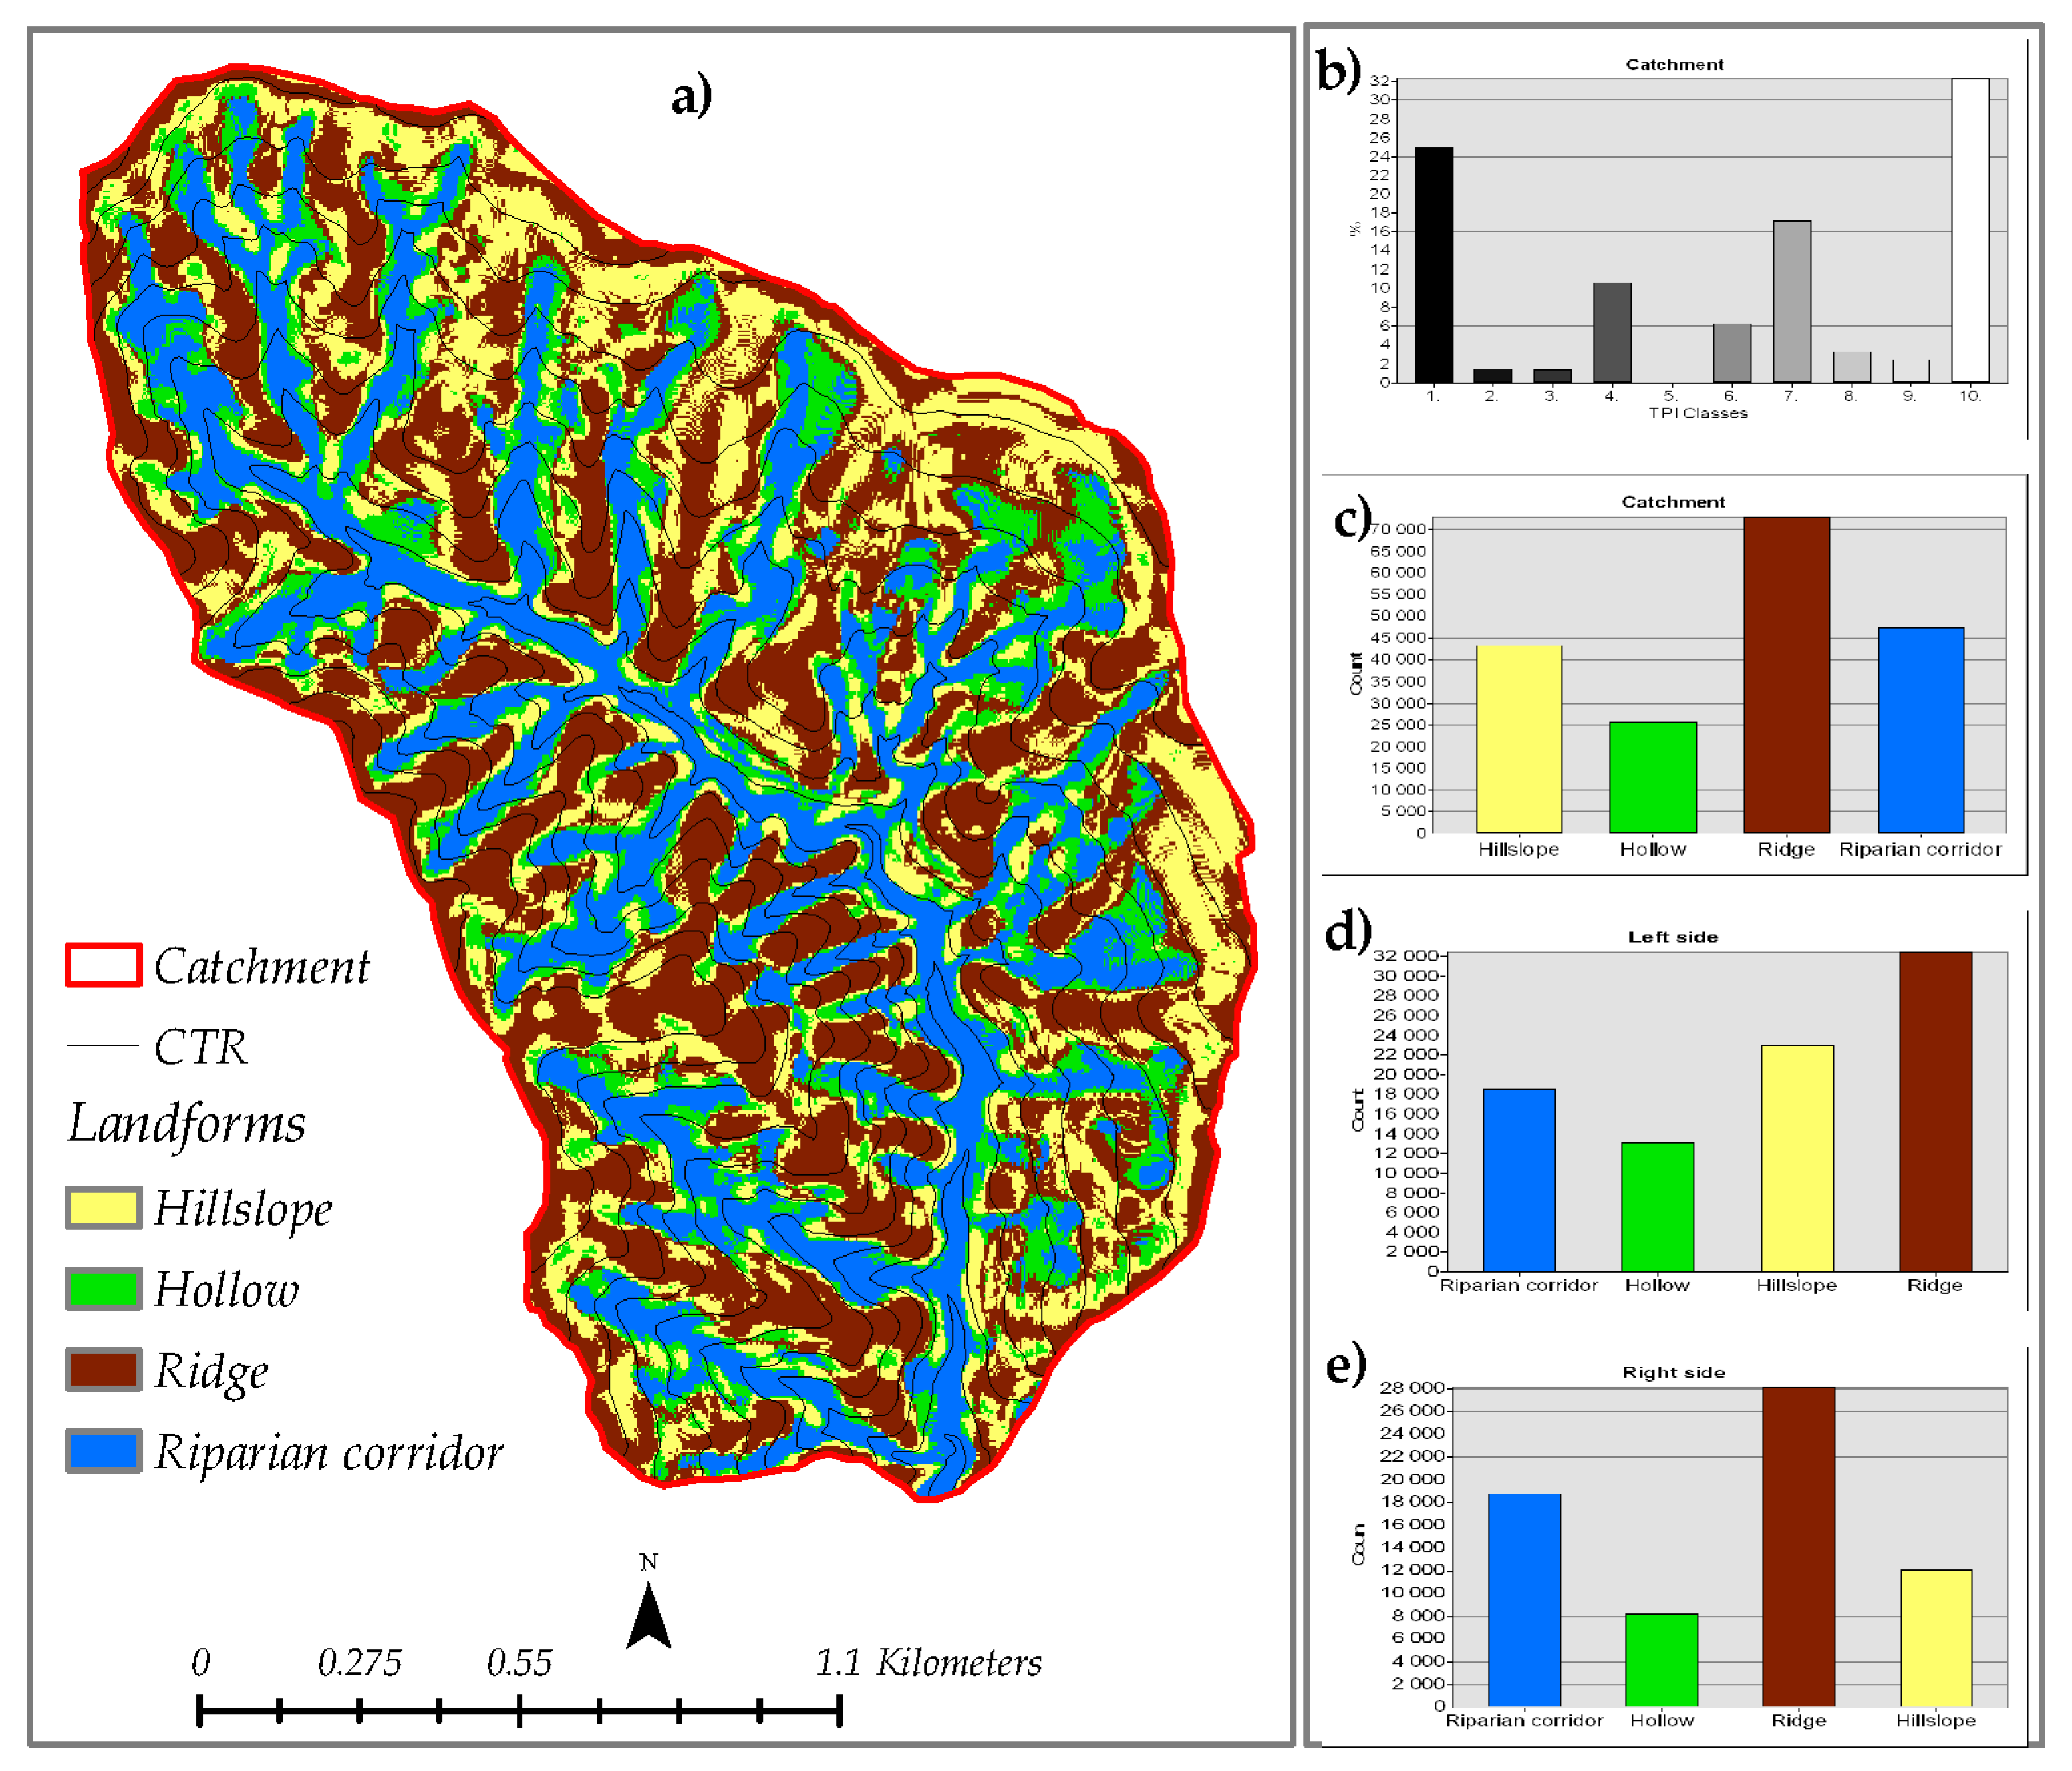
The Topographic Position Index (TPI) (Figure 10) is one of the morphometric tools based on neighboring areas that is useful in topographic and DEM analysis [46], here used for a semi-automated landform classification. The adopted procedure works on two windows whose size have to be chosen to obtain the better representation of the real landscape. To this aim we used the expert base geomorphologic map (Section 2.1) to optimize the TPI map. The TPI map, here produced, is also in good accordance with the source areas defined in [7,8], whereby a hydro-geochemical investigation of the catchment was identified and modelled in a geomorphometric manner in [4].
The reference catchment was composed of a prevalence of ridge or summit (33%), 25% of the catchment was incised stream and the 15.4% and 10% were, respectively, upper slopes and U-shaped (or headwaters) valleys. A major difference between the left (Figure 10d) and the right (Figure 10e) side of the catchment is the higher presence of hollow and hillslope on the left side compared with the right side.

3.2. Connection between the Hydro-Chemical Relations and Hysteretic Loops

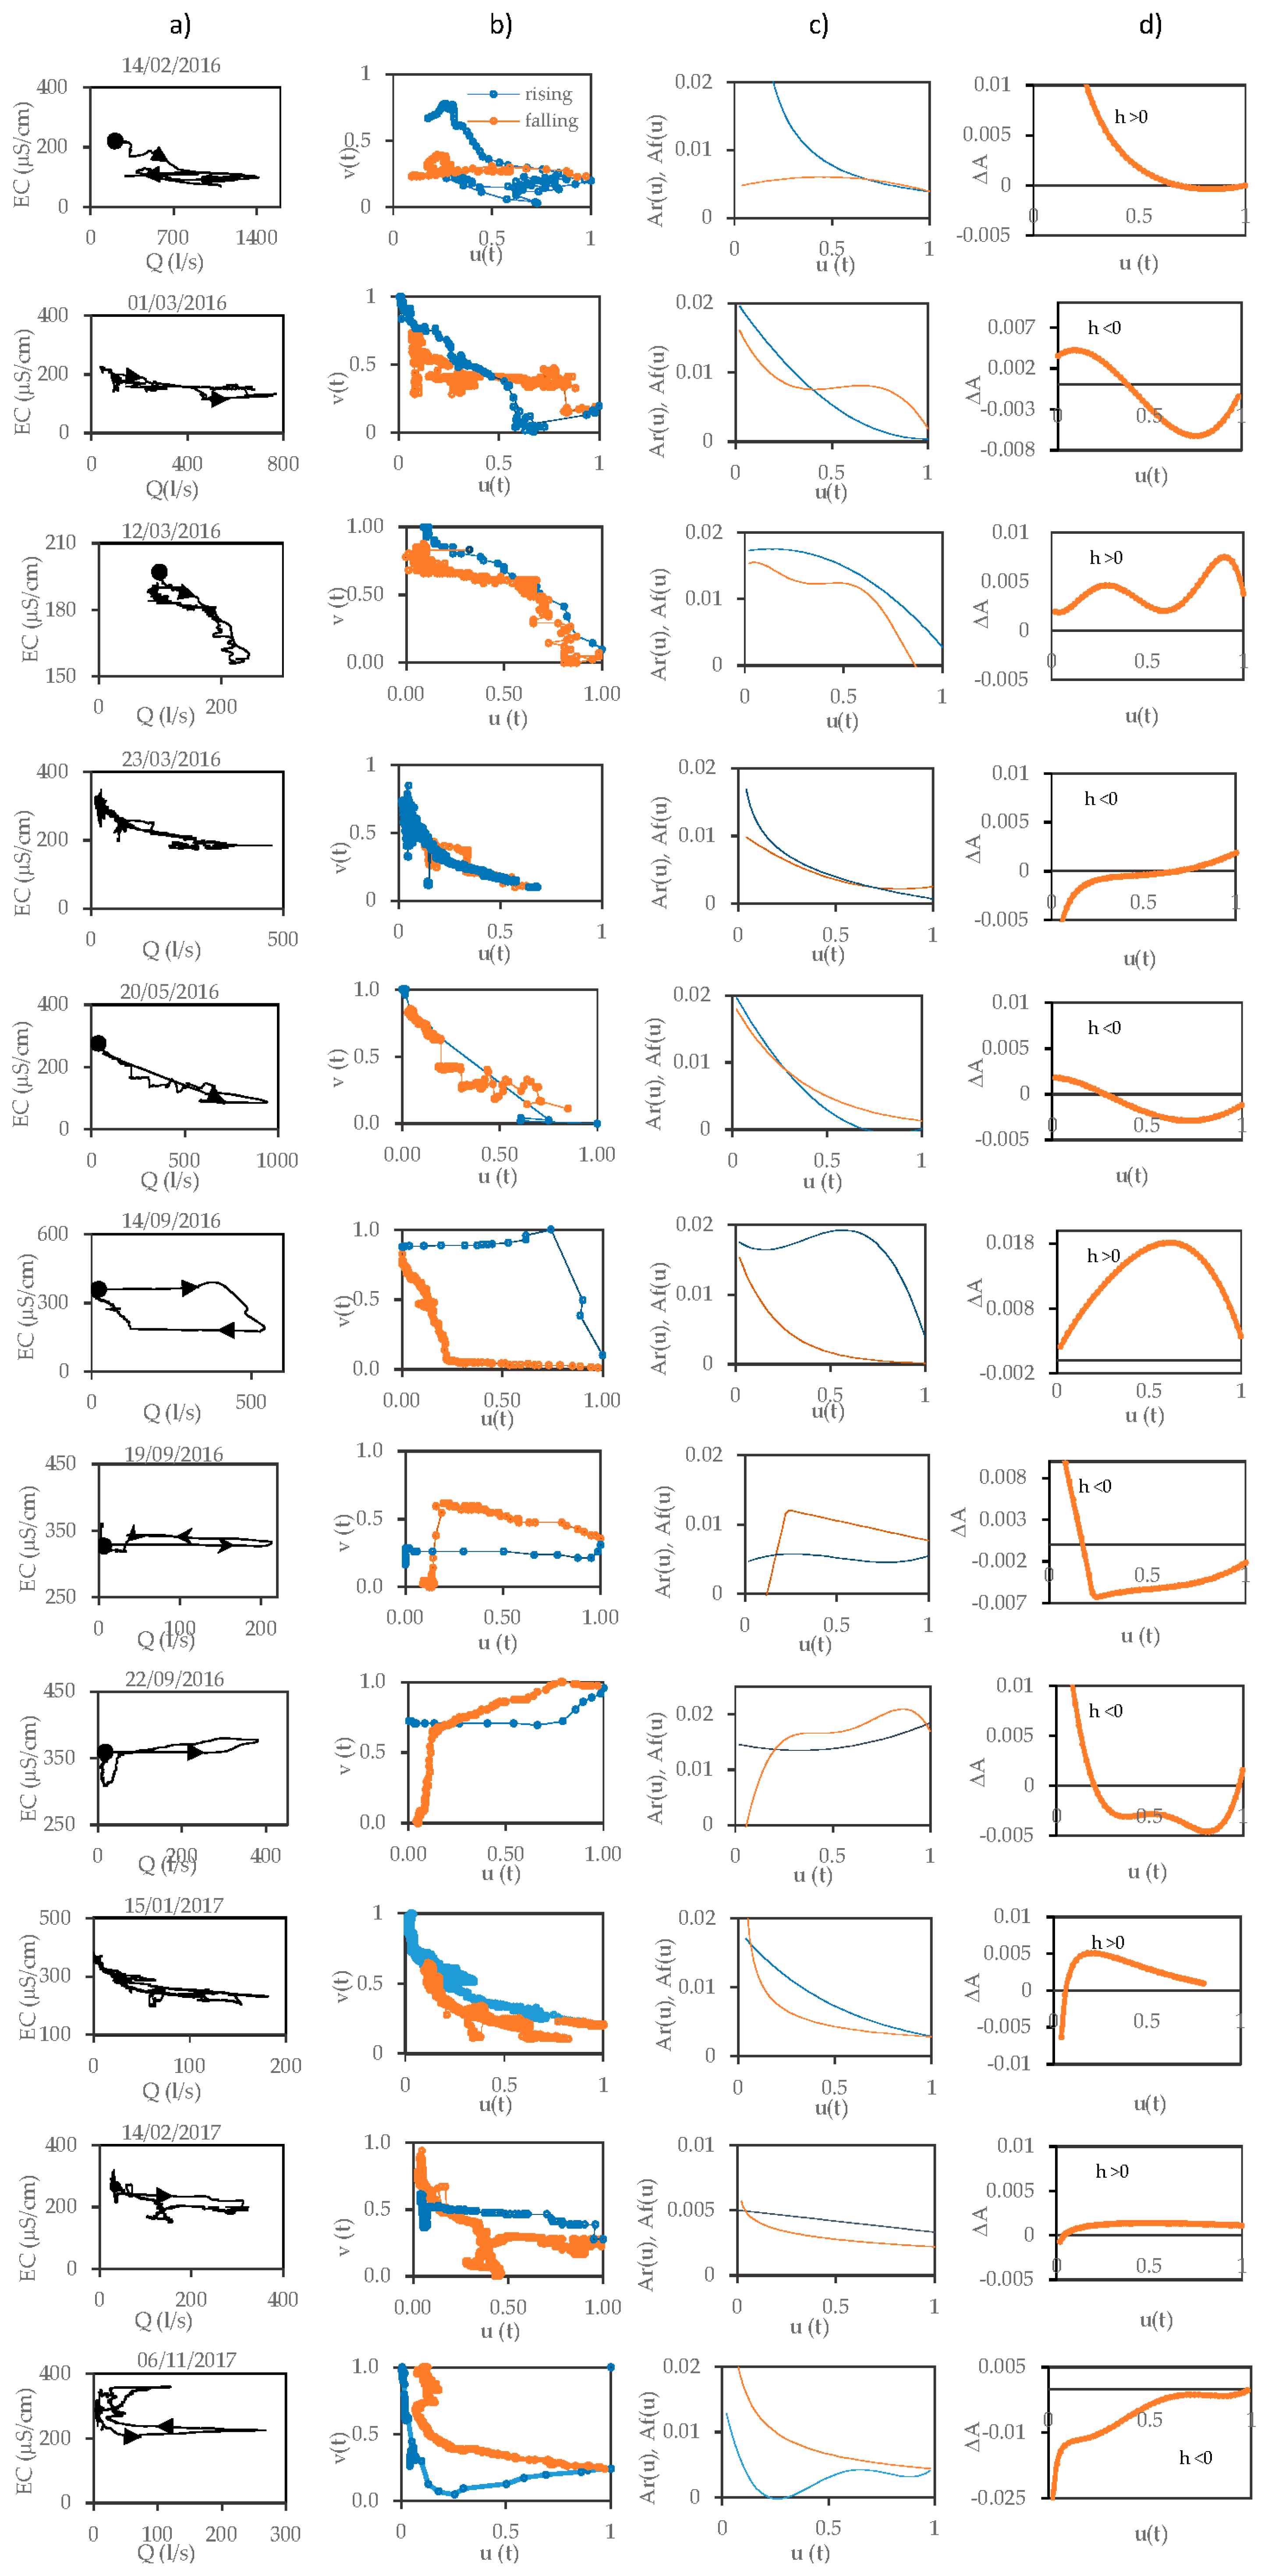
In order to evaluate the hysteretic loop, 11 events were selected from the 5-min Q-EC dataset. The events are shown in Figure 11, where the first column contains the selected hydro-chemograph events. In the middle field, the events are characterized by using the daily chart of [8] for identifying the runoff mechanisms. The daily chart was derived from the application of the mixing law equation by using the Q-EC end-members collected during the hydro-geomorphic monitoring activities. The mixing law was applied considering that following prolonged and intense rainstorms, occurring during the wet period, different runoff mechanisms are progressively activated from different runoff sources and mixed to the previous one. Based on the above assumptions, we derived that the upper hyperbolic 1(UH1) curve that describes the Q-EC relation for a groundwater and groundwater ridging mechanisms (Q = 1–3 l/s and EC = 350–240 μS/cm). The second upper hyperbolic curve (UH2) starts when the UH1 reaches its horizontal asymptote (Q = 3 l/s and EC = 220 μS/cm) and the sub-surface mechanism starts to enlarge and expand, mixing with the previous one. The upper linear curve (UL3) describes the Q-EC relation when the direct runoff and soil pipe mixes with the previous components; this condition begins when the UH2 reaches the horizontal asymptote for Q =400 l/s and EC = 120 μS/cm. In the last field the hysteretic loop is shown.
It is widely accepted that during a purely natural event, only affected by precipitation input, the hydro-chemo-graph shows an inverse relationship between the two variables Q and EC, therefore when the discharge reaches its maximum value, EC reaches its lowest value, while the EC values increase (recovery phase) during the recession limb of Q. Following this assumption, the first five events of Figure 11 exhibited a hydro-chemograph pattern typical of rain-influenced events and these events fell within the boundary curves of the daily chart. They differed from each other in their hydrologic characteristics: the 14th February 2016 event was a compound event with several peaks that fell under the linear curve of the daily chart (UL3) describing the prevailing direct runoff, so called Hortonian flow and the hysteretic loop exhibit overlapping curves due to the presence of several peaks and a clockwise loop. The event that occurred on the 13th March 2016 was a sub-event (Q = 237 l/s, EC = 173 μS/cm) extracted from a multiple peaks event. Its position on the daily chart confirms the nature of sub-events because it is not completed with the groundwater (first hyperbolic curve) and Hortonian flows (linear relation). For this event, the hysteretic loop was clockwise. The events that occurred on the 20th of May 2016, 1st of March 2016 and 23rd of March 2016 were all single events with well-defined peaks of 960 l/s, 750 l/s and 500 l/s, respectively. In the daily chart, the event data points were well described by the characteristic curves identifying the active runoff mechanisms and their hysteretic loops were anticlockwise.
By analyzing the Q-EC pattern, the three events occurring on September 2016 were deemed to be “affected”, as defined in [48]: the event that occurred on September 14th 2016 began with a constant horizontal EC value even if Q increased and a sudden decrease of EC was delayed with respect to the peak value. The hysteretic curve had an anticlockwise loop and a square shape. For the events that occurred on the 19th and 22nd of September the EC ranged between 300 and 400 μS/cm during the peak discharge (dilution phase). The hysteretic loop was clockwise and a horizontal linear Q-EC hysteretic relation appeared until the peak discharge. A similar behavior was detected for the event that occurred on November 6th, 2017. For all these events, the data fell outside the first upper boundary curve (groundwater field) of the daily chart with a constant value of the EC despite Q increasing.
The events of January 15th and February 6th, 2017, seemed to be affected as well, even if in a slightly different way. In the Q-EC daily chart, the data fell within the dry field of the chart. The hysteretic relation had an anticlockwise loop.

3.3. Hysteretic Index Results

Over the last few years, researchers have described and interpreted these relationships through indices, which identified the different hysteretic patterns. In the case of a Q-EC relationship, hysteretic behavior is strongly dependent on the nature of the event [49].
In Figure 12, the main steps of the hysteresis index computation and the h index values are shown, respectively. In the first column, the hysteretic relationship between Q and EC is reported, while the results of the computation can be seen in columns b–d.
Observing the various events, a coherent result was obtained for the events of the 19th and 22nd of September 2016 and the 6th of November 2017, which exhibited a negative h index; the other affected events had an h index >0 (clockwise loop). The same hysteretic behavior was found for the events of the 1st and 23rd of March 2016 and of 20th of May 2016 that had an h index <0 and a figure-of-eight-shaped loop (ΔAmin <0 and ΔAmax >0). The other events, such as the 13th of March 2016 or the 14th of September 2016, did not show comparable hysteretic behavior with the other selected events. The couple of events of the 15th of January and 14th of February 2017 seemed to exhibit a similar hysteretic behavior, with h >0 (clockwise loop), ΔAmin <0 and ΔAmax >0.

4. Discussion

The paper focused on the analysis of the Mediterranean reference Ciciriello catchment in terms of geology, geomorphometry and hydrology to derive a geo-hydrological perceptual model of the experimental catchment. The studied catchment was characterized by different geo-structural and morphological assets between the right and left side of the catchment, also due to the presence of landslides on the left side, as confirmed during field surveys. From the TPI map, we derived that the reference catchment was composed of a prevalence of ridge or summit (33%), 25% of the catchment was incised stream and riparian corridor and 15.4% and 10% were respectively upper slopes and U-shaped (or headwaters) valleys. The drainage network and the riparian corridor were at 450–550 m asl while, up to 650 m asl we identified hillslope with a gentle slope gradient. At elevations larger than 650 m asl we identified the hillslope with a steeper slope gradient.
A higher number of first-order streams was observed in the catchment, which pointed towards terrain complexity and the compact nature of the bedrock lithology. The catchment was characterized by potential wet areas with WI values from 5 to 8 indicating a sub-surface flow mechanism localized in the convergent–concave areas and in the hollow land unit. The streamline network was well identified with the highest WI values up to 8. The authors classified the values ranging from 4 to 5 as a parallel flow or Hortonian overland flow occurring in a linear land unit as open slope or hillslopes. The WI less than 4 was localized in the permeable convex landforms (as ridge or summit) where the deep percolation dominantly occurs.
The geomorphometric analysis seemed to highlight the different geologic characteristics of the two sides of the catchment. In particular, the TPI map revealed the difference between the left and the right side of the catchment with a higher presence of hollows and hillslopes on the left side than the right side. These differences were further confirmed by the slope map analysis where the higher slope gradient was on the right valley characterized by very incised stream beds, while lower slope gradients were on the left valley of the catchment, where landslides occur. The presence of a large number of streams in the left valley indicates that the topography is still undergoing erosion and at the same time, the lower number of streams on the right indicates a mature topography. These results are also linked to the structural asset of the bedrock that is characterized by dip slope layers on the left valley where a higher presence of landslides than the right valley was verified in the field.
The analyses of the events—achieved by comparison of the hydro-chemograph pattern, the daily EC-Q chart of [8] and the hysteretic behavior—to understand the geo-hydrologic behavior of the reference catchment highlighted the occurrence of two types of events: the ordinary and the affected events (Table 3). The ordinary events were identified if the hydro-chemograph pattern respected the well-known Q-EC inverse power law. This condition was reflected in the daily chart for the three types of runoff mechanisms, if the data events fell under the characteristic curves. When this condition was not met, the data fell outside the fields of the chart, and the Q-EC pattern did not respect the inverse relation, the event was defined as affected. The presence of affected events highlighted the limit of the daily chart to represent certain physical mechanisms as more identifiable at high frequency analysis. In Table 1, the event types are summarized.
The ordinary events were classified considering their hydrologic pattern into: compound events, occurring during the rainy period and for which it was impossible to isolate a single peak event; sub-events, occurring within a rainy period and for which it was possible to identify one isolated peak; and pure ordinary events, for which it was possible to identify an isolated peak. All the events defined as ordinary fell within the boundary curves of the daily chart. The daily Q-EC analysis, performed by [7] on the same catchment, highlighted that the Ciciriello is characterized by a deep percolation mechanism that takes place in the bedrock and that constitutes the base of the stream flow (340 μS/cm) during the dry period.
During the initial phase of the wet season, the intense and short showers induced storm flow only from riparian corridors and impervious surfaces with short, peaked and opposite flood hydro-chemographs. After a prolonged rainfall, the sub-surficial runoff component, from regolith and infilling soil on the hillside and hollows, was added to the groundwater component as delayed return flow (Q-EC values ranging from 50 to 100 l/s and 100–120 μS/cm, respectively). During and just after the storm event, quick return flow from the topsoil added new water to the total storm flow (the lowest EC-Q values were 70–110 μS/cm): this represents the peak flow conditions during wet periods.
This catchment behavior was confirmed by the 5-min event analysis performed on the Q-EC data using the chart. The compound event of the 14th of February 2016 showed the system response during the wet phase, with a peak flow condition and the activation of topsoil with the fast return flow. The delayed response was the sub-surface flow from the regolith and infilling soil on the hillside and hollows. The single event that occurred on the 1st March 2016 exhibited a progressive rise from a minimum flow to a well-defined peak of 750 l/s, after which there was a progressive return to zero. Its position in the hydro-chemograph analytical curves, with EC ranging between 120 and 160 μS/cm, confirmed that the catchment at the end of the rainy period was saturated [4] and the hydrologic response was sustained by groundwater ridging and sub-surface flow as main components.
The event that occurred on the 23rd of March 2016 was a single event with a peak discharge lower than 400 l/s that was not high enough to show the activation of the hillside and the hollow contribution. This event was affected by the antecedent soil moisture conditions of the 1st of March. Its position on the chart was due to the deep aquifer (EC between 160 and 370 μS/cm) that started to sustain the hydrologic response of the system. The event of the 20th of May 2016 was an isolated peak that occurred at the beginning of the dry period. A high ground water contribution was verified and the sub-surface flow acted as the faster response of the system activated from the nearest hillside and hollow to the riparian corridor.
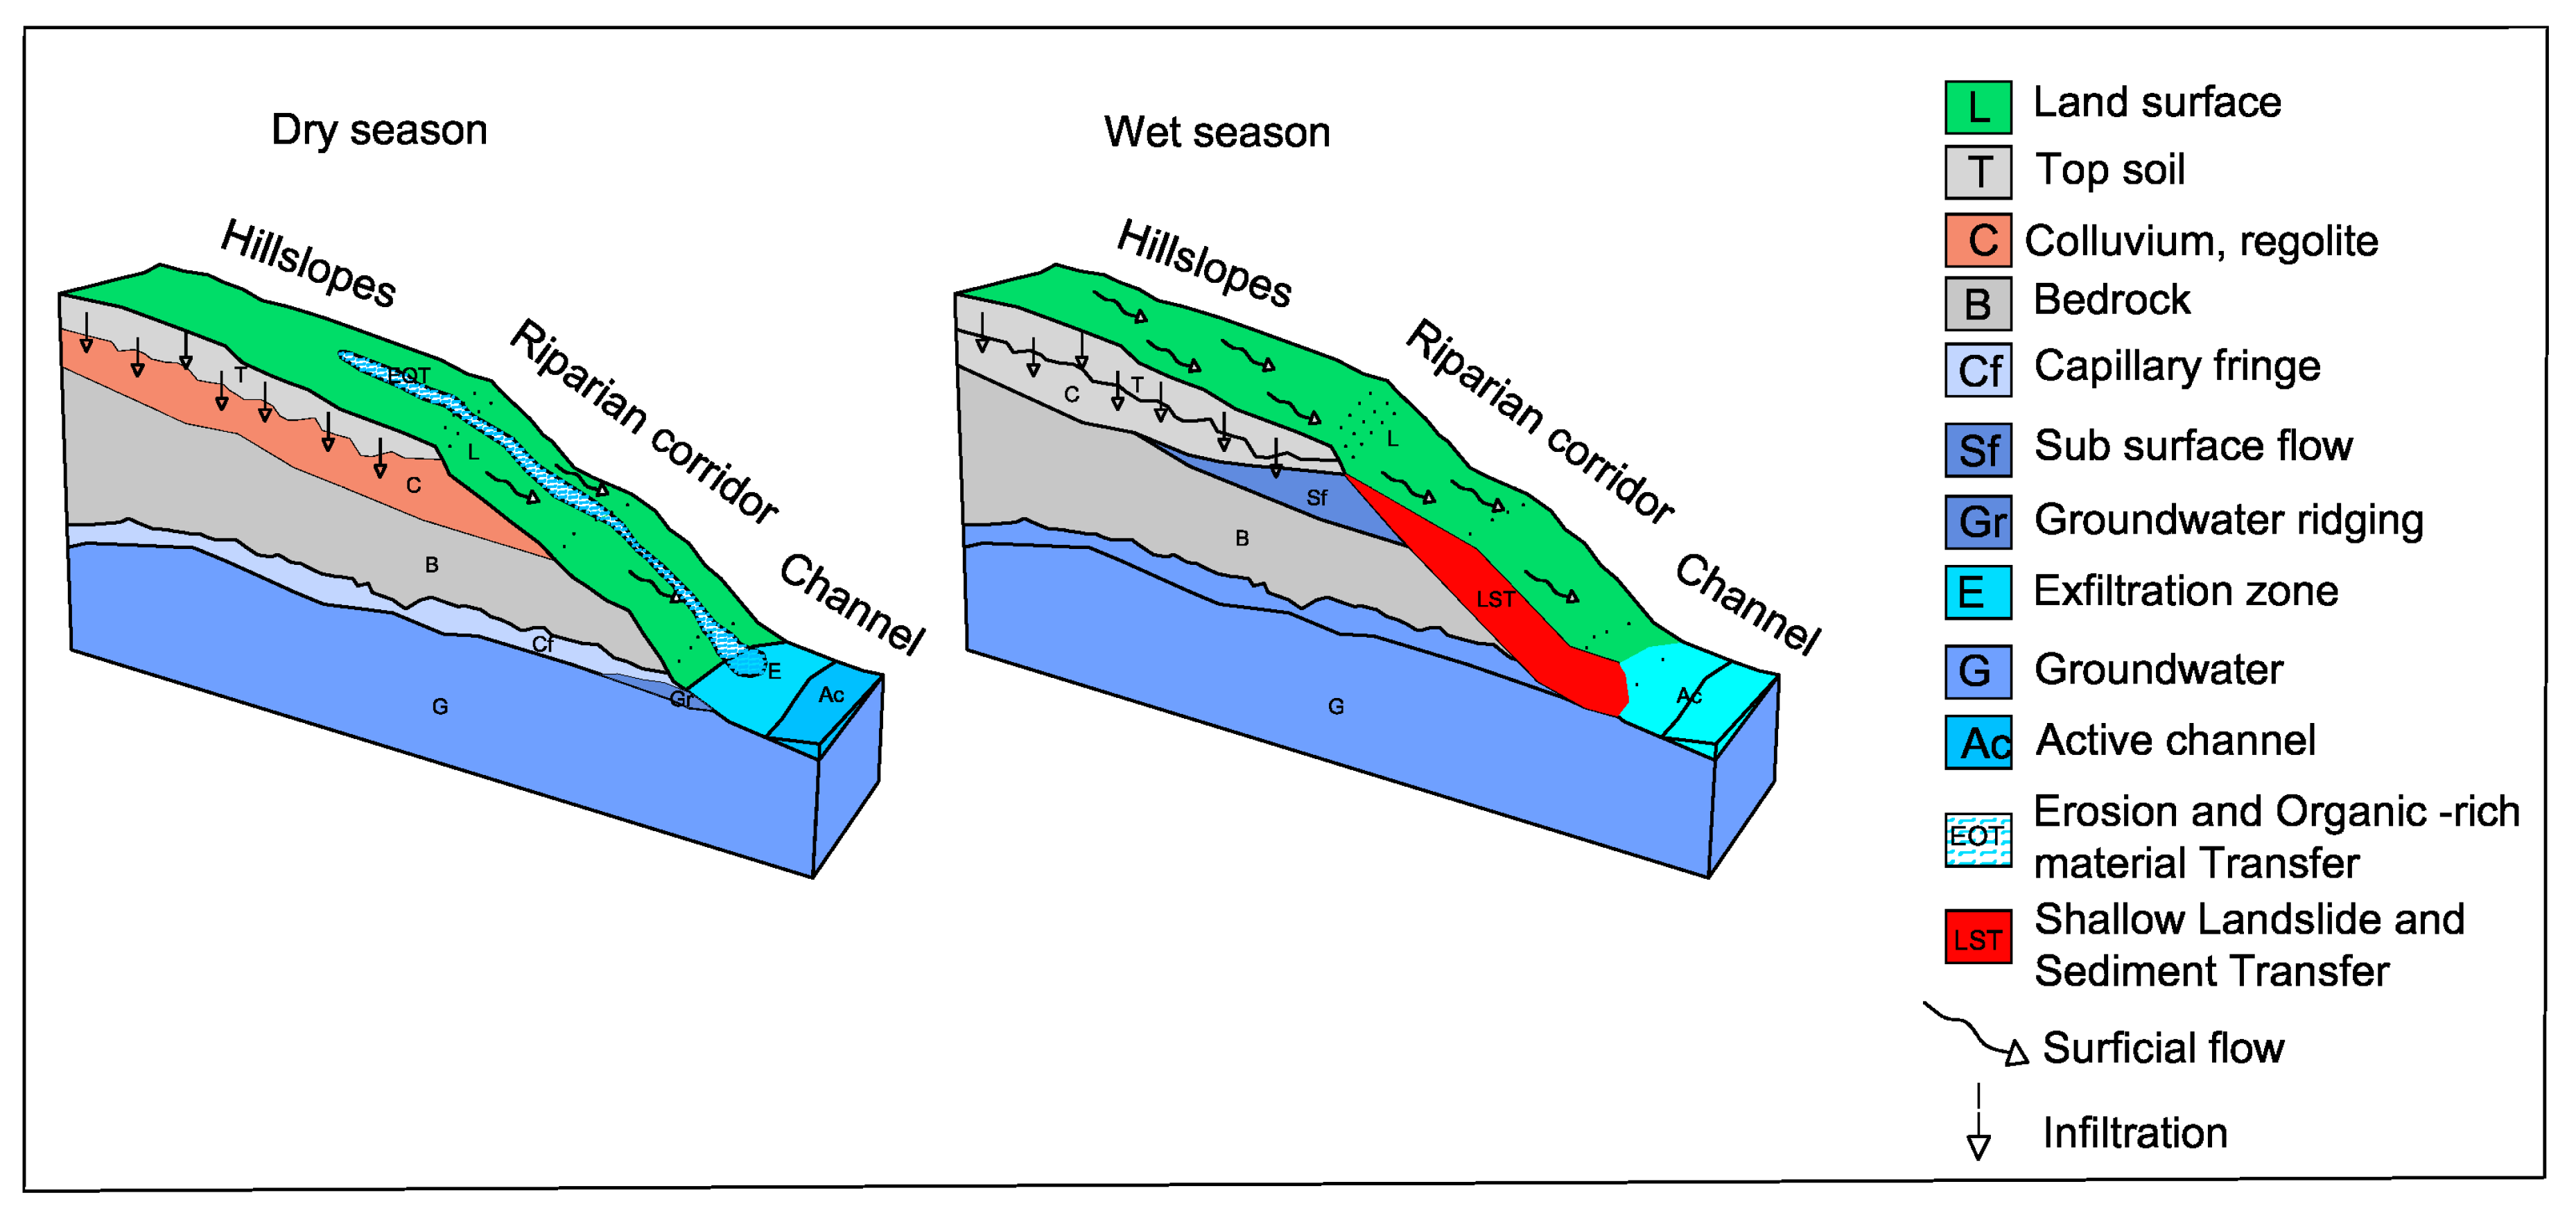
Figure 13 shows a schematic representation of the geohydrologic perceptual model of the Ciciriello, where only a portion of catchment was representing by a 3D scheme, including a generic hillslope-riparian corridor-channel transect during a peak discharge, both in dry and wet season. Detected natural geomorphic processes, that affect the hydro-chemograph response as material transfer by erosion and shallow landslides, are added.
The affected events, characterized, during a dilution phase, by a positive Q-EC relation or a constant EC value, were classified with respect to their origins: snow-melt, organic sediment and farmer waste. The causes of the organic sediment can be related to the erosion and transfer of the leaf litter deposited in the hollow and channel during the summer (14 September 2016). Spot turbidity events, affecting anomalous EC response, are recorded during the wet season. They can be related to shallow landslides along the riparian corridor (06 November 2017). The farmer waste injection, that is caused by un-controlled spills into the river, was revealed by direct surveys and is well detected by the anomalous behavior of the corresponding hysteresis cycle. The snow-melt, instead, is due to the cold winter that occurred with a snow event at higher elevation (42% of landforms is ridge up to 800 m asl or secondary ridge at 600 m asl).
The events that occurred in January and February of 2017 were affected by snow events. For these events a decrease in the EC values was observed during the peak discharge (see hydro-chemograph) and the EC values, during the peak, were comparable to that of the sub-surface flow. At the middle of the recession limb, a decrease in the EC levels was observed due to the snowmelt phenomena often referred to as “delayed precipitation” due to the gradual release of water [50].
A geologic field survey demonstrated the presence of small mass movements on the left side of the catchment. Indeed, the larger presence of streams in the left side of valley, compared with the right side, indicated that the topography is still undergoing erosion. Furthermore, the presence of colluvial and alluvial formations on a dip slope layer confirmed the possible presence of inorganic sediment in the river during the wet season (06 November 2017), and organic sediment with the first precipitation after the dry period (July–August). This was the case of the event that occurred on the 14th of September 2016, which happened at the beginning of a new hydrologic year: after a dry period. The main mechanism was the overland flow (linear curve of the daily chart) that washed the landscape and moved sediment through the watershed. The water signature was about 200 μS/cm, a typical value of the sub-surface flow. The Table 3 shows the event types classified by comparing the Hydro-chemograph pattern and the daily chart
The presence of farmer activities on the catchment indicated uncontrolled spills into the river, verified during hydro-geomorphic fields surveys. This condition exhibits, on the dilution phase of the hydro-chemograph (19th and 22nd September 2016 events), a sudden increase in the EC pattern and a very high EC value compared to that of the others comparable events. The daily chart confirmed that the 19th and 22nd of September 2016 events are affected because, despite an increasing of Q, the EC value was constant with a value of approximately 350 μS/cm. The analysis performed on the selected events highlighted six different typologies of characteristic hysteretic parameters (Table 4).
The analysis on the shape of the Q-EC Hysteretic pattern was performed by estimating the hysteretic indexes h of [25], which was used here for its versatility and availability for a wide range of hydrological variables with respect to other indexes, including [51,52,53] and that of [1].
Comparing the results between the event types, we obtained a good result for the pollution influenced events (September 19 and 22), which exhibited a negative h index and the eight-shape (ΔAmin <0 and ΔAmax >0). Similar behaviors were obtained for the ordinary events that had an h index of less than 0 and the same eight-shape. The differences between the ordinary and pollutant events was in the dependent variable pattern that was, respectively, decreasing and increasing from the initial state. The compound event and the sub-event presented an h >0 with an order of magnitude greater than the ordinary event. This was due, most likely, to the antecedent moisture condition that was greater than the ordinary events. The inorganic sediment or shallow landslides event exhibit a negative h index, ΔAmin and ΔAmax. This event differs from the organic sediment event characterized by a positive indexes. The snowmelt event exhibited h >0 (clockwise loop), ΔAmin <0 and ΔAmax >0.
Specifically, in a forested catchment with no-evaporite bedrock, the Q-EC relationship was inverse: when the peak discharge occurred, the minimum EC value was recorded and vice versa. In this condition, the hysteretic loop would show a line during the rising phase, with a gentle negative slope until reaching the peak, after that, following a counter clockwise loop, it would reach the end point of the falling phase with h <0, ΔAmax >0 and ΔAmin <0. When pollution inputs occurred, the h index, ΔAmax and ΔAmin had the same values of the natural event; however, the dependent variable remained constant at the start of the event. For the snow melting case, h was <0, ΔAmax >0 and ΔAmin <0, the clock wise direction appeared and the dependent variable remained constant at the start of the event. Each type of event was associated with a well-specified pattern of the ΔA variation with respect to the variable u(t).
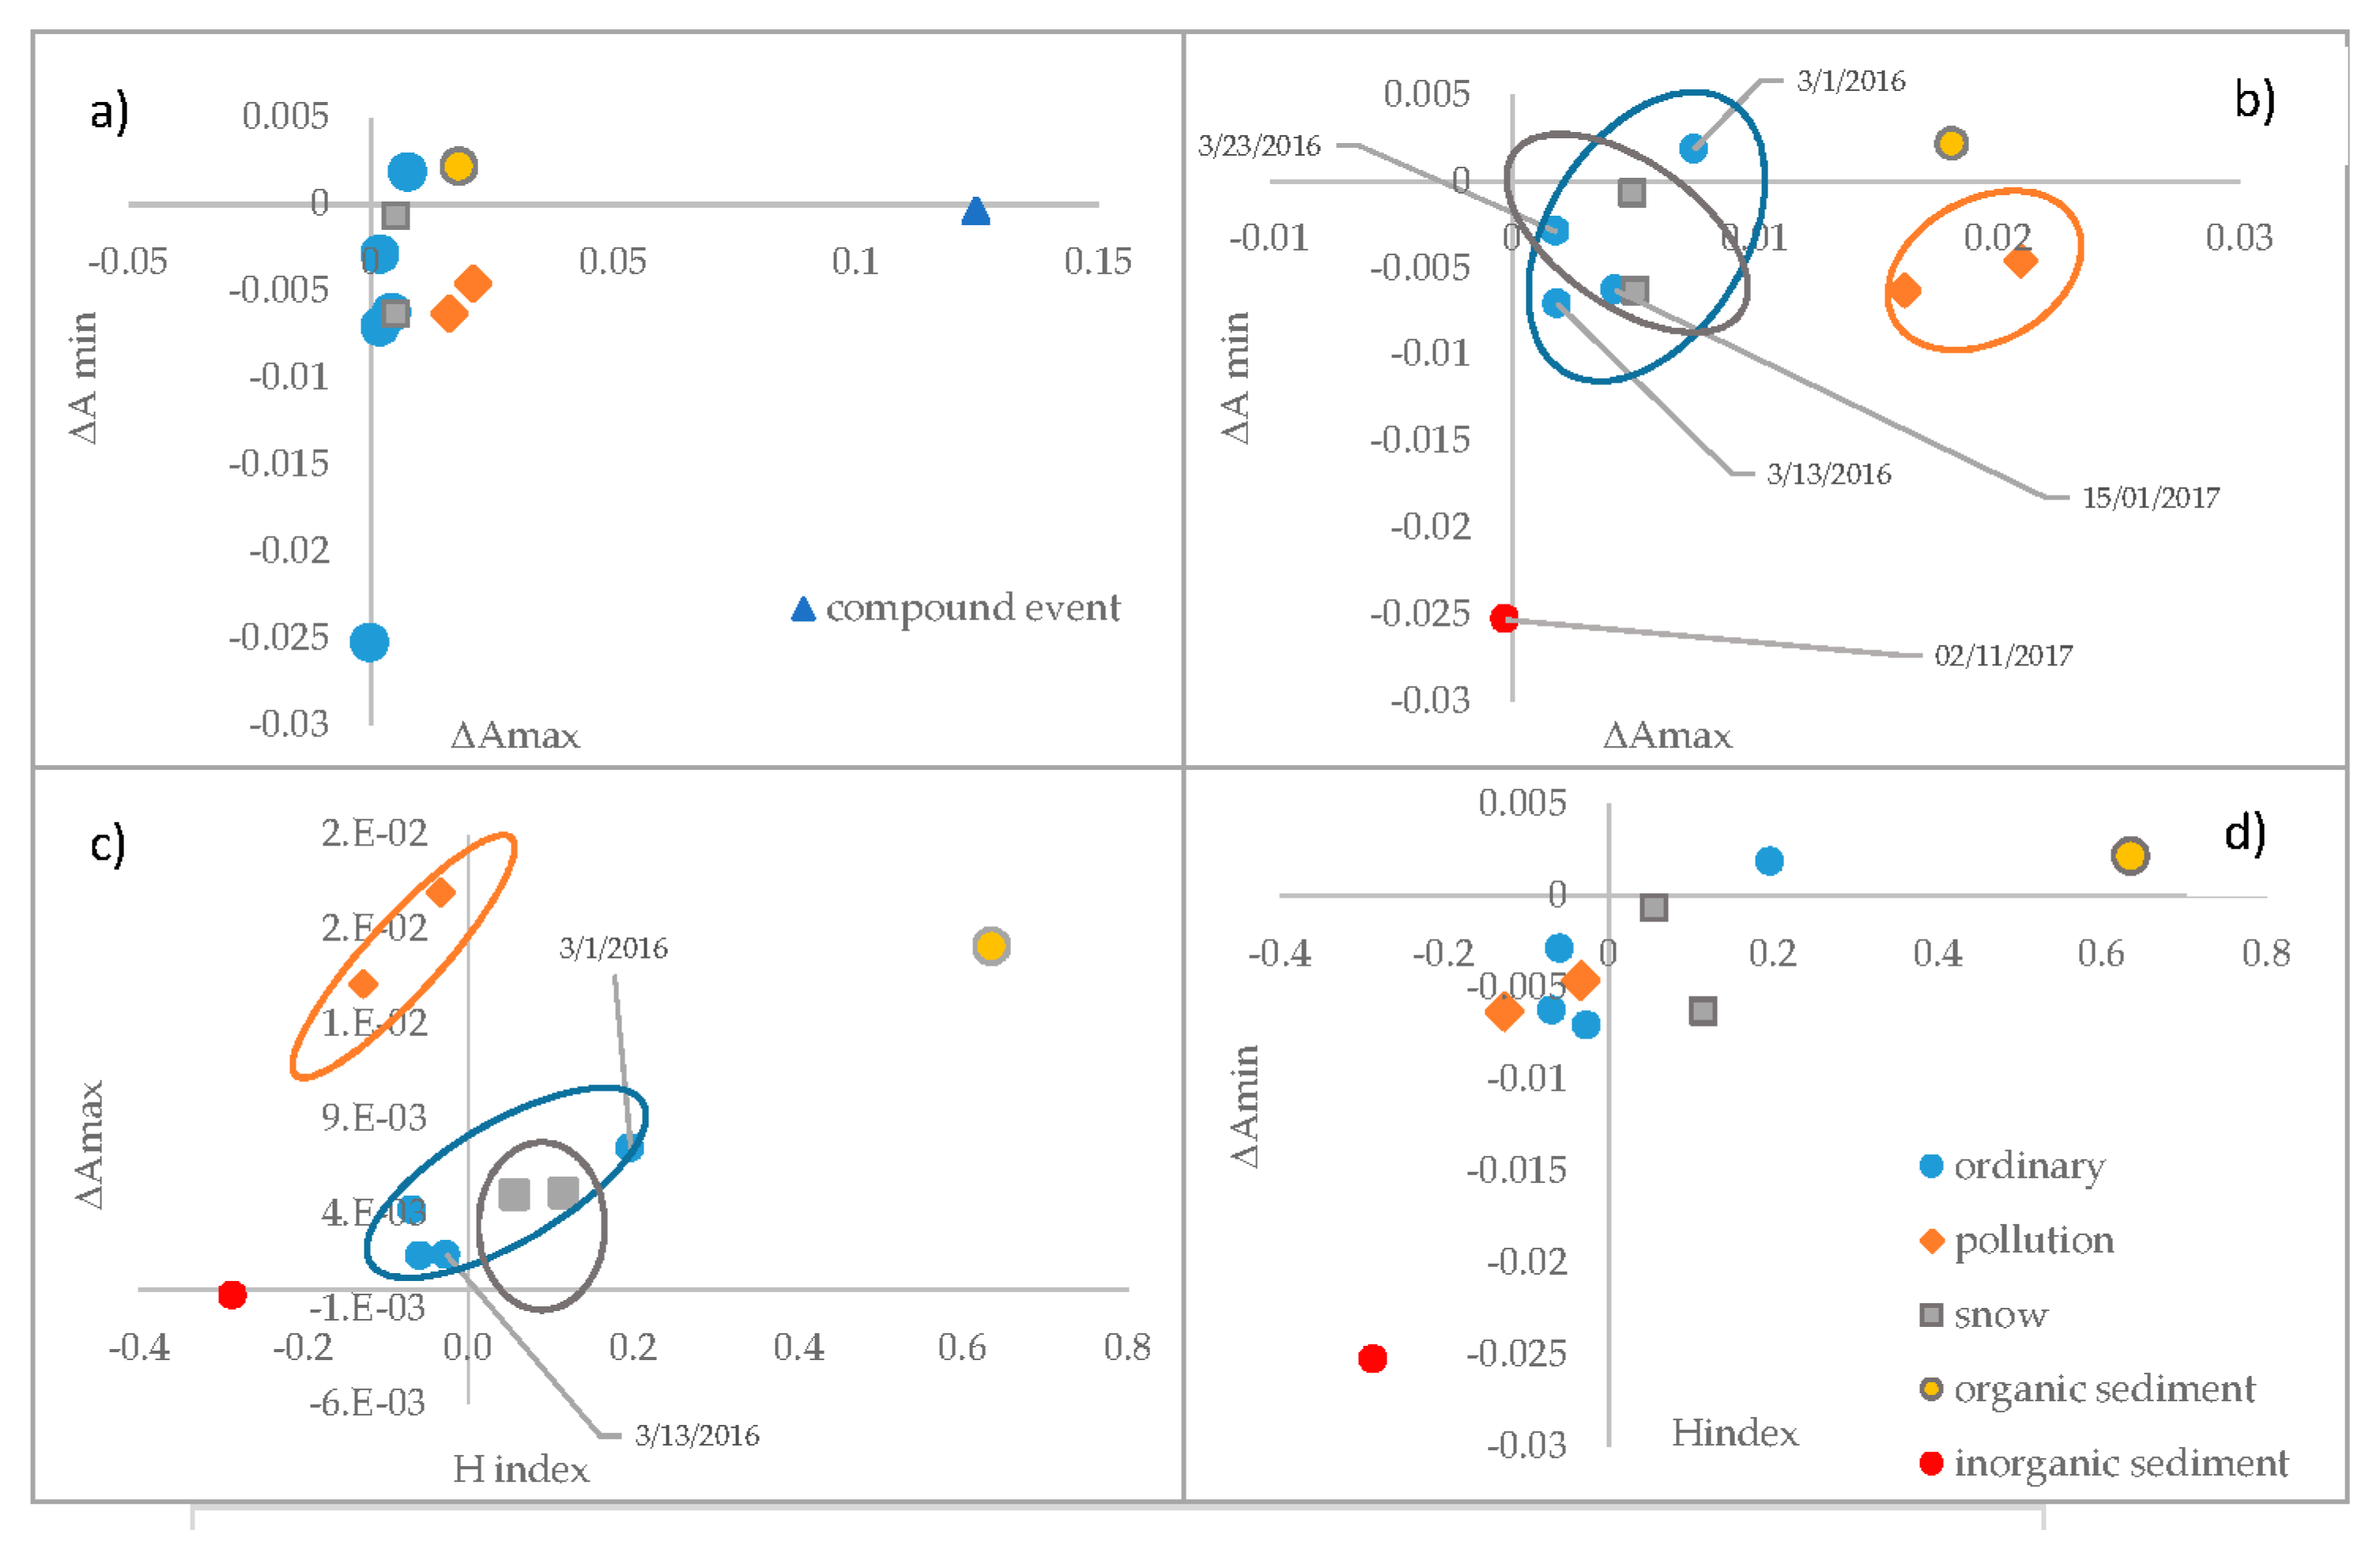
Plotting the resulted indexes of Table 4 in pairs, we found a clear isolated behavior for the compound event (Figure 14a), with parameter values that were quite different from the other events. In Figure 14b–d, we omitted the compound event to improve the readability of the graphs.
Figure 14b,c shows a clear independent group of pollution events, but an overlap appeared between the snow and ordinary events that happened when the catchment was saturated and the sub-surface flow was the main runoff mechanism from the hollow and headwaters. A well-identified organic and inorganic sediment appears in the Figure 10c, plotting h versus ΔAmax, while, in the graph of ΔAmax versus ΔAmin (Figure 14b), the values of the organic sediment are comparable with the pollution ones, excepting for the sign. Figure 14d does not give more information regarding the similarities among the estimated parameters h index vs. ΔAmin.

5. Conclusions

In the current study, we presented a hydro-geomorphologic characterization of a Mediterranean headwater catchment by using a high frequency hydro-chemical dataset and a specific hydro-geomorphologic monitoring system. The combined GIS based geomorphometric characterization of the catchment and the hydrologic analysis in term of the hydro-chemograph and Q-EC hysteretic analysis allowed us to define the hydrologic and hydro-geomorphological behavior of the catchment. To this aim, we used the synoptic daily chart proposed in [8], allowing us to further identify runoff mechanisms at the event scale. The daily-chart proposed characteristic curves for the runoff mechanism identification on the base of a daily Q-EC dataset. The analysis results showed how four types of hydrologic event occurred on the catchment: the ordinary events and three affected events influenced by anthropic input, snow melting or organic sediment transfer. The so-called affected events were well identified in the hydro-chemograph because, during the dilution phase, the discharge was positively correlated to the river water conductivity and the data lay outside the daily chart. The ordinary events, instead, respected the natural Q-EC negative relation, typical of natural phenomena, and, for these cases, the dataset completely contained in the limit of the daily boundary curves.
In addition, the Q-EC hysteretic loop analysis, performed on the affected and natural events, validated and supported the results obtained on the chart applications and on the hydro-chemograph analysis. In particular, the h index of [25] was able to correctly identify all major hysteresis classes. The h index was applicable to the datasets where the dependent variable decreased during the event or when the dependent variable remained constant at the start of the event. The analyzed data, collected at the outlet of the reference catchment, presented all the conditions required for the h index application. The authors verified its ability to characterize the affected events, especially for that events with the EC value typical of the subsurface flow as for the organic and inorganic sediment events and snow events. In respect to previous studies based on the hydro-chemograph only, these events could not distinguish between them. The hysteretic analysis of the events allowed to further distinguish them.
Each type of event was associated with a well-specified pattern of the ΔA variation with respect to the variable u(t). This analysis, performed on paired indexes gave a clear isolated behavior for the compound event (ΔAmax vs. ΔAmin), with parameter values quite different from the other events. Our analysis also identified the independent pollution events group; however, an overlap appeared between the snow and ordinary events in the ΔAmax vs. ΔAmin and ΔAmax vs. h index. This overlapping is due to the chemical nature of the snow melting that has an EC signature typical of the subsurface flow. It is possible to discriminate the two event types comparing their Q-EC patterns and hysteretic loops.
These results are in accordance with the studies on hydro-chemical pattern analysis and the daily chart, giving support toward better understanding the main mechanisms occurring and the origins of these events on the catchment. The given results obtained, it is expected in future research studies to implement the procedure on other affect events, especially shallow landslides events.
In addition, the employment of the hydro-chemograph analytical curves, even if obtained by a daily Q-EC dataset, resulted as an objective method for event type identification before any analytical studies—an easy guide for the runoff type and anomaly identification and a powerful tool for the analysis on long-term time series analysis. The hysteretic indexes, instead, were used here for the best characterization of the event types, and would be a helpful tool for the hydrologic behavior comparison among basins at different temporal and spatial scales.
Therefore, the combination analysis performed here on a dataset collected using a hydro-geomorphologic monitoring system and the derived results allowed for a geo-hydrologic behavior interpretation of the catchment for the wet and dry seasons in terms of a perceptual model.
Ultimately, this study, based on the integrated and interdisciplinary approach and a pecific hydro-geomorphologic monitoring system, resulted parsimonious in cost, simple in management and effective in scientific results. The scientific strategy used in the present research could be an experimental “prototype”, matching with one of the principal criteria suggested by the Biosphere 2 Program [3] for rural and protected areas, designated by UNESCO as Man and Biosphere Reserves. Following this suggestion, more experimental catchments which are representative in hydrology, geomorphology and geology with a size range of 1 to 10 km2, are being studied by using the above described monitoring system and analysis procedure. Clearly, the Q-EC-based hydrograph analysis must be based on a well-defined hydro-geomorphological identification (object-based) of the source areas and flow paths.

Author Contributions

Conceptualization, A.C. and A.L.; validation, D.G. and P.V.; writing—original draft preparation, A.C.; supervision, A.L. All authors have read and agreed to the published version of the manuscript.

Funding

The research was founded by the University Research Annual Founding (FARB) GUIDA2017 and 2018, by financial contributions of the C. U. G. RI. (InterUniversitary Consortium, denoted as the Research Center for the prevention of Great Risks.

Acknowledgments

The authors are very grateful to Lovisi Pasqualino for field measurements. Thanks to ing. Biafore for the rainfall data from the Campania region Monitoring System.

Conflicts of Interest

The authors declare no conflict of interest.

References

  1. Aich, V.; Zimmermann, A.; Elsenbeer, H. Quantification and interpretation of suspended-sediment discharge hysteresis patterns: How much data do we need? CATENA 2014, 122, 120–129. [Google Scholar] [CrossRef]
  2. Bouleau, G.; Pont, D. Did you say reference conditions? Ecological and socio-economic perspectives on the European Water Framework Directive. Environ. Sci. Policy 2015, 47, 32–41. [Google Scholar] [CrossRef] [Green Version]
  3. Hopp, L.; Harman, C.; Desilets, S.L.E.; Graham, C.B.; McDonnell, J.J.; Troch, P.A. Hillslope hydrology under glass: Confronting fundamental questions of soil-water-biota co-evolution at Biosphere 2. Hydrol. Earth Syst. Sci. 2009, 13, 2105–2118. [Google Scholar] [CrossRef] [Green Version]
  4. Guida, D.; Cuomo, A.; Palmieri, V. Using object-based geomorphometry for hydro-geomorphological analysis in a Mediterranean research catchment. Hydrol. Earth Syst. Sci. 2016, 20, 3493–3509. [Google Scholar] [CrossRef] [Green Version]
  5. Bovolin, V.; Cuomo, A.; Guida, D. Monitoring Activity at the Middle Bussento Karst System (Cilento Geopark, Southern Italy). In Engineering Geology for Society and Territory; Springer: Cham, Switzerland, 2016; Volume 3, pp. 275–279. [Google Scholar]
  6. Guida, D.; Longobardi, A.; Villani, P.; Cuomo, A. Hydrological modelling for river basin management in a highly hydro-geological conditioned environment. WIT Trans. Ecol. Environ. 2006, 10, 283–292. [Google Scholar] [CrossRef] [Green Version]
  7. Guida, D.; Cuomo, A. Using discharge-electrical conductivity relationship in a Mediterranean catchment: The T. Ciciriello in the Cilento, Vallo Diano and Alburni European Geopark (Southern Italy). In Engineering Geology for Society and Territory; Springer: Cham, Switzerland, 2015; pp. 201–205. [Google Scholar]
  8. Cuomo, A.; Guida, D. Using hydro-chemograph analyses to reveal runoff generation processes in a Mediterranean catchment. Hydrol. Process. 2016, 30, 4462–4476. [Google Scholar] [CrossRef]
  9. Guida, D. The contribution of the geo-scientific community to risk, resource and chance management, education and dissemination in the Cilento, Vallo Diano and Alburni - Geopark (Southern Italy). In Proceedings of the 12th European Geoparks Conference National Park of Cilento, Vallo di Diano and Alburni Geopark, Italy, 4–6 September 2013; pp. 30–32. [Google Scholar]
  10. Longobardi, A.; Guida, D.; Cuomo, A.; Villani, P. At which time step do we need to monitor the stream hydro-chemistry properties for low flow characterization? Rend. Online Della Soc. Geol. Ital. 2015, 35, 3. [Google Scholar] [CrossRef]
  11. Longobardi, A.; Villani, P.; Guida, D.; Cuomo, A. Hydro-geo-chemical streamflow analysis as a support for digital hydrograph filtering in a small, rainfall dominated, sandstone watershed. J. Hydrol. 2016, 539, 177–187. [Google Scholar] [CrossRef]
  12. Longobardi, A.; Villani, P.; Guida, D.; Cuomo, A. Regression Approaches for Hydrograph Separation: Implications for the Use of Discontinuous Electrical Conductivity Data. Water 2018, 10, 1235. [Google Scholar] [CrossRef] [Green Version]
  13. Betson, R.P. What is watershed runoff? J. Geophys. Res. 1964, 69, 1541–1551. [Google Scholar] [CrossRef]
  14. Ladouche, B.; Probst, A.; Viville, D.; Idir, S.; BaqueÂ, D.; Loubet, M.; Probst, J.-L.; Bariac, T. Hydrograph separation using isotopic, chemical and hydrological approaches (Strengbach catchment, France). J. Hydrol. 2001, 242, 255–274. [Google Scholar] [CrossRef]
  15. Klaus, J.; McDonnell, J.J. Reviewe paper: Hydrograph separation using stable isotopes: Review and evaluation. J. Hydrol. 2013, 505, 47–64. [Google Scholar] [CrossRef]
  16. Pellerin, B.; Wollheim, W.; Feng, X.; Charles, J. The application of electrical conductivity as a tracer for hydrograph separation in urban catchments. Hydrol. Process. 2008, 22, 1810–1818. [Google Scholar] [CrossRef]
  17. Stewart, M.; Cimino, J.; Ross, M. Calibration of Base Flow Separation Methods with Streamflow Conductivity. Ground Water 2007, 45, 17–27. [Google Scholar] [CrossRef]
  18. Lott, D.A.; Stewart, M.T. A Power Function Method for Estimating BaseFlow. Groundwater 2013, 51, 442–451. [Google Scholar]
  19. Zhang, R.L.Q.; Chow, T.L.L.S.; Danielescu, S. Baseflow separation in a small watershed in New Brunswick Canada, using a recursive digital filter calibrated with the conductivity mass balance method. Hydrol. Process. 2013, 27, 2659–2665. [Google Scholar] [CrossRef]
  20. Genereux, D. Quantifying uncertainty in tracer-based hydrograph separations. Water Resour. Res. 1998, 34, 915–919. [Google Scholar] [CrossRef]
  21. Sklash, M.; Farvolden, R. Role of groundwater in storm runoff. J. Hydrol. 1979, 43, 45–65. [Google Scholar] [CrossRef]
  22. Penna, D.; van Meervelt, H.J.; Oliviero, O.; Zuecco, G.; Assendelft, R.S.; Dalla Fontana, G.; Borga, M. Seasonal changes in runoff generation in a small forested mountain catchment. Hydrol. Process. 2014, 29, 2027–2042. [Google Scholar] [CrossRef]
  23. Montgomery, J.L.; Harmon, T.; Haas, C.N.; Hooper, R.; Clesceri, N.L.; Graham, W.; Kaiser, W.; Sanderson, A.; Minsker, B.; Schnoor, J.; et al. The WATERS Network: An Integrated Environmental Observatory Network for Water Research. Environ. Sci. Technol. 2007, 41, 6642–6647. [Google Scholar] [CrossRef] [Green Version]
  24. Bowes, M.J.; Jarvie, H.P.; Halliday, S.J.; Skeffington, R.A.; Wade, A.J.; Loewenthal, M.; Gozzard, E.; Newman, J.R.; Palmer-Felgate, E.J. Characterising phosphorus and nitrate inputs to a rural river using high-frequency concentration-flow relationships. Sci. Total Environ. 2015, 511, 608–620. [Google Scholar] [CrossRef] [Green Version]
  25. Zuecco, G.; Penna, D.; Borga, M.; van Meerveld, H.J. A versatile index to characterize hysteresis between hydrological variables at the runoff event timescale. Hydrol. Process. 2016, 30, 1449–1466. [Google Scholar] [CrossRef] [Green Version]
  26. Murphy, J.C.; Hornberger, G.M.; Liddle, R.G. Concentration–discharge relationships in the coal mined region of the New River basin and Indian Fork sub-basin, Tennessee, USA. Hydrol. Process. 2014, 28, 718–728. [Google Scholar] [CrossRef]
  27. Shanley, J.B.; Sebestyen, S.D.; McDonnell, J.J.; McGlynn, B.L.; Dunne, T. Water’s Way at Sleepers River watershed – revisiting flow generation in a post-glacial landscape, Vermont USA. Hydrol. Process. 2015, 29, 3447–3459. [Google Scholar] [CrossRef] [Green Version]
  28. McGuire, K.J.; McDonnell, J.J. Hydrological connectivity of hillslopes and streams: Characteristic time scales and nonlinearities. Water Resour. Res. 2010, 46, 1–17. [Google Scholar] [CrossRef] [Green Version]
  29. Fovet, O.; Ruiz, L.; Hrachowitz, M.; Faucheux, M.; Gascuel-Odoux, C. Hydrological hysteresis and its value for assessing process consistency in catchment conceptual models. Hydrol. Earth Syst. Sci. 2015, 19, 105–123. [Google Scholar] [CrossRef]
  30. Zhang, Q.; Manzoni, S.; Katul, G.; Porporato, A.; Yang, D. The hysteretic evapotranspiration—Vapor pressure deficit relation. J. Geophys. Res. Biogeosci. 2014, 119, 125–140. [Google Scholar] [CrossRef]
  31. Zheng, H.; Wang, Q.; Zhu, X.; Li, Y.; Yu, G. Hysteresis Responses of Evapotranspiration to Meteorological Factors at a Diel Timescale: Patterns and Causes. PLoS ONE 2014, 9, e98857. [Google Scholar] [CrossRef]
  32. Allocca, V.; Manna, F.; De Vita, P. Estimating annual groundwater recharge coefficient for karst aquifers of the southern Apennines (Italy). Hydrol. Earth Syst. Sci. 2014, 18, 803–817. [Google Scholar] [CrossRef] [Green Version]
  33. Celico, P.; De Vita, P.; Aloia, A. Caratterizzazione idrogeologica della Formazione di Monte Sacro (Cilento- Campania meridionale). Geologia Applicata e Idrogeologia 1993, XXVIII, 243–252. [Google Scholar]
  34. Celico, P. Prospezioni Idrogeologiche; Liguori editore: Napoli, Italy, 1986. [Google Scholar]
  35. Bonardi, G.; Amore, F.O.; Ciampo, G.; De Capoa, P.; Miconnet, P.; Perrone, V. Il complesso liguride Auct.: Stato delle conoscenze e problemi sualla sua evoluzione Pre-Appenninica ed i suoi rapporti con l’arco calabro. Mem. Soc. Geol. Ital. 1988, 41, 17–35. [Google Scholar]
  36. Guida, D.; Guida, M.; Luise, D.; Salzano, G.; Vallario, A. Idrogeologia del Cilento (Campania). Geol. Rom 1980, 19, 349–369. [Google Scholar]
  37. Cascini, L.; Cuomo, S.; Guida, D. Typical source areas of May 1998 flow-like mass movements in the Campania region, Southern Italy. Eng. Geol. 2008, 96, 107–125. [Google Scholar] [CrossRef]
  38. Cuomo, A. Il contributo Della Idro-Geomorfologia Nella Valutazione Delle Piene in Campania; University of Salerno: Fisciano, Italy, 2012. [Google Scholar]
  39. Hewlett, J.D.; Hibbert, A.R. Factors affecting the response of small forested watersheds to precipitation in humid regions. In Proceedings of the International symposium on Forest Hydrology, New York, NY, USA, 29 August–10 September 1965; pp. 275–290. [Google Scholar]
  40. Sidle, R.C.; Tsuboyama, Y.; Noguchi, S.; Hosoda, I.; Motohisa, F.; Shimuizu, T. Stormflow generation in steep forested headwater: A linked hydrogeomorphic paradigm. Hydrol. Process. 2000, 14, 369–385. [Google Scholar] [CrossRef]
  41. Burrough, P.A. Principles of geographical information systems for land resources assessment. Geocarto Int. 1986, 1, 54. [Google Scholar] [CrossRef]
  42. Horton, R. Drainage Basin Characteristics. Trans. Am. Geophys. Union 1932, 13, 11. [Google Scholar] [CrossRef]
  43. Leopold, L.B.; Wolman, M.G.; Miller, J.P. Fluvial processes in geomorphology: San Francisco; W.H. Freeman and Co: San Francisco, CA, USA, 1964. [Google Scholar]
  44. Moore, I.D.; Gessler, P.; Nielsen, G.A.E.; Peterson, G. Soil Attribute Prediction Using Terrain Analysis. Soil Sci. Soc. Am. J.—SSSAJ 1993, 57, 443–452. [Google Scholar] [CrossRef]
  45. Schmidt, F.; Persson, A. Comparison of DEM Data Capture and Topographic Wetness Indices. Precis. Agric. 2003, 4, 179–192. [Google Scholar] [CrossRef]
  46. Gallant, J.C.; Wilson, J.P. Primary topographic attributes. In Terrain Analysis: Principles and Applications; Gallant, J.C., Wilson, J.P., Eds.; Wiley: New York, NY, USA, 2000; p. 34. [Google Scholar]
  47. Strahler, A. Quantitative Geomorphology of Drainage Basins and Channel Networks. In Handbook of Applied Hydrology; Chow, V., Ed.; McGraw Hill: New York, NY, USA, 1964; p. 36. [Google Scholar]
  48. Liu, F.; Conklin, M.H.; Shaw, G.D. Insights into hydrologic and hydrochemical processes based on concentration-discharge and end-member mixing analyses in the mid-Merced River Basin, Sierra Nevada, California. Water Resour. Res. 2017, 53, 832–850. [Google Scholar] [CrossRef]
  49. Lloyd, C.E.M.; Freer, J.E.; Johnes, P.J.; Collins, A.L. Using hysteresis analysis of high-resolution water quality monitoring data, including uncertainty, to infer controls on nutrient and sediment transfer in catchments. Sci. Total Environ. 2016, 543, 388–404. [Google Scholar] [CrossRef] [Green Version]
  50. Chang, M. Forest Hydrology: An Introduction to Water and Forests, 2nd ed.; Taylor & Francis: Abingdon, UK, 2006. [Google Scholar]
  51. Langlois, J.; Johnson, D.; Mehuys, G. Suspended sediment dynamics associated with snowmelt runoff in a small mountain stream of Lake Tahoe (Nevada). Hydrol. Process. 2005, 19, 3569–3580. [Google Scholar] [CrossRef]
  52. Lawler, D.M.; Petts, G.E.; Foster, I.D.L.; Harper, S. Turbidity dynamics during spring storm events in an urban headwater river system: The Upper Tame, West Midlands, UK. Sci. Total. Environ. 2006, 360, 109. [Google Scholar] [CrossRef]
  53. Lloyd, C.E.M.; Freer, J.E.; Johnes, P.J.; Collins, A.L. Technical Note: Testing an improved index for analysing storm discharge–concentration hysteresis. Hydrol. Earth Syst. Sci. 2016, 20, 625–632. [Google Scholar] [CrossRef] [Green Version]
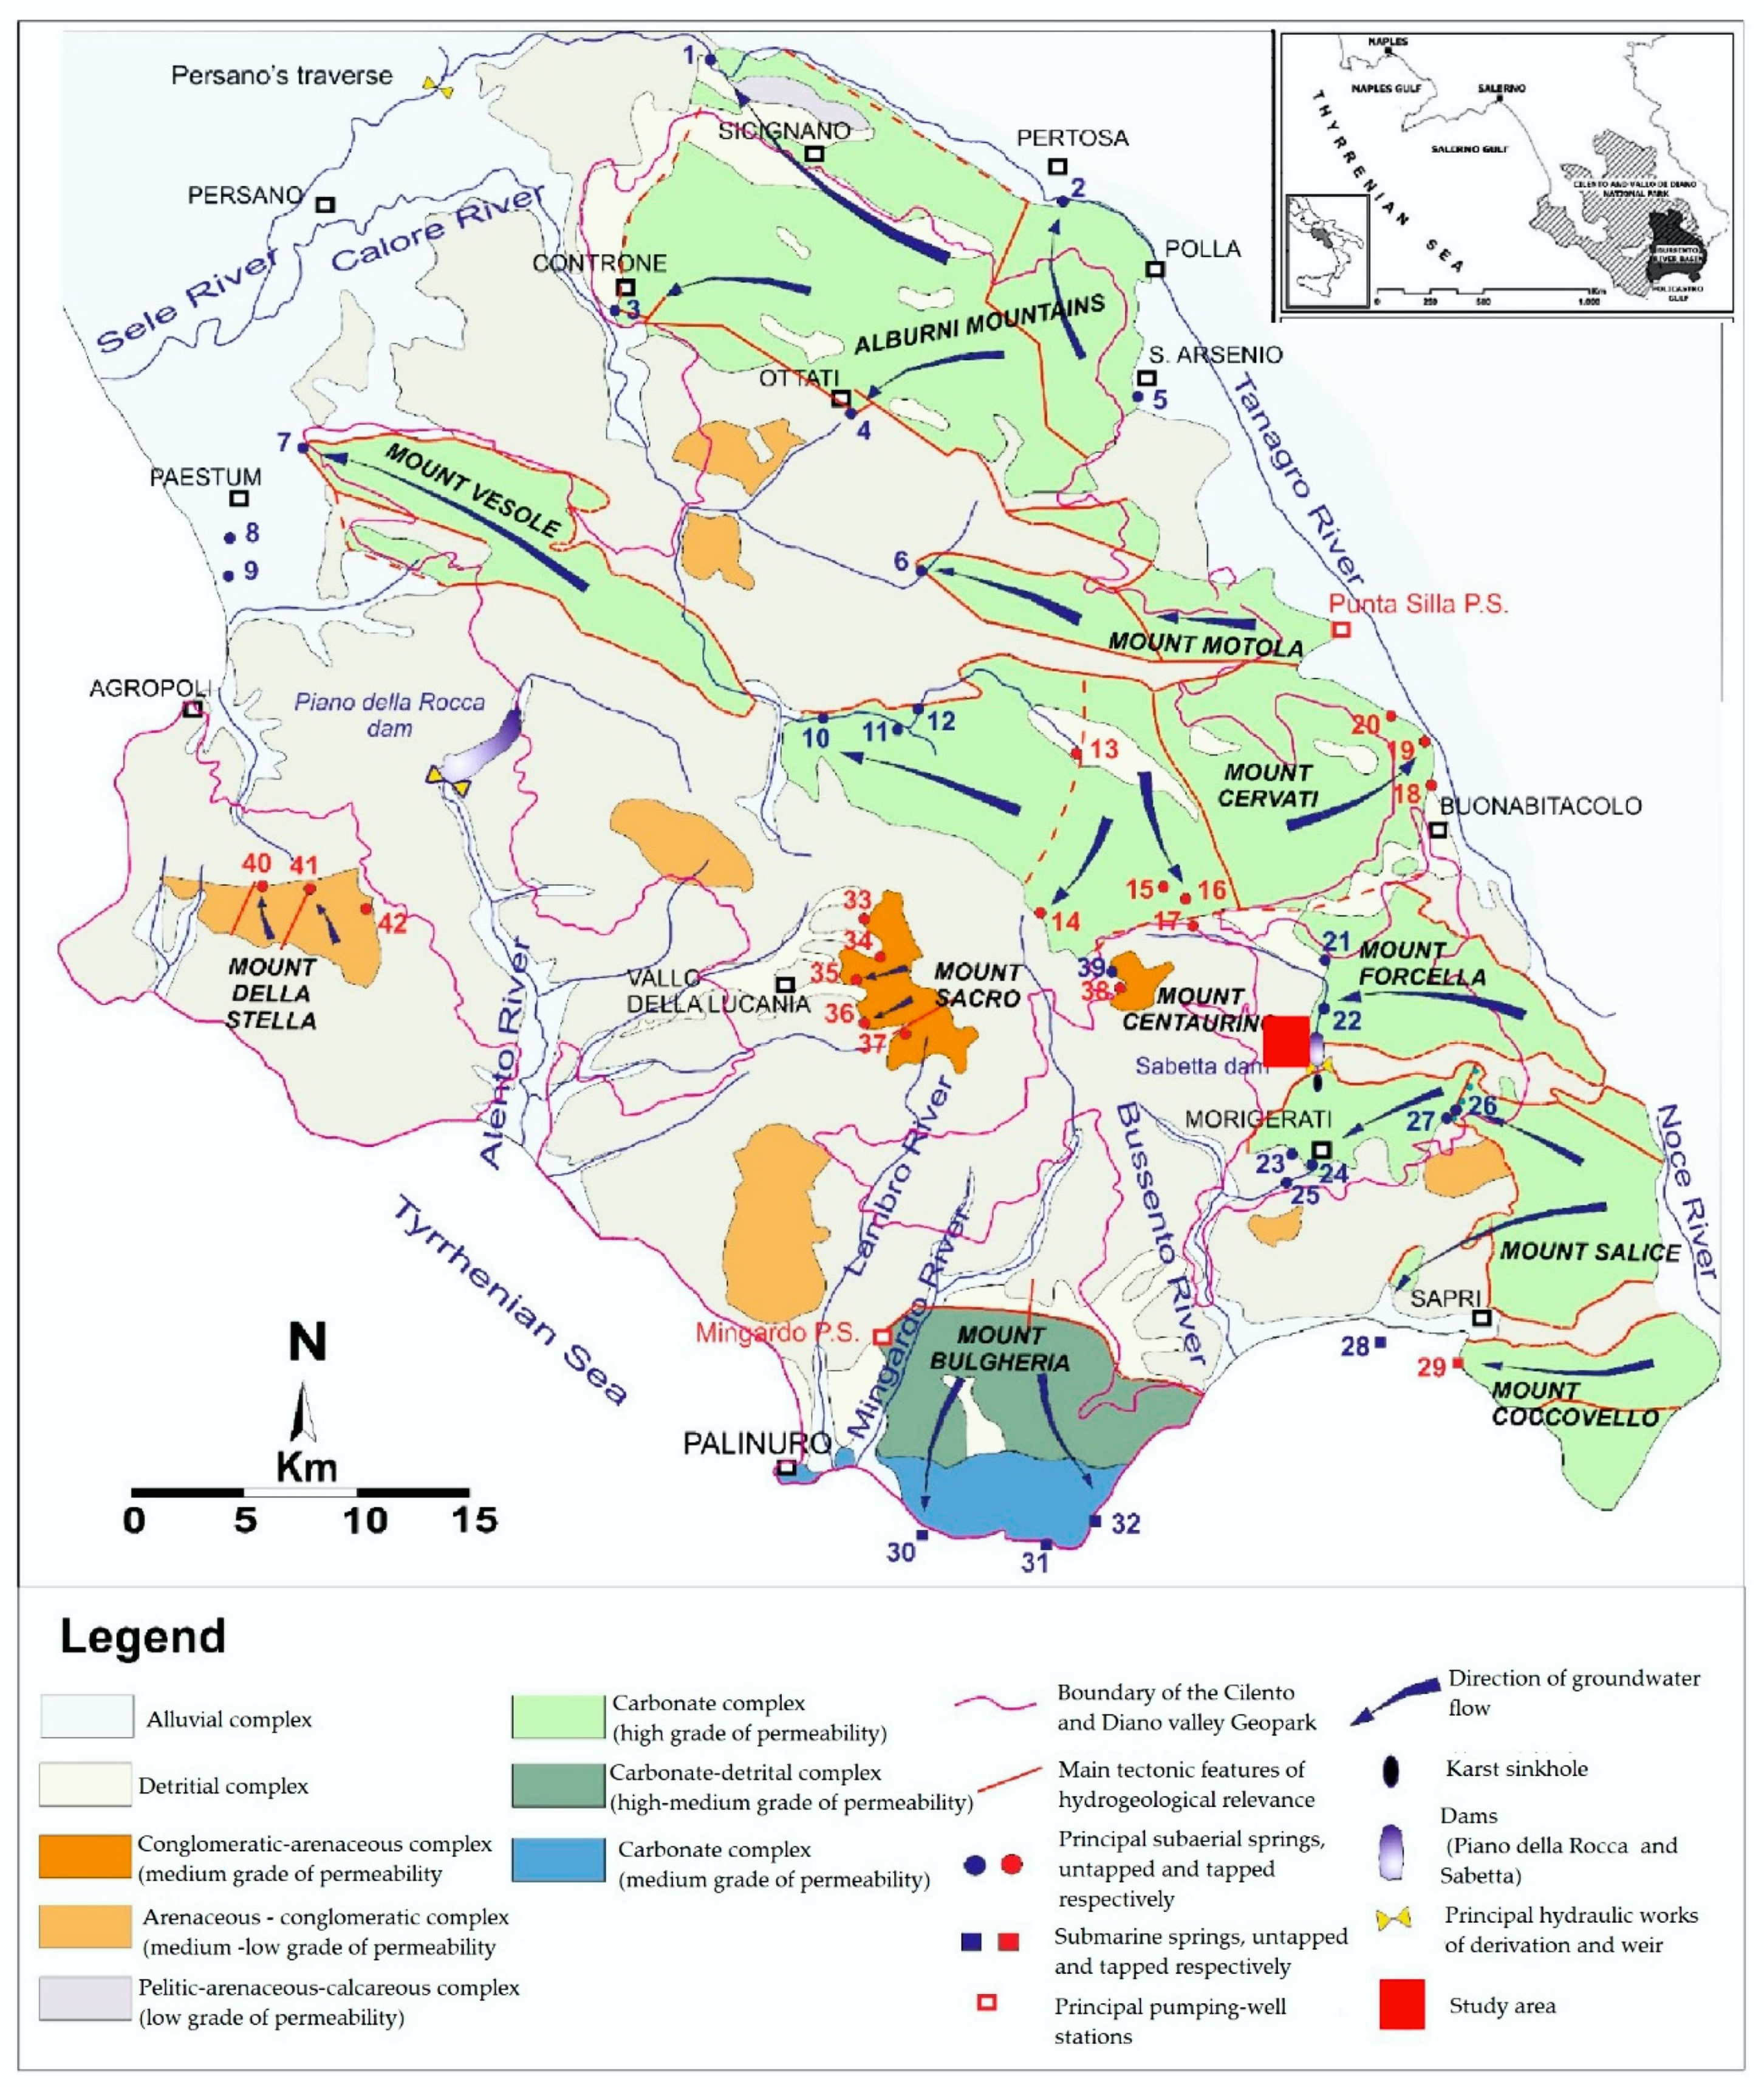
Figure 1. Hydrogeological map of the UNESCO Cilento Global Geopark (red square indicates the Ciciriello catchment location).
Applsci 10 04117 g001
Figure 2. Ciciriello Mediterranean experimental catchment (modified from [4]). (a) Upper right inset: geographical location of the Bussento river basin; (b) left inset: schematic geological map, hydro-structural features and location of the monitoring stations; (c) lower inset: A–B: geological cross-section trace. Bedrock lithology; Ma: Tertiary marly–clayey and argillite (Upper Saraceno formation—North Calabrian Unit), base aquiclude; Ss: sandstone (Albidona–San Mauro formation—Cilento Group), fractured and weathered local aquifer; Mf: Miocene marly–limestone (Fogliarina marls member), interlayered and confined fractured local aquifer; (d) geological cross section: see (c) above for geological legend; Small triangle: main spring; dashed blue arrows: groundwater direction.
Applsci 10 04117 g002
Figure 3. Expert-based hydro-geomorphological map of the catchment depicting the morphological units significant as hydro-geomorphotypes. In black, the hydrogeological features are as in Figure 2, and arrows represent the surveyed sub-surface flow.
Applsci 10 04117 g003
Figure 4. High-frequency (5 min) discharge (Q)—electrical conductivity (EC) dataset, collected at the outlet catchment (blue line: Q; green line: EC).
Applsci 10 04117 g004
Figure 5. Basic derived maps from the digital elevation model (DEM) with a 5 m cell size. (a) Extracted DEM 5 × 5 m; (b) Difference map between DEM and Filled DEM; (c) Slope; (d) Flow direction; (e) Flow accumulation; (f) Stream network; (g) Stream order; (h) Wetness Index (WI); and (i) Topographic Position Index (TPI) (classes: 1: incised stream; 2: midslope drainages, shallow valley; 3: upland drainages, headwater; 4: U-shaped valley; 5: plains; 6: open slopes; 7: upper slopes, mesas; 8: local ridges/hills in valleys; 9: midslope ridges, small hills in plains; and 10: mountain tops, high ridges).
Applsci 10 04117 g005
Figure 6. Elevation map classification derived by the Regional Technical Map (CTR) (a), frequency distribution on the un-classified elevation map on the catchment (b) and on the left (b1) and right side of the catchment (b2). Frequency distribution on the classified elevation map (c) and on the left (c1) and right side of the catchment (c2).
Applsci 10 04117 g006
Figure 7. Slope map classification (CTR: Regional Technical Map) (a), frequency distribution on the un-classified slope map on the catchment (b) and on the left (b1) and right side of the catchment (b2). Frequency distribution on the classified slope map (c) and on the left (c1) and right side of the catchment (c2).
Applsci 10 04117 g007
Figure 8. Hydrographical network of the Ciciriello catchment. Strahler order (a), stream order frequency distribution on the whole catchment and on the left and right valley (b) and stream order frequencies on the whole catchment (c).
Applsci 10 04117 g008
Figure 9. Classified Wetness Index (WI) map of the Ciciriello catchment (a), frequency distribution on the un-classified WI map on the whole catchment (b), on the left (b1) and right side of it (b2). Frequency distribution of the classified WI map performed on the whole catchment (c), on the left (c1) and right side of the catchment (c2).
Applsci 10 04117 g009
Figure 10. (a)Topographic position Index (TPI) for the Ciciriello catchment; (b) frequency distribution of values on the unclassified map (1: incised stream; 2: midslope drainages, shallow valley; 3: upland drainages, headwater; 4: U-shaped valley; 5: plains; 6: open slopes, 7: upper slopes, mesas; 8: local ridges/hills in valleys; 9: midslope ridges, small hills in plains; 10: mountain tops, high ridges); (c) frequency distribution on the classified TPI map on the catchment, on the left (d) and right side of the catchment (e).
Applsci 10 04117 g010
Figure 11. Hydro-chemograph, daily chart and hysteretic loop comparison of the selected events. (UH1—upper hyperbolic law 1, describing the Q-EC mixed value of groundwater and groundwater ridging; UH2—upper hyperbolic law 2, describing the Q-EC mixed value of groundwater, groundwater ridging and sub-surface flow; UL3—upper linear curve 3, describing the Q-EC mixed value of groundwater, groundwater ridging, sub-surface flow and direct runoff; LH—lower hyperbolic curve typical of the Q-EC response when direct runoff is suddenly added to the groundwater, following the heavy showers occurring during the dry period; WET-DRY 1 and 2—the hyperbolic curves defining the transition from the dry to wet season (under the curves UH1 and UH2, respectively).
Applsci 10 04117 g011
Figure 12. Hysteretic index results estimated with the formulation of [25]. (a) hysteretic loops of the events; (b) Normalization of the Q and EC parameters; (c) definite integrals Ar[i, j] and Af[i, j] of the functions vr(u) and vf(u) on intervals [i, j] for the rising (r) and the falling (f) curve; (d) differences between the definite integrals on the rising and falling curves computed for the same intervals, [i, j].
Applsci 10 04117 g012
Figure 13. Perceptual model of the Ciciriello catchment.
Applsci 10 04117 g013
Figure 14. Comparisons in pairs of hysteretic indexes to better highlight the presence of events in groups that identify the different types of phenomena. (a) ΔAmax-ΔAmin relation; (b) ΔAmax-ΔAmin relation without a compound event; (c) h index- ΔAmax relation without a compound event; (d) h index- ΔAmin relation without a compound event
Applsci 10 04117 g014
Table 1. Landforms, hydro-geomorphotypes and electrical conductivity ranges (modified from [4]).
Landform, Component or Element Hydro-Geomorphotype (HGT in [38])Hydro-Geomorphological BehaviourStation Type for Sampled Water SourcesTemporal ResolutionEC Range (μS/cm)
Upland, summit, peak, crestRidgeGroundwater recharge on bare bedrock and dominant excess infiltration runoff after storm-Springs
-Control points
-Monthly
-After heaviest storms
250–300
<100
Shoulder, side slopeNoseShallow soil, groundwater recharge area, prevalently excess infiltration runoff-Spring
-Control points
-Monthly
-After heaviest storms
250–300
<100
Scarps, back-slope, foot-slope, wash-slope, talusHillslopeDebris, deep soil, shallow aquifer, excess saturation excess and sub-surficial runoff-Piezometers
-Control points
-Weekly
-After heaviest storms
120–180
Glen, swallet, scarHollowDeep soil, shallow aquifer, prevalently excess saturation, delayed runoff productionHollowMonthly120–180
V-shaped stream, gully, bank, stream bedRiparian corridorShallow soil, groundwater discharge, prevalently sub-surface, delayed return flow and groundwater ridgingPiezometersWeekly-continuously200–220
Table 2. Summary of the monitored points with the collected parameters and time-steps. D: water depth; Q: discharge; EC: electrical conductivity (modified from [8]).
Station Type for Sampled Water SourcesNumberCollected ParametersTemporal ResolutionMode
QDEC
Main1xxxDaily/Sub-hourlyAutomatic
Sub-stations4x xWeeklyManual
Secondary23x xWeeklyManual
Springs13x xMonthlyManual
Hollow16 xxMontlyManual
Weir V-notch 90°16 xxDailySemi-automatic
Piezometers16 xxWeeklyManual
Control points30xxxAfter heavy stormsManual
Table 3. Event types classification.
EventsEvent TypeHydrologic Type Event
16 February 14OrdinaryCompound event
16 March 01OrdinaryOrdinary
16 March 13OrdinarySub-event
16 March 23OrdinaryOrdinary
16 May 20OrdinaryOrdinary
16 September 14Affectedorganic sediment
16 September 22Affectedpollution
16 September 19Affectedpollution
17 January 15Affectedsnow
17 Febbraio 14Affectedsnow
17 November 6AffectedInorganic sediment
Table 4. Hysteretic index results.
EventsEvent typeHindexΔAmaxΔAminDependent Variable
16 February 14compound event0.470.12−0.000377decreases from the initial state
16 March 01ordinary−0.06830.004231−0.006254decreases from the initial state
16 March 13sub-event0.19670.0074890.001843decreases from the initial state
16 March 23ordinary−0.02660.001851−0.007067decreases from the initial state
16 May 20ordinary−0.05880.00179−0.002901decreases from the initial state
16 September 14organic sediment0.63450.0180920.0021387constant from the initial state
16 September 22pollution−0.03420.020928−0.004599constant from the initial state
16 September 19pollution−0.12770.01615−0.006313constant from the initial state
17 January 15snow0.1160.005079−0.006357decreases from the initial state
17 February 14snow0.05130.001395−0.000706constant from the initial state
17 November 6inorganic sediment−0.2861−0.00029−0.025266constant from the initial state