Rainfall Parameters Affecting Splash Erosion under Natural Conditions

 ,
,  ,
,  ,
,  ,
,  and
and
Abstract
Featured Application
Abstract
1. Introduction
2. Materials and Methods
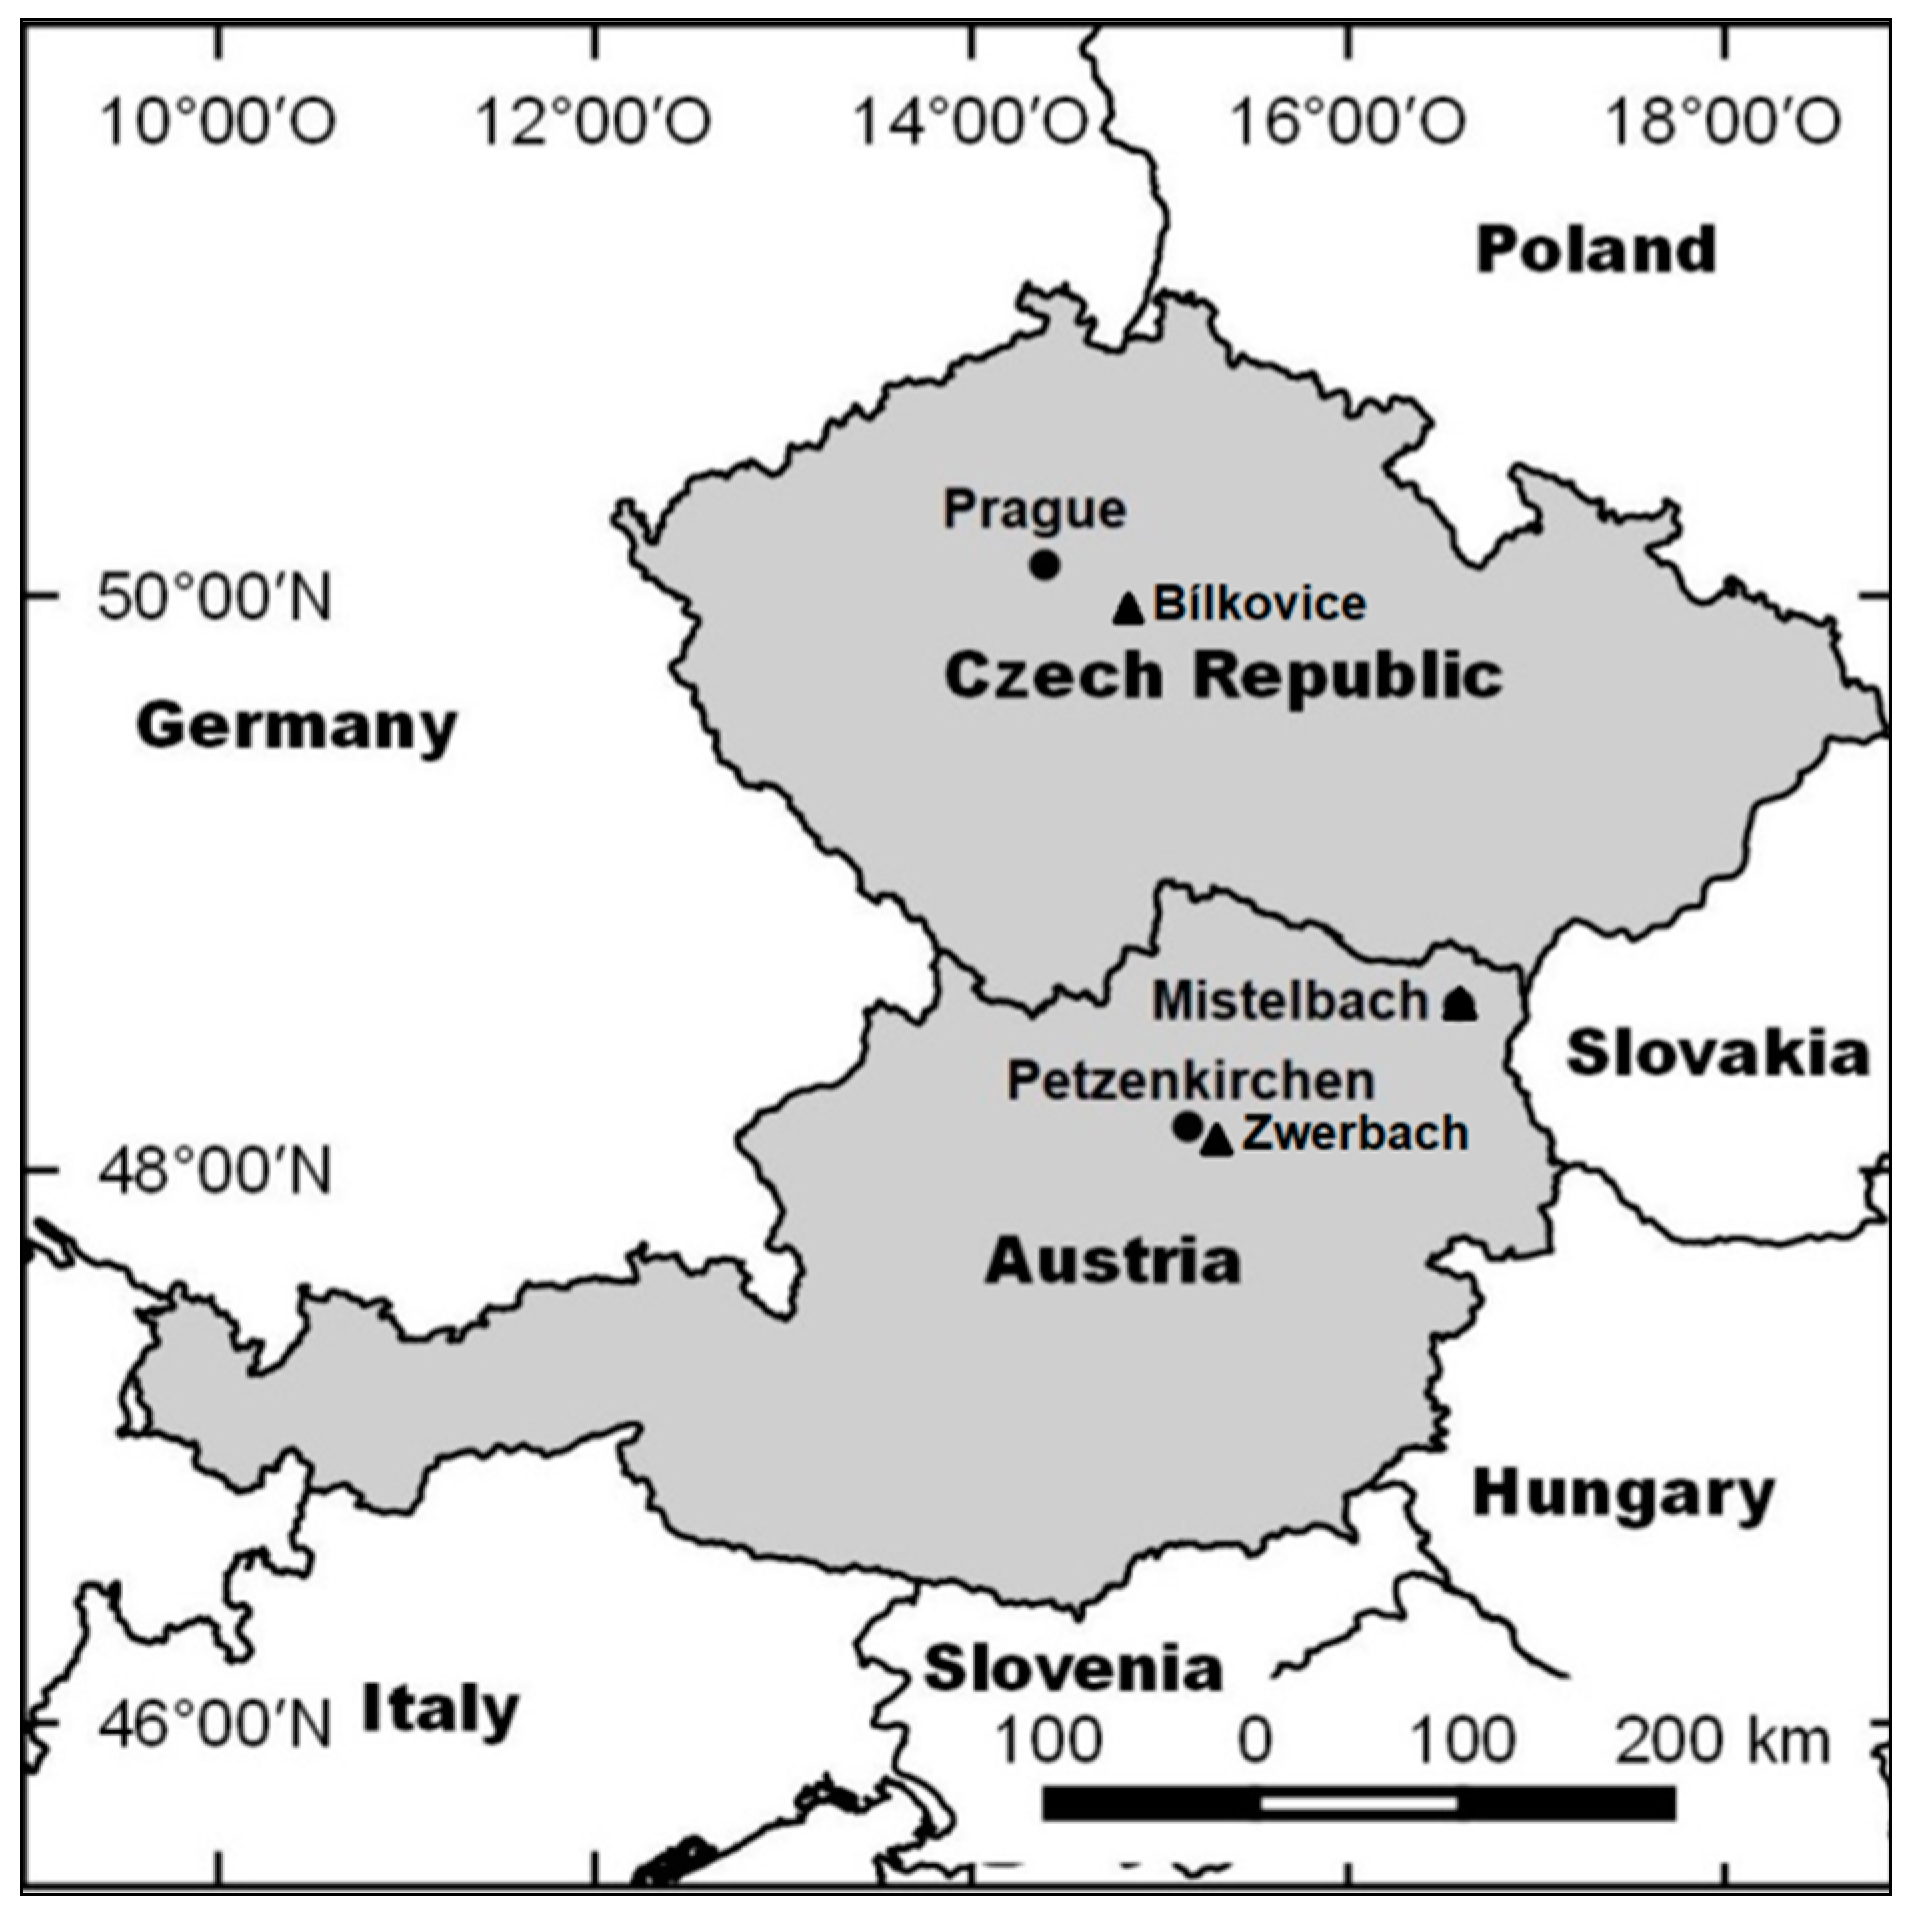
2.1. Study Sites
2.2. Investigated Soils
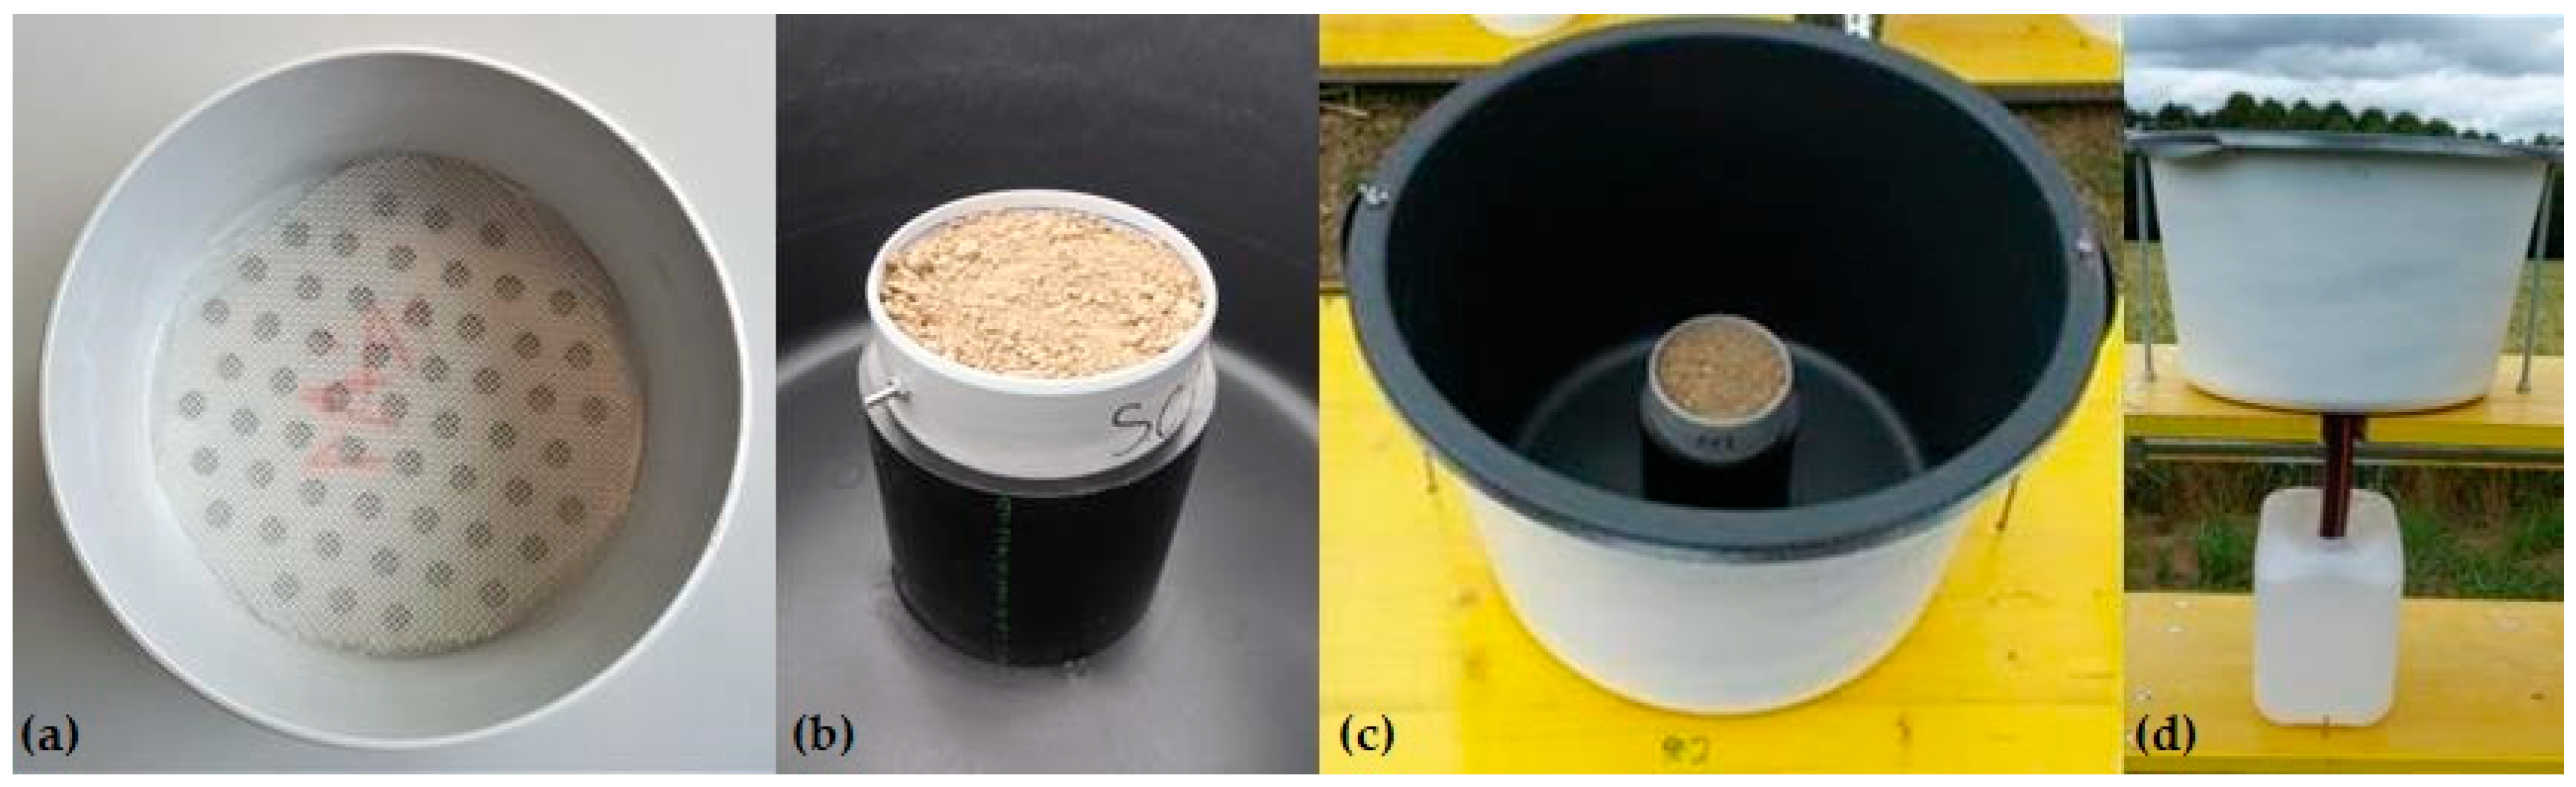
2.3. Splash Erosion Measurements
2.4. Rainfall Parameters
2.5. Data Analysis
3. Results
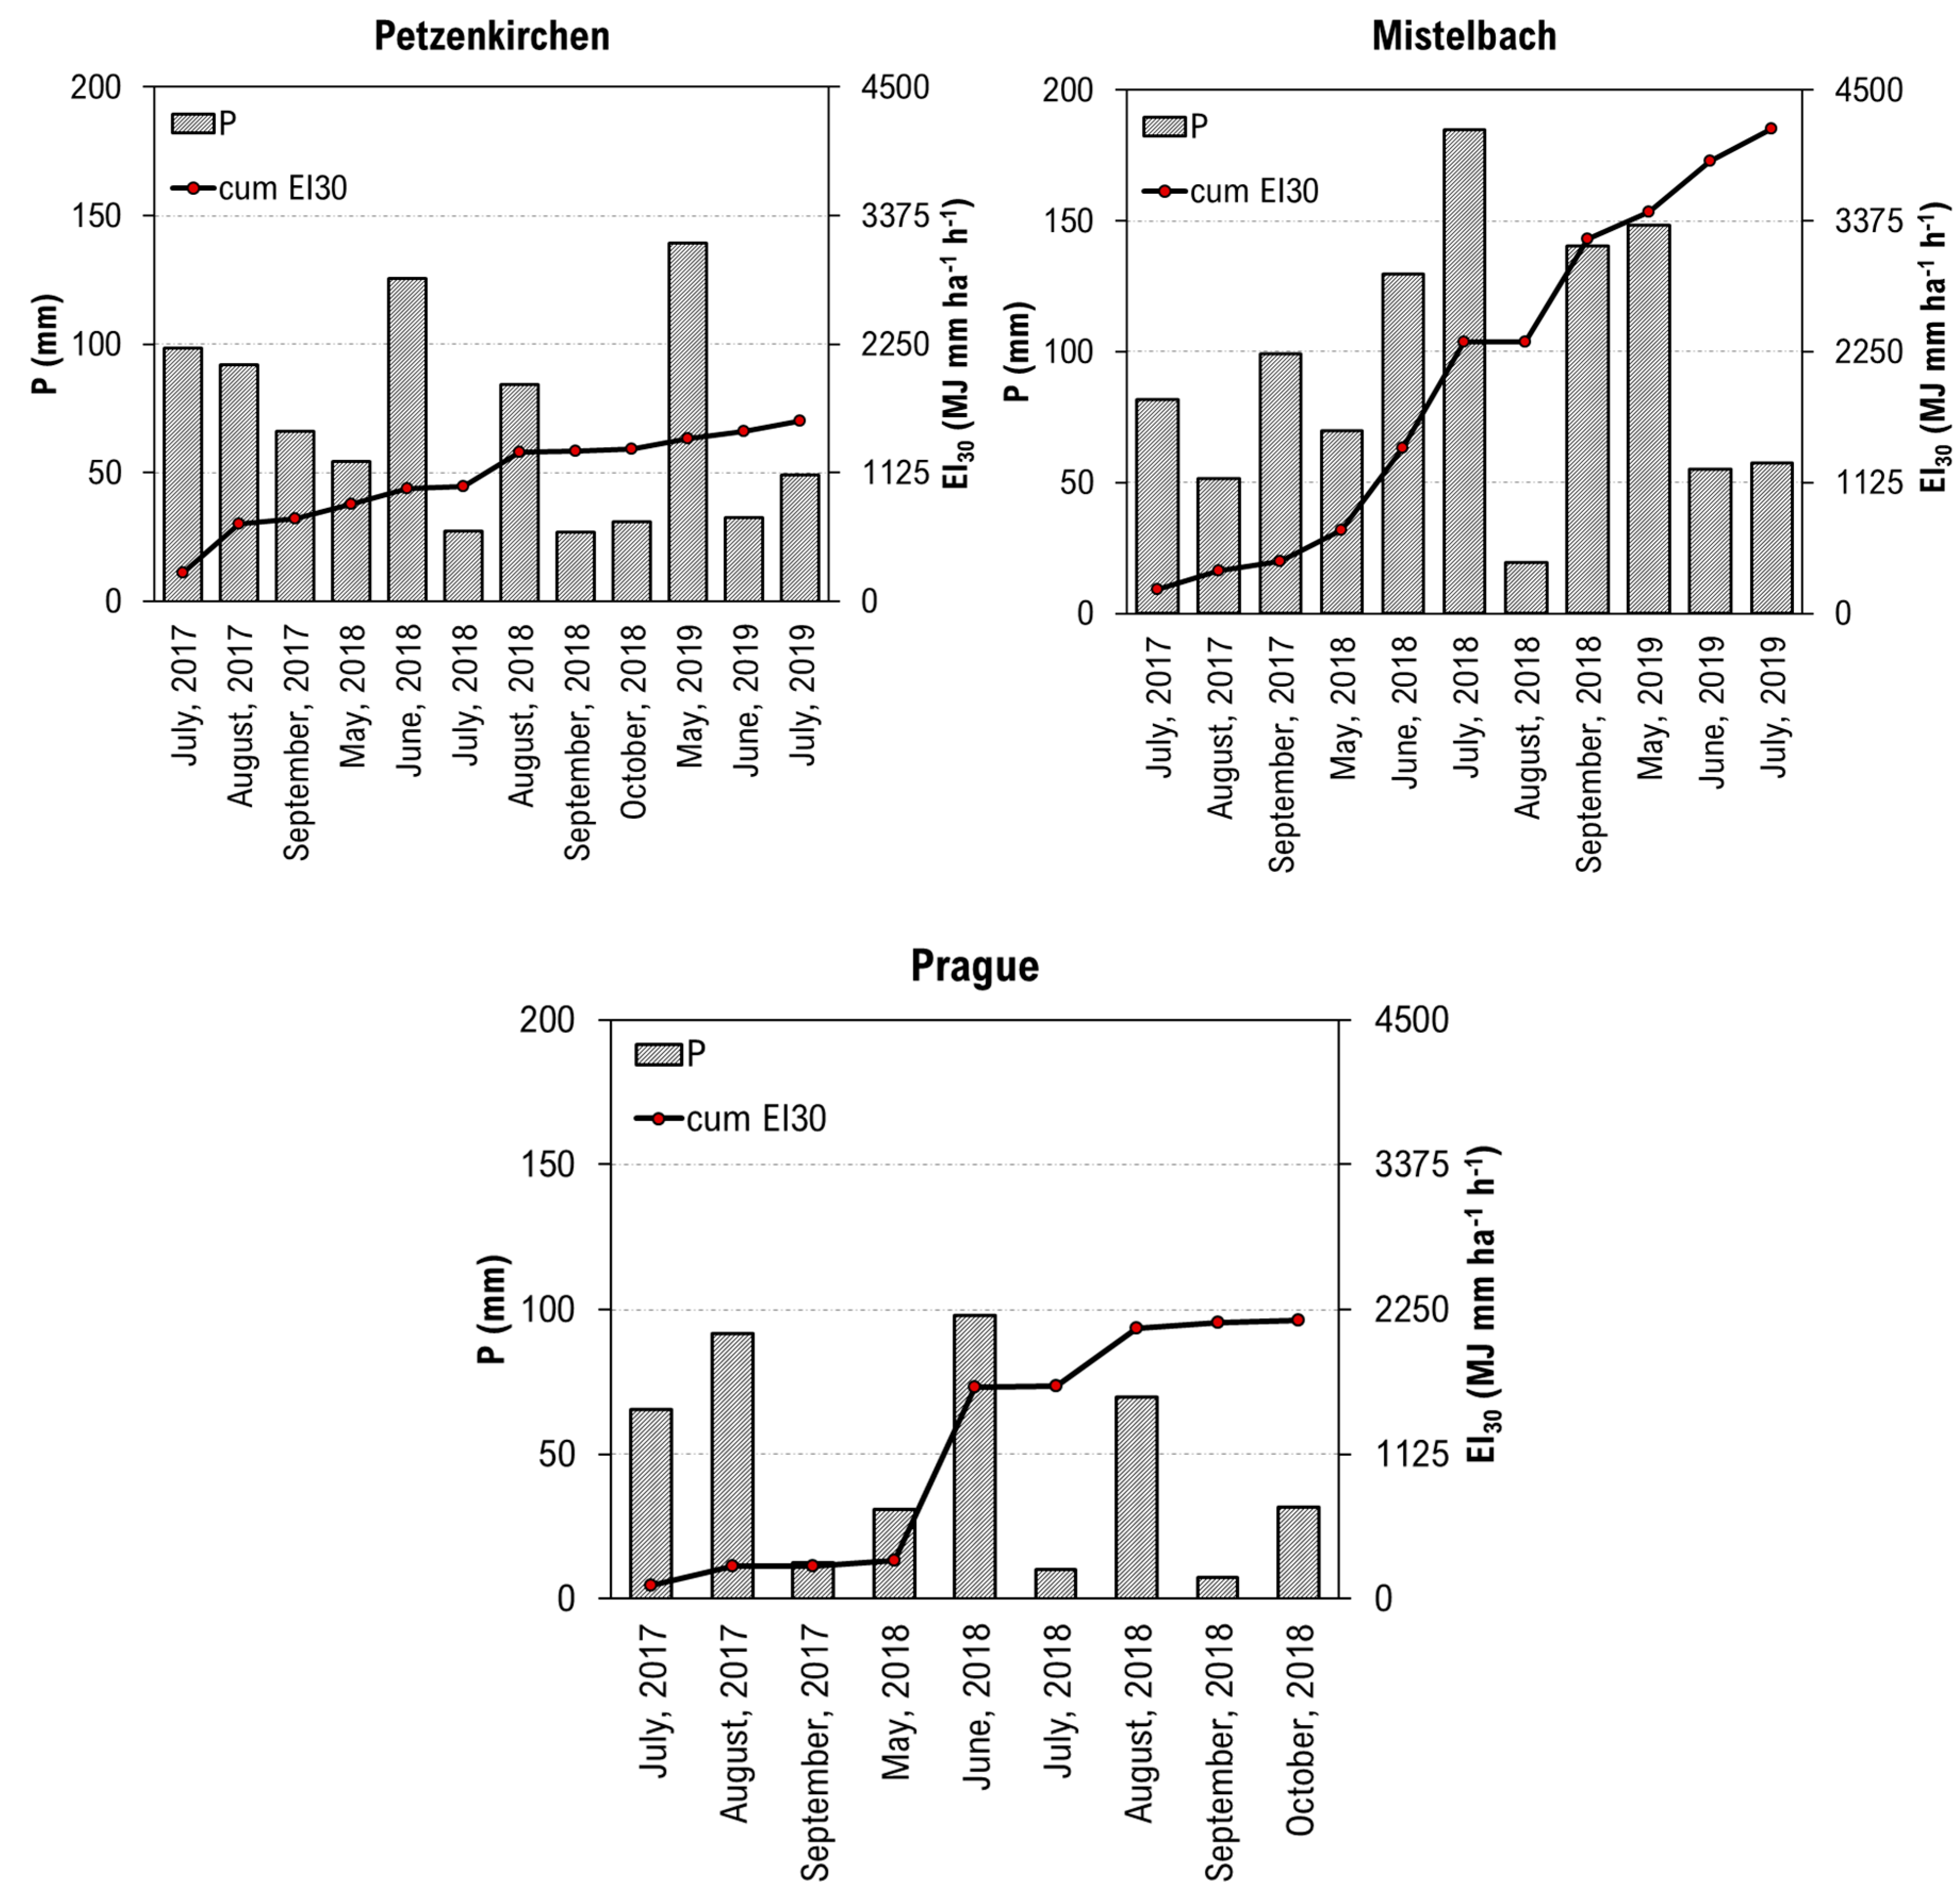
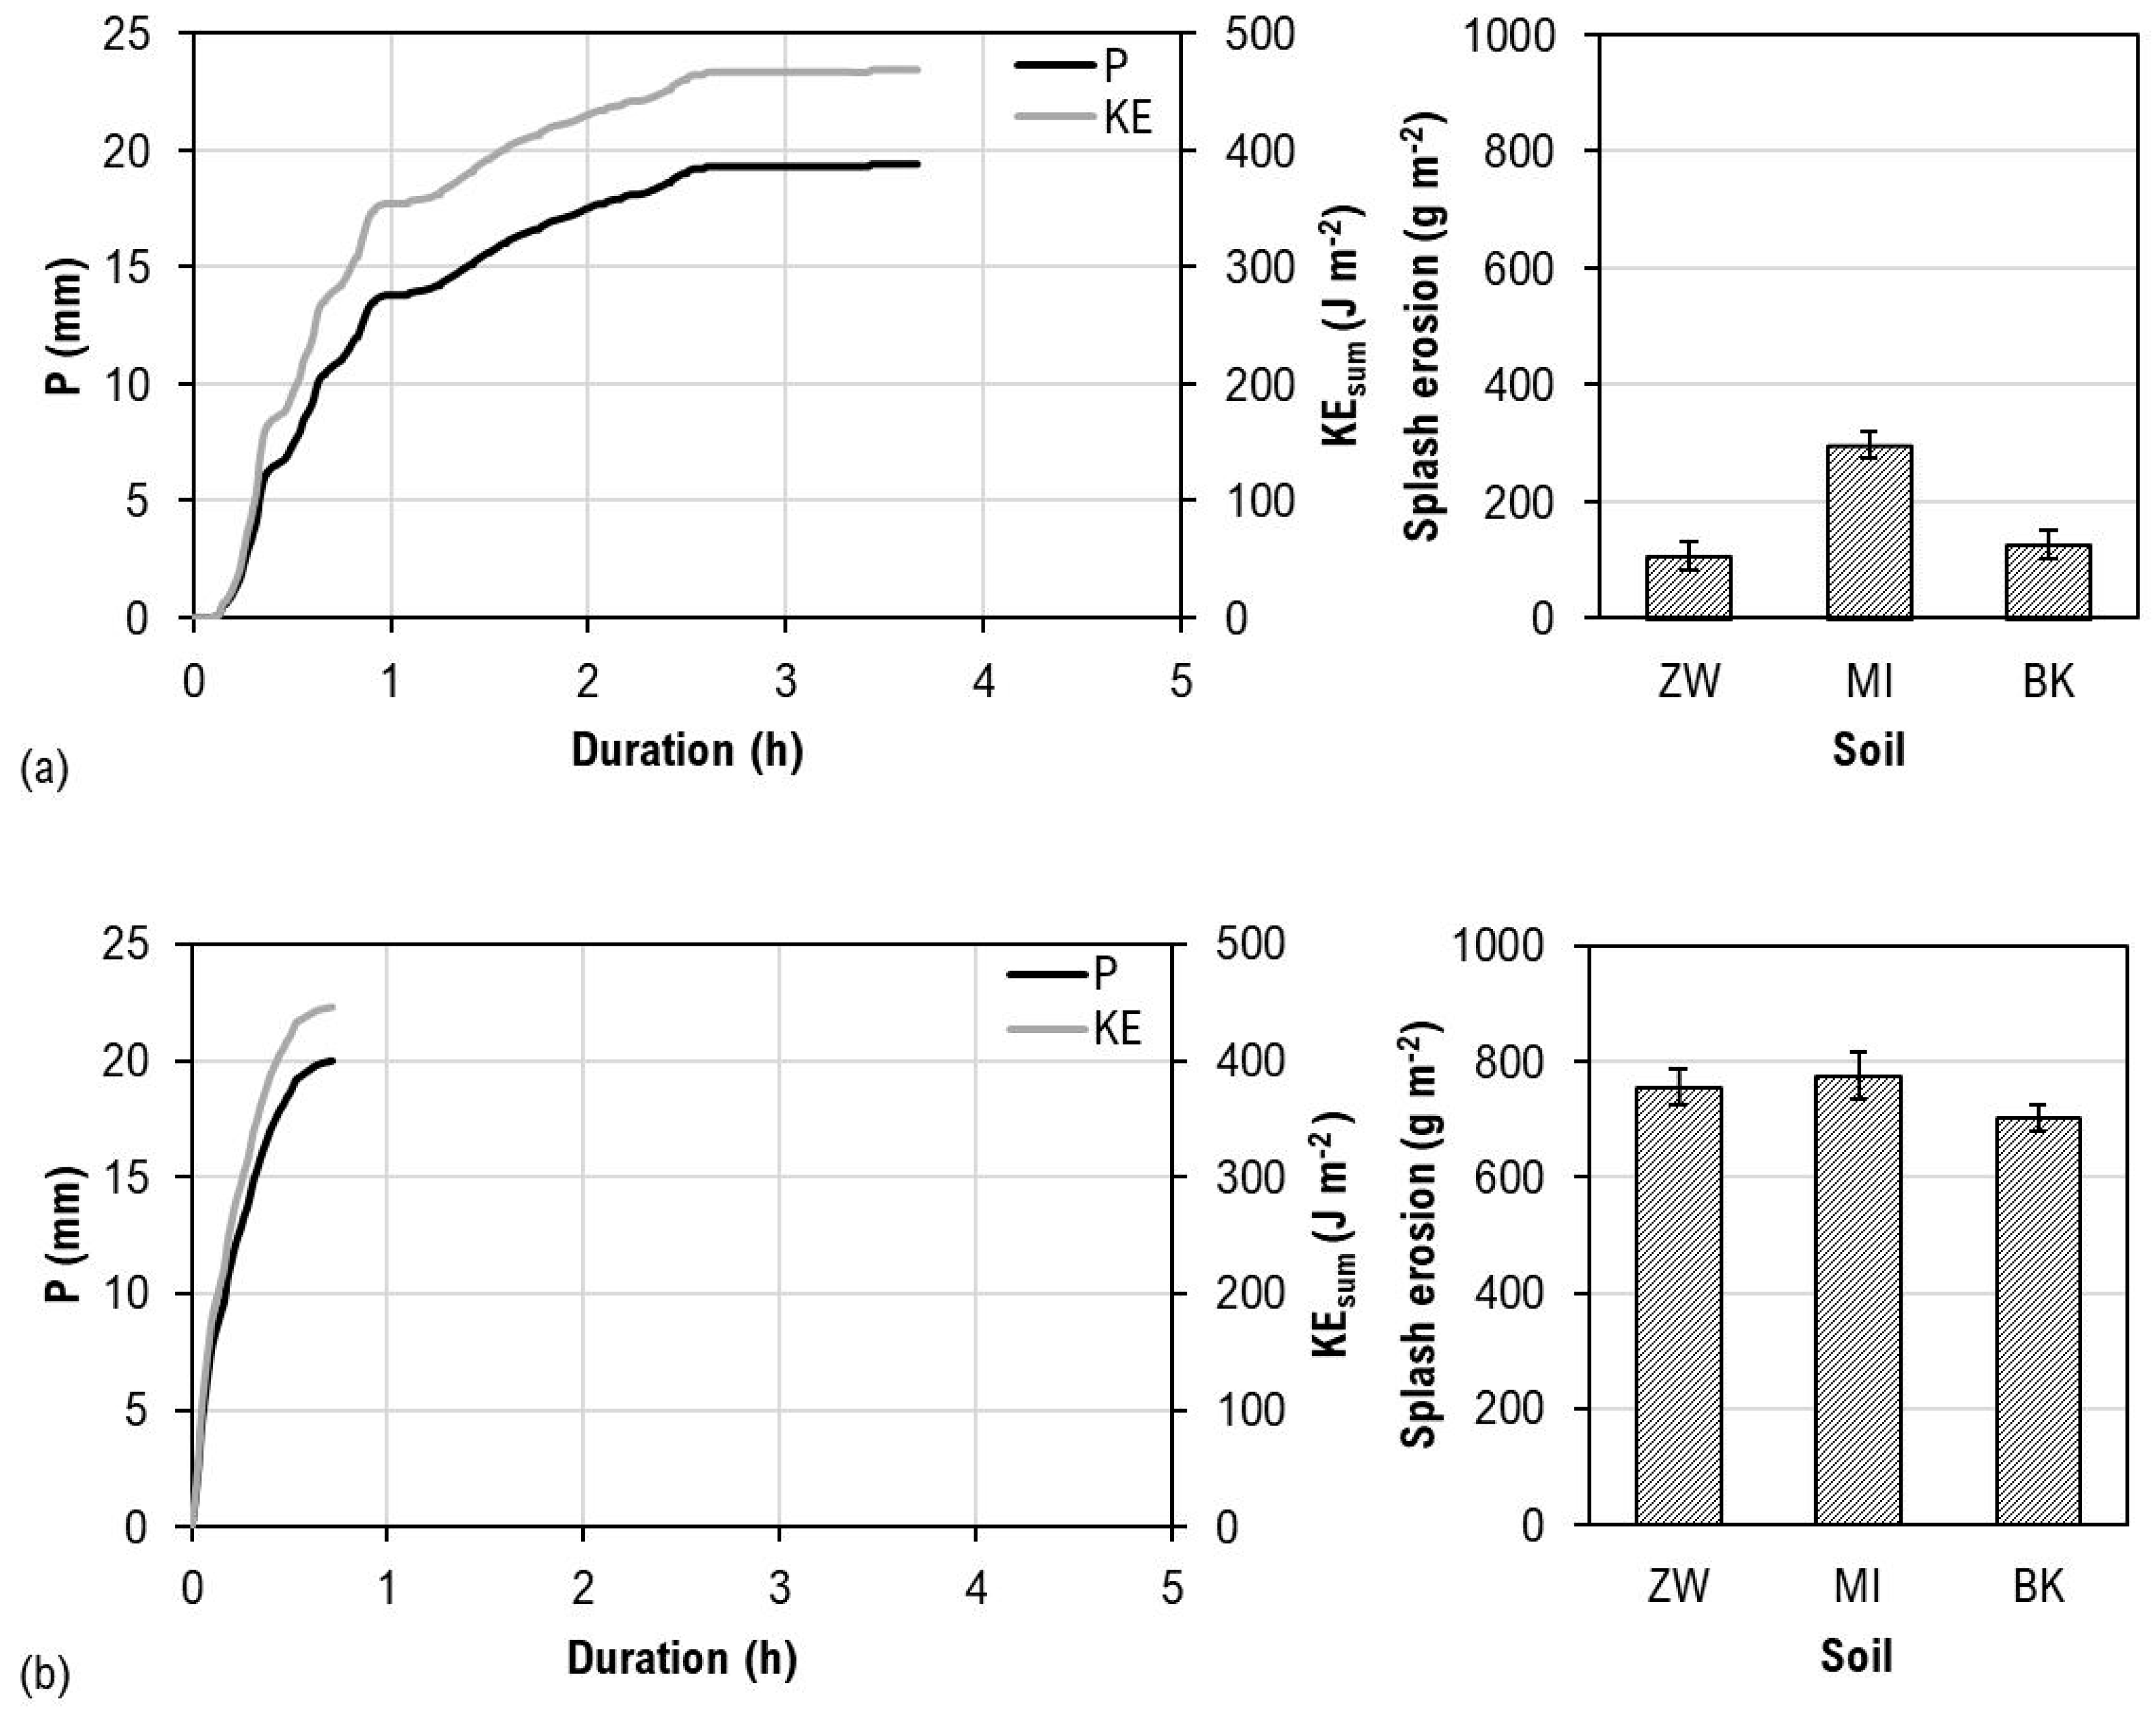
3.1. Rainfall Data
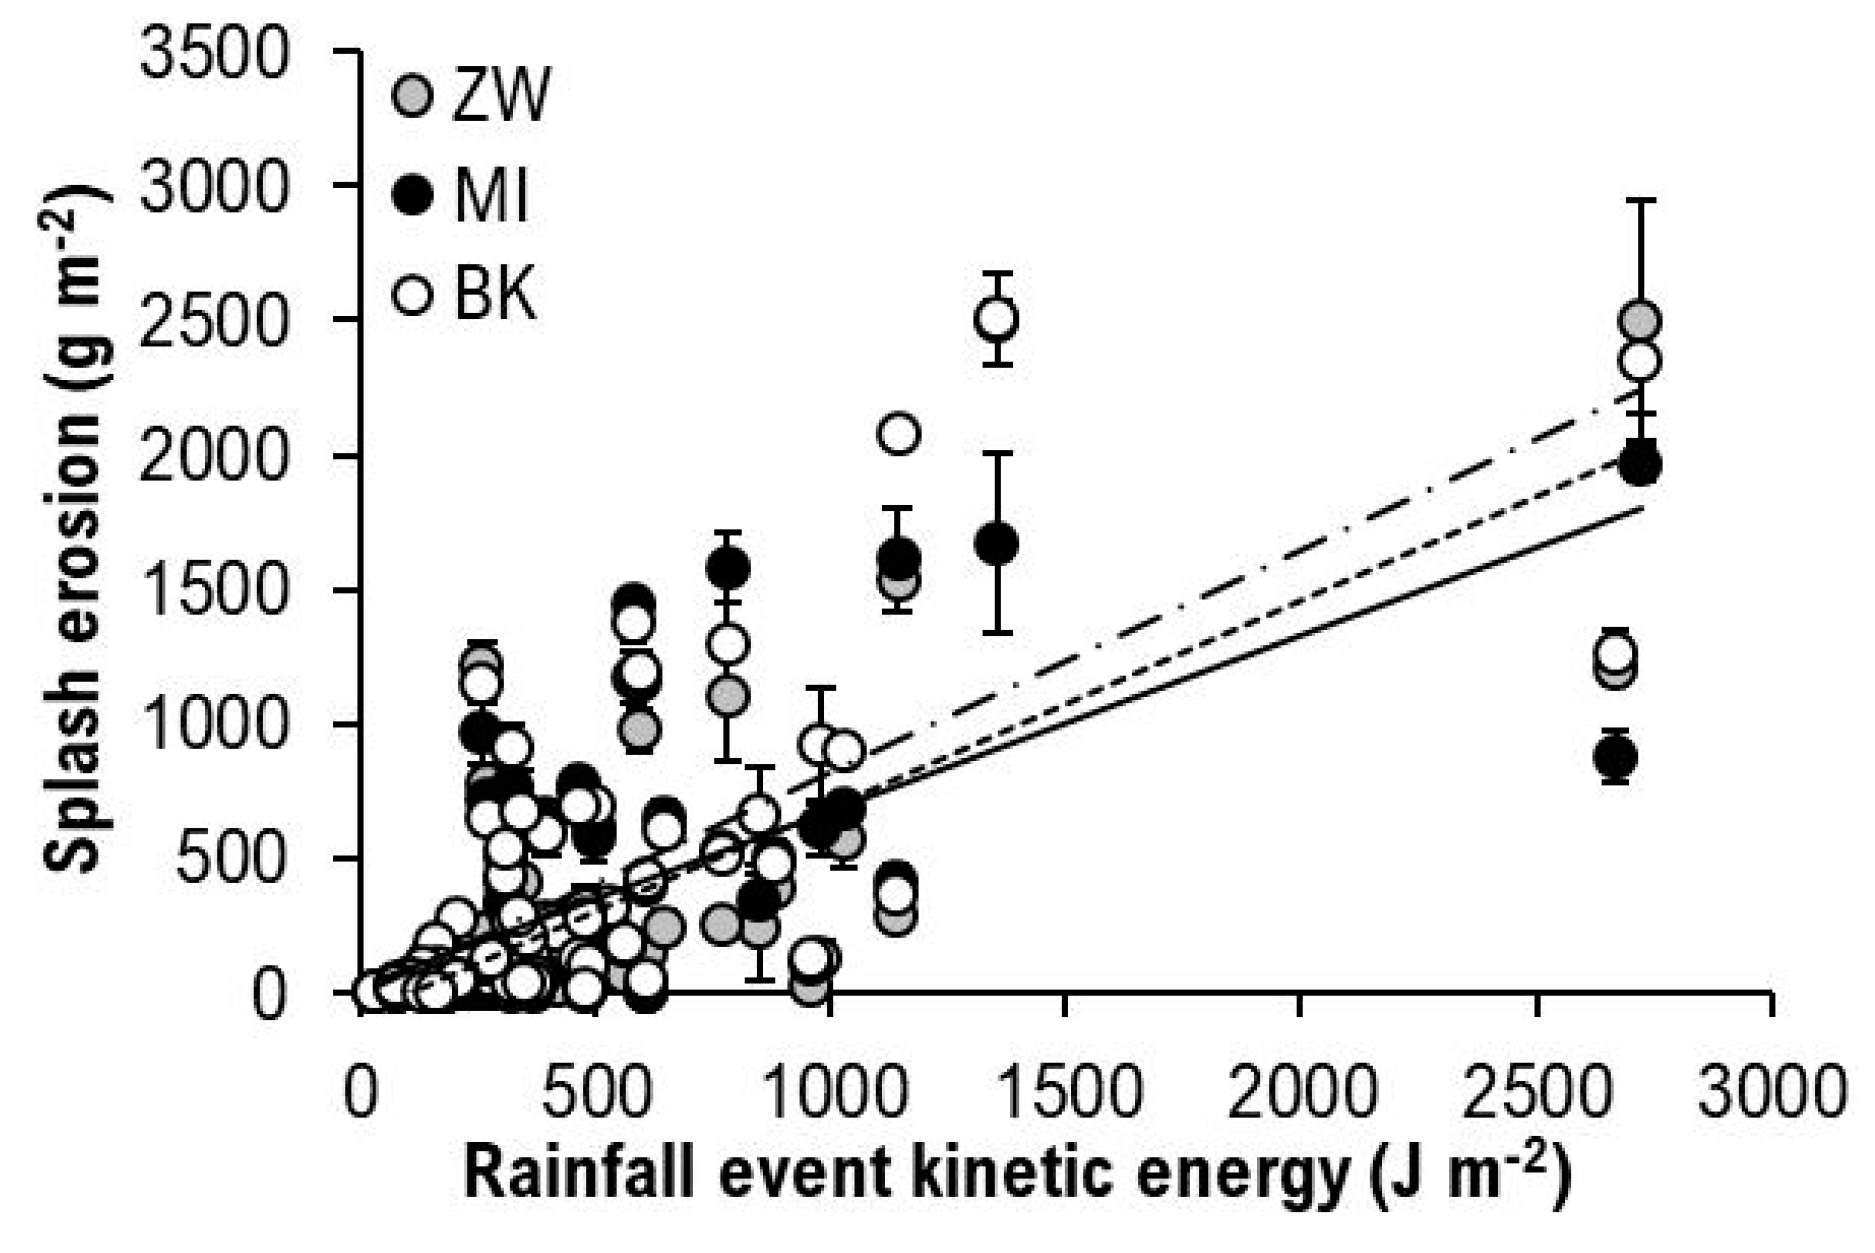
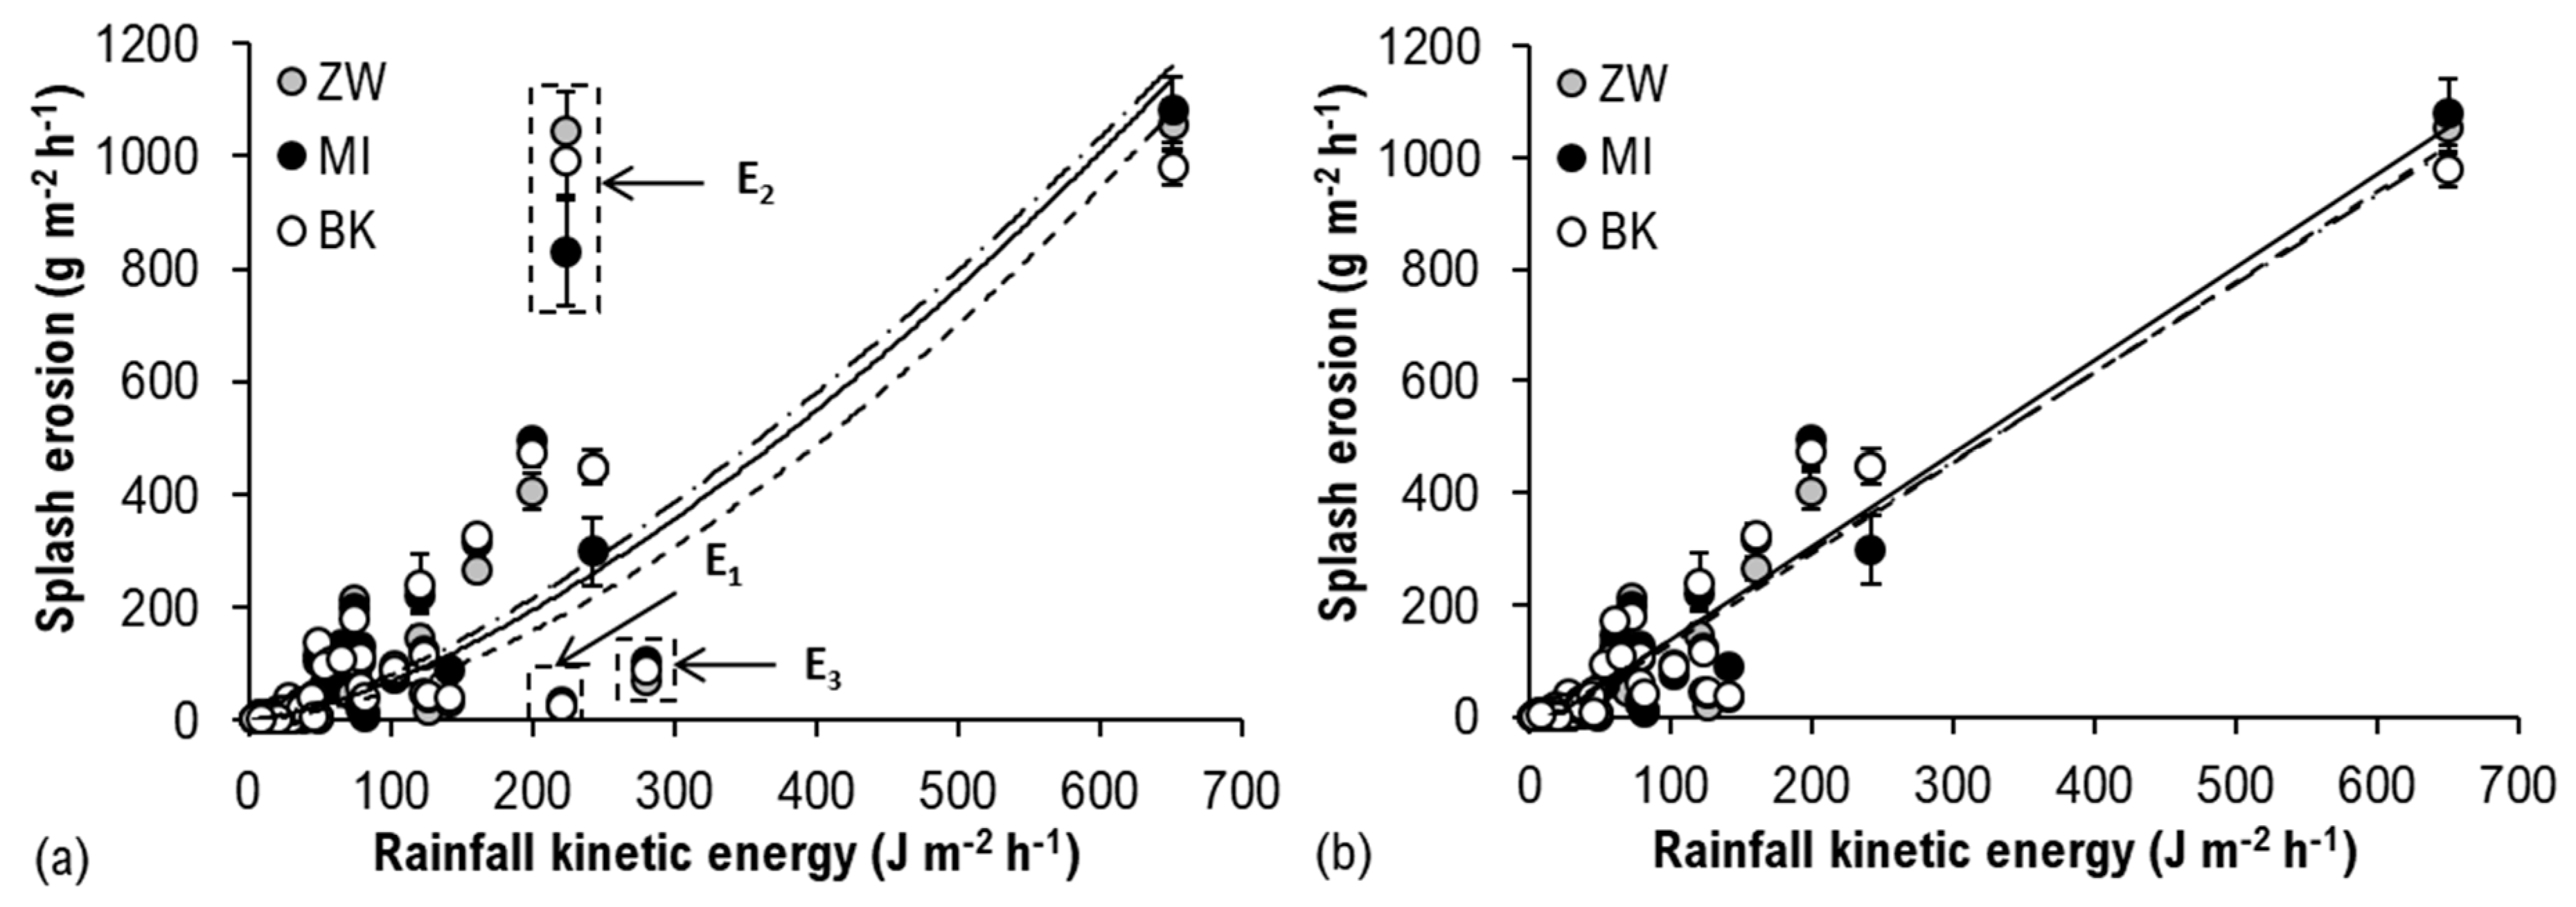
3.2. Splash Erosion as the Function of Total Kinetic Energy
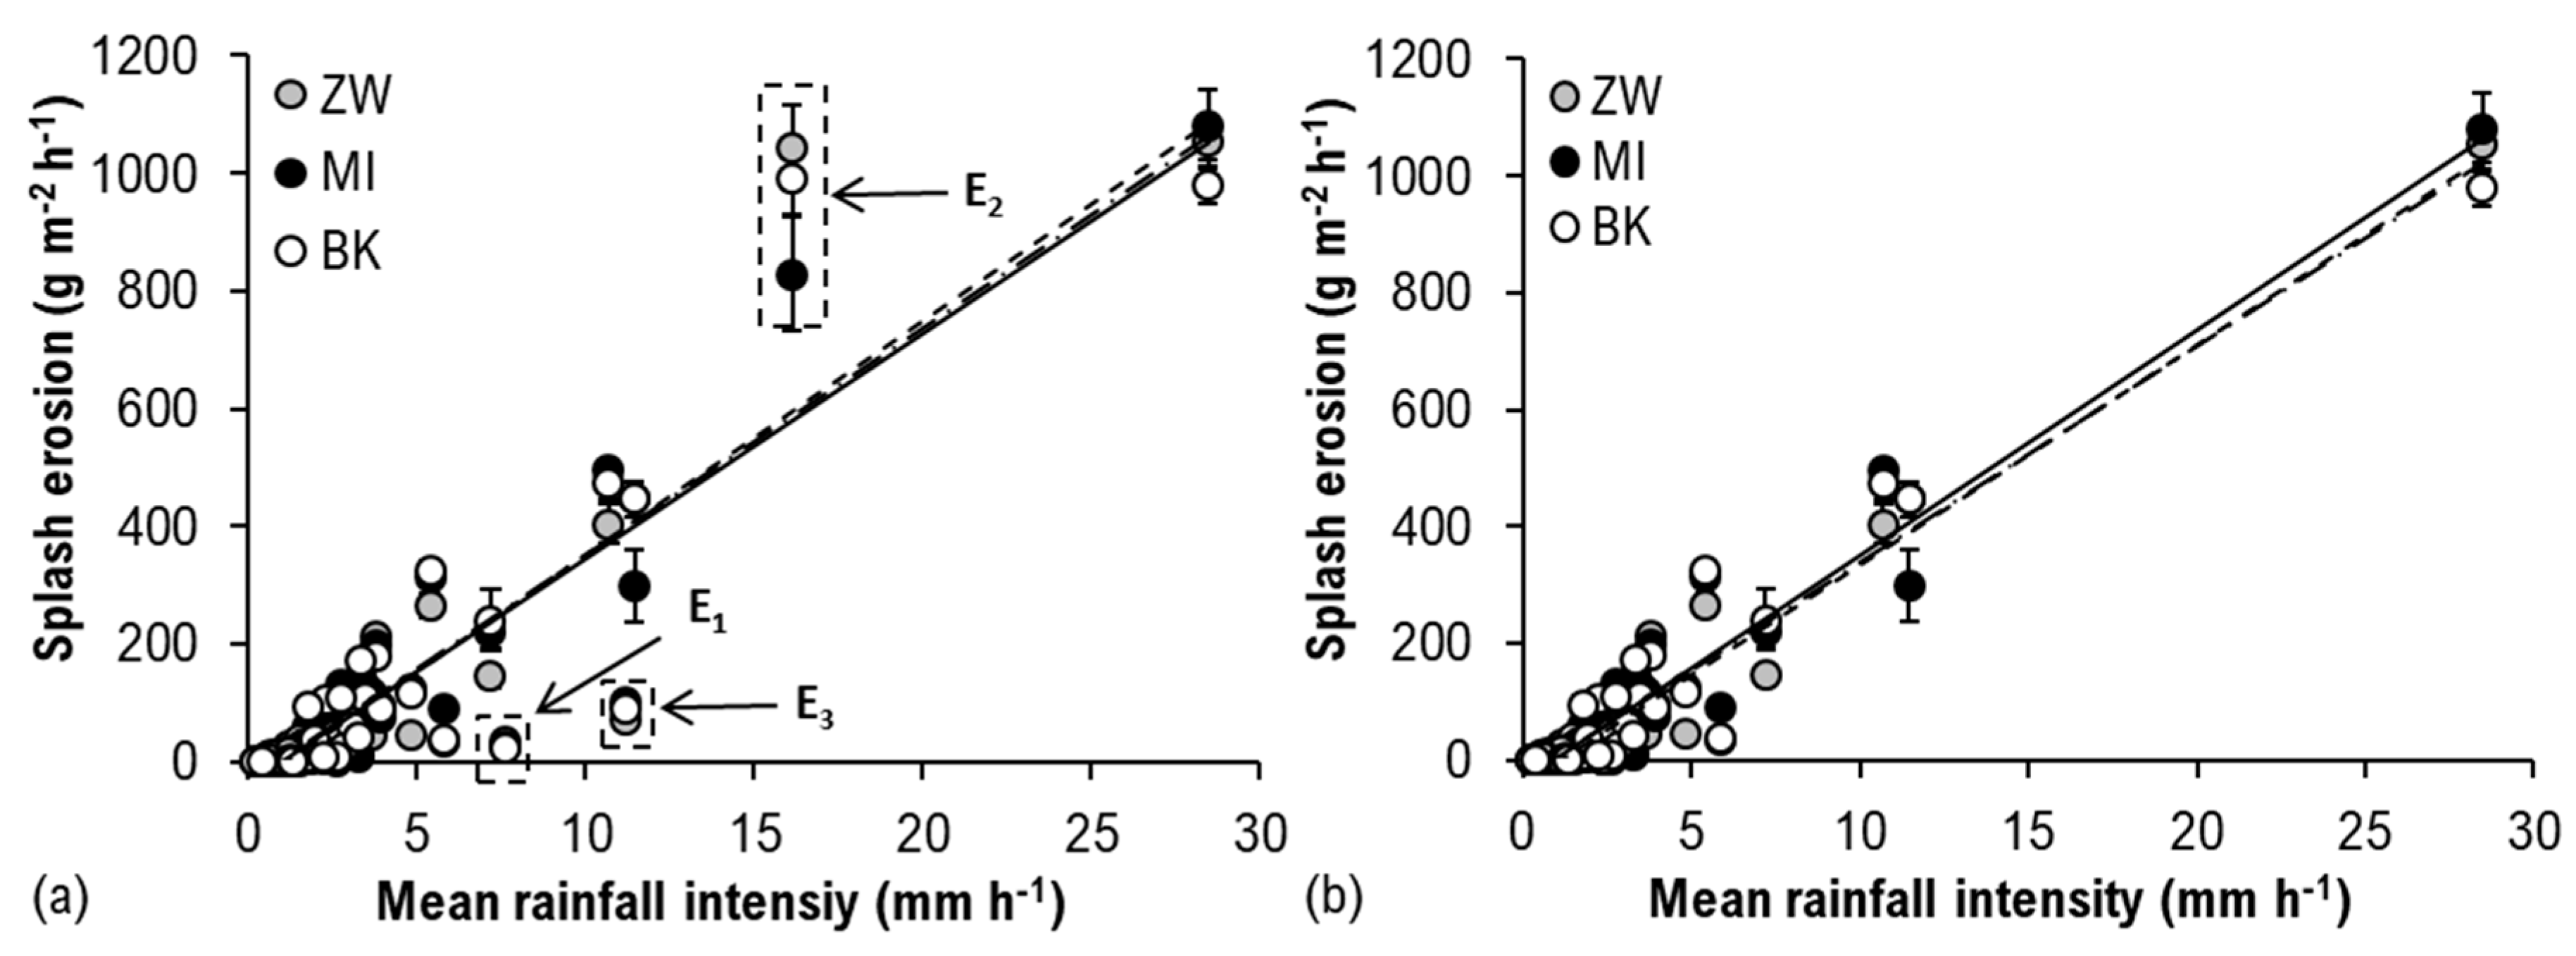
3.3. Impact of Rainfall Intensity on Splash Erosion
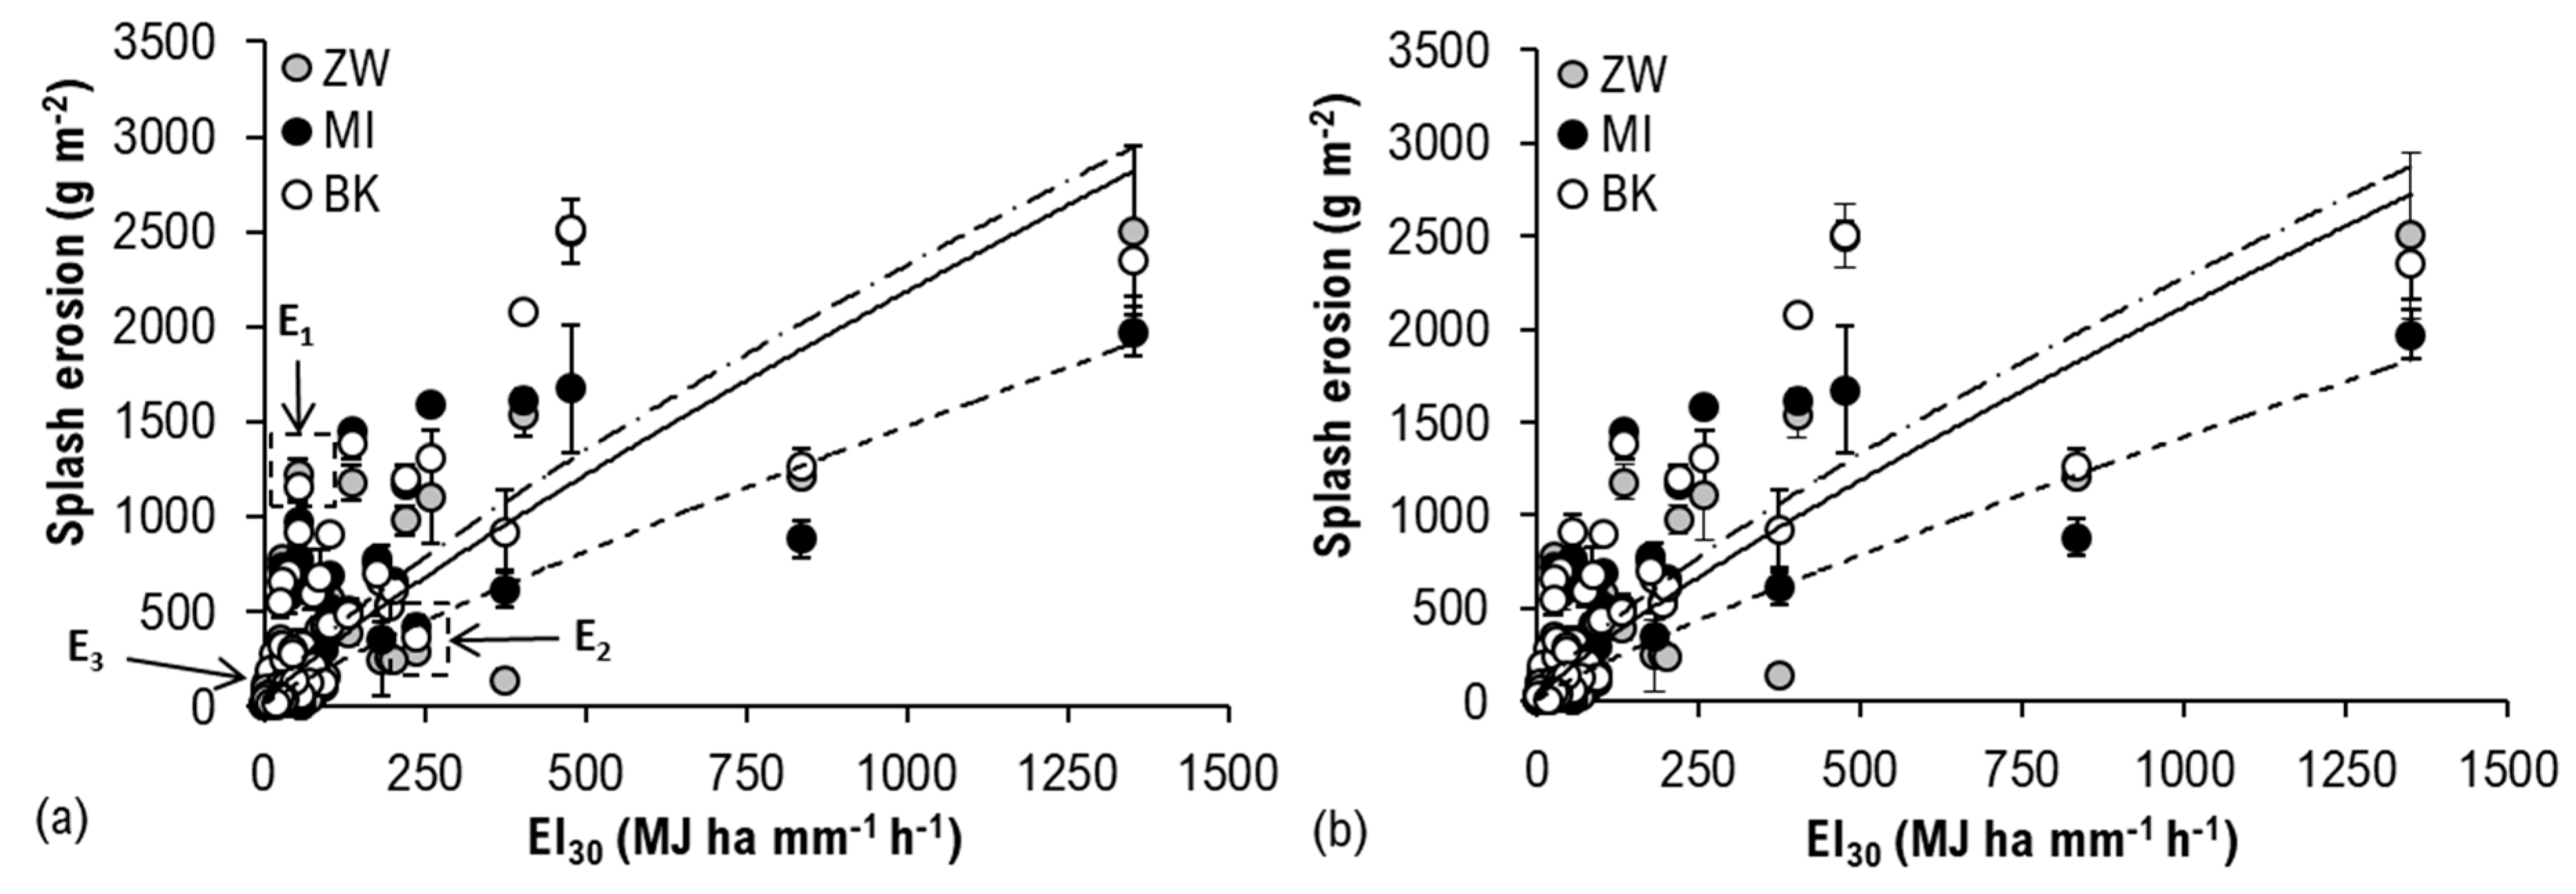
3.4. Regression Analysis of Rainfall Erosivity Parameters with Splash Erosion
3.4.1. Splash Erosion and Kinetic Energy Per Rainfall Duration
3.4.2. Splash Erosion and Mean Rainfall Intensity
3.4.3. Splash Erosion and Rainfall Erosivity (EI30)
4. Discussion
5. Conclusions
Author Contributions
Funding
Acknowledgments
Conflicts of Interest
References
- Montgomery, D.R. Soil erosion and agricultural sustainability. Proc. Natl. Acad. Sci. USA 2007, 104, 13268–13272. [Google Scholar] [CrossRef] [PubMed]
- Fernández-Raga, M.; Palencia, C.; Keesstra, S.; Jordán, A.; Fraile, R.; Angulo-Martínez, M.; Cerdà, A. Splash erosion: A review with unanswered questions. Earth Sci. Rev. 2017, 171, 463–477. [Google Scholar] [CrossRef]
- Salles, C.; Poesen, J.; Govers, G. Statistical and physical analysis of soil detachment by raindrop impact: Rain erosivity indices and threshold energy. Water Resour. Res. 2000, 36, 2721–2729. [Google Scholar] [CrossRef]
- Morgan, R.P.C. Soil Erosion and Conservation, 3rd ed.; Blackwell Publishing Company: Oxford, UK, 2005. [Google Scholar]
- Smith, D.D.; Wischmeier, W. Factors affecting sheet and rill erosion. Trans. Am. Geophys. Union 1957, 38, 889–896. [Google Scholar] [CrossRef]
- Rose, C.; Williams, J.; Sander, G.; Barry, D. A Mathematical Model of Soil Erosion and Deposition Processes: I. Theory for a Plane Land Element1. Soil Sci. Soc. Am. J. 1983, 47, 991–995. [Google Scholar] [CrossRef]
- Nearing, M.; Foster, G.R.; Lane, L.J.; Finkner, S.C. A Process-Based Soil Erosion Model for USDA-Water Erosion Prediction Project Technology. Trans. ASAE 1989, 32, 1587. [Google Scholar] [CrossRef]
- Wischmeier, W.H.; Smith, D. Rainfall energy and its relationship to soil loss. Trans. Am. Geophys. Union 1958, 39, 285–291. [Google Scholar] [CrossRef]
- Poesen, J. An improved splash transport model. Z. Geomorphol. 1985, 29, 193–211. [Google Scholar]
- Morgan, R.P.C.; Quinton, J.N.; Smith, R.E.; Govers, G.; Poesen, J.W.A.; Auerswald, K.; Chisci, G.; Torri, D.; Styczen, M.E.; Folly, A.J. The European Soil Erosion Model (EUROSEM): Documentation and User Guide; Cranfield University: Silsoe, UK, 1998. [Google Scholar]
- Renard, K.G.; Foster, G.R.; Weesies, G.A.; McCool, D.K.; Yoder, D.C. Predicting Soil Erosion by Water: A Guide to Conservation Planning With the Revised Universial Soil Erosion Equation (RUSLE); US Derpartment of Agriculture: Washington, DC, USA, 1997. [Google Scholar]
- Salles, C.; Poesen, J. Rain properties controlling soil splash detachment. Hydrol. Process. 2000, 14, 271–282. [Google Scholar] [CrossRef]
- Assouline, S. Infiltration into soils: Conceptual approaches and solutions. Water Resour. Res. 2013, 49, 1755–1772. [Google Scholar]
- Wang, G.; Fang, Q.; Wu, B.; Yang, H.; Xu, Z. Relationship between soil erodibility and modeled infiltration rate in different soils. J. Hydrol. 2015, 528, 408–418. [Google Scholar] [CrossRef]
- Liu, H.; Lei, T.W.; Zhao, J.; Yuan, C.P.; Fan, Y.T.; Qu, L.Q. Effects of rainfall intensity and antecedent soil water content on soil infiltrability under rainfall conditions using the run off-on-out method. J. Hydrol. 2011, 396, 24–32. [Google Scholar] [CrossRef]
- Beczek, M.; Ryżak, M.; Sochan, A.; Mazur, R.; Bieganowski, A. The mass ratio of splashed particles during raindrop splash phenomenon on soil surface. Geoderma 2019. [Google Scholar] [CrossRef]
- Le Bissonnais, Y.; Renaux, B.; Delouche, H. Interactions between soil properties and moisture content in crust formation, runoff and interrill erosion from tilled loess soils. Catena 1995, 25, 33–46. [Google Scholar] [CrossRef]
- Le Bissonnais, Y. Aggregate stability and assessment of soil crustability and erodibility: I. Theory and methodology. Eur. J. Soil Sci. 2016, 67, 11–21. [Google Scholar] [CrossRef]
- Cheng, Q.; Cai, Q.; Ma, W. Comparative study on rain splash erosion of representative soils in China. Chin. Geogr. Sci. 2008, 18, 155–161. [Google Scholar] [CrossRef]
- Beguería, S.; Angulo-Martínez, M.; Gaspar, L.; Navas, A. Detachment of soil organic carbon by rainfall splash: Experimental assessment on three agricultural soils of Spain. Geoderma 2015, 245, 21–30. [Google Scholar] [CrossRef]
- Torri, D.; Poesen, J. The effect of cup size on splash detachment and transport measurements. Part II: theoretical approach. Catena Suppl. 1988, 12, 113–126. [Google Scholar]
- Ellison, W.D. Studies of raindrop erosion. Agric. Eng. 1944, 25, 131–136. [Google Scholar]
- Morgan, R.P.C. Field measurement of splash erosion (Bedfordshire, England). Eros. Sediment. Transp. Meas. Proc. Florence Symp. (Int. Assoc. Hydrol. Sci. IAHS-AISH) 1981, 133, 373–382. [Google Scholar]
- Ma, B.; Liu, Y.; Liu, X.; Ma, F.; Wu, F.; Li, Z. Soil splash detachment and its spatial distribution under corn and soybean cover. Catena 2015, 127, 142–151. [Google Scholar] [CrossRef]
- Fernández-Raga, M.; Campo, J.; Rodrigo-Comino, J.; Keesstra, S.D. Comparative analysis of splash erosion devices for rainfall simulation experiments: A laboratory study. Water (Switzerland) 2019, 11, 1–21. [Google Scholar] [CrossRef]
- Scholten, T.; Geißler, C.; Goc, J.; Kühn, P.; Wiegand, C. A new splash cup to measure the kinetic energy of rainfall. J. Plant. Nutr. Soil Sci. 2011, 174, 596–601. [Google Scholar] [CrossRef]
- Quansah, C. The effect of soil type, slope, rain intensity and their interactions on splash detachment and transport. J. Soil Sci. 1981, 32, 215–224. [Google Scholar] [CrossRef]
- Kinnell, P.I.A. Laboratory studies on the effect of drop size on splash erosion. J. Agric. Eng. Res. 1982, 27, 431–439. [Google Scholar] [CrossRef]
- Sharma, P.P.; Gupta, S.C. Sand Detachment by Single Raindrops of Varying Kinetic Energy and Momentum. Soil Sci. Soc. Am. J. 1989, 53, 1005–1010. [Google Scholar] [CrossRef]
- Fu, Y.; Li, G.; Wang, D.; Zheng, T.; Yang, M. Raindrop energy impact on the distribution characteristics of splash aggregates of cultivated dark loessial cores. Water (Switzerland) 2019, 11, 1514. [Google Scholar] [CrossRef]
- Van Dijk, A.I.J.M.; Bruijnzeel, L.A.; Eisma, E.H. A methodology to study rain splash and wash processes under natural rainfall. Hydrol. Process. 2003, 17, 153–167. [Google Scholar] [CrossRef]
- Iserloh, T.; Ries, J.B.; Arnáez, J.; Boix-Fayos, C.; Butzen, V.; Cerdà, A.; Echeverría, M.T.; Fernández-Gálvez, J.; Fister, W.; Geißler, C.; et al. European small portable rainfall simulators: A comparison of rainfall characteristics. Catena 2013. [Google Scholar] [CrossRef]
- Lassu, T.; Seeger, M.; Peters, P.; Keesstra, S.D. The Wageningen Rainfall Simulator: Set-up and Calibration of an Indoor Nozzle-Type Rainfall Simulator for Soil Erosion Studies. Land Degrad. Dev. 2015, 26, 604–612. [Google Scholar] [CrossRef]
- Morgan, R.P.C. Splash detachment under plant covers: results and implications of a field study. Trans. Am. Soc. Agric. Eng. 1982, 25, 987–991. [Google Scholar] [CrossRef]
- Hudson, N.W. The Influence of Rainfall on the Mechanics of Soil Erosion: With Particular Reference to Southern Rhodesia. Master’s Thesis, University of Cape Town, Cape Town, South Africa, 1965. [Google Scholar]
- Govers, G. Spatial and temporal variations in splash detachment: a field study. Catena Suppl. 1991, 20, 15–24. [Google Scholar]
- Laws, J.O. Measurements of the fall-velocity of water -drops and raindrops. Trans. Am. Geophys. Union 1941, 22, 709. [Google Scholar] [CrossRef]
- van Dijk, A.I.J.M.; Bruijnzeel, L.A.; Rosewell, C.J. Rainfall intensity—Kinetic energy relationships: A critical literature appraisal. J. Hydrol. 2002, 261, 1–23. [Google Scholar] [CrossRef]
- Dunkerley, D. Rain event properties in nature and in rainfall simulation experiments: A comparative review with recommendations for increasingly systematic study and reporting. Hydrol. Process. 2008, 22, 4415–4435. [Google Scholar] [CrossRef]
- Johannsen, L.L.; Zambon, N.; Strauss, P.; Dostal, T.; Neumann, M.; Zumr, D.; Cochrane, T.A.; Klik, A. Impact of Disdrometer Types on Rainfall Erosivity Estimation. Water 2020, 12, 963. [Google Scholar] [CrossRef]
- Kinnell, P.I.A. Problem of Assessing the Erosive Power of Rainfall from Meteorological Observations. Soil Sci. Soc. Am. Proc. 1973, 37, 617–621. [Google Scholar] [CrossRef]
- Fernández-Raga, M.; Fraile, R.; Keizer, J.J.; Varela Teijeiro, M.E.; Castro, A.; Palencia, C.; Calvo, A.I.; Koenders, J.; Da Costa Marques, R.L. The kinetic energy of rain measured with an optical disdrometer: An application to splash erosion. Atmos. Res. 2010, 96, 225–240. [Google Scholar] [CrossRef]
- Angulo-Martínez, M.; Beguería, S.; Navas, A.; Machín, J. Splash erosion under natural rainfall on three soil types in NE Spain. Geomorphology 2012, 175–176, 38–44. [Google Scholar] [CrossRef]
- Bauer, B. Soil splash as an important agent of erosion. Geogr. Pol. 1990, 58, 99–106. [Google Scholar]
- Land Niederösterreich. Wasserstandsnachrichten und Hochwasserprognosen. Messstellendaten. Wieselburg. Available online: https://www.noe.gv.at/wasserstand/#/de/Messstellen/Details/107235/Niederschlag/3Tage (accessed on 25 November 2019).
- Land Niederösterreich. Wasserstandsnachrichten und Hochwasserprognosen. Messstellendaten. Mistelbach. Available online: https://www.noe.gv.at/wasserstand/#/de/Messstellen/Details/99116541/Niederschlag/3Tage (accessed on 25 November 2019).
- Czech Hydrometeorological Institute. Prague Clementinum: Basic Data on Prague Clementinum Station. Available online: http://portal.chmi.cz/historicka-data/pocasi/praha-klementinum?l=en# (accessed on 25 November 2019).
- Klik, A.; Truman, C.C. What is a Typical Heavy Rainstorm? In Proceedings of the 25 Years of Assesment of Erosion, Proceedings of International Symposium, Ghent, Belgium, 22–26 September 2003; Gabriels, D., Cornelis, W., Eds.; Ghent University: Ghent, Belgium, 2003; pp. 93–98. [Google Scholar]
- Panagos, P.; Borrelli, P.; Spinoni, J.; Ballabio, C.; Meusburger, K.; Beguería, S.; Klik, A.; Michaelides, S.; Petan, S.; Hrabalíková, M.; et al. Monthly rainfall erosivity: Conversion factors for different time resolutions and regional assessments. Water (Switzerland) 2016, 8, 119. [Google Scholar] [CrossRef]
- ÖNORM L1061-1. Physikalische Bodenuntersuchungen—Bestimmung der Korngrößenverteilung des Mineralbodens; Teil 1; Grobboden, Austrian Standards Institute: Vienna, Austria, 2002. [Google Scholar]
- ÖNORM L1061-2. Physikalische Bodenuntersuchungen—Bestimmung der Korngrößenverteilung des Mineralbodens; Teil 2; Feinboden, Austrian Standards Institute: Vienna, Austria, 2002. [Google Scholar]
- ÖNORM L 1050. Boden als Pflanzenstandort—Begriffsbestimmungen, Untersuchungsverfahren; Austrian Standards Institute: Vienna, Austria, 1994. [Google Scholar]
- ÖNORM L 1080. Chemische Bodenuntersuchungen—Bestimmung des organischen Kohlenstoffs durch trockene Verbrennung mit und ohne Berücksichtigung von Carbonaten; Austrian Standards Institute: Vienna, Austria, 1987. [Google Scholar]
- Kemper, W.D.; Rosenau, R.C. Aggregate Stability and Size Dlstributlon. In Methods of soil analysis: Part 1 Physical and Mineralogical Methods; Klute, A., Ed.; American Society of Agronomy—Soil Science Socity of America: Madison, WI, USA, 1986; pp. 425–442. [Google Scholar]
- Zumr, D.; Mützenberg, D.V.; Neumann, M.; Jeřábek, J.; Laburda, T.; Kavka, P.; Johannsen, L.L.; Zambon, N.; Klik, A.; Strauss, P.; et al. Experimental Setup for Splash Erosion Monitoring—Study of Silty Loam Splash Characteristics. Sustainability 2019, 12, 157. [Google Scholar] [CrossRef]
- Richter, G.; Negendank, J.F.W. Soil erosion processes and their measurement in the german area of the Moselle river. Earth Surf. Process. 1977, 2, 261–278. [Google Scholar] [CrossRef]
- Johannsen, L.L.; Zambon, N.; Strauss, P.; Dostal, T.; Neumann, M.; Zumr, D.; Cochrane, T.A.; Blöschl, G.; Klik, A. Comparison of three types of laser optical disdrometers under natural rainfall conditions. Hydrol. Sci. J. 2020, 65, 524–535. [Google Scholar] [CrossRef]
- Kruskal, W.H.; Wallis, W.A. Use of Ranks in One-Criterion Variance Analysis. J. Am. Stat. Assoc. 1952, 47, 583–621. [Google Scholar] [CrossRef]
- Bubenzer, G.D.; Jones, B. Drop size and impact velocity effects on the detachment of soils under simulated rainfall. Trans. Am. Soc. Agric. Eng. 1971, 14, 625–628. [Google Scholar] [CrossRef]
- Fu, Y.; Li, G.; Zheng, T.; Li, B.; Zhang, T. Splash detachment and transport of loess aggregate fragments by raindrop action. Catena 2017, 150, 154–160. [Google Scholar] [CrossRef]
- Zambon, N.; Johannsen, L.L.; Strauss, P.; Dostál, T.; Zumr, D.; Cochrane, T.A.; Klik, A. Splash erosion affected by initial soil moisture and surface conditions under simulated rainfall. Catena. (under review).
- Xiao, H.; Liu, G.; Zhang, Q.; Fenli, Z.; Zhang, X.; Liu, P.; Zhang, J.; Hu, F.; Elbasit, M.A.M.A. Quantifying contributions of slaking and mechanical breakdown of soil aggregates to splash erosion for different soils from the Loess plateau of China. Soil Tillage Res. 2018, 178, 150–158. [Google Scholar] [CrossRef]
- Ryzak, M.; Bieganowski, A.; Polakowski, C. Effect of soil moisture content on the splash phenomenon reproducibility. PLoS ONE 2015, 10, 1–15. [Google Scholar] [CrossRef]
- Assouline, S.; Mualem, Y. Modeling the dynamics of seal formation and its effect on infiltration as related to soil and rainfall characteristics. Water Resour. Res. 1997, 33, 1527–1536. [Google Scholar] [CrossRef]
- Caron, J.; Kay, B.D.; Stone, J.A. Improvement of Structural Stability of a Clay Loam with Drying. Soil Sci. Soc. Am. J. 1992, 56, 1583–1590. [Google Scholar] [CrossRef]


| Soil | Sand [%] | Silt [%] | Clay [%] | Soil Texture | AS [%] | pH | TOC [%] |
|---|---|---|---|---|---|---|---|
| Zwerbach | 14.0 | 60.2 | 25.8 | Silt loam | 41.4 | 7.5 | 1.5 |
| Mistelbach | 11.2 | 70.4 | 18.4 | Silt loam | 18.3 | 8.2 | 1.6 |
| Bílkovice | 41.6 | 46.3 | 12.1 | Loamy sand | 63.3 | 6.9 | 1.7 |
| Study Sites | |||
|---|---|---|---|
| Petzenkirchen | Mistelbach | Prague | |
| Number of months measured | 12 | 11 | 9 |
| Precipitation (mm) | 68.7 | 94.0 | 46.5 |
| Kinetic energy (J m−2) | 1026.0 | 1876.9 | 661.7 |
| Rainfall erosivity (MJ mm ha−1 h−1) | 131.6 | 378.9 | 241.0 |
| Erosivity density (MJ ha−1 h−1) | 1.7 | 3.8 | 3.6 |
| Raindrop diameter (mm) * | 0.9 | 1.2 | 0.6 |
| Parameter | Soil | Equation | R2 | RMSE |
|---|---|---|---|---|
| KEsum | ZW | S = 0.767∙KEsum − 75.968 | 0.50 | 349.25 |
| MI | S = 0.653∙KEsum + 22.841 | 0.45 | 326.10 | |
| BK | S = 0.825∙KEsum − 1.299 | 0.52 | 357.73 |
| Parameter | Soil | Equation | R2 | RMSE |
|---|---|---|---|---|
| KEh (including E1, E2, E3) | ZW | Sh = 0.028∙KEh1.629 | 0.76 | 112.21 |
| MI | Sh = 0.069∙KEh1.498 | 0.75 | 91.30 | |
| BK | Sh = 0.113∙KEh1.426 | 0.76 | 106.27 | |
| KEh (excluding E1, E2, E3) | ZW | Sh = 1.621∙KEh − 32.289 | 0.91 | 43.04 |
| MI | Sh = 1.668∙KEh − 27.828 | 0.91 | 43.40 | |
| BK | Sh = 1.590∙KEh − 20.586 | 0.90 | 43.10 |
| Parameter | Soil | Equation | R2 | RMSE |
|---|---|---|---|---|
| Iav (including E1, E2, E3) | ZW | Sh = 39.765∙Iav − 47.492 | 0.81 | 77.08 |
| MI | Sh = 38.379∙Iav − 39.707 | 0.86 | 62.50 | |
| BK | Sh = 38.578∙Iav − 34.877 | 0.82 | 73.06 | |
| Iav (excluding E1, E2, E3) | ZW | Sh = 37.658∙Iav − 42.101 | 0.93 | 37.78 |
| MI | Sh = 38.691∙Iav − 36.893 | 0.93 | 37.68 | |
| BK | Sh = 36.960∙Iav − 30.124 | 0.93 | 37.66 |
| Parameter | Soil | Equation | R2 | RMSE |
|---|---|---|---|---|
| EI30 (including E1, E2, E3) | ZW | S = 3.927∙EI300.858 | 0.60 | 335.23 |
| MI | S = 6.418∙EI300.844 | 0.64 | 299.95 | |
| BK | S = 10.233∙EI300.785 | 0.65 | 310.70 | |
| EI30 (excluding E1, E2, E3) | ZW | S = 3.899∙EI300.854 | 0.60 | 322.87 |
| MI | S = 6.572∙EI300.836 | 0.65 | 287.67 | |
| BK | S = 10.517∙EI300.778 | 0.65 | 294.55 |
© 2020 by the authors. Licensee MDPI, Basel, Switzerland. This article is an open access article distributed under the terms and conditions of the Creative Commons Attribution (CC BY) license (http://creativecommons.org/licenses/by/4.0/).
Share and Cite
Zambon, N.; Johannsen, L.L.; Strauss, P.; Dostal, T.; Zumr, D.; Neumann, M.; Cochrane, T.A.; Klik, A. Rainfall Parameters Affecting Splash Erosion under Natural Conditions. Appl. Sci. 2020, 10, 4103. https://doi.org/10.3390/app10124103
Zambon N, Johannsen LL, Strauss P, Dostal T, Zumr D, Neumann M, Cochrane TA, Klik A. Rainfall Parameters Affecting Splash Erosion under Natural Conditions. Applied Sciences. 2020; 10(12):4103. https://doi.org/10.3390/app10124103
Chicago/Turabian StyleZambon, Nives, Lisbeth Lolk Johannsen, Peter Strauss, Tomas Dostal, David Zumr, Martin Neumann, Thomas A. Cochrane, and Andreas Klik. 2020. "Rainfall Parameters Affecting Splash Erosion under Natural Conditions" Applied Sciences 10, no. 12: 4103. https://doi.org/10.3390/app10124103
APA StyleZambon, N., Johannsen, L. L., Strauss, P., Dostal, T., Zumr, D., Neumann, M., Cochrane, T. A., & Klik, A. (2020). Rainfall Parameters Affecting Splash Erosion under Natural Conditions. Applied Sciences, 10(12), 4103. https://doi.org/10.3390/app10124103