A Systematic Literature Review of Non-Invasive Indoor Thermal Discomfort Detection


Abstract
1. Introduction
- +
- 3 Hot
- +
- 2 Warm
- +
- 1 Slightly warm
- 0 Neutral
- -
- 1 Slightly cold
- -
- 2 Cool
- -
- 3 Cold
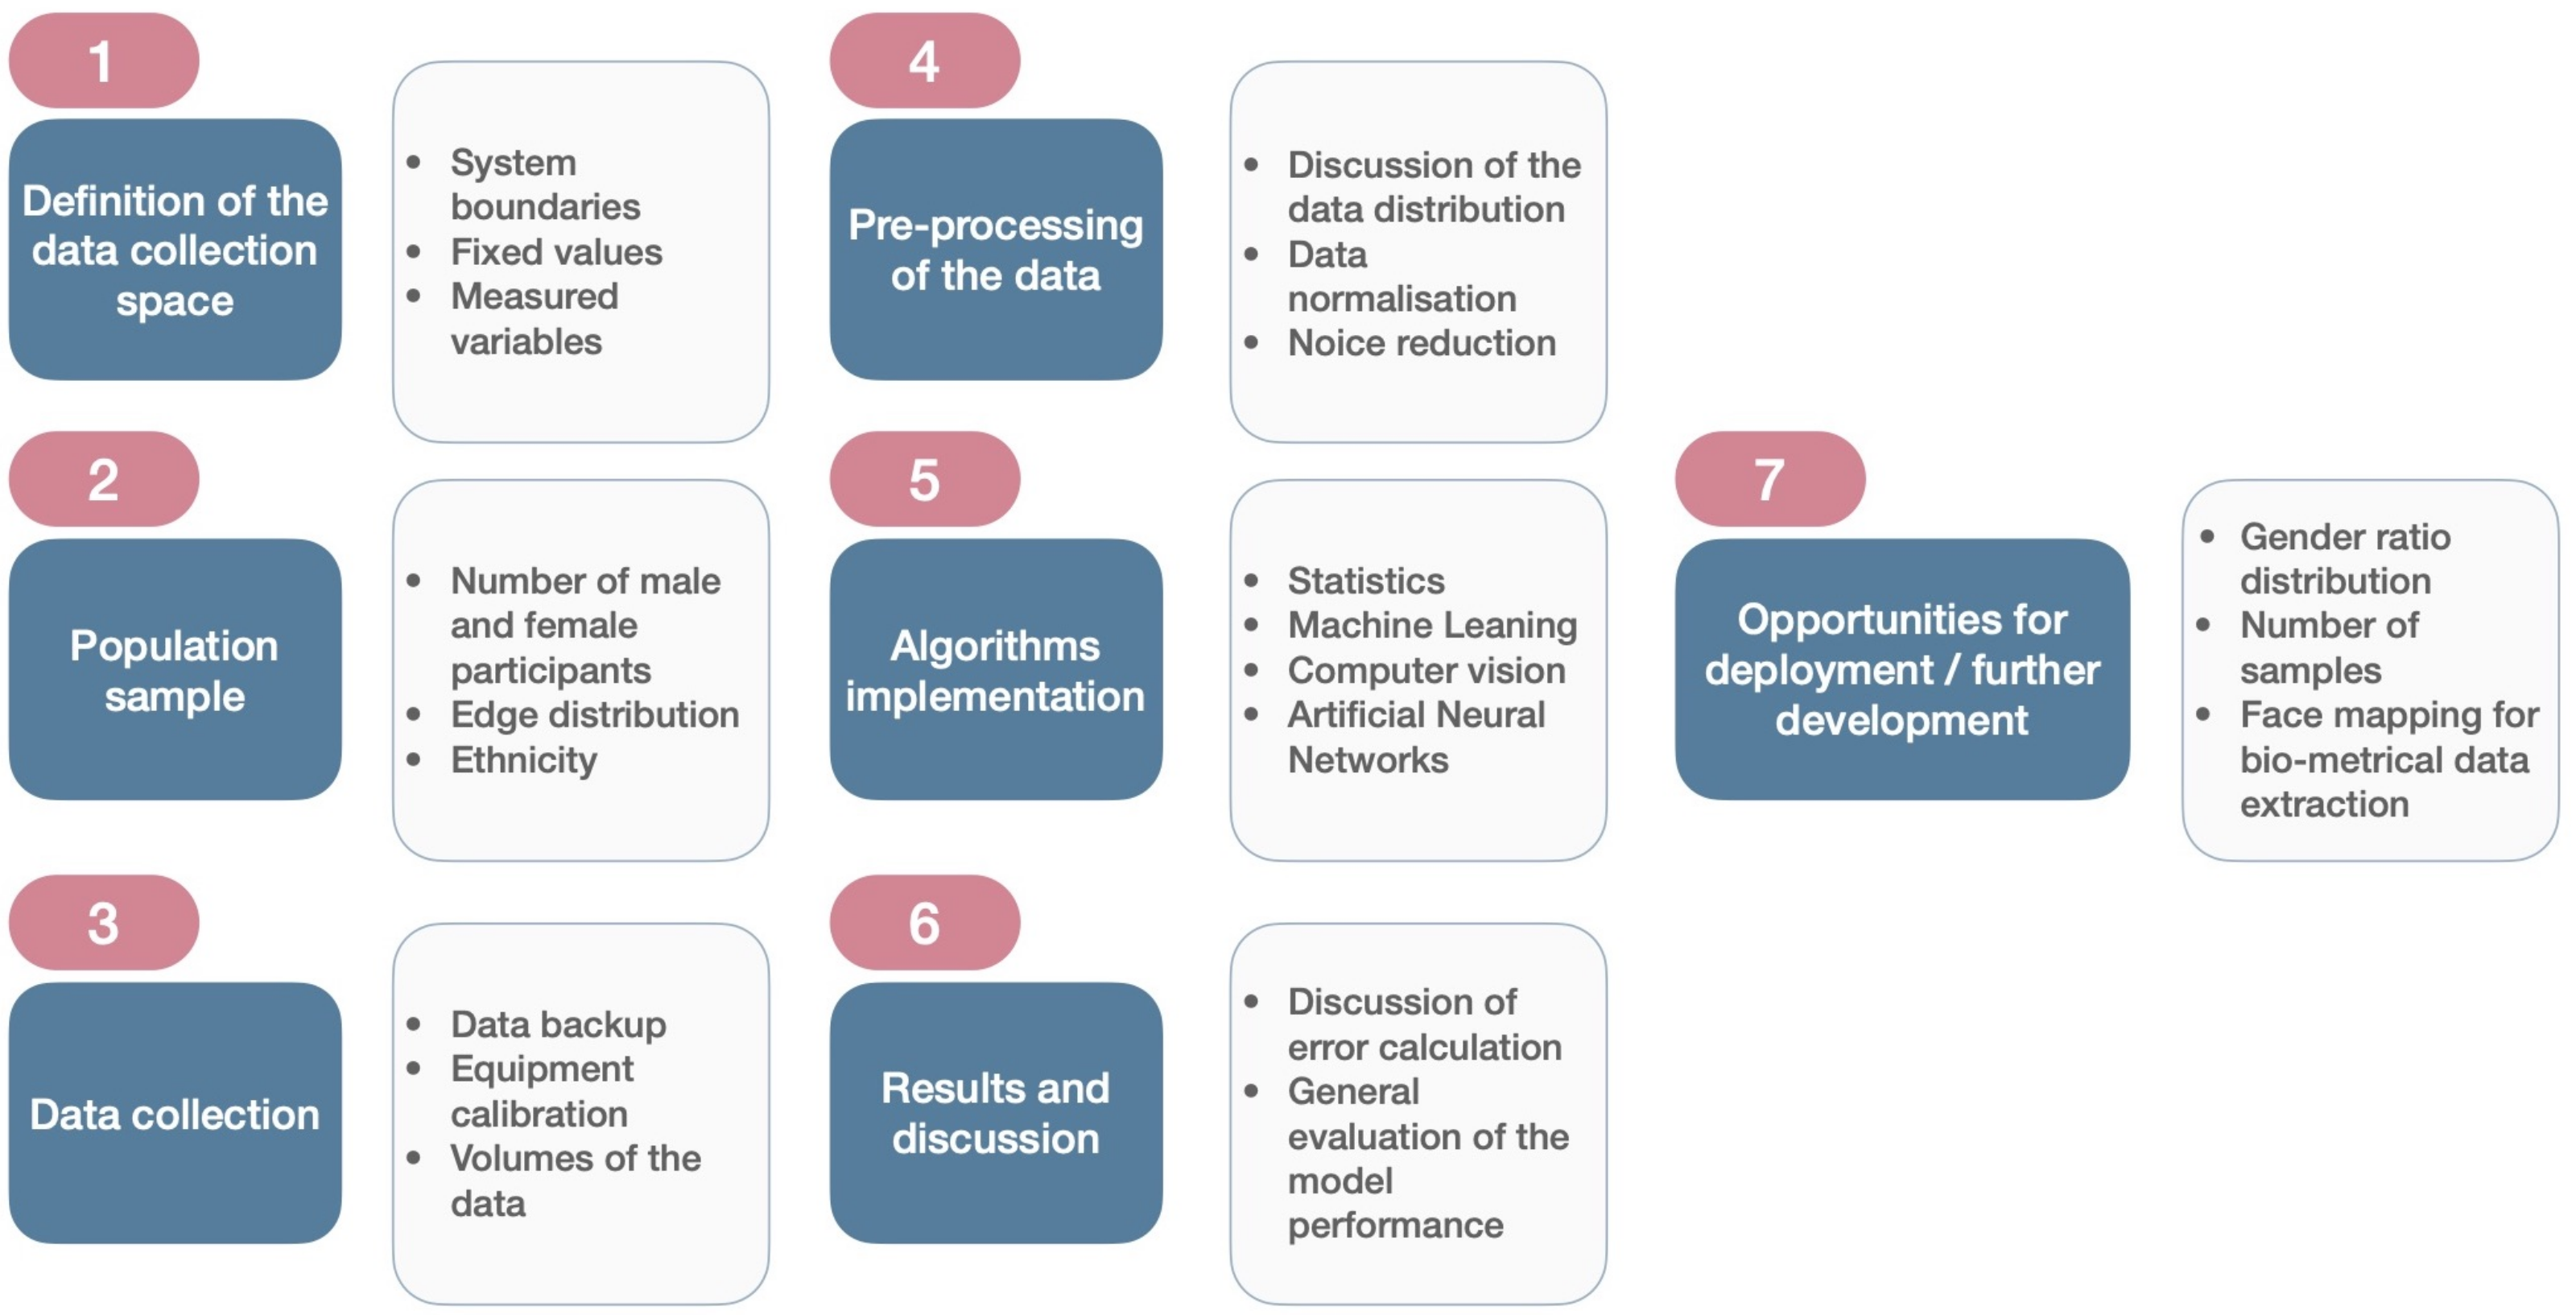
2. Methodology
- Definition of the review question;
- Systematic search and selection of the literature;
- -
- Definition of the framework;
- -
- Specification of the keywords;
- -
- Selection of the literature search engines;
- Quality evaluation;
- Selection and organization of the important information;
- Analysis of the collected data;
- Presentation and discussion of the results;
3. Results
4. Discussion
5. Conclusions
Author Contributions
Funding
Acknowledgments
Conflicts of Interest
Abbreviations
| PICOC | The Problem Intervention Comparison Outcome Context |
| PIOC | The Problem Intervention Outcome Context |
| PIO | The Problem Intervention Outcome |
| PRISMA | The Preferred Reporting Items for Systematic Reviews and Meta-Analyses |
| IEQ | Indoor Environment Quality |
| PPD | Predicted Percentage of Dissatisfied |
| PMV | Predicted Mean Vote |
| ANN | Artificial Neural Networks |
| ML | Machine Learning |
| HVAC | Heating, Ventilation and Air Conditioning |
| SLR | Systematic Literature Review |
| BMI | Body Mass Index |
| Oxygen sat. | Oxygen Saturation |
| SBP | Systolic Blood Pressure |
| DBP | Diastolic Blood Pressure |
| GSR | Galvanic Skin Response |
| EEG | Electroencephalogram |
| ECG | Electrocardiogram |
| SBF | Skin Blood Flow |
| SVM | Support Vector Machine |
| k-NN | K-Nearest Neighbors |
References
- Tanabe, S.I.; Haneda, M.; Nishihara, N. Workplace productivity and individual thermal satisfaction. Build. Environ. 2015, 91, 42–50. [Google Scholar] [CrossRef]
- Chadburn, A.; Smith, J.; Milan, J. Productivity drivers of knowledge workers in the central London office environment. J. Corp. Real Estate 2017. [Google Scholar] [CrossRef]
- Mulville, M.; Callaghan, N.; Isaac, D. The impact of the ambient environment and building configuration on occupant productivity in open-plan commercial offices. J. Corp. Real Estate 2016. [Google Scholar] [CrossRef]
- Haynes, B.P. Impact of workplace connectivity on office productivity. J. Corp. Real Estate 2008. [Google Scholar] [CrossRef]
- Akimoto, T.; Tanabe, S.i.; Yanai, T.; Sasaki, M. Thermal comfort and productivity-Evaluation of workplace environment in a task conditioned office. Build. Environ. 2010, 45, 45–50. [Google Scholar] [CrossRef]
- Baričič, A.; Salaj, A. The impact of office workspace on the satisfaction of employees and their overall health-research presentation. Zdr. Vestn. 2014, 83, 217–231. [Google Scholar]
- Salaj, A.T. The synergetic effect of the observer on the built environment. Urbani Izziv 2005, 16, 163–167. [Google Scholar] [CrossRef]
- Figueiredo, A.; Vicente, R.; Lapa, J.; Cardoso, C.; Rodrigues, F.; Kämpf, J. Indoor thermal comfort assessment using different constructive solutions incorporating PCM. Appl. Energy 2017, 208, 1208–1221. [Google Scholar] [CrossRef]
- Yang, L.; Yan, H.; Lam, J.C. Thermal comfort and building energy consumption implications—A review. Appl. Energy 2014, 115, 164–173. [Google Scholar] [CrossRef]
- Allab, Y.; Pellegrino, M.; Guo, X.; Nefzaoui, E.; Kindinis, A. Energy and comfort assessment in educational building: Case study in a French university campus. Energy Build. 2017, 143, 202–219. [Google Scholar] [CrossRef]
- Figueiredo, A.; Figueira, J.; Vicente, R.; Maio, R. Thermal comfort and energy performance: Sensitivity analysis to apply the Passive House concept to the Portuguese climate. Build. Environ. 2016, 103, 276–288. [Google Scholar] [CrossRef]
- Alfano, F.R.D.; Olesen, B.W.; Palella, B.I.; Riccio, G. Thermal comfort: Design and assessment for energy saving. Energy Build. 2014, 81, 326–336. [Google Scholar] [CrossRef]
- Jowkar, M.; Rijal, H.B.; Montazami, A.; Brusey, J.; Temeljotov-Salaj, A. The influence of acclimatization, age and gender-related differences on thermal perception in university buildings: Case studies in Scotland and England. Build. Environ. 2020, 179, 106933. [Google Scholar] [CrossRef]
- Marchenko, A.; Carlucci, S.; Pagliano, L.; Pietrobon, M.; Karlessi, T.; Santamouris, M.; Delaere, N.; Assimakopoulos, M. The assessment of the environmental quality directly perceived and experienced by the employees of 69 European offices. In Proceedings of the 10th Windsor Conference: Rethinking Comfort, Windsor, UK, 12–15 April 2018; pp. 1017–1028. [Google Scholar]
- Humphreys, M.A.; Nicol, J.F.; Raja, I.A. Field studies of indoor thermal comfort and the progress of the adaptive approach. Adv. Build. Energy Res. 2007, 1, 55–88. [Google Scholar] [CrossRef]
- Croitoru, C.; Nastase, I.; Bode, F.; Meslem, A.; Dogeanu, A. Thermal comfort models for indoor spaces and vehicles—Current capabilities and future perspectives. Renew. Sustain. Energy Rev. 2015, 44, 304–318. [Google Scholar] [CrossRef]
- Attia, S.; Hensen, J.L. Investigating the impact of different thermal comfort models for zero energy buildings in hot climates. In Proceedings of the 1st International Conference on Energy and Indoor Environment for Hot Climates, Doha, Qatar, 24–26 February 2014. [Google Scholar]
- Fanger, P.O. Thermal Comfort. Analysis and Applications in Environmental Engineering; Danish Technical Press: Copenhagen, Denmark, 1970. [Google Scholar]
- Standard, A. Standard 55-2010, Thermal Environmental Conditions for Human Occupancy; American Society of Heating, Refrigerating, and Air-Conditioning Engineers: Atlanta, GA, USA, 2010. [Google Scholar]
- ISO. ISO 7730:2005 Ergonomics of the Thermal Environment—Analytical determination and Interpretation of Thermal Comfort Using Calculation of the PMV and PPD Indices and Local Thermal Comfort Criteria; ISO: Geneva, Switzerland, 2005; p. 10. [Google Scholar]
- Yau, Y.; Chew, B. A review on predicted mean vote and adaptive thermal comfort models. Build. Serv. Eng. Res. Technol. 2014, 35, 23–35. [Google Scholar] [CrossRef]
- Yao, R.; Li, B.; Liu, J. A theoretical adaptive model of thermal comfort–Adaptive Predicted Mean Vote (aPMV). Build. Environ. 2009, 44, 2089–2096. [Google Scholar] [CrossRef]
- Nicol, J.F.; Humphreys, M. Understanding the adaptive approach to thermal comfort. ASHRAE Trans. 1998, 104, 991–1004. [Google Scholar]
- Nicol, F.; Humphreys, M.; Roaf, S. Adaptive The rmal Comfort: Principles and Practice; Routledge: Abingdon, UK, 2012. [Google Scholar]
- Cheng, Y.; Niu, J.; Gao, N. Thermal comfort models: A review and numerical investigation. Build. Environ. 2012, 47, 13–22. [Google Scholar] [CrossRef]
- Liu, W.; Lian, Z.; Zhao, B. A neural network evaluation model for individual thermal comfort. Energy Build. 2007, 39, 1115–1122. [Google Scholar] [CrossRef]
- Toronto, C.E.; Remington, R. A Step-by-Step Guide To Conducting an Integrative Review; Springer: Berlin, Germany, 2020. [Google Scholar]
- Gradeci, K.; Labonnote, N.; Sivertsen, E.; Time, B. The use of insurance data in the analysis of Surface Water Flood events—A systematic review. J. Hydrol. 2019, 568, 194–206. [Google Scholar] [CrossRef]
- Ueda, M.; Taniguchi, Y.; Aoki, H. A new method to predict the thermal sensation of an occupant using a neural network and its application to the automobile HVAC system. JSME Int. J. Ser. B Fluids Therm. Eng. 1997, 40, 166–174. [Google Scholar] [CrossRef][Green Version]
- Gwak, J.; Shino, M.; Ueda, K.; Kamata, M. Effects of changes in the thermal factor on arousal level and thermal comfort. In Proceedings of the 2015 IEEE International Conference on Systems, Man, and Cybernetics, Hong Kong, China, 9–12 October 2015; pp. 923–928. [Google Scholar]
- Cosma, A.C.; Simha, R. Machine learning method for real-time non-invasive prediction of individual thermal preference in transient conditions. Build. Environ. 2019, 148, 372–383. [Google Scholar] [CrossRef]
- Yang, Y.; Wu, W.; Fang, Q.; Zhu, X.; Zhang, R.; Wang, M. Research on Human Thermal Comfort Model Based on Multiple Physiological Parameters. In Advancements in Smart City and Intelligent Building, Proceedings of the International Conference on Smart City and Intelligent Building, Hefei, China, 16–16 September 2018; Springer: Singapore, 2018; pp. 11–21. [Google Scholar]
- Jin, Q.; Duanmu, L. Experimental study of thermal sensation and physiological response during step changes in non-uniform indoor environment. Sci. Technol. Built Environ. 2016, 22, 237–247. [Google Scholar] [CrossRef]
- Ghahramani, A.; Castro, G.; Becerik-Gerber, B.; Yu, X. Infrared thermography of human face for monitoring thermoregulation performance and estimating personal thermal comfort. Build. Environ. 2016, 109, 1–11. [Google Scholar] [CrossRef]
- Li, D.; Menassa, C.C.; Kamat, V.R. Non-intrusive interpretation of human thermal comfort through analysis of facial infrared thermography. Energy Build. 2018, 176, 246–261. [Google Scholar] [CrossRef]
- Ghahramani, A.; Castro, G.; Karvigh, S.A.; Becerik-Gerber, B. Towards unsupervised learning of thermal comfort using infrared thermography. Appl. Energy 2018, 211, 41–49. [Google Scholar] [CrossRef]
- Choi, J.H.; Yeom, D. Study of data-driven thermal sensation prediction model as a function of local body skin temperatures in a built environment. Build. Environ. 2017, 121, 130–147. [Google Scholar] [CrossRef]
- Salamone, F.; Belussi, L.; Currò, C.; Danza, L.; Ghellere, M.; Guazzi, G.; Lenzi, B.; Megale, V.; Meroni, I. Integrated method for personal thermal comfort assessment and optimization through users’ feedback, IoT and machine learning: A case study. Sensors 2018, 18, 1602. [Google Scholar] [CrossRef]
- Chaudhuri, T.; Zhai, D.; Soh, Y.C.; Li, H.; Xie, L. Random forest based thermal comfort prediction from gender-specific physiological parameters using wearable sensing technology. Energy Build. 2018, 166, 391–406. [Google Scholar] [CrossRef]
- Cheng, X.; Yang, B.; Tan, K.; Isaksson, E.; Li, L.; Hedman, A.; Olofsson, T.; Li, H. A Contactless Measuring Method of Skin Temperature based on the Skin Sensitivity Index and Deep Learning. Appl. Sci. 2019, 9, 1375. [Google Scholar] [CrossRef]
- Matalucci, B.; Phillips, K.; Walf, A.A.; Dyson, A.; Draper, J. An experimental design framework for the personalization of indoor microclimates through feedback loops between responsive thermal systems and occupant biometrics. Int. J. Archit. Comput. 2017, 15, 54–69. [Google Scholar] [CrossRef]
- Laftchiev, E.; Nikovski, D. An IoT system to estimate personal thermal comfort. In Proceedings of the 2016 IEEE 3rd World Forum on Internet of Things (WF-IoT), Reston, VA, USA, 12–14 December 2016; pp. 672–677. [Google Scholar]
- Chaudhuri, T.; Zhai, D.; Soh, Y.C.; Li, H.; Xie, L.; Ou, X. Convolutional neural network and kernel methods for occupant thermal state detection using wearable technology. In Proceedings of the 2018 International Joint Conference on Neural Networks (IJCNN), Rio de Janeiro, Brazil, 8–13 July 2018; pp. 1–8. [Google Scholar]
- Lee, H.M.; Cho, C.K.; Yun, M.H.; Lee, M.W. Development of a temperature control procedure for a room air-conditioner using the concept of just noticeable difference (JND) in thermal sensation. Int. J. Ind. Ergon. 1998, 22, 207–216. [Google Scholar] [CrossRef]
- Lopez, G.; Takahashi, K.; Nkurikiyeyezu, K.; Yokokubo, A. Development of a wearable thermo-conditioning device controlled by human factors based thermal comfort estimation. In Proceedings of the 2018 12th France-Japan and 10th Europe-Asia Congress on Mechatronics, Tsu, Japan, 10–12 September 2018; pp. 255–259. [Google Scholar]
- Lopez, G.; Tokuda, T.; Isoyama, N.; Hosaka, H.; Itao, K. Development of a wrist-band type device for low-energy consumption and personalized thermal comfort. In Proceedings of the 2016 11th France-Japan & 9th Europe-Asia Congress on Mechatronics (MECATRONICS)/17th International Conference on Research and Education in Mechatronics (REM), Compiegne, France, 15–17 June 2016; pp. 209–212. [Google Scholar]
- Wang, C.; Lee, H. Economical and Non-Invasive Residential Human Presence Sensing via Temperature Measurement. In ASME 2018 International Mechanical Engineering Congress and Exposition; American Society of Mechanical Engineers Digital Collection: New York, NY, USA, 2018. [Google Scholar]
- Vesely, M.; Zeiler, W. Fingertip temperature as a control signal for personalized heating. In Proceedings of the 13th International Conference on Indoor Air Quality and Climate (Indoor Air 2014), Hong Kong, China, 7–12 June 2014; pp. 464–470. [Google Scholar]
- Li, W.; Zhang, J.; Zhao, T. Indoor thermal environment optimal control for thermal comfort and energy saving based on online monitoring of thermal sensation. Energy Build. 2019, 197, 57–67. [Google Scholar] [CrossRef]
- Lu, S.; Cochran Hameen, E. Integrated IR Vision Sensor for Online Clothing Insulation Measurement. In Proceedings of the 23rd International Conference of the Association for Computer-Aided Architectural Design Research in Asia (CAADRIA), Beijing, China, 17–19 May 2018; Volume 1, pp. 565–573. [Google Scholar]
- Barrios, L.; Kleiminger, W. The Comfstat-automatically sensing thermal comfort for smart thermostats. In Proceedings of the 2017 IEEE International Conference on Pervasive Computing and Communications (PerCom), Kona, HI, USA, 13–17 March 2017; pp. 257–266. [Google Scholar]
- Cosma, A.C.; Simha, R. Thermal comfort modeling in transient conditions using real-time local body temperature extraction with a thermographic camera. Build. Environ. 2018, 143, 36–47. [Google Scholar] [CrossRef]
- Lu, S.; Wang, W.; Wang, S.; Cochran Hameen, E. Thermal Comfort-Based Personalized Models with Non-Intrusive Sensing Technique in Office Buildings. Appl. Sci. 2019, 9, 1768. [Google Scholar] [CrossRef]
- Burzo, M.; Abouelenien, M.; Pérez-Rosas, V.; Wicaksono, C.; Tao, Y.; Mihalcea, R. Using infrared thermography and biosensors to detect thermal discomfort in a building’s inhabitants. In ASME 2014 International Mechanical Engineering Congress and Exposition; American Society of Mechanical Engineers Digital Collection: New York, NY, USA, 2014. [Google Scholar]
- Katić, K.; Li, R.; Verhaart, J.; Zeiler, W. Neural network based predictive control of personalized heating systems. Energy Build. 2018, 174, 199–213. [Google Scholar] [CrossRef]
- Zhai, D.; Chaudhuri, T.; Soh, Y.C. Energy efficiency improvement with k-means approach to thermal comfort for ACMV systems of smart buildings. In Proceedings of the 2017 Asian Conference on Energy, Power and Transportation Electrification (ACEPT), Singapore, 24–26 October 2017; pp. 1–6. [Google Scholar]
- Cheng, X.; Yang, B.; Olofsson, T.; Liu, G.; Li, H. A pilot study of online non-invasive measuring technology based on video magnification to determine skin temperature. Build. Environ. 2017, 121, 1–10. [Google Scholar] [CrossRef]
- Pavlin, B.; Carabin, G.; Pernigotto, G.; Gasparella, A.; Vidoni, R. An Embedded Mechatronic Device for Real-Time Monitoring and Prediction of Occupants’ Thermal Comfort. In ASME 2018 International Mechanical Engineering Congress and Exposition; American Society of Mechanical Engineers Digital Collection: New York, NY, USA, 2018. [Google Scholar]
- Jazizadeh, F.; Kavulya, G.; Klein, L.; Becerik-Gerber, B. Continuous sensing of occupant perception of indoor ambient factors. In Computing in Civil Engineering (2011), Proceedings of the 2011 ASCE International Workshop on Comupting in Civil Engineering, Miami, FL, USA, 19–22 June 2011; American Society of Civil Engineers: Reston, VA, USA, 2011; pp. 161–168. [Google Scholar]
- Mitchell, T.M. Machine Learning; McGraw Hill: New York, NY, USA, 1997. [Google Scholar]
- Bennett, K.P.; Campbell, C. Support vector machines: Hype or hallelujah? ACM SIGKDD Explor. Newsl. 2000, 2, 1–13. [Google Scholar] [CrossRef]
- Geurts, P.; Ernst, D.; Wehenkel, L. Extremely randomized trees. Mach. Learn. 2006, 63, 3–42. [Google Scholar] [CrossRef]
- Alpaydin, E. Introduction to Machine Learning; MIT Press: Cambridge, MA, USA, 2020. [Google Scholar]
- Richter, M.M.; Weber, R.O. Case-Based Reasoning; Springer: Berlin, Germany, 2016. [Google Scholar]
- Goodfellow, I.; Bengio, Y.; Courville, A. Deep Learning; MIT Press: Cambridge, MA, USA, 2016. [Google Scholar]
- Špelić, I.; Mihelić-Bogdanić, A.; Šajatović, A.H. Standard Methods for Thermal Comfort Assessment of Clothing; CRC Press: Boca Raton, FL, USA, 2019. [Google Scholar]


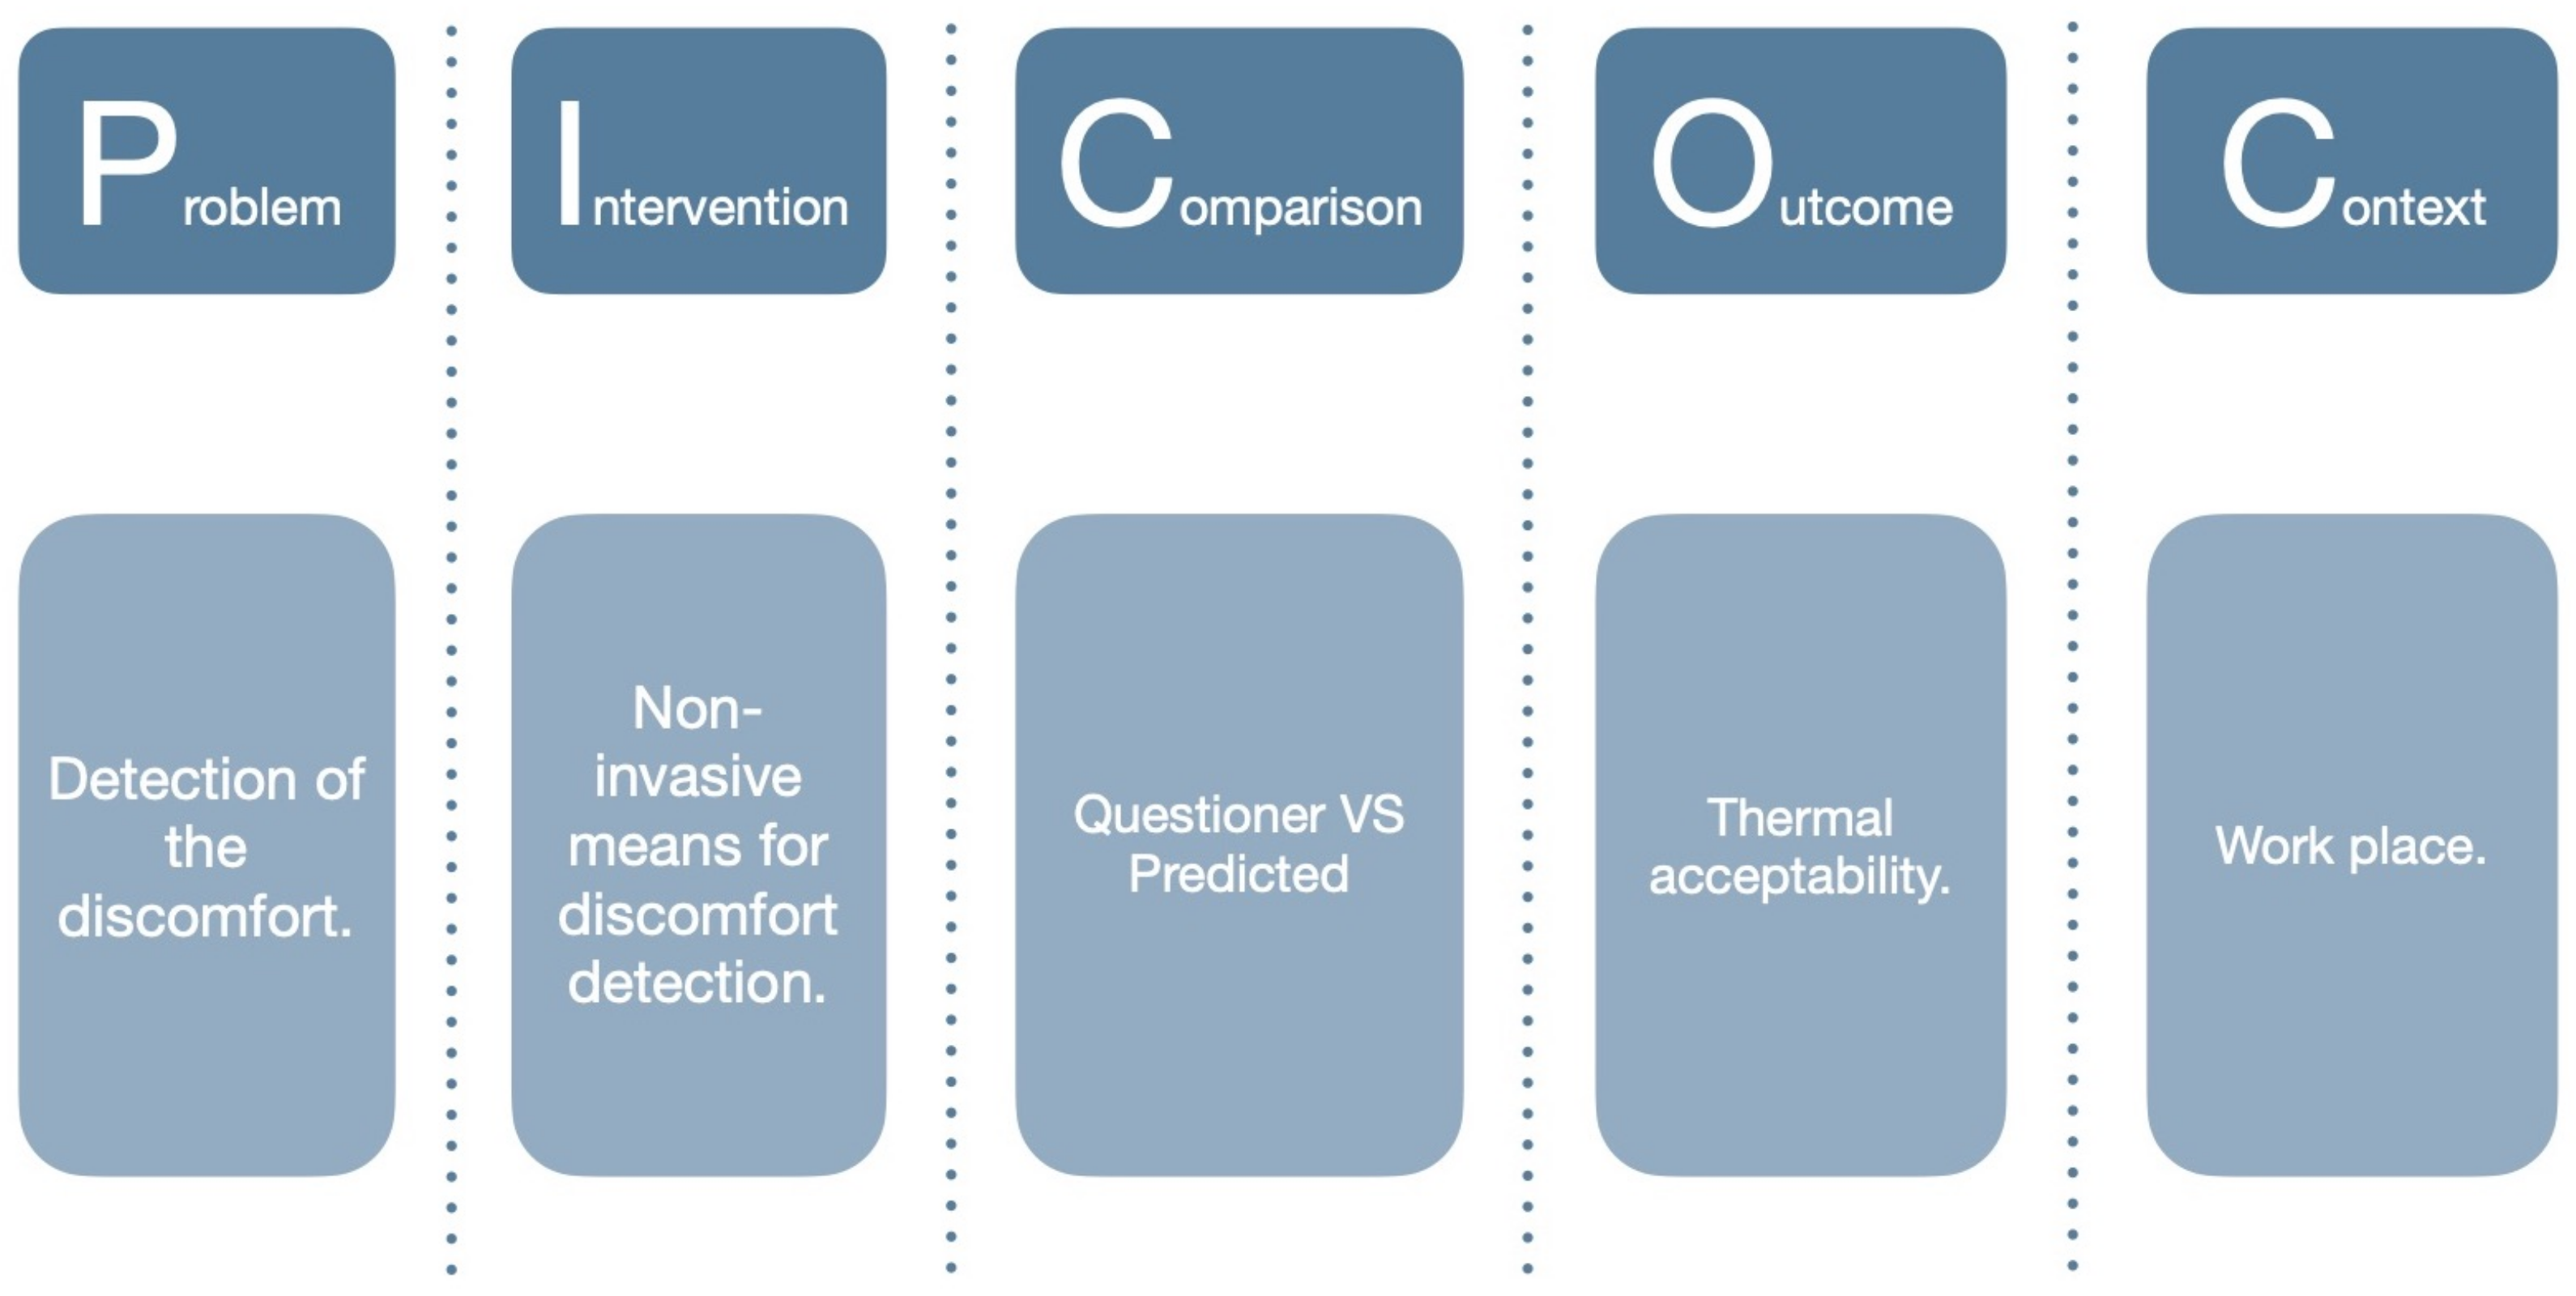
| Problem | Intervention | Comparison | Outcome(s) | Context | |
|---|---|---|---|---|---|
| Who? | What or How? | Compared to what? | What is going to be accomplished? | In what kind of circumstances? | |
| Keywords | Discomfort | Non-invasive | Questionnaire | HVAC | Workplace |
| Thermal stress | Biometr | Survey | Control signal | Work place | |
| Thermal strain | Physiological response | Audit | Indoor environment | Work space | |
| Thermal tolerance | Physiological state | Preliminary studies | Personalized control system | Work unit | |
| Acceptability | Biosensor | Personal comfort model | Work units | ||
| Thermal sensation | Bio-sensor | Personal thermal comfort | Office | ||
| Thermal preference | Biosignal | Building control | Commercial building | ||
| Thermal comfort | Bio-signal | Building management system | Desktop | ||
| Human response | Wearable | Energy efficiency | Built environment | ||
| Human reaction | Sensing | Heating | Building | ||
| Thermal state | Skin temperature | Cooling | Construction | ||
| Duty activities | Remote sensor | Thermal-conditioning | |||
| Non-intrusive | Productivity | ||||
| Sensor fusion | Indoor environmental quality | ||||
| Contactless | Indoor clima | ||||
| Building automation |
| Tag Words Used (Web of Science) | Tag Words Used (Scopus) | Tag Words Used (Engineering Village) | |
| PIOC | TS = ((“Discomfort” OR “thermal stress” OR “thermal strain” OR “thermal tolerance” OR “acceptability” OR “Thermal sensation” OR “Thermal preference” OR “Thermal comfort” OR “human response” OR “Human reaction” OR “thermal state” OR “duty activities”) AND (“Non-invasive” OR "Biometr*” OR “Physiological response” OR “Physiological state” OR “Biosensor” OR “Bio-sensor” OR “Biosignal” OR “Bio-signal” OR “wearable” OR “sensing” OR “skin temperature” OR “remote sensor” OR “non-intrusive”) AND (“HVAC” OR “Control signal” OR “Indoor environment” OR “personalized control system” OR “personalised control system” OR “personal comfort model” OR “personal thermal comfort” OR “building control” OR “building management system” OR “energy efficiency” OR “heating” OR “cooling” OR “thermal-conditioning” OR “productivity” OR “Indoor environmental quality” OR “indoor clima” OR “Building automation”) AND (“Workplace” OR “Work place” OR “Work unit” OR “Work units” OR “Office” OR “Commercial building” OR “Desktop” OR “built environment” OR “building” OR “construction”)) Indexes=SCI-EXPANDED, SSCI, A&HCI, CPCI-S, CPCI-SSH, ESCI Timespan=All years | TITLE-ABS-KEY ( ( “Discomfort” OR “thermal stress” OR “thermal strain” OR “thermal tolerance” OR “acceptability” OR “Thermal sensation” OR “Thermal preference” OR “Thermal comfort” OR “human response” OR “Human reaction” OR “thermal state” OR “duty activities” ) AND (“Non-invasive” OR “Biometr*” OR “Physiological response” OR “Physiological state” OR “Biosensor” OR “Bio-sensor” OR “Biosignal” OR “Bio-signal” OR “wearable” OR “sensing” OR “skin temperature” OR “remote sensor” OR “non-intrusive” ) AND (“HVAC” OR “Control signal” OR “Indoor environment” OR “personalized control system” OR “personalised control system” OR “personal comfort model” OR “personal thermal comfort” OR “building control” OR “building management system” OR “energy efficiency” OR “heating” OR “cooling” OR “thermal-conditioning” OR “productivity” OR “Indoor environmental quality” OR “indoor clima” OR “Building automation”) AND (“Workplace” OR “Work place” OR “Work unit” OR “Work units” OR “Office” OR “Commercial building” OR “Desktop” OR “built environment” OR “building” OR “construction”)) | ((“Discomfort” OR “thermal stress” OR “thermal strain” OR “thermal tolerance” OR “acceptability” OR “Thermal sensation” OR “Thermal preference” OR “Thermal comfort” OR “human response” OR “Human reaction” OR “thermal state” OR “duty activities”) AND (“Non-invasive” OR “Biometr*” OR “Physiological response” OR “Physiological state” OR “Biosensor” OR “Bio-sensor” OR “Biosignal” OR “Bio-signal” OR “wearable” OR “sensing” OR “skin temperature” OR “remote sensor” OR “non-intrusive”) AND (“HVAC” OR “Control signal” OR “Indoor environment” OR “personalized control system” OR “personalised control system” OR“personal comfort model” OR “personal thermal comfort” OR “building control” OR “building management system” OR “energy efficiency” OR “heating” OR “cooling” OR “thermal-conditioning” OR “productivity” OR “Indoor environmental quality” OR “indoor clima” OR “Building automation”) AND (“Workplace” OR “Work place” OR “Work unit” OR “Work units” OR “Office” OR “Commercial building” OR “Desktop” OR “built environment” OR “building” OR “construction”)) |
| Tag Words Used (Web of Science) | Tag Words Used (Scopus) | Tag Words Used (Engineering Village) | |
| PIO | TS = ((“Discomfort” OR “thermal stress” OR “thermal strain” OR “thermal tolerance” OR “acceptability” OR “Thermal sensation” OR “Thermal preference” OR “Thermal comfort” OR “human response” OR “Human reaction” OR “thermal state” OR “duty activities”) AND (“Non-invasive” OR “Biometr*” OR “Physiological response” OR “Physiological state“ OR “Biosensor” OR “Bio-sensor” OR “Biosignal” OR “Bio-signal” OR “wearable” OR “sensing” OR “skin temperature” OR “remote sensor” OR “non-intrusive”) AND (“HVAC” OR “Control signal” OR “Indoor environment” OR “personalized control system” OR “personalised control system” OR“personal comfort model” OR “personal thermal comfort” OR “building control” OR “building management system” OR “energy efficiency” OR “heating” OR “cooling” OR “thermal-conditioning” OR “productivity” OR “Indoor environmental quality” OR “indoor clima” OR “Building automation”)) Indexes=SCI-EXPANDED, SSCI, A&HCI, CPCI-S, CPCI-SSH, ESCI Timespan=All years | TITLE-ABS-KEY ((“Discomfort” OR “thermal stress” OR “thermal strain” OR “thermal tolerance” OR “acceptability” OR “Thermal sensation” OR “Thermal preference” OR “Thermal comfort” OR “human response” OR “Human reaction” OR “thermal state” OR “duty activities”) AND (“Non-invasive” OR “Biometr*” OR “Physiological response” OR “Physiological state” OR “Biosensor” OR “Bio-sensor” OR “Biosignal” OR “Bio-signal” OR “wearable” OR “sensing” OR “skin temperature” OR “remote sensor” OR “non-intrusive” ) AND (“HVAC” OR “Control signal” OR “Indoor environment” OR “personalized control system” OR “personalised control system” OR “personal comfort model” OR “personal thermal comfort” OR “building control” OR “building management system” OR “energy efficiency” OR “heating” OR “cooling” OR “thermal-conditioning” OR “productivity” OR “Indoor environmental quality” OR “indoor clima” OR “Building automation” ) ) | ((((“Discomfort” OR “thermal stress” OR “thermal strain” OR “thermal tolerance” OR “acceptability” OR “Thermal sensation” OR “Thermal preference” OR “Thermal comfort” OR “human response” OR “Human reaction” OR “thermal state” OR “duty activities”) AND (“Non-invasive” OR “Biometr*” OR “Physiological response” OR “Physiological state” OR “Biosensor” OR “Bio-sensor” OR “Biosignal” OR “Bio-signal” OR “wearable” OR “sensing” OR “skin temperature” OR “remote sensor” OR “non-intrusive”) AND (“HVAC” OR “Control signal” OR “Indoor environment” OR “personalized control system” OR “personalised control system” OR“personal comfort model” OR “personal thermal comfort” OR “building control” OR “building management system” OR “energy efficiency” OR “heating” OR “cooling” OR “thermal-conditioning” OR “productivity” OR “Indoor environmental quality” OR “indoor clima” OR “Building automation”))) WN All fields) |
| PIOC | PIO | Step | ||||||||||
|---|---|---|---|---|---|---|---|---|---|---|---|---|
| Web of Science | Scopus | Engineering Village | Web of Science | Scopus | Engineering Village | |||||||
| Identification | 114 | 212 | 250 | 529 | 996 | 675 | All literature | |||||
| 114 | 191 | 239 | 523 | 936 | 627 | 1st exclusion criterion | ||||||
| 544 | 2086 | All together | ||||||||||
| 306 | 1175 | Duplicates filtered | ||||||||||
| PIOC + PIO | ||||||||||||
| Screening | 1481 | All | ||||||||||
| 1154 | Duplicates | |||||||||||
| 207 | 2nd exclusion criterion | |||||||||||
| 83 | 3rd exclusion criterion | |||||||||||
| Eligibility | ||||||||||||
| 35 | 4th exclusion criterion | |||||||||||
| Reference | Bio-Data Collected among Studies | ||||||||||||
|---|---|---|---|---|---|---|---|---|---|---|---|---|---|
| Skin Temp. | BMI | Pulse | Sweat Rate | Oxygen Sat. | SBP | DBP | GSR | EEG | ECG | SBF | Facial Temp. | Facial Zones | |
| Cheng et al. [40] | YES | YES | - | - | - | - | - | - | - | - | - | - | - |
| Ueda et al. [29] | - | - | - | - | - | - | - | - | - | - | - | YES | measured at 7 points |
| Matalucci et al. [41] | YES | - | YES | - | - | - | - | - | YES | YES | - | - | - |
| Laftchiev and Nikovski [42] | YES | - | YES | - | - | - | - | YES | - | - | - | - | - |
| Chaudhuri et al. [43] | YES | YES | YES | - | YES | YES | YES | - | - | - | - | - | - |
| Lee et al. [44] | YES | - | - | - | - | - | - | - | - | - | - | - | - |
| Lopez et al. [45] | - | - | YES | - | - | - | - | - | - | - | - | - | - |
| Lopez et al. [46] | YES | - | - | - | - | - | - | - | - | - | - | - | - |
| Wang and Lee [47] | YES | - | - | - | - | - | - | - | - | - | - | - | - |
| Gwak et al. [30] | YES | - | - | - | - | - | - | - | YES | YES | - | - | - |
| Jin and Duanmu [33] | - | - | - | - | - | - | - | - | - | - | - | YES | - |
| Vesely and Zeiler [48] | YES | - | - | - | - | - | - | - | - | - | - | - | - |
| Li et al. [49] | YES | - | YES | - | - | - | - | - | - | - | - | - | - |
| Ghahramani et al. [34] | YES | - | - | - | - | - | - | - | - | - | YES | YES | ear, nose, front face, cheekbone |
| Lu and Cochran Hameen [50] | YES | - | - | - | - | - | - | - | - | - | - | - | - |
| Salamone et al. [38] | YES | - | YES | - | - | - | - | - | - | - | - | - | - |
| Cosma and Simha [31] | YES | YES | - | - | - | - | - | - | - | - | - | - | - |
| Li et al. [35] | - | - | - | - | - | - | - | - | - | - | - | YES | - |
| Chaudhuri et al. [39] | YES | - | YES | - | YES | - | - | - | - | - | - | - | - |
| Yang et al. [32] | YES | - | YES | YES | - | - | - | YES | - | - | - | - | - |
| Choi and Yeom [37] | YES | - | - | - | - | - | - | - | - | - | - | - | - |
| Barrios and Kleiminger [51] | - | - | YES | - | - | - | - | - | - | - | - | - | - |
| Cosma and Simha [52] | YES | - | - | - | - | - | - | - | - | - | - | - | - |
| Lu et al. [53] | YES | - | - | - | - | - | - | - | - | - | - | - | - |
| Ghahramani et al. [36] | - | - | - | - | - | - | - | - | - | - | - | YES | nose, ear, front of face, cheekbone |
| Burzo et al. [54] | YES | - | YES | - | - | - | - | - | - | - | - | - | - |
© 2020 by the authors. Licensee MDPI, Basel, Switzerland. This article is an open access article distributed under the terms and conditions of the Creative Commons Attribution (CC BY) license (http://creativecommons.org/licenses/by/4.0/).
Share and Cite
Marchenko, A.; Temeljotov-Salaj, A. A Systematic Literature Review of Non-Invasive Indoor Thermal Discomfort Detection. Appl. Sci. 2020, 10, 4085. https://doi.org/10.3390/app10124085
Marchenko A, Temeljotov-Salaj A. A Systematic Literature Review of Non-Invasive Indoor Thermal Discomfort Detection. Applied Sciences. 2020; 10(12):4085. https://doi.org/10.3390/app10124085
Chicago/Turabian StyleMarchenko, Alla, and Alenka Temeljotov-Salaj. 2020. "A Systematic Literature Review of Non-Invasive Indoor Thermal Discomfort Detection" Applied Sciences 10, no. 12: 4085. https://doi.org/10.3390/app10124085
APA StyleMarchenko, A., & Temeljotov-Salaj, A. (2020). A Systematic Literature Review of Non-Invasive Indoor Thermal Discomfort Detection. Applied Sciences, 10(12), 4085. https://doi.org/10.3390/app10124085