Article

Seismic Fragility of Ordinary Reinforced Concrete Shear Walls with Coupling Beams Designed Using a Performance-Based Procedure

1
Industry-Academic Cooperation Foundation, Incheon National University, Incheon 22012, Korea
2
Division of Architecture and Urban Design, Incheon National University, Incheon 22012, Korea
*
Author to whom correspondence should be addressed.
Appl. Sci. 2020, 10(12), 4075; https://doi.org/10.3390/app10124075
Submission received: 23 April 2020 / Revised: 29 May 2020 / Accepted: 7 June 2020 / Published: 12 June 2020
(This article belongs to the Special Issue Advances on Structural Engineering)

Abstract

:
The seismic performance of ordinary reinforced concrete shear walls, that are commonly used in high-rise residential buildings in Korea (h < 60 m), but are prohibited for tall buildings (h ≥ 60 m), is evaluated in this research project within the framework of collapse probability. Three bidimensional analytical models comprised of both coupled and uncoupled shear walls exceeding 60 m in height were designed using nonlinear dynamic analysis in accordance with Korean performance-based seismic design guidelines. Seismic design based on nonlinear dynamic analysis was performed using different shear force amplification factors in order to determine an appropriate factor. Then, an incremental dynamic analysis was performed to evaluate collapse fragility in accordance with the (Federal Emergency Management Agency) FEMA P695 procedure. Four engineering demand parameters including inter-story drift, plastic hinge rotation angle, concrete compressive strain and shear force were introduced to investigate the collapse probability of the designed analytical models. For all analytical models, flexural failure was the primary failure mode but shear force amplification factors played an important role in order to meet the requirement on collapse probability. High-rise ordinary reinforced concrete shear walls designed using seven pairs of ground motion components and a shear force amplification factor ≥ 1.2 were adequate to satisfy the criteria on collapse probability and the collapse margin ratio prescribed in FEMA P695.

1. Introduction

Performance-based seismic design has been applied to high-rise buildings increasingly in South Korea as well as the USA, owing to progress in nonlinear structural analysis techniques and relevant design guidelines. In Korean Building Code (KBC) 2016, the performance-based seismic design is introduced for the first time and defined as a design method to achieve performance objectives using nonlinear analysis considering inelastic deformation capacity and the over-strength of structures more precisely, and it can be applied to structures in which the design coefficients for elastic design are uncertain or structures required to meet various performance objectives [1]. In South Korea, performance-based seismic design is mostly applied to high-rise apartment buildings in which ordinary reinforced concrete (RC) shear walls are used to resist seismic forces. This is because ordinary RC shear walls are not permitted in the elastic design for buildings that belong to seismic design category D and are taller than 60 m. For such conditions, special RC shear walls are used, but strict confinement details are required in boundary elements with a side effect of higher construction cost and time. The “boundary element” designate longitudinal end in the cross section of walls where hoop reinforcement is located to confine concrete in high compression. The special RC wall is avoided, particularly in case of thin walls because the spacing of the hoop reinforcement required to be smaller than one third of the wall thickness, and this requirement causes difficulty in the detailing work and concrete placing in an actual construction field. In order to solve this problem, high-rise ordinary RC shear walls are used, using the performance-based seismic design procedure introduced in KBC 2016. The detailed guidelines for the performance-based seismic design are given in “Guidelines for Performance-Based Seismic Design of Residential Buildings” published by the Architectural Institute of Korea (AIK) [2].
Although nonlinear dynamic analysis is used for the detailed verification of seismic performance, it is necessary to verify the structural safety of high-rise ordinary RC shear walls, because such walls are subjected to relatively high axial force ratios, which can lead to brittle failure mode due to the lack of confinement in the boundary elements. In accordance with AIK guidelines, nonlinear response history analyses are conducted using seven pairs of horizontal ground motion components within the framework of performance-based seismic design. However, mean peak response-based design without strength reduction factors for a limited number of ground motion records are questionable in respect to reliability. Representative guidelines on the reliability of seismic design are found in (American Society of Civil Engineers) ASCE 7–16, in which a target reliability for structural stability against earthquakes is proposed as 10% in the case of seismic risk category I and II [3]. FEMA P695 provides a verification methodology for seismic design coefficients in respect to structural stability based on incremental dynamic analysis, by which structures are analyzed repeatedly for earthquakes with increasing intensity measures until structural collapse is identified [4].
Recently, diverse studies have been conducted to assess the seismic fragility of the RC shear wall. In the study of Chun et al. (2013) [5], seismic fragility analysis was carried out for both ordinary and special RC shear walls, among which some specimens have simplified confinement details for boundary elements. However, their work presents only RC walls with boundary elements in detail. Gogus and Wallace (2015) [6,7] and Rafie Nazari (2017) [8] evaluated the seismic performance of building frame systems, of which the core walls are ordinary or special RC shear walls. Above all, analytical models for buildings in their research have at most 12 and 10 stories, respectively, which are not so high-risen compared to Korean apartment buildings over 60 m designed in a performance-based methodology. Therefore, existing studies on the seismic performance of bearing wall systems consisting of ordinary RC shear walls over 60 m-tall height are insufficient. In addition, existing studies address shear walls designed using the ultimate strength design method based on elastic analysis rather than the performance-based design based on nonlinear analysis.
In this study, the seismic fragility assessment of high-rise ordinary RC shear walls over 60 m designed through performance-based seismic design is conducted to verify whether those structures have adequate collapse margin ratios. The evaluation of the collapse fragility curve and the assessment of collapse prevention performance are conducted in accordance with FEMA P695. The procedure of FEMA P695 is intended to verify the seismic design coefficients, such as response modification factors and over-strength factors and displacement amplification factors. However, the procedure can be applied to any structure that can be grouped as a single category, such as ordinary RC shear walls higher than 60 m designed in accordance with a single design document. Therefore, three analytical models composed of ordinary RC shear walls typical in South Korea but with different heights are designed in accordance with the AIK guidelines using nonlinear response history analysis using seven pairs of horizontal ground motion components. Then, incremental dynamic analysis (IDA) is performed for those structures using 30 ground motion pairs to calculate the collapse fragility curve. Finally, criteria on the conditional collapse probability and the collapse margin ratio (CMR) are evaluated in accordance with FEMA P695.

2. Design of Analytical Models

2.1. Structure

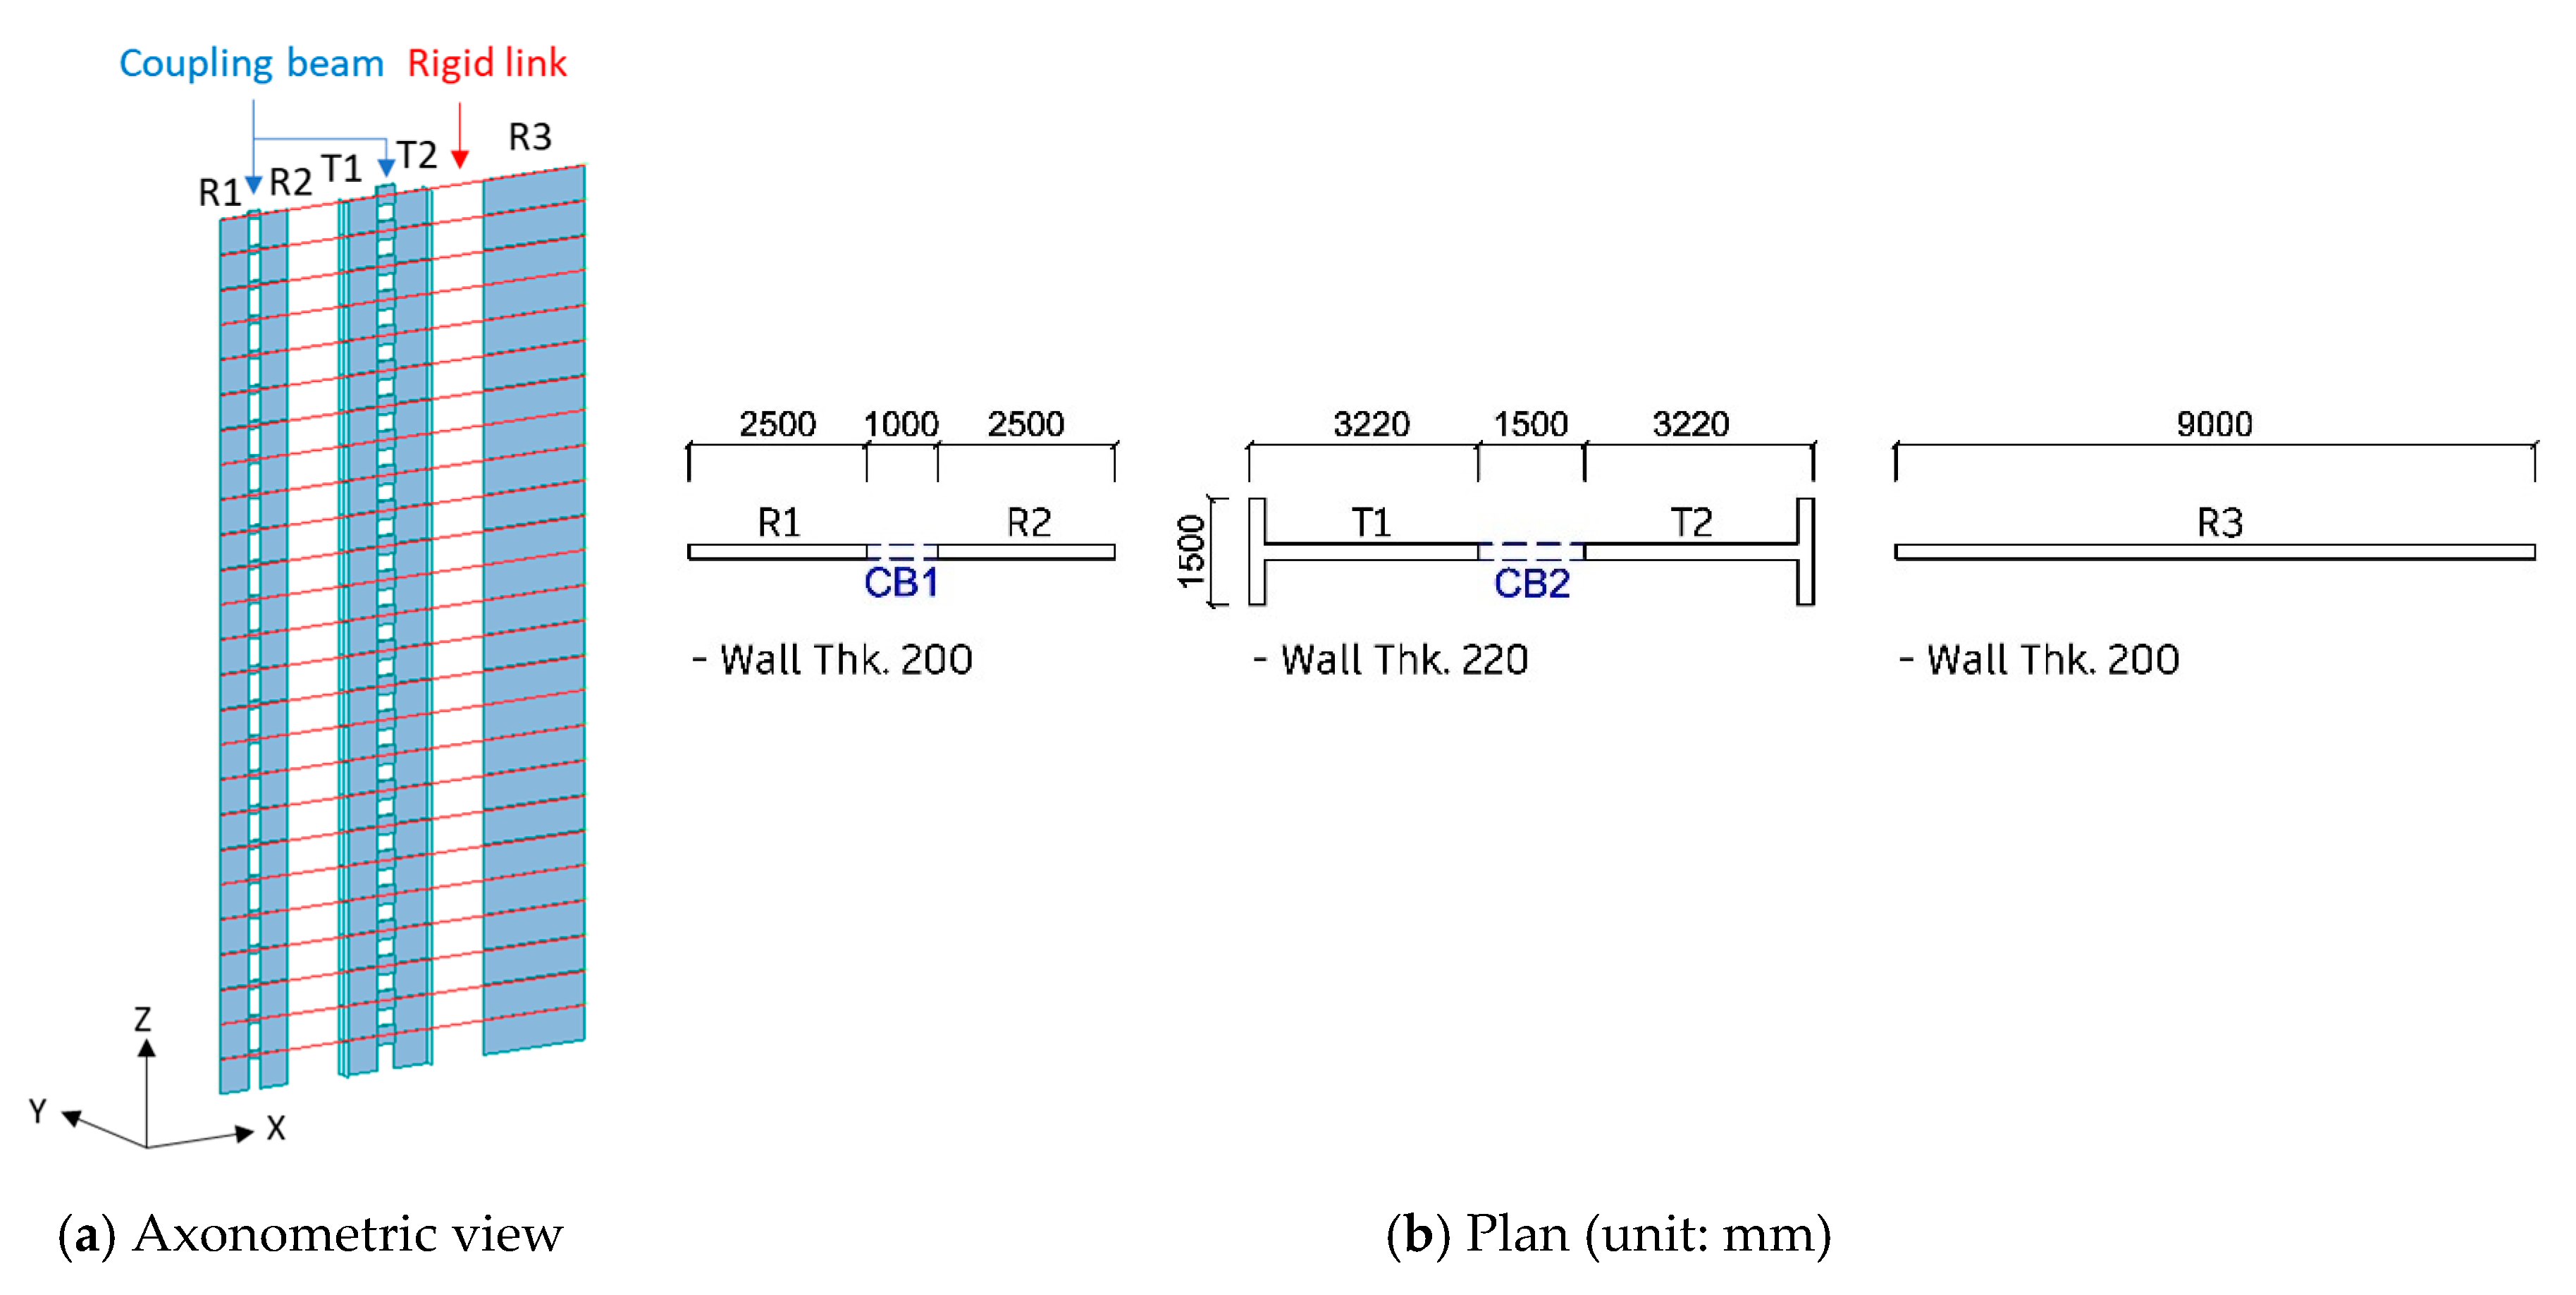
High-rise ordinary shear wall structures were idealized using two-dimensional plane models. A total of three models denoted by Model A, Model B, and Model C are constructed, designed and evaluated. Figure 1a,b show the three-dimensional view and plan of the Model A. The model is composed of five walls, of which R1 and R2 are coupled shear walls with a rectangular cross section, R3 is a single wall with a rectangular cross section, and T1 and T2 are coupled shear walls with a T-shaped cross section as illustrated in Figure 1a,b. CB1 and CB2 represent coupling beams. Those five walls are connected with rigid links (red line), which constrain only the translational degree of freedom in the X-direction. The length of coupling beams CB1 and CB2 in Figure 1b is 1 m and 1.5 m, respectively, reflecting the width of doors and windows. The depth of those coupling beams is set to 0.6 m and 1.2 m, respectively. The width of the coupling beam is the same as the thickness of the adjacent walls. The dimensions of coupling beams are common among the three analytical models. Table 1 represents the characteristics of the three models.
Model B and C have the same configuration as Model A, but the detailed dimensions are slightly different from each other. Height, cross sectional shapes and dimensions for the component walls comprising each model were determined based on typical actual apartment buildings in South Korea and listed with other characteristics in Table 1. The height of Model A, B and C is 70 m (25 floors), 81.2 m (29 floors), and 109.2 m (39 floors), respectively. The height of all of the three models exceeds the upper limit 60 m, below which the ordinary shear walls are acceptable.
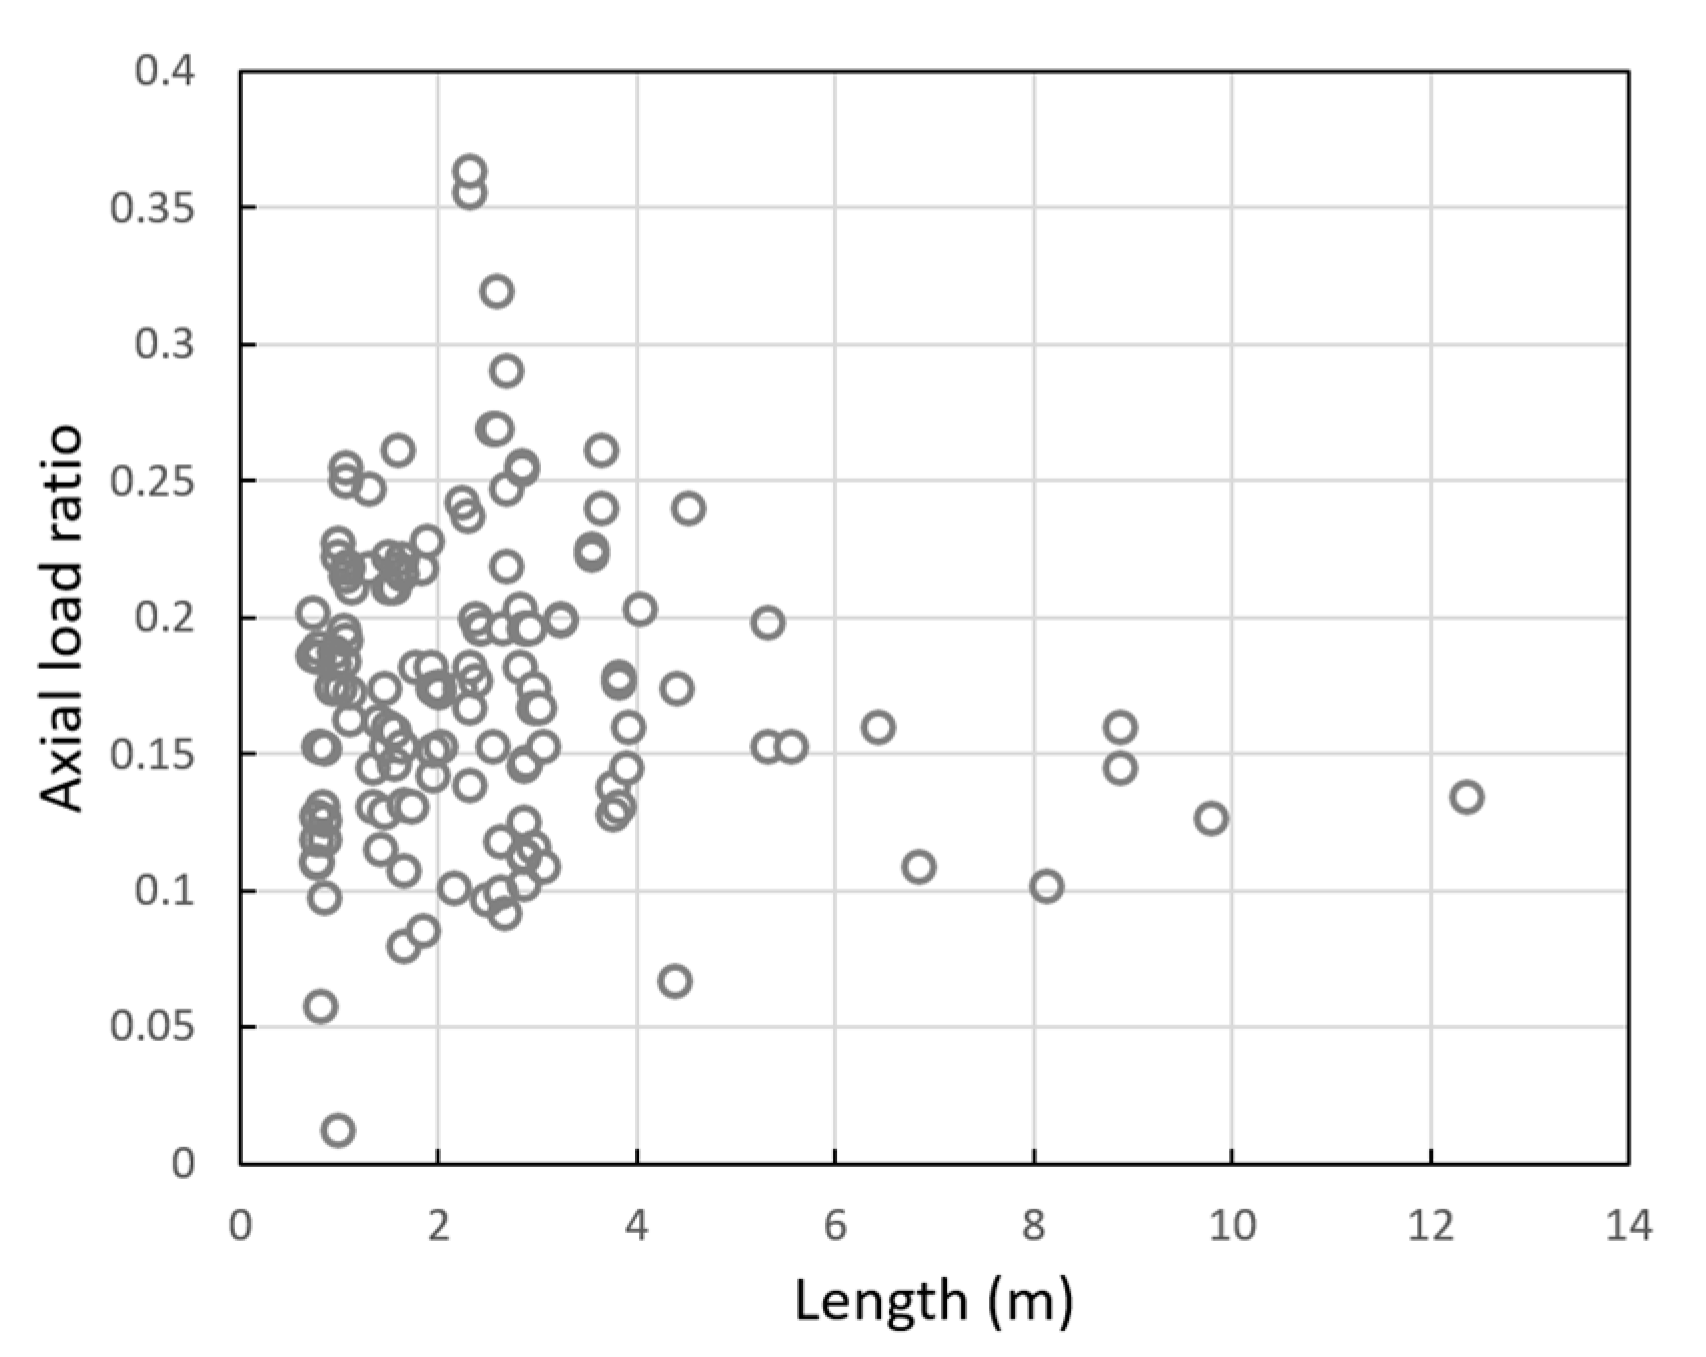
The axial force ratio plays an important role in the flexural and shear capacities of walls. Therefore, axial force ratios and corresponding wall lengths were investigated based on design documents for previously designed apartment buildings. Figure 2 shows that longer walls tend to have lower axial force ratios. Considering this observation, R1 and R2 with relatively shorter length have higher axial force ratio than R3, T1 and T2 in Table 1.
The purpose of using simplified plane models is to concentrate on the adequacy of ordinary shear walls exceeding the height limit in the design code. However, issues such as irregularity and flexible diaphragms are important in the behavior of actual building structures. Irregular building configuration can cause additional seismic demand to structural systems by torsion in structural systems leading to increased possibility of collapse [9]. In addition, a flexible diaphragm may enhance such an irregularity [10,11]. Therefore, it should be noted that the result of this study can be applied only to buildings with regular configurations and rigid diaphragms, and more sophisticated and realistic models are necessary in further study.

2.2. Ground Motion and Scaling

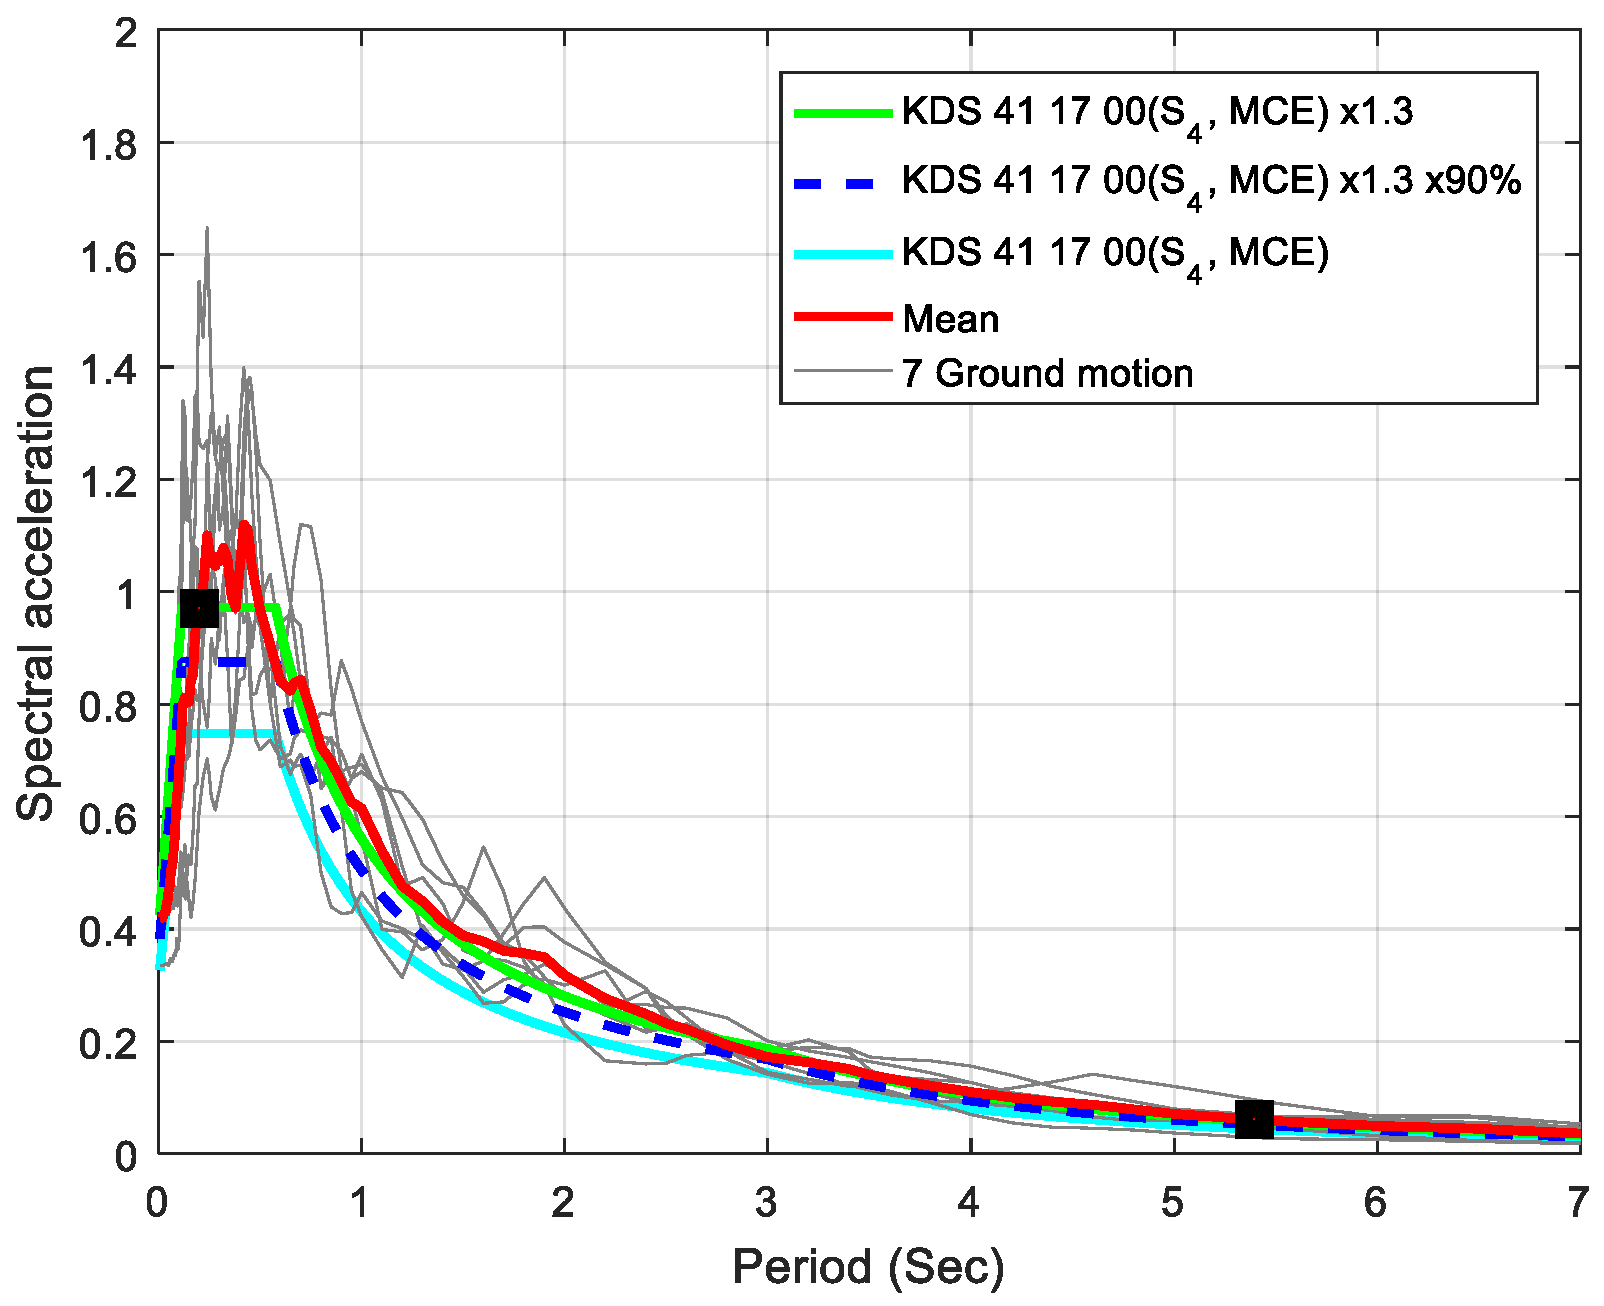
Seismic hazard was defined based on the maximum considered earthquake (MCE) defined in Korean Design Standard (KDS 41 17 00: 2019) [12]. Effective ground acceleration S, that can be read from peak ground acceleration map, was assumed to be 0.22 g, corresponding to seismic zone I, and the site classification was assumed to be S4. As a result, the site belongs to the seismic design category D, for which the building height of ordinary RC shear walls is limited below 60 m. The response spectrum for the MCE is plotted in Figure 3.
Three ground motion suites were selected for the design of three analytical models, respectively. The individual suite is comprised of seven pairs of horizontal components. Ground motion records used in nonlinear dynamic analysis were selected from the NGA-West2 database of PEER [13]. The shear wave velocity corresponding to site class S4 is defined as more than 180 m/s, but the range of shear wave velocity was increased by a small amount to secure a sufficient number of ground motion suites. A method proposed by Han et al. [14] was used for selecting ground motion records fitting the target MCE spectrum in good agreement. The details of ground motion suites adopted for the design of three analytical models are summarized in Table 2.
In accordance with KDS 41 17 00, the SRSS spectrum of two horizontal components for each ground motion pair shall be scaled not to fall below 90% of the target spectrum defined as 1.3 times the MCE spectrum. The range of the period for scaling individual response spectrum is defined as 0.2 to 1.5 times the first mode period, T1, in KDS 41 17 00, but the lower bound is modified to be the period where the modal mass participation ratio is over 90% in order to consider the effect of the higher mode sufficiently. Figure 3 shows the target spectrum and 90% thereof and individual scaled spectra for the Model B analysis model.
In this study, a two-dimensional analysis was performed. Only the single horizontal component of ground motion was applied to the in-plane horizontal direction in a single nonlinear dynamic analysis. Each component, comprising a ground motion pair, was applied to the analysis alternately to take into account uncertainty in the azimuth of horizontal ground motion in accordance with KDS 41 17 00. Therefore, a total of 14 nonlinear dynamic analyses were conducted in the in-plane direction for the design of each analytical model.

2.3. Preliminary Elastic Design

The analytical models were designed initially to have a minimum base shear capacity defined as 75% of the base shear determined by an equivalent lateral force procedure to meet the requirement for structures designed with the performance-based seismic design procedure provided by KDS 41 17 00. Response modification factor R = 4.0 for ordinary RC shear walls and importance factor I E = 1.2 for residential buildings with five or more stories were applied to the minimum base shear forces. Material strengths of concrete and reinforcement are summarized in Table 3. Response spectrum analysis was performed for the elastic design. A total of 25, 29 and 39 modes of vibration were included in the analysis of Model A, B and C, respectively, and combined with the complete quadratic combination (CQC) rule. The mass participation factor of the modes included in the analysis was 99.9% for all the three analytical models. For the analysis of the response spectrum, a 5% damping ratio was assumed. The initial design was conducted using MIDAS Gen [15].

2.4. Inelastic Modeling and Nonlinear Dynamic Analysis

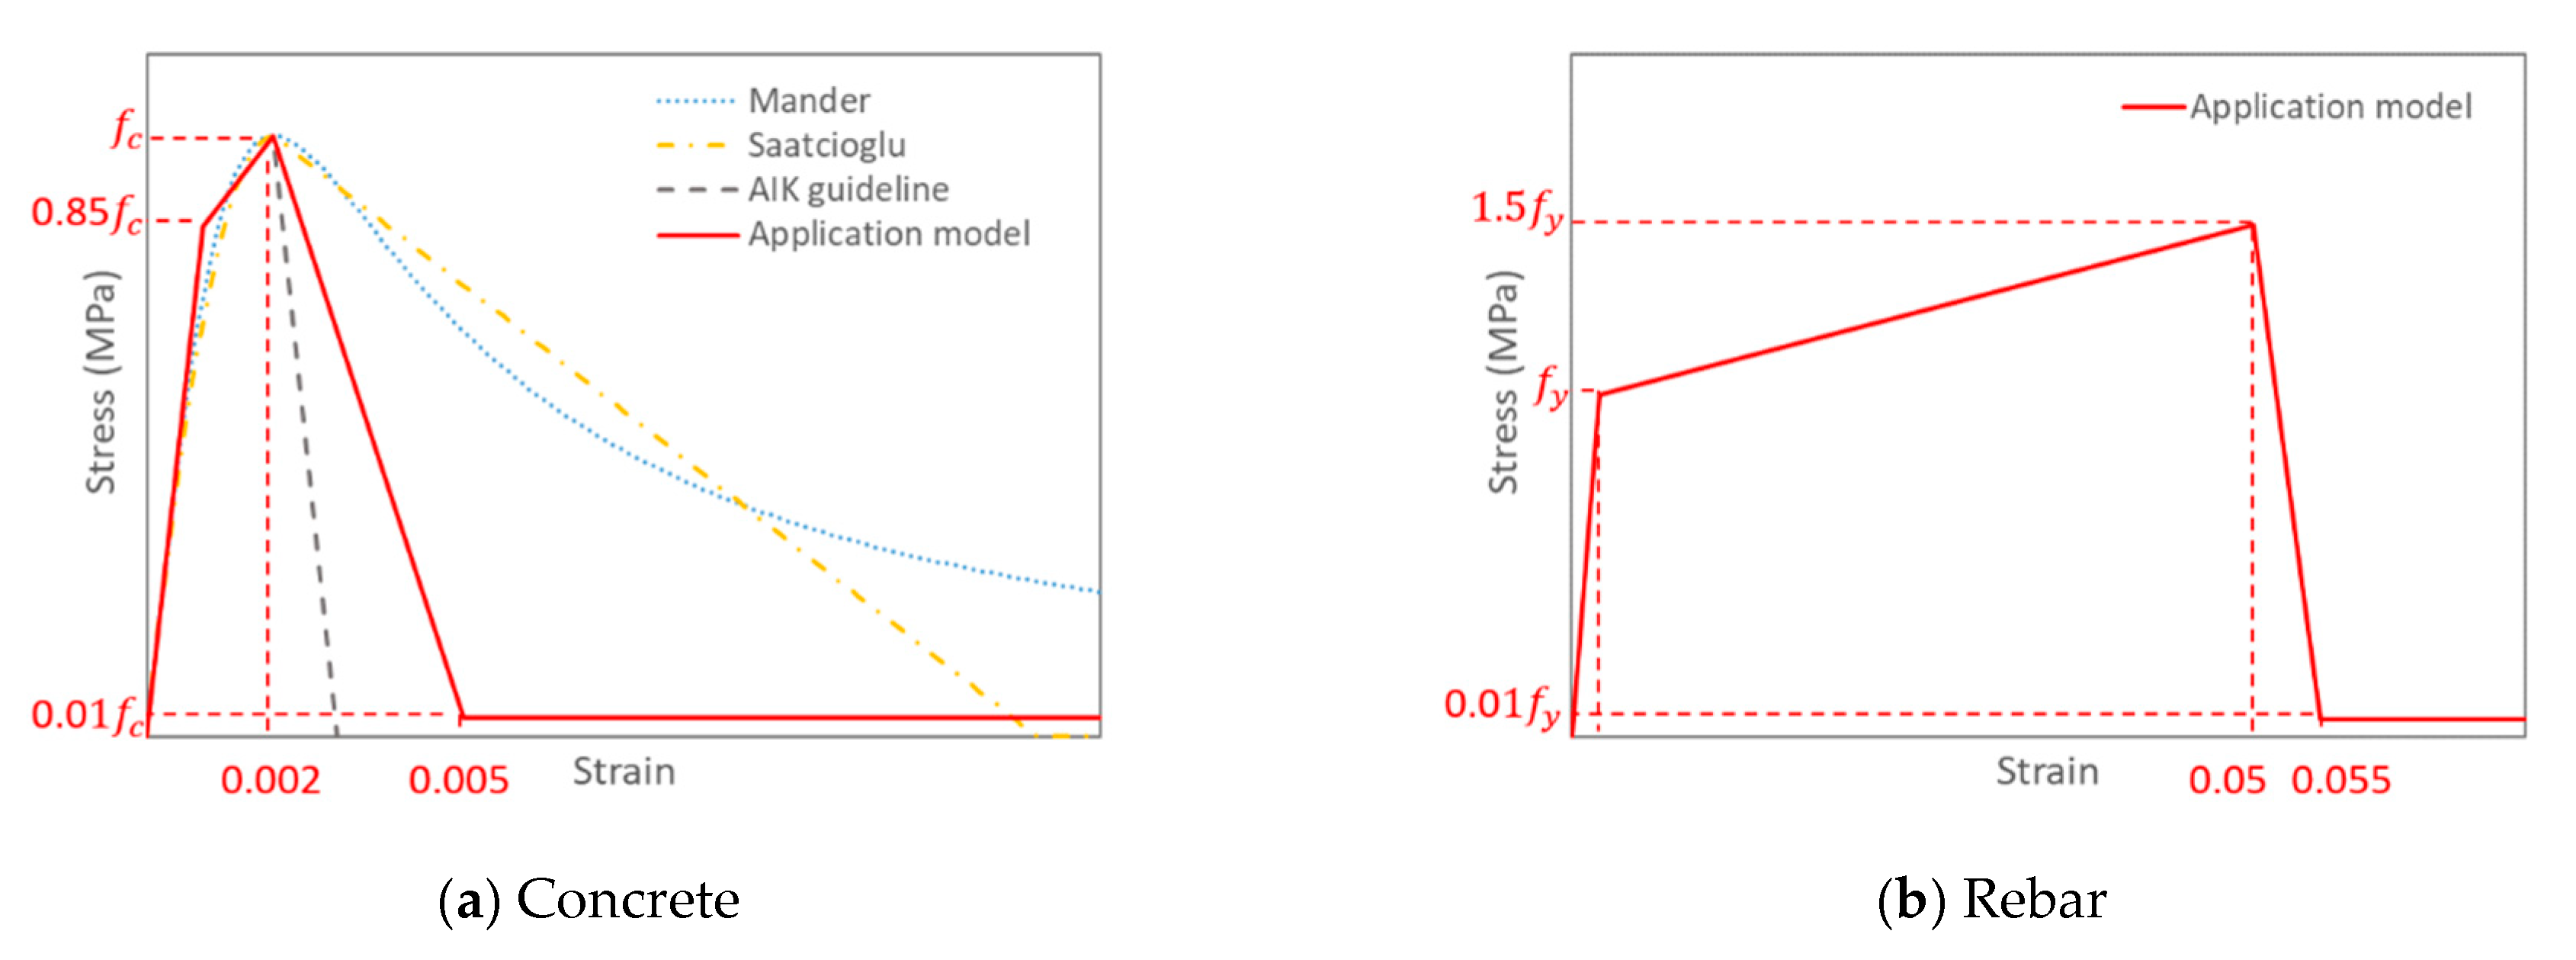
For nonlinear dynamic analysis, shear walls were modeled using fiber elements. Uniaxial inelastic models for concrete and rebar are represented in Figure 4, respectively. The unconfined concrete model proposed by Mander and Priestley was used to represent the nonlinear behavior of the concrete before the maximum compressive stress of concrete [16]. In accordance with the AIK guidelines, the stress drops to the residual stress after reaching the maximum stress at the strain of 0.002. The ultimate strain at the end of stress drop is prescribed as 0.003 in the guidelines. However, the ultimate strain of 0.003 may underestimate the deformation capacity of actual unconfined concrete. Figure 4a represents the nonlinear behavior beyond the maximum compressive stress for concrete models by Saatcioglu, and Mander and Priestley, in which deformation capacities considerably higher than 0.003 are observed [16,17]. Therefore, it is necessary to set an appropriate concrete deformation capacity beyond the maximum compressive stress of concrete.
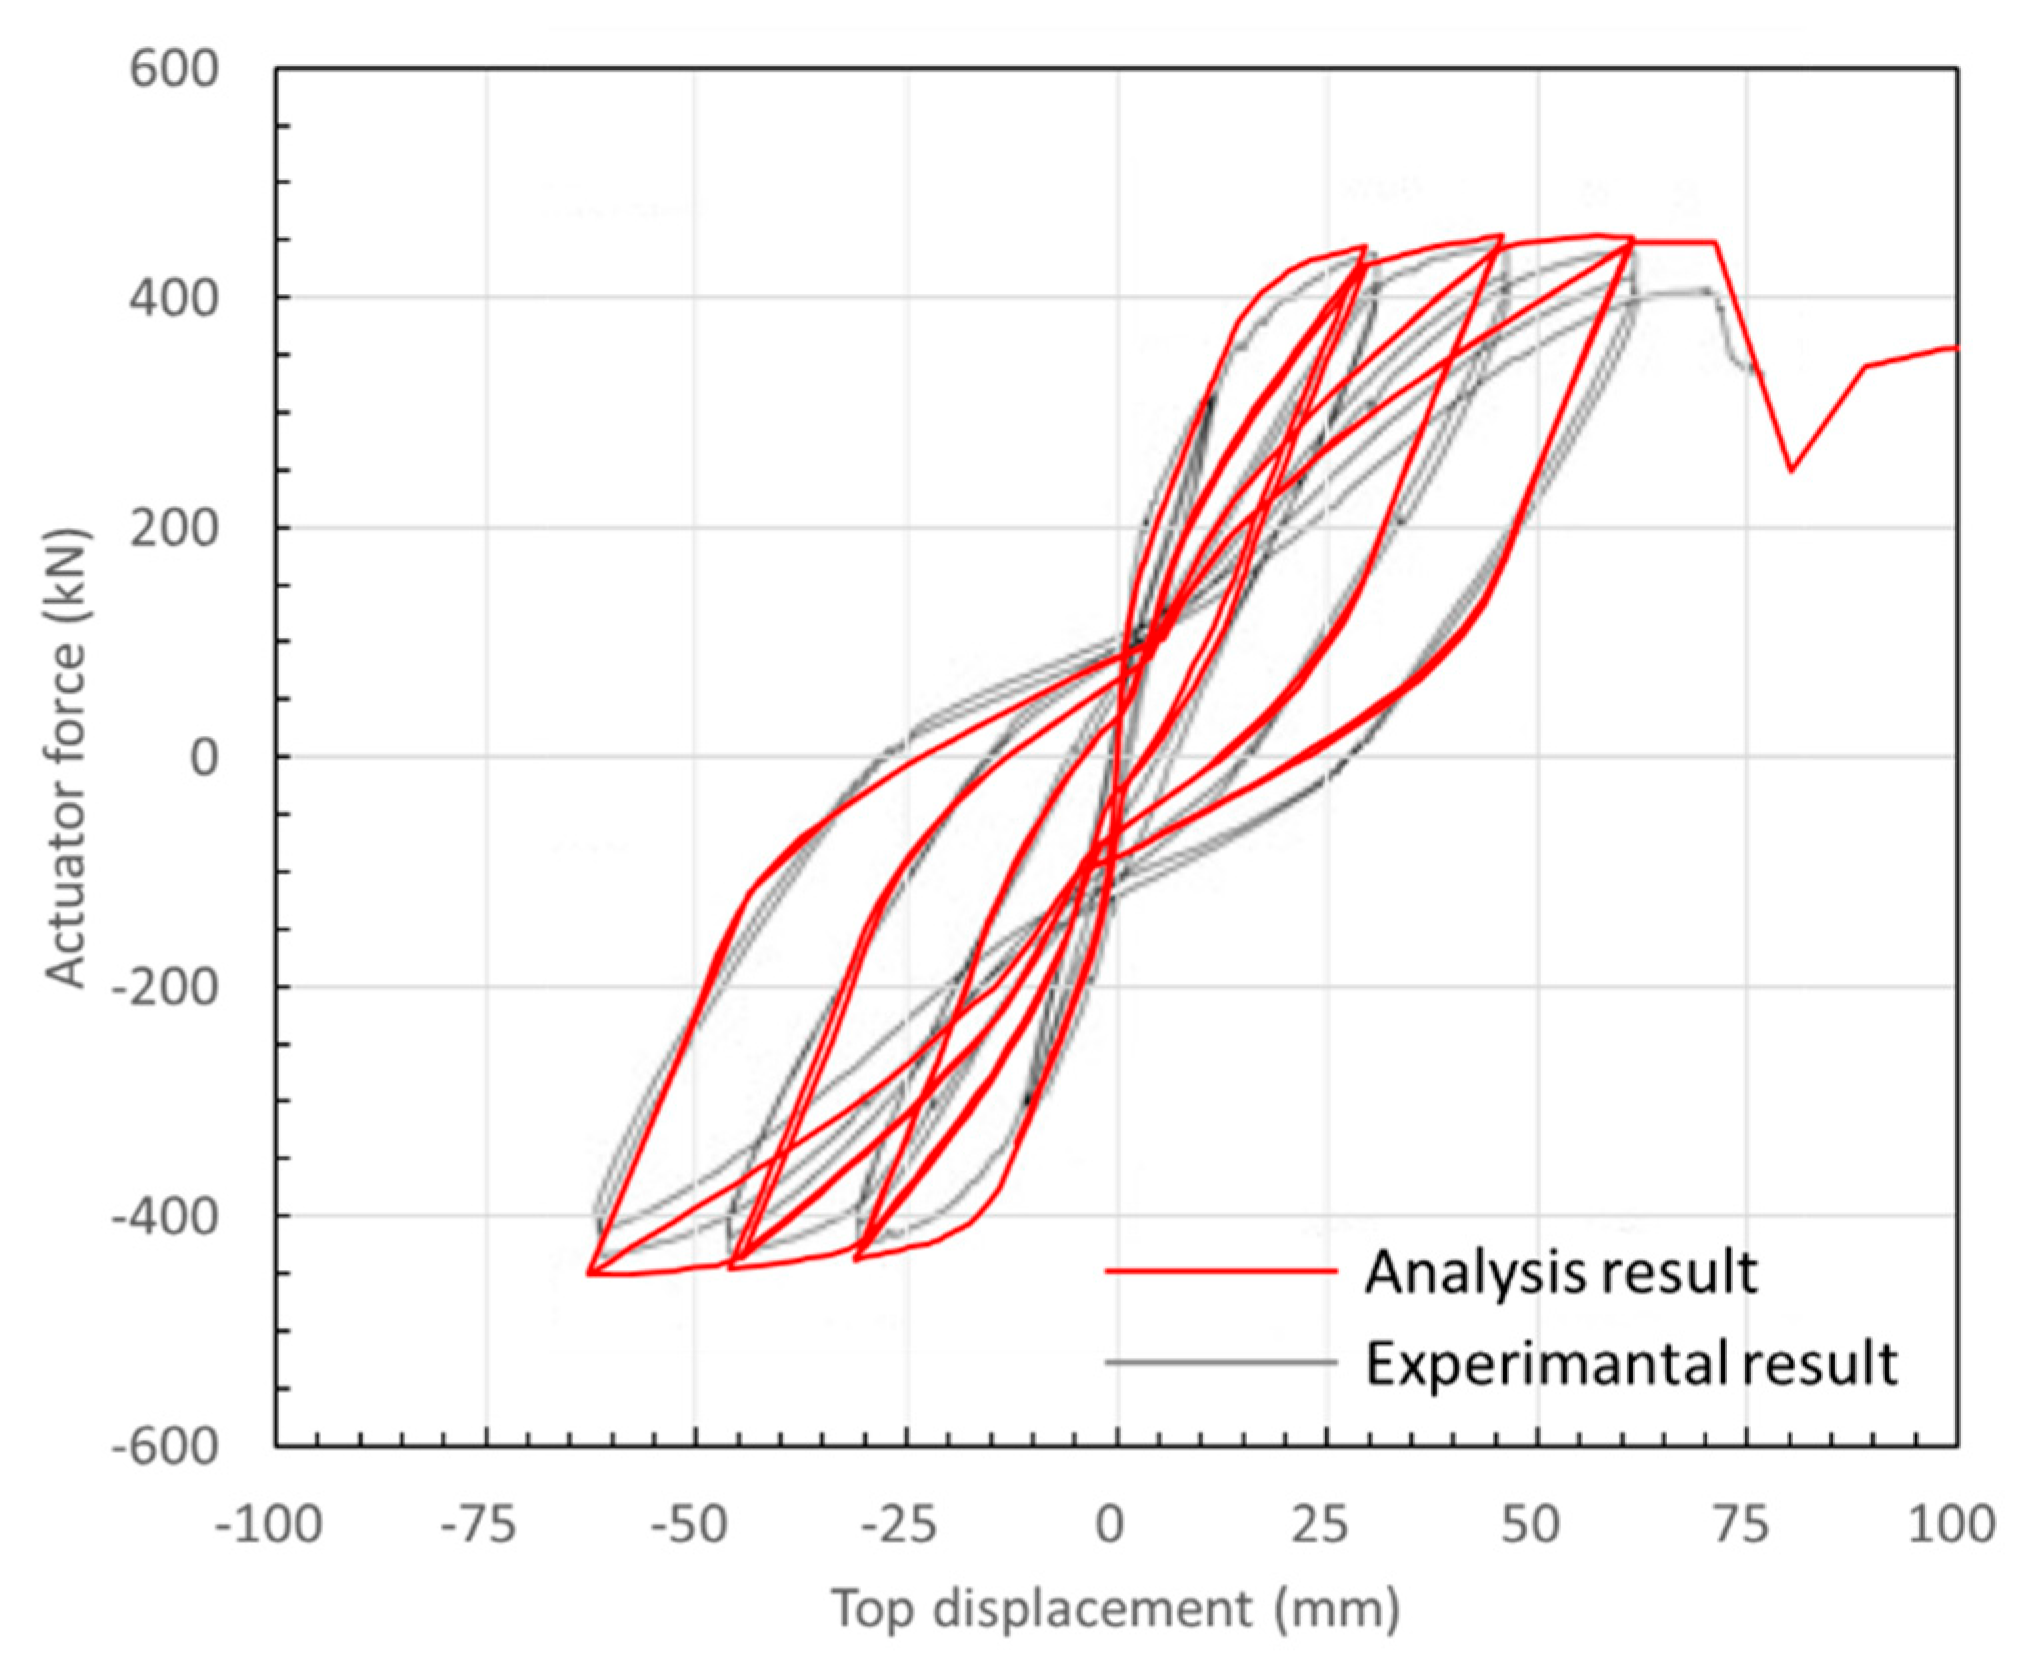
In this study, the ultimate strain ε c u was determined by comparison of the test and numerical analysis results for an existing specimen tested by Dazio et al. [18]. A total of 1% of the maximum stress is applied to the residual stress of the unconfined concrete model. Using 0.005 for the ultimate strain, it was confirmed that the experimental results and the analytical results were in good agreement for each cycle, and the deformation at the strength drop was simulated well in Figure 5. Therefore, unconfined concrete model with the ultimate strain of 0.005 and residual strength ratio of 0.01 times the maximum stress is adopted for the analytical models in this study. The inelastic material model for reinforcing bars was determined referring to the works of Thomsen and Wallace, Orakcal and Wallace, and Tuna [19,20,21]. The tensile strength of the rebar was selected to be 1.5 times the yield strength, and the tensile strain at the tensile strength is 0.05. The nonlinear model of reinforcing bars was created symmetrically, but the limit of compressive strain was set to be 0.02 considering buckling as shown in Figure 4b.
All the shear walls have height-to-length ratios higher than 3.0 and are dominated by flexural behavior [19]. Therefore, the shear of those walls was modeled as linear elastic and regarded as force-controlled behavior. Uncracked stiffness was applied to the shear stiffness of the shear walls in accordance with AIK guidelines [2].
The flexural or shear behavior of coupling beams were modeled with concentrated plastic hinges of which modeling parameters were determined in accordance with the AIK guidelines. The failure mode of coupling beams is classified into flexural or shear one based on the span-to-depth ratio in the AIK guidelines [2]. All the coupled beams included in the analytical models used in this study have the span-to-depth ratio less than 4.0 for which shear failure is dominant. The nonlinear modeling parameters of a coupling beam depend on the normalized shear force determined by Equation (1) and the classification of seismic details between conforming and non-conforming details depending on whether the transverse reinforcement satisfies requirements on the boundary elements of special structural walls prescribed in KDS 14 20 80 or not [22].
V / f c k t h
where V is the shear force demand, f c k is the specified compressive strength of the concrete material, t is the thickness of the coupling beam, and h is the clear span. Inelastic modeling and nonlinear dynamic analysis was performed using PERFORM 3D V7 [23]. Newmark’s method was used for the time history analysis with time step sizes s between 0.005 to 0.02 s according to the ground motion data. For nonlinear analysis, the event-to-event solution strategy adopted in PERFORM-3D was used to update stiffness and strength of components and to stop analysis when the number of events in a time step exceeds a specified value 1000. Rayleigh damping was used to introduce 2.5% damping ratio in the analytical model.

2.5. Performance Goals and Acceptance Criteria

Collapse prevention against the maximum considered earthquake was adopted as a performance objective for the design of shear walls using nonlinear dynamic analysis. Table 4 summarizes the engineering design parameters and their acceptance criteria used in the design of three models. Details of the acceptance criteria are described as follows.
Four engineering demand parameters (EDPs) such as inter-story drift ratios, plastic hinge rotation angles, shear forces and compressive extreme-fiber strains were checked with the acceptance criteria for the performance level. TBI v2.03 limits the mean peak inter-story drift ratio for the whole ground motion suites below 3.0% and individual peak inter-story drift ratio for each ground motion suite below 4.5% in order to prevent collapse [26]. However, the upper limit of mean peak inter-story drift ratio is specified as 2.0% for the prevention of collapse in the AIK guidelines, because most shear walls are designed in the type of ordinary shear walls without confinement at boundary regions and 3.0% inter-story drift ratio could overestimate the performance of those shear walls. Therefore, ordinary shear walls in this study were also designed using the 2.0% inter-story drift ratio limit in accordance with the AIK guidelines.
For the plastic hinge rotation angles of shear walls, acceptance criteria prescribed in the AIK guidelines were applied and are essentially equivalent to ASCE 41-17 [27]. To check the plastic hinge rotation angle of shear walls, a yield rotation is necessary to subtract from the peak rotation angle. In this study, the yield rotation angle was calculated using the following Equation (2), where the yield moment strength M y is estimated using Equation (3) in accordance with the regression analysis of Haselton et al. [28].
θ y = ( M y E c I ) l p
M n / M y = 1.13
where M n and M y are the nominal and yield flexural moment strengths respectively, E c is the elastic modulus of concrete, and I is the moment of inertia. l p is the plastic hinge length of the wall. In this study, l p was assumed to be a half of the wall length in accordance with ASCE 41-17.
The shear force is a force control action, designed to satisfy the required strength increased with an amplification factor. Table 4 shows the shear design recommendation of the AIK guidelines and other relevant literature, where Q n and Q e represent the nominal shear strengths based on the nominal and expected material strengths, respectively. Q u is the required strength defined by the mean peak response for the whole suite of ground motions. γ and ϕ are the shear force amplification factor and the strength reduction coefficient, respectively. In the AIK guidelines, ϕ and γ are 1.0 and 1.2, respectively [2]. Hassan et al. and Moehle et al. used similar mathematical representation for the acceptance criteria of force-controlled actions, but used 1.5 for γ and adopted expected strength rather than nominal strength [24,25]. In TBI v2.03, the change was made to use γ = 1.3, but ϕ was applied and a new coefficient B was introduced to correct bias in the nominal strength equation. This study applied acceptance criteria of the AIK guidelines but different force amplification factors corresponding to 1.0, 1.2, and 1.5 in order to examine an appropriate level of the factor. Finally, compressive extreme-fiber strains were limited below 0.002 corresponding to the strain at the peak stress in the uniaxial material model for unconfined concrete in order to take into account uncertainty in the descending branch of the model and avoid overestimating the deformation capacity of the ordinary RC shear walls in accordance with the AIK guidelines.

2.6. Analysis and Design Results

In order to confirm whether the analytical model satisfies the target performance, a nonlinear dynamic analysis was performed for the 14 ground motion records described in Section 2.2. The mean peak of inter-story drifts, plastic hinge rotation angles, and compressive extreme-fiber strains were calculated and all component walls were designed to meet acceptance criteria for collapse prevention. The component walls were reinforced with double-layered rebars, and design results are summarized in Table 5. The reinforcement of coupling beams is summarized in Table 6.
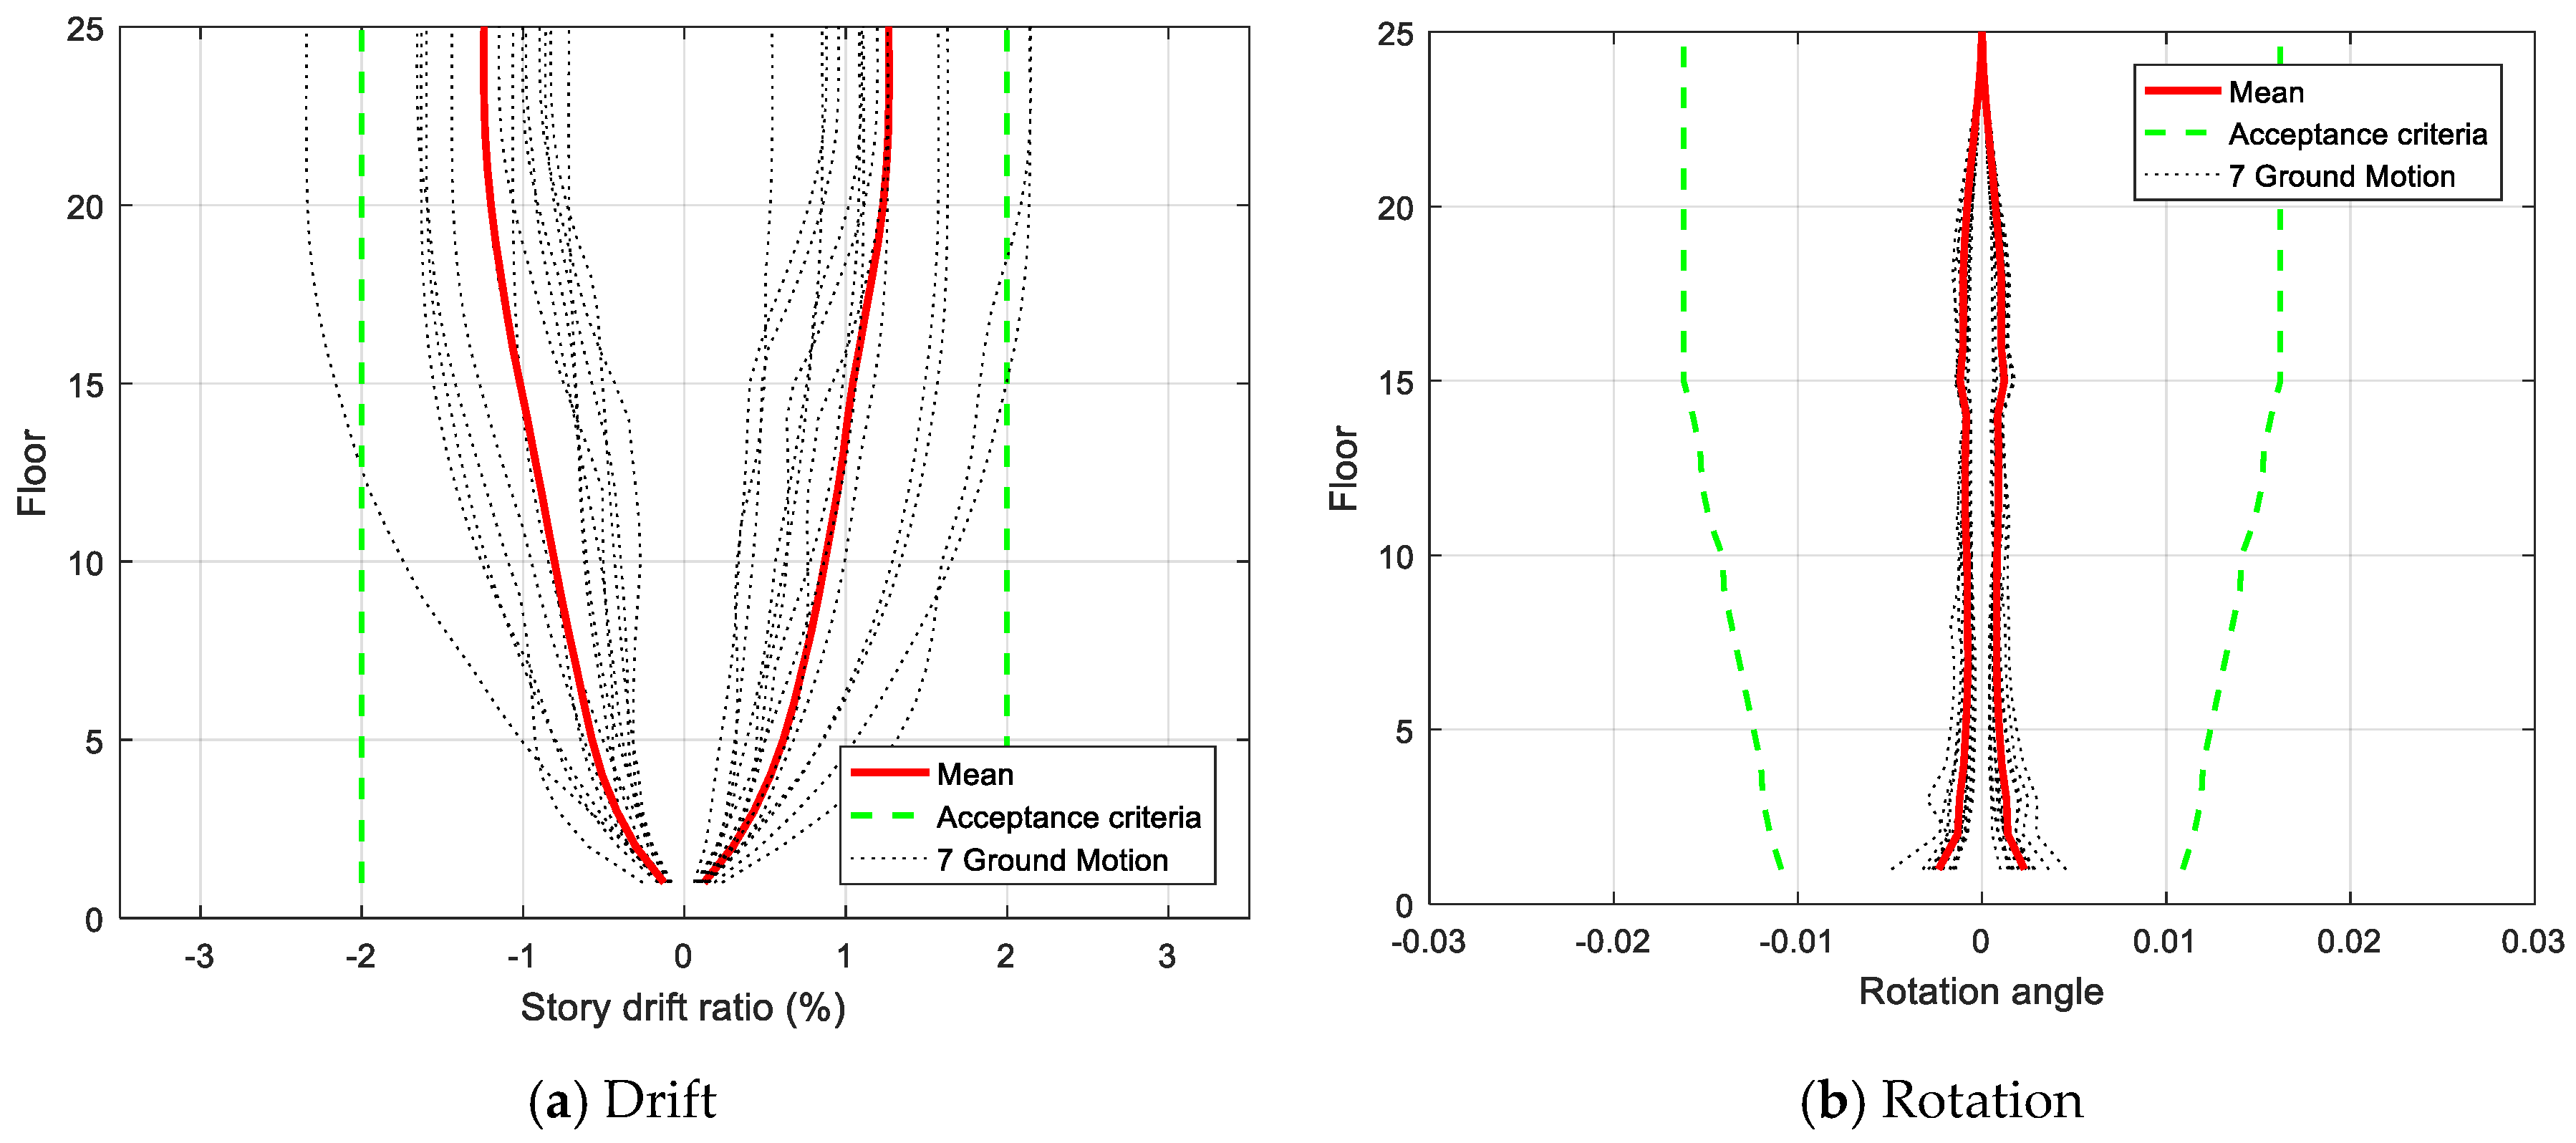
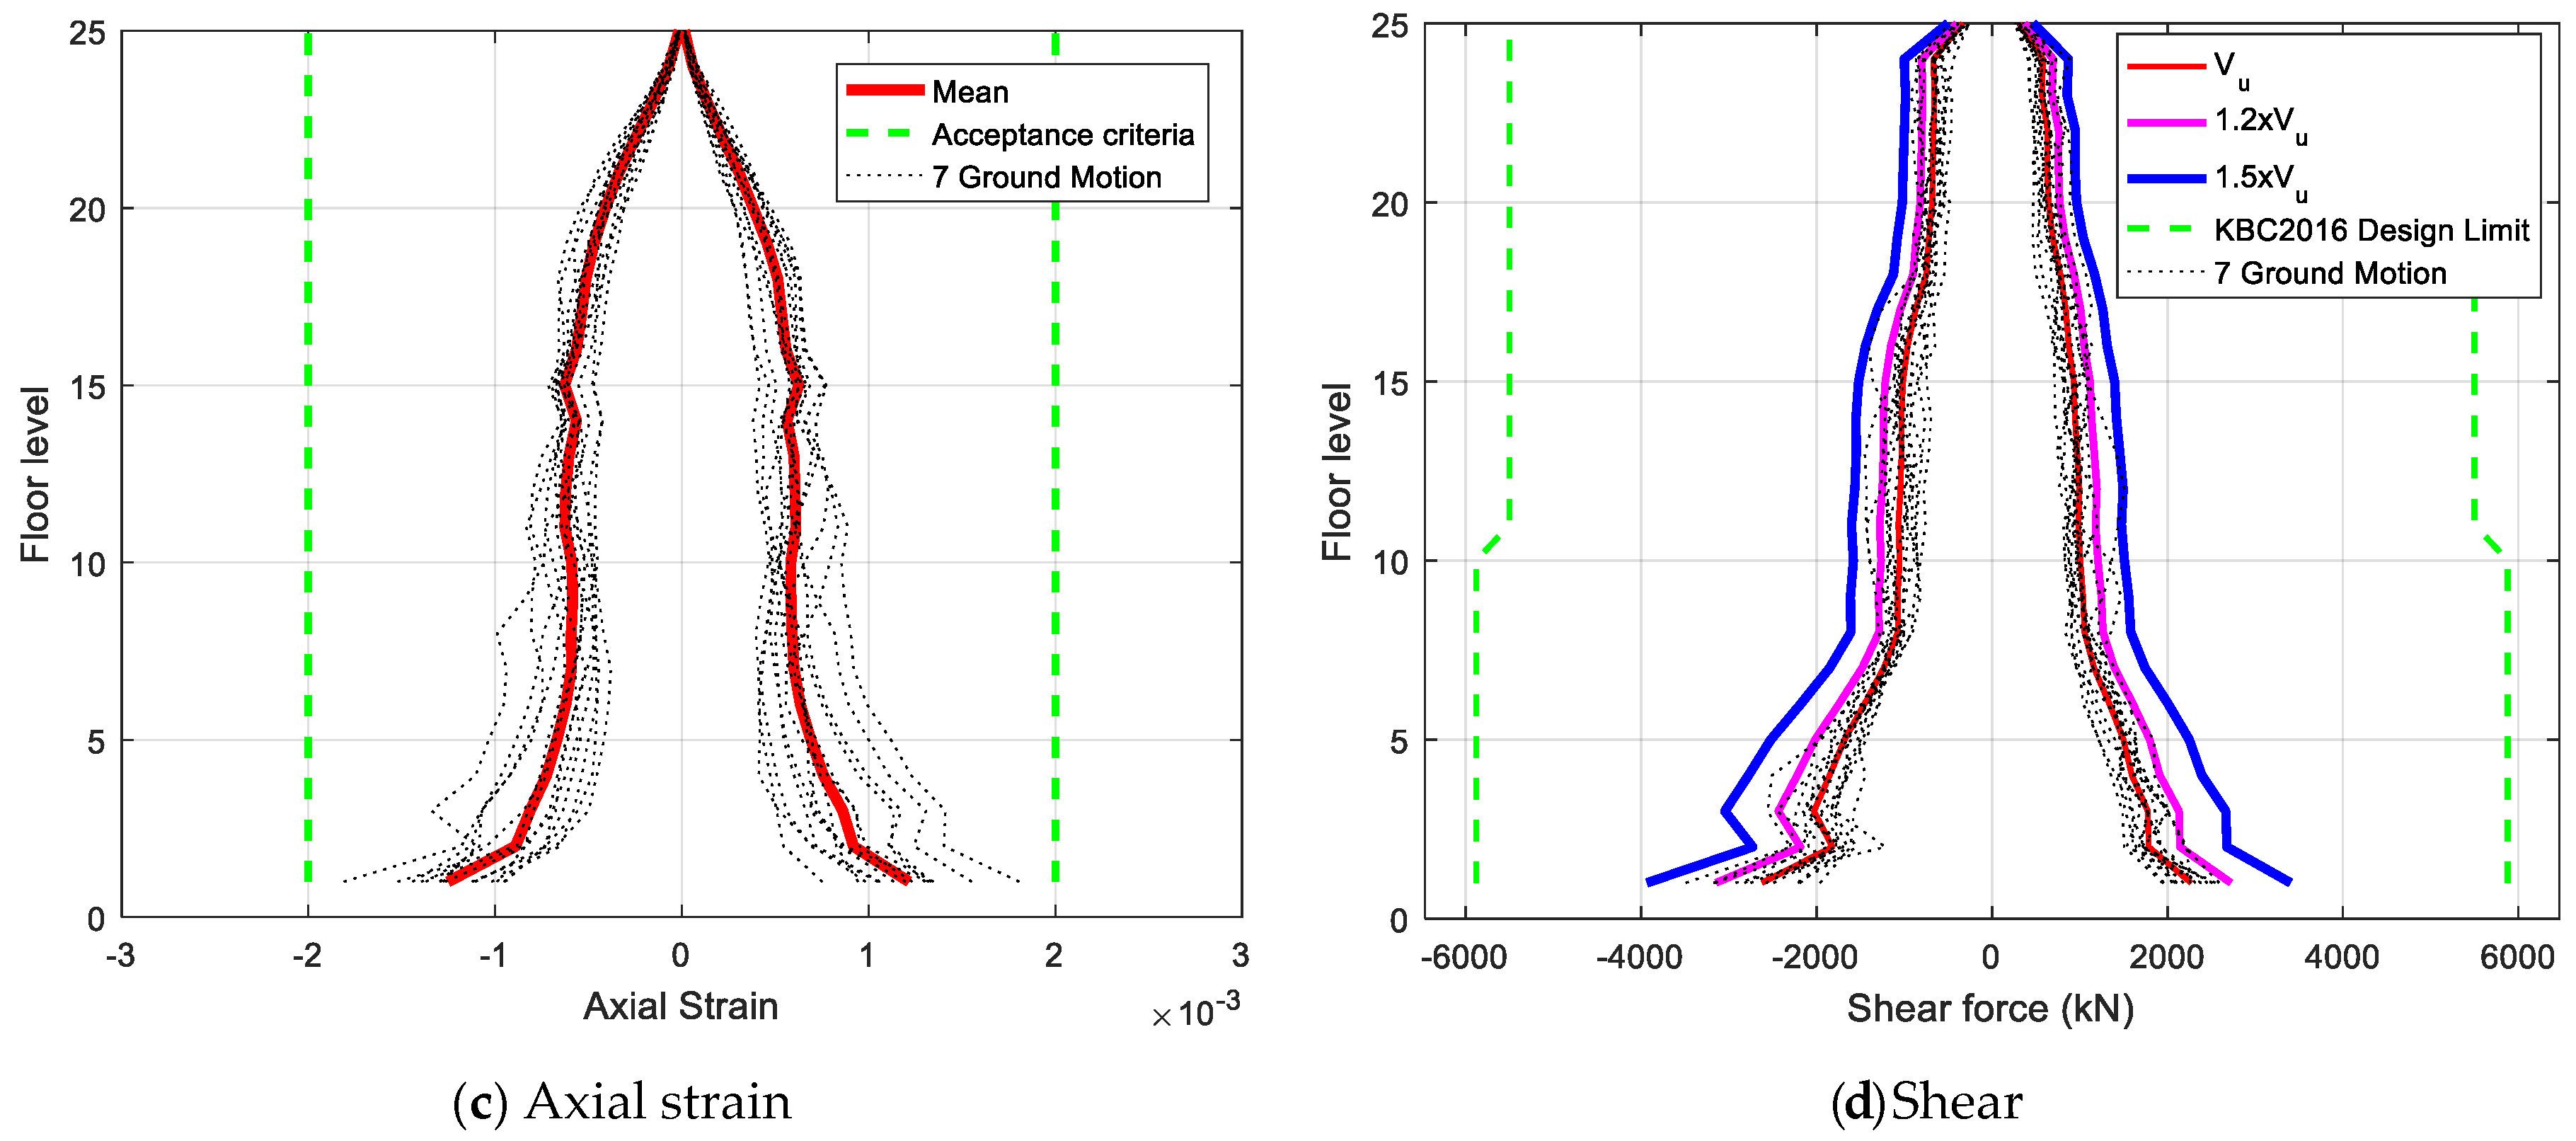
In the nonlinear analysis of final design results, all the individual walls in Model A, B, and C satisfy the acceptance criteria on the inter-story drift ratio, plastic hinge rotation angle, and compressive extreme-fiber strain. Vertical distribution of diverse responses for a wall in Model A is shown in Figure 6a–c. All of the maximum values of peak responses along the entire stories are summarized in Table 7. The maximum of mean peak inter-story drift ratios for Model A, B, and C was 1.27%, 1.25%, and 0.85%, respectively, of which all satisfy the acceptance criteria described above. The demand-capacity ratio (DCR) for plastic hinge rotation angle in Table 7 are expressed in the ratio of the mean peak plastic hinge rotation angle and the acceptance criteria described above and meet the collapse prevention requirements. All the walls in three analysis models satisfy the collapse prevention criteria. It was also found that all compressive extreme-fiber strains are below 0.002.
The plots for 0, 1.2 and 1.5 are shown in Figure 6d. The maximum demand-to-capacity ratios for individual wall elements along the height are summarized in Table 7. The design of shear strength was performed for 1.0, 1.2, and 1.5 times the mean shear force demand in order to investigate the seismic fragility performance with respect to the design shear force level. In Table 7, there are shear walls designed with a DCR much lower than 1.0, which is the result of amplified shear force demands which do not reach the shear strength for the minimum reinforcement ratio defined in the KBC 2016 [1].

3. Seismic Fragility Assessment Procedure

3.1. FEMA P695 Procedure

A seismic fragility assessment for three analytical model was conducted using the procedure of FEMA P695, one of the methodologies for evaluating the seismic performance coefficients of structural systems that are not prescribed in the standard. The FEMA P695 procedure verifies if seismic-force-resisting systems have an acceptable probability of collapse and a collapse margin ratio (CMR) for the maximum considered earthquake based on the collapse fragility curve obtained by incremental dynamic analysis (IDA).
The spectral shape of ground motion records is an important factor that influences the result of IDA and the corresponding collapse fragility. Baker and Cornell found that the spectral shape for the MCE level ground motion of the western area of United States and the shape design spectrum shape of ASCE 7-05 are different significantly over a certain period of time [29,30,31]. In addition, the structural analysis for those spectra having such differences showed that there is a considerable difference in collapse prevention performance. Baker and Cornell proposed a conditional spectrum to compensate for that kind of difference. The conditional spectrum has a spectral acceleration corresponding to a specific return period at a control frequency, and spectral accelerations at other periods are determined by a percentile conditional on the spectral acceleration at the control frequency. The conditional spectrum thus provides statistical information about the variability of the spectrum at periods other than the control frequency. In this study, ground motion suites for the IDA were selected and scaled using the conditional spectrum.
In FEMA P695, when the spectral shape of the general structural design standard is used, the CMR is modified to the adjusted collapse margin ratio (ACMR) using a correction factor called the spectral shape factor (SSF) to take into account difference in the spectral shape mentioned above. However, the conditional spectrum was used directly as the target response spectrum for ground motion suites used in the performance evaluation in this study. Therefore, values of ACMR in this study are the same as those of CMR without modification.
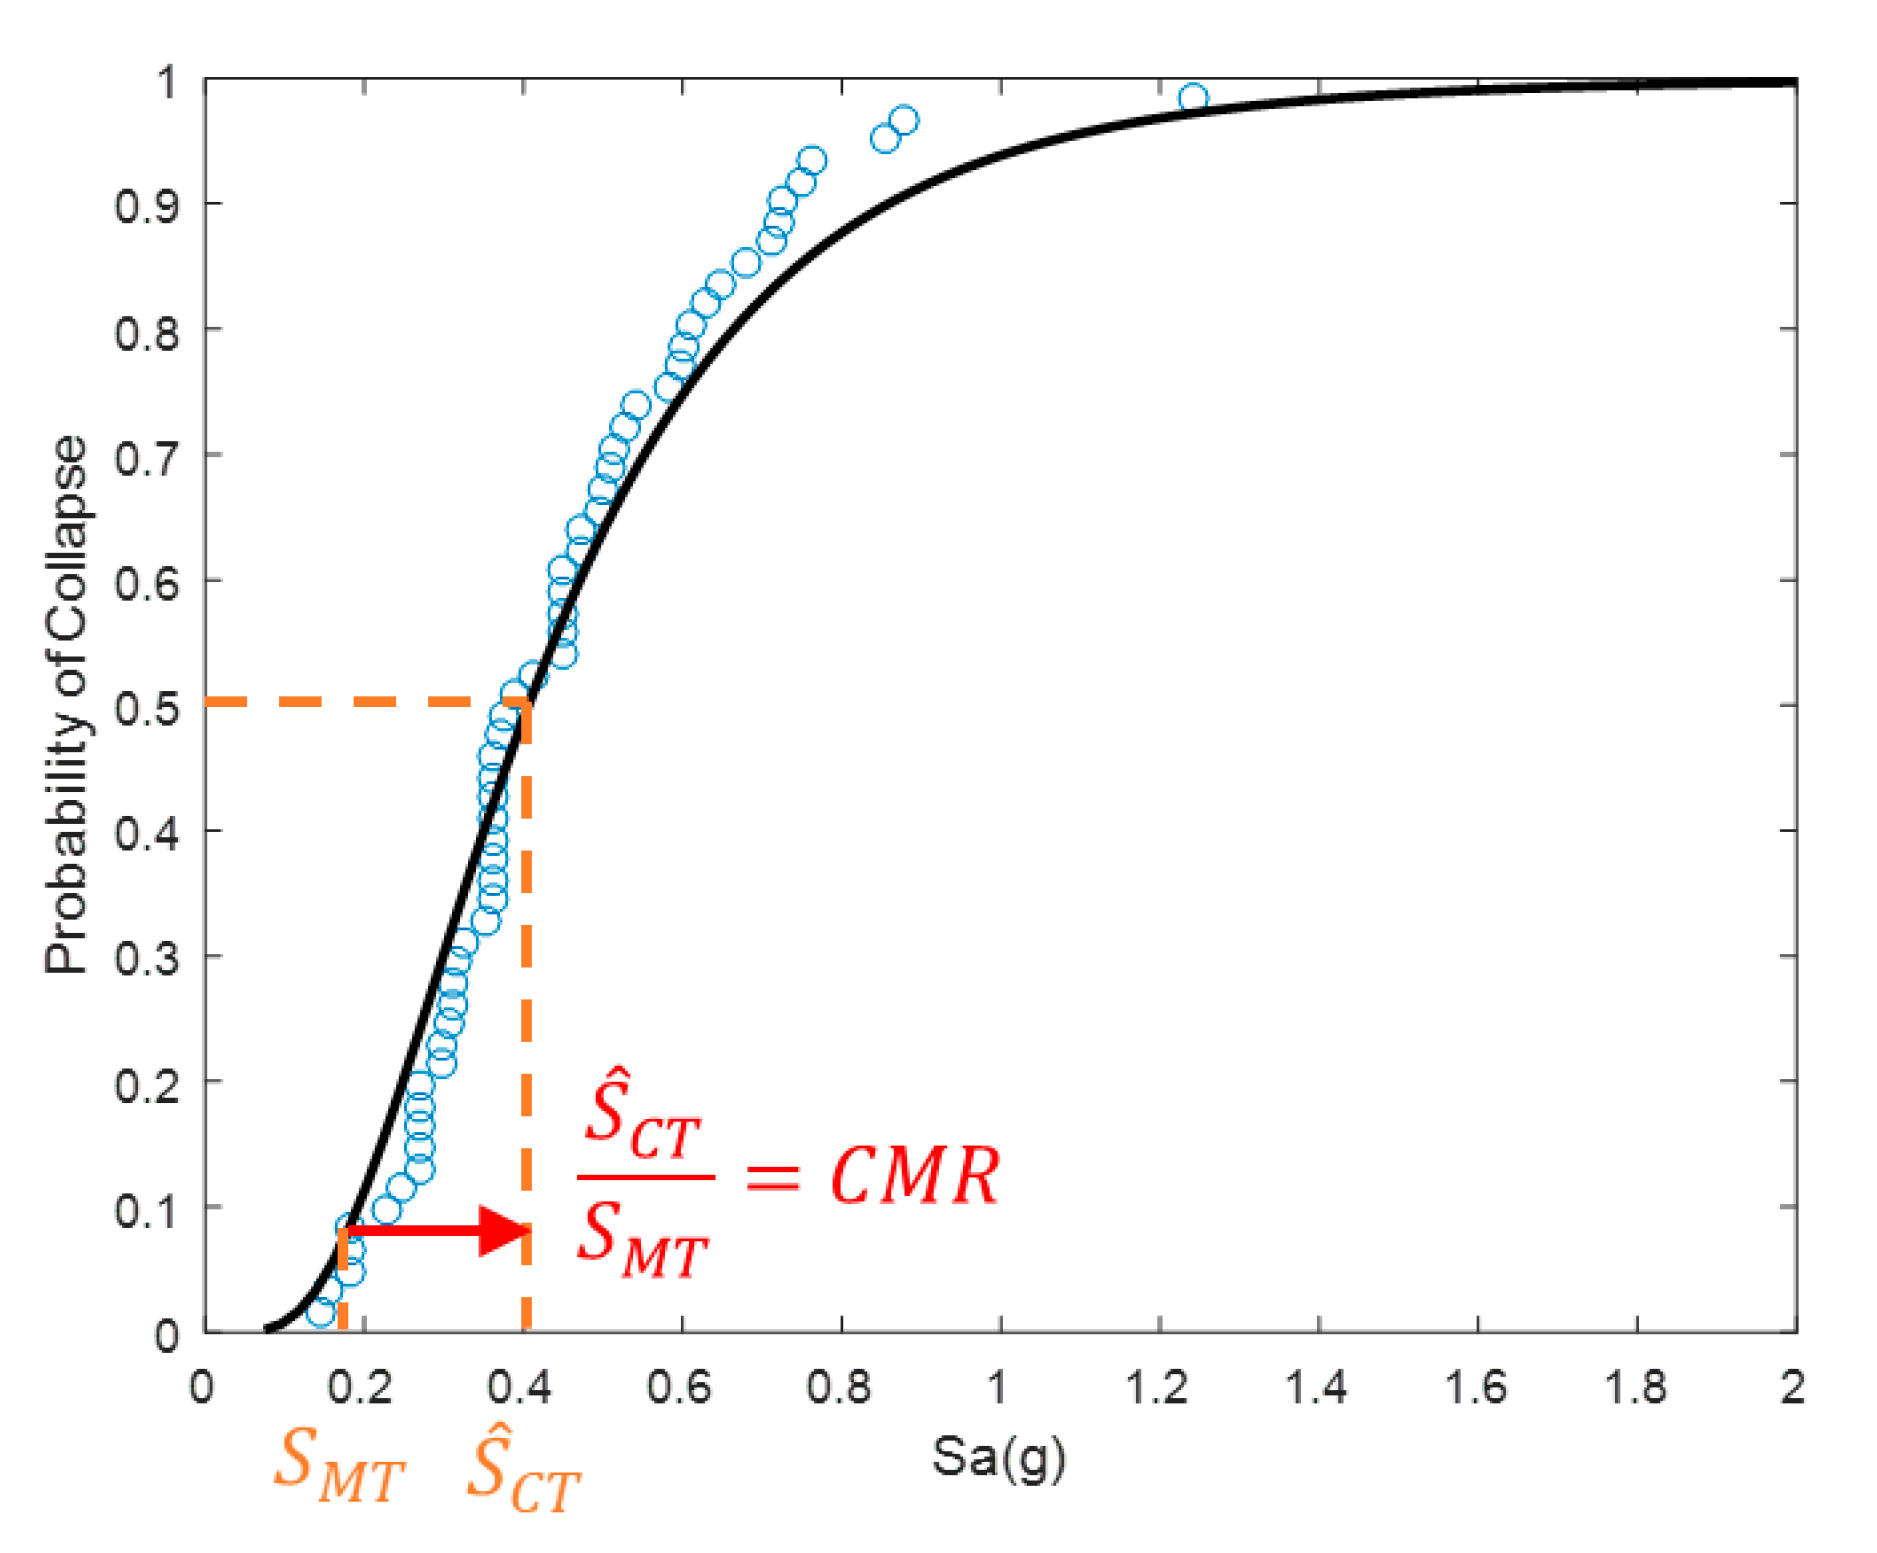
The FEMA P695 criteria for collapse prevention require that the CMR be above a specified allowable value and the collapse probability at the MCE level of spectral acceleration be less than 10%. An example of the seismic fragility curve in the form of a cumulative lognormal distribution function is shown in Figure 7, to illustrate those two collapse prevention criteria. In Figure 7, the CMR is defined as S ^ C T / S M T , where S M T is the spectral acceleration corresponding to the fundamental mode period of the analytical model at the MCE level spectrum, and S ^ C T is the spectral acceleration with 50% collapse probability in the fragility curve. The collapse probability is evaluated at S M T .
The spectral acceleration at the first mode period S a ( T 1 ) was used to represent the intensity measure (IM) of ground motion suites for IDA and the fragility assessment. Higher-mode contribution and period elongation are important factors in the case of high-rise buildings responding to earthquakes inelastically. An intensity measure, such as an average spectral acceleration for multiple periods including an elongated one, may be a better IM that can reduce dispersion and bias in the prediction of collapse [32]. Nevertheless, S a ( T 1 ) was adopted for the IM in order to achieve consistency in the seismic hazard between design and fragility evaluation as well as to take into account variability in spectral shape by scaling ground motion records to the distribution of conditional spectra anchored to S a ( T 1 ) .
The standard deviation β T O T of the lognormal distribution to account for uncertainty in the fragility curve was determined in accordance with FEMA P695 [4]. β T O T is calculated by Equation (4).
β T O T = β R T R 2 + β D R 2 + β T D 2 + β M D R 2
where β R T R is the record-to-record collapse uncertainty and was calculated based on the dynamic analysis results in this study. β D R is the design requirements-related collapse uncertainty, β T D is the test data-related collapse uncertainty, and β M D R is the modeling-related collapse uncertainty. In FEMA P695, values of 0.1 to 0.5 are assigned to β D R , β T D , and β M D R according to “Superior” to “Poor” grade of quality ratings for each uncertainty source. In this study, 0.2 was used uniformly for the three standard deviation assuming “Good” grade.

3.2. Ground Motion for Incremental Dynamic Analysis

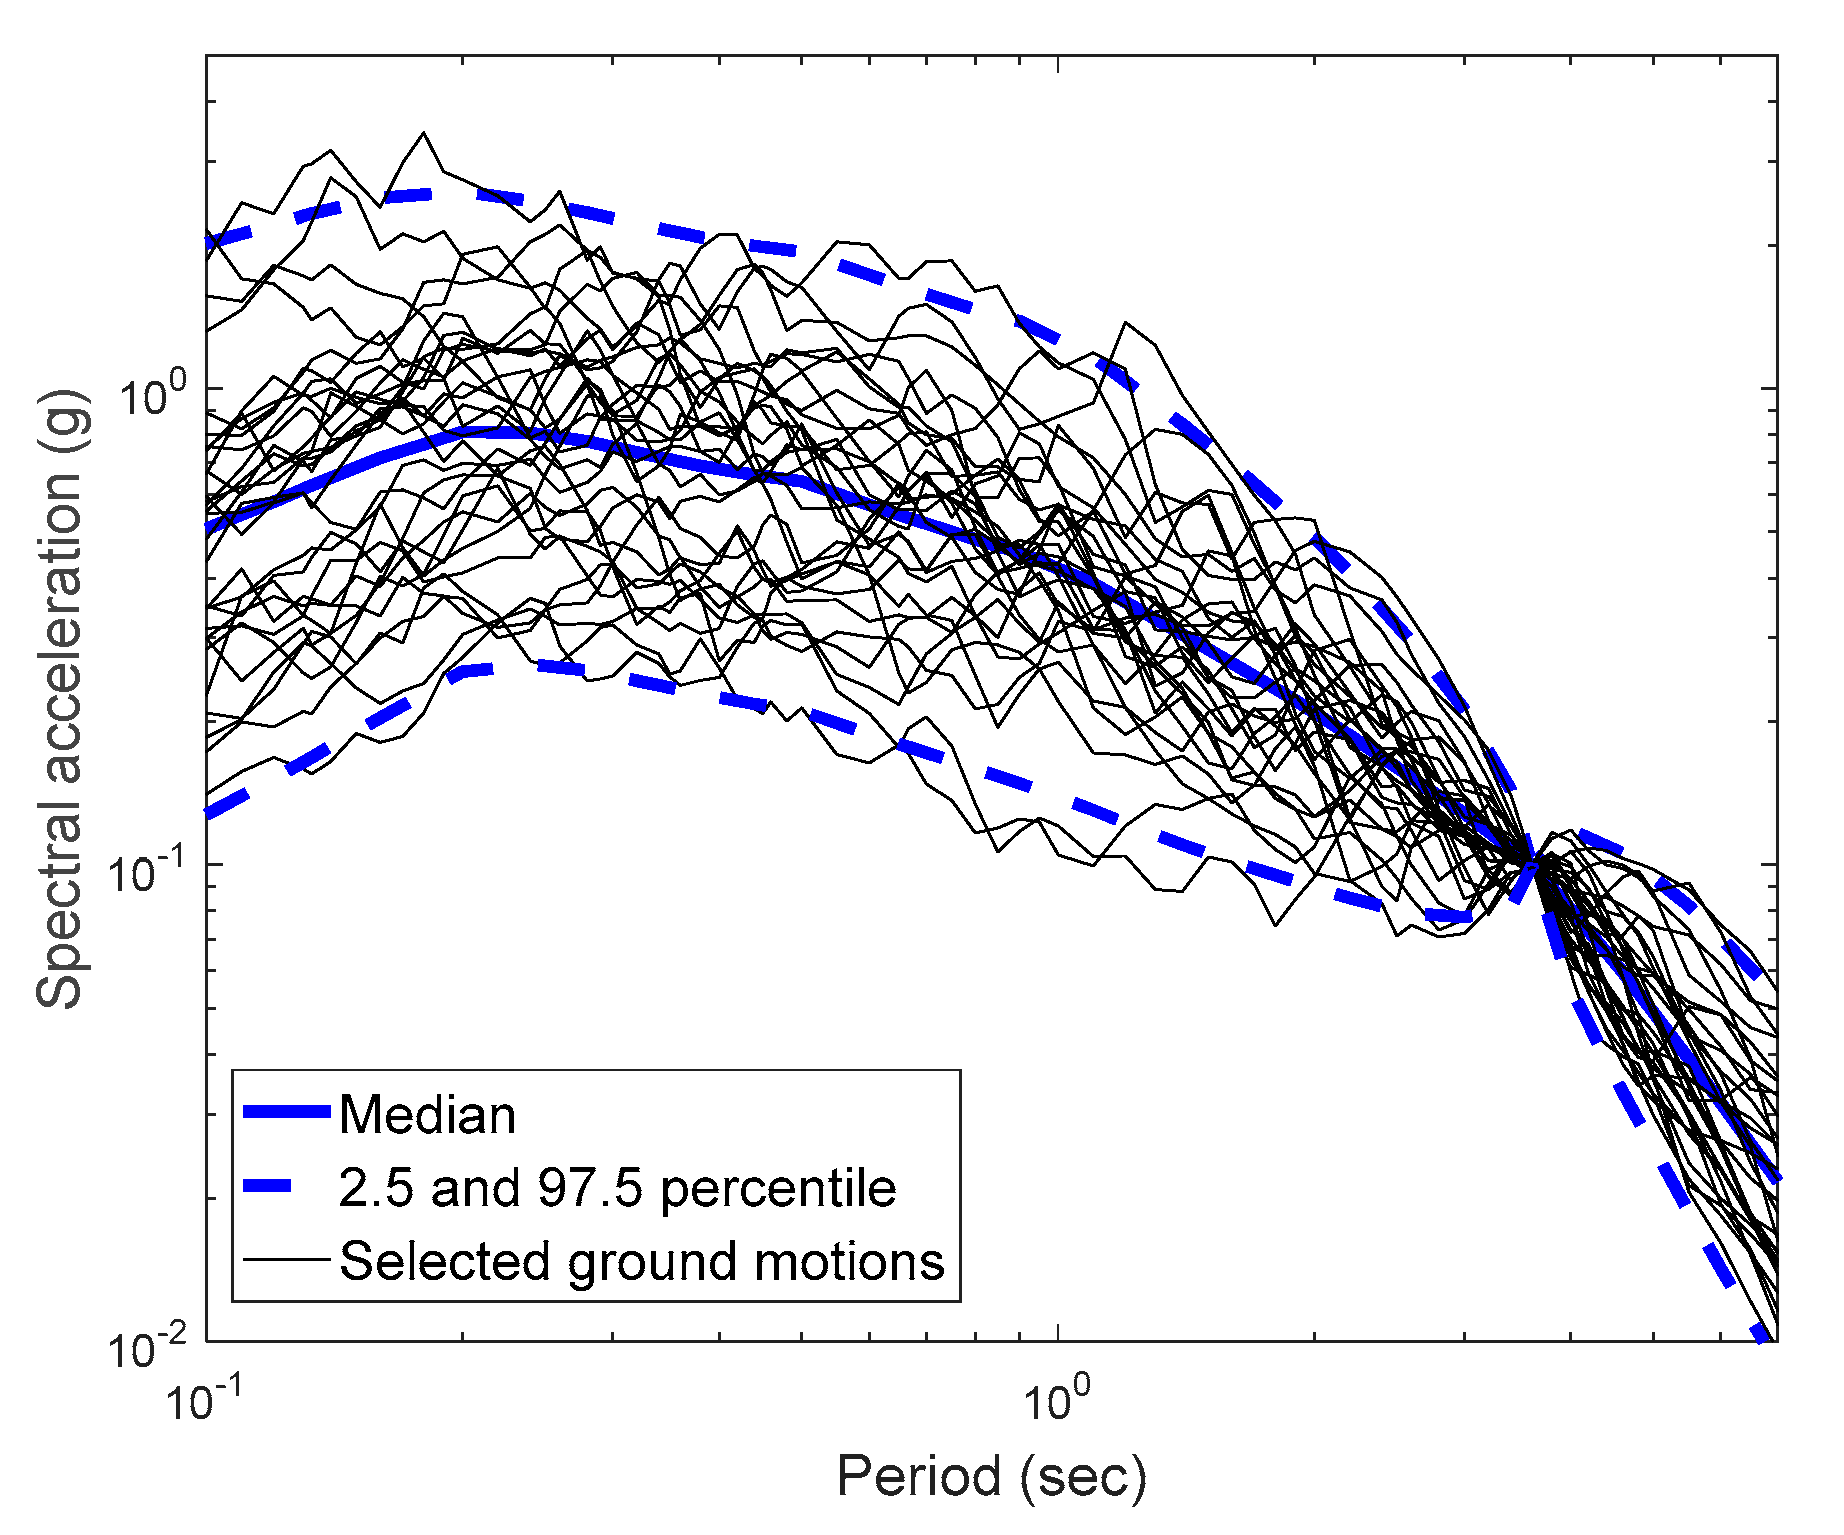
Three ground motion suites were used in the IDA of each analytical model, respectively. All the selected ground motions in each suite have earthquake magnitudes between 6.0 and 7.0 and epicenter distance between 10 and 50 km. The mean shear wave velocities for the upper 30 m of the site profile at the record station is between 150–420 m/s, which are similar to the condition of site class S4 applied to the design of the analytical models. Ground motions were chosen from the NGA-West2 ground motion database of the PEER, as in the design [13]. The ground motion records comprising a single suite were matched to the probability distribution as well as the median of the conditional spectrum by amplitude scaling in accordance with Baker and Lee’s study [33]. The fundamental mode period of each analysis model was chosen for the control period of the conditional spectra. Figure 8 shows the target and matched ground motion spectra for analytical Model B.
The individual ground motion suite is comprised of 30 pairs of horizontal components, much more than the seven pairs used for the design phase. Similar to the design of the analytical models, only the single horizontal component of ground motion was applied to the in-plane horizontal direction in a single IDA. Each component comprising a ground motion pair was applied to the IDA alternately, considering the randomness in the azimuth of ground motion. Therefore, total 60 IDA’s were conducted in the in-plane direction for a total of 60 ground motion components, respectively.
Regarding the number of ground motion records, 22 pairs of horizontal components are used in FEMA P695 [4]. Baltzopoulos et al. conducted a study on an adequate number of ground motion records necessary to predict the collapse of moment-resisting frames with nonlinear dynamic analysis [34]. According to their research result, 40 to 100 ground motion records are required to achieve a coefficient of variation below 10% with respect to the result using 200 records. The 60 ground motion components used in this study is a reasonable choice considering both computational efforts and accuracy in collapse probability.
It was assumed that the target spectrum was defined in the direction of the maximum spectral acceleration and GMRotD100 spectrum of each ground motion suite is used in amplitude scaling of each suite. The GMRotD100 spectrum is the 100-percentile of the geometric mean dependent on period [35,36]. Figure 9a shows the GMRotD100 spectra of individual ground motion pairs and the target MCE spectrum for the Model B. Figure 9b,c compare the target spectrum and the individual ground motion spectra for each horizontal component, respectively, for the Model B. The median spectrum and the target MCE spectrum for each direction have considerable difference in the spectral acceleration ordinate, but the difference is only slight at the control period.
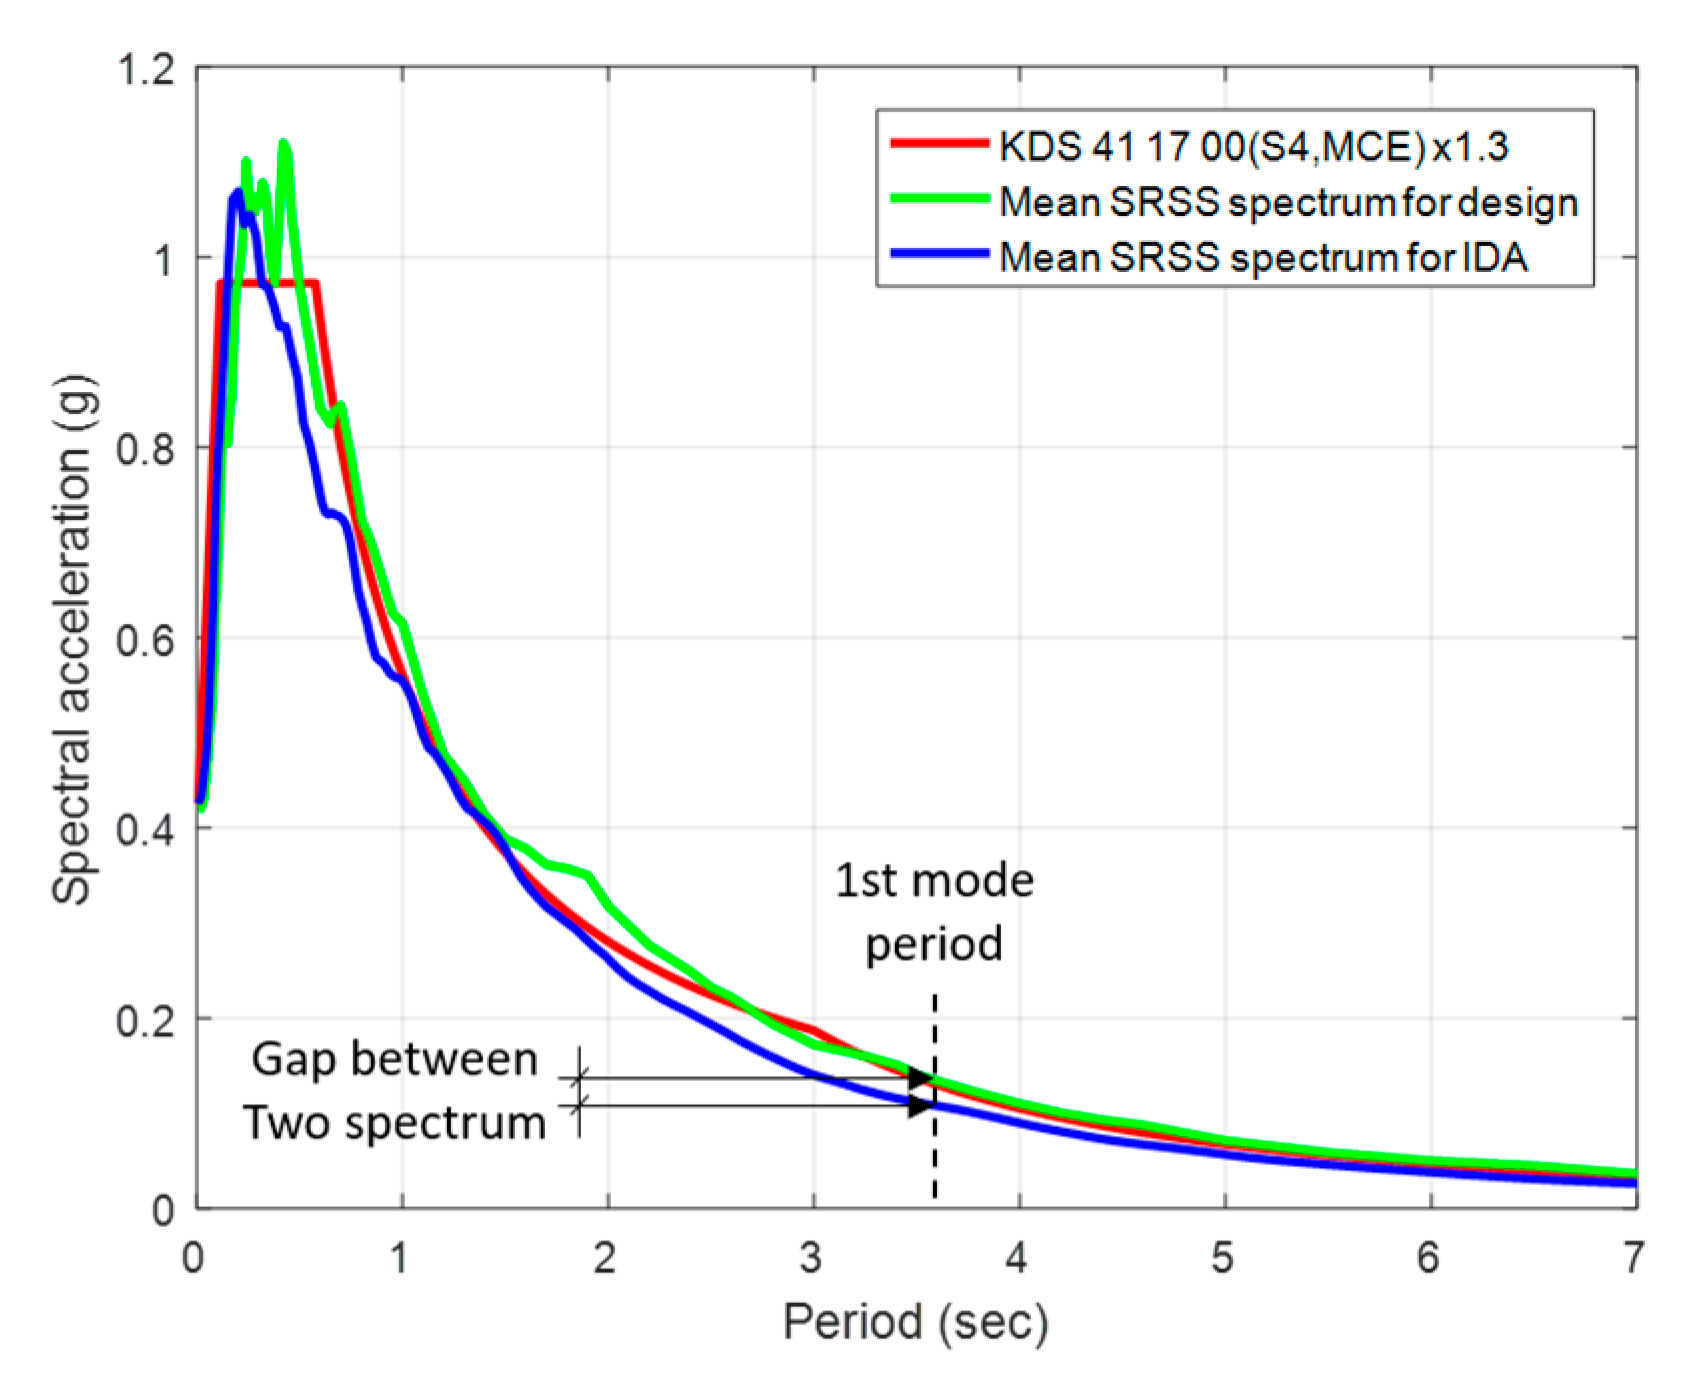
The ground motion suites for the design of the analytical models were scaled so that the mean SRSS spectrum is fit to 1.3 times the MCE spectrum, while those for IDA was scaled so that individual GMRotD100 spectrum has the same Sa(T1) as that of the MCE spectrum itself. The mean SRSS spectra of the ground motion suites for design and IDA is plotted, respectively, and compared to 1.3 times the MCE spectrum in Figure 10. The mean SRSS spectrum of the ground motion suite for IDA is lower than that for design at most periods longer than 0.2 s. For consistency between the design and performance evaluation, S M T , the spectral acceleration at T 1 for MCE spectrum itself, is modified into S M T using a scale factor defined by the ratio of spectral accelerations at T 1 on the mean SRSS spectra for design and IDA. The scale factor for each analytical model and corresponding S M T are summarized in Table 8. In the following, the collapse probability and collapse margin of wall group models are calculated for S M T rather than S M T .

3.3. Engineering Demand Parameter (EDP)

Four EDPs are considered in order to determine the collapse of the structure. Those EDPs include the rapid increase of inter-story drift, exceedance of the acceptable plastic hinge rotation angle, concrete compression failure at the boundary of wall section, and the shear failure, and are described as follows. Table 9 summarizes the acceptance criteria for the four EDPs and details are given in the following sections.

3.3.1. Inter-Story Drift

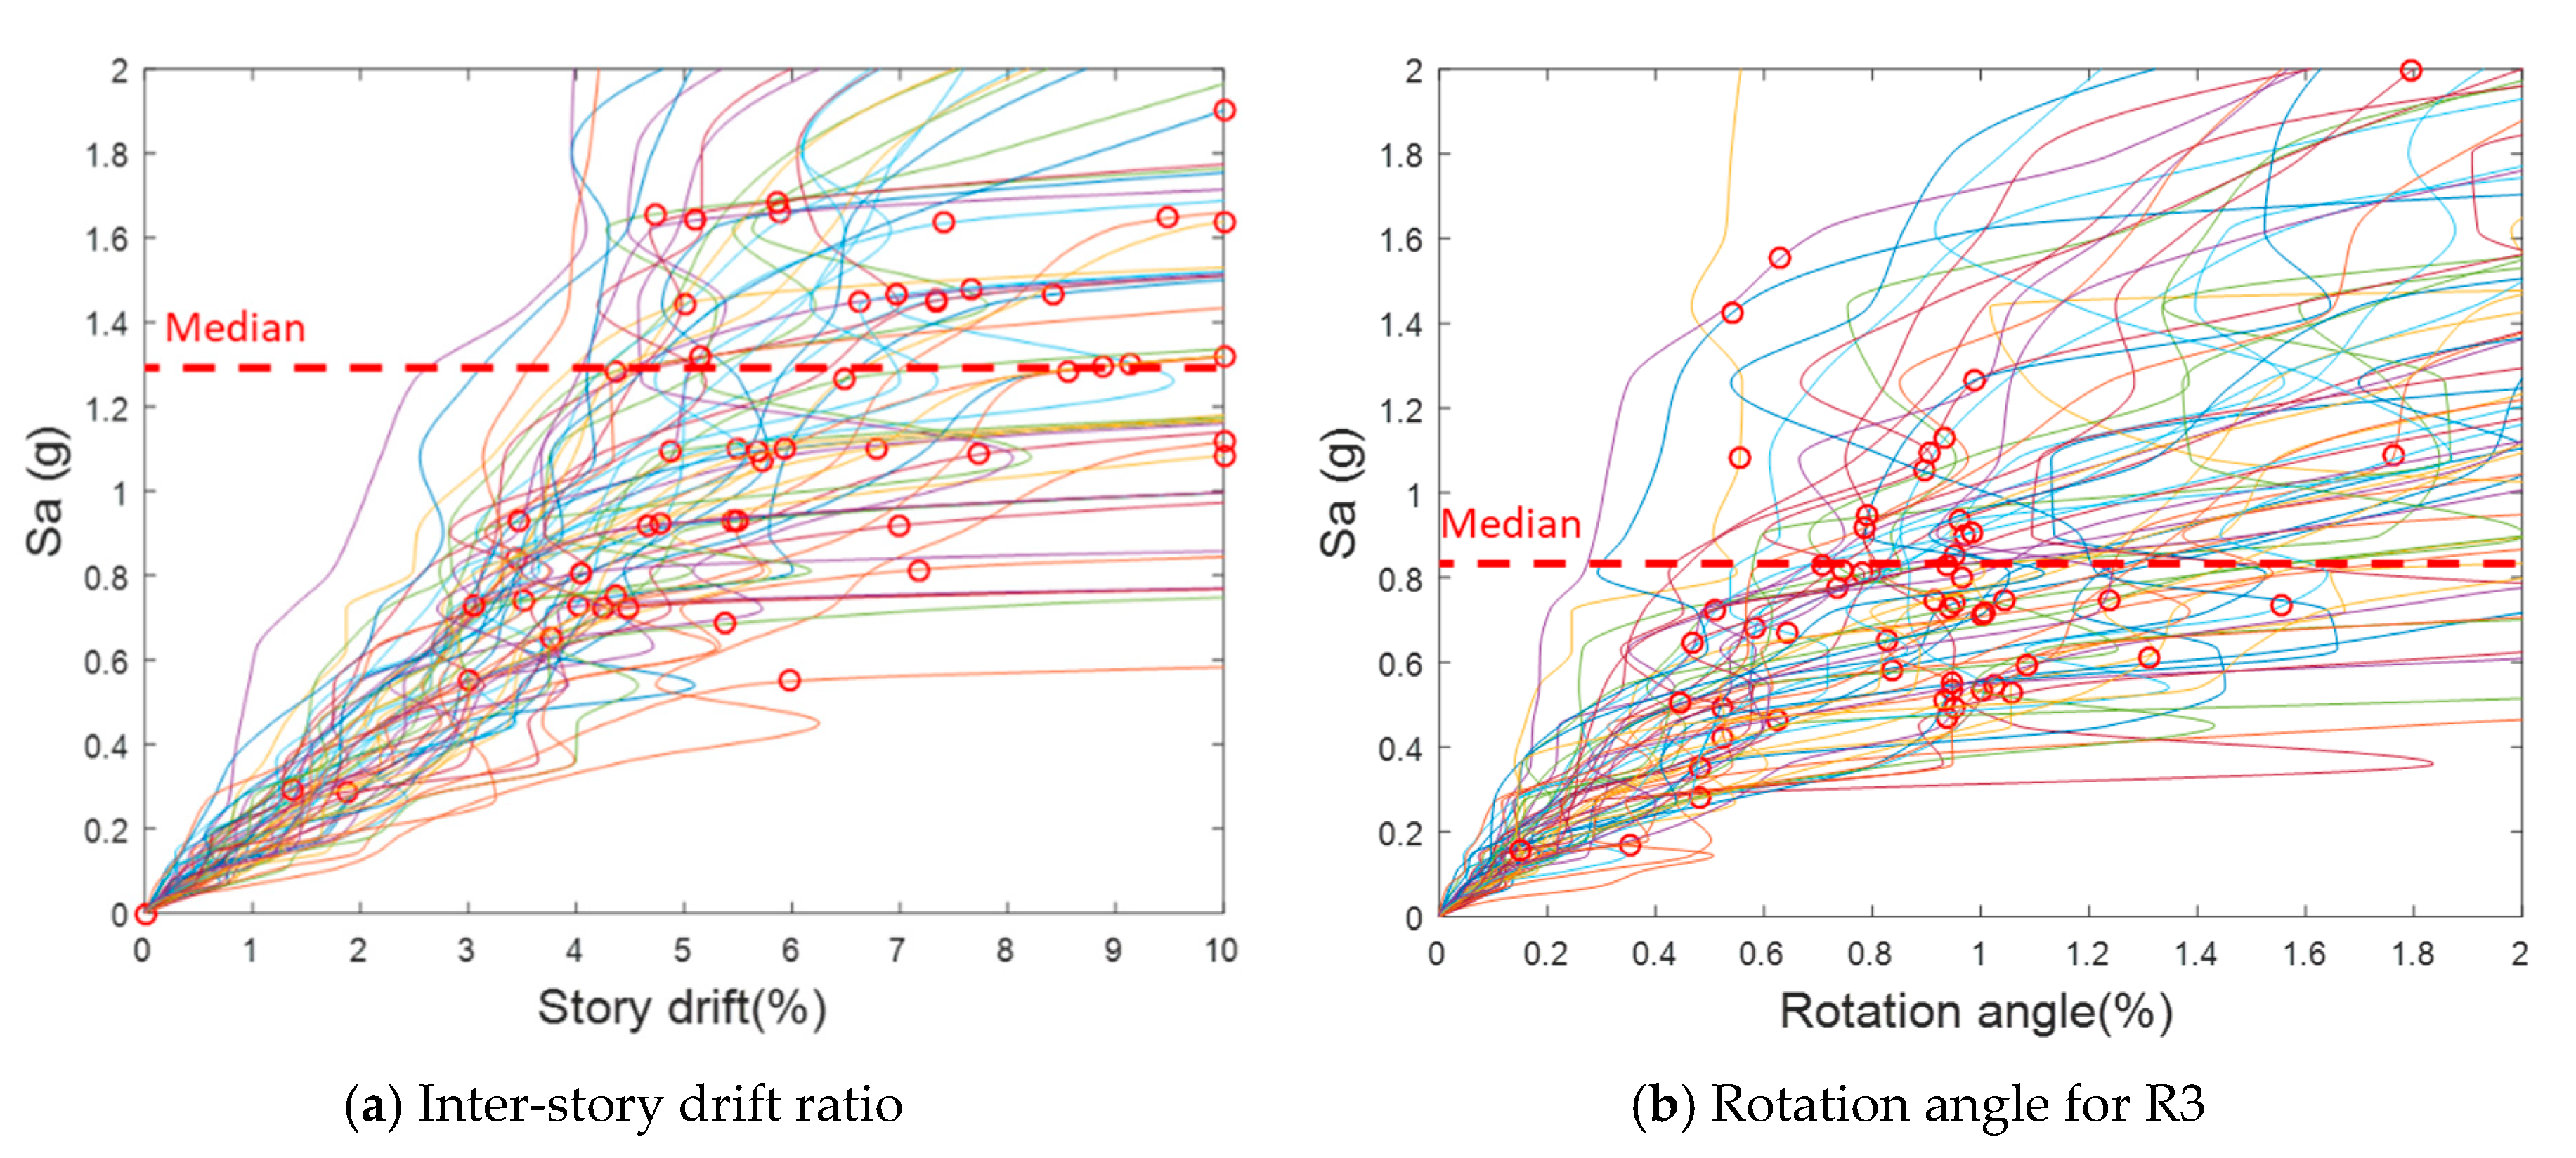
The first EDP is the maximum of the peak inter-story drift for entire stories. Figure 11a shows IDA curves with the horizontal axis of the inter-story drift and the vertical axis of the first mode spectral acceleration. The collapse of structures is a kind of instability and is identified by the rapid increase of the inter-story drift on the IDA curve. In other words, this is the case when the increase in spectral acceleration is small but the inter-story drift ratio is significantly increased. The collapse in this study is defined as the point on the IDA curve where the slope of the curve decrease to the 20% of the initial slope according to the recommendation by Vamvatsikos and Cornell [37]. However, when such a point did not occur, the point where the maximum inter-story drift ratio reaches 10%, which is judged to be a sufficient measure of instability, and was defined as the collapse point. The collapse points are marked with circles in Figure 11a.

3.3.2. Plastic Hinge Rotation Angle

The second EDP is the plastic hinge rotation angle of the wall element. The exceedance of acceptance criteria by at least one shear wall element was deemed collapse. The acceptance criteria for collapse prevention defined in ASCE 41-17 was adopted. The allowable plastic rotation angle is dependent on the extent of confinement at the boundary of the wall section and was determined for each analysis case, considering the axial force ratio and shear force demand determined from the dynamic response analysis results. IDA curves with respect to the plastic hinge rotation angle are plotted in Figure 11b for the component wall R3 in Model A. The circles represent a point where the EDP reaches the acceptance criteria. Plastic hinge rotation angles at the circles are different because they are dependent on the shear force demand for the wall.

3.3.3. Compression Strain

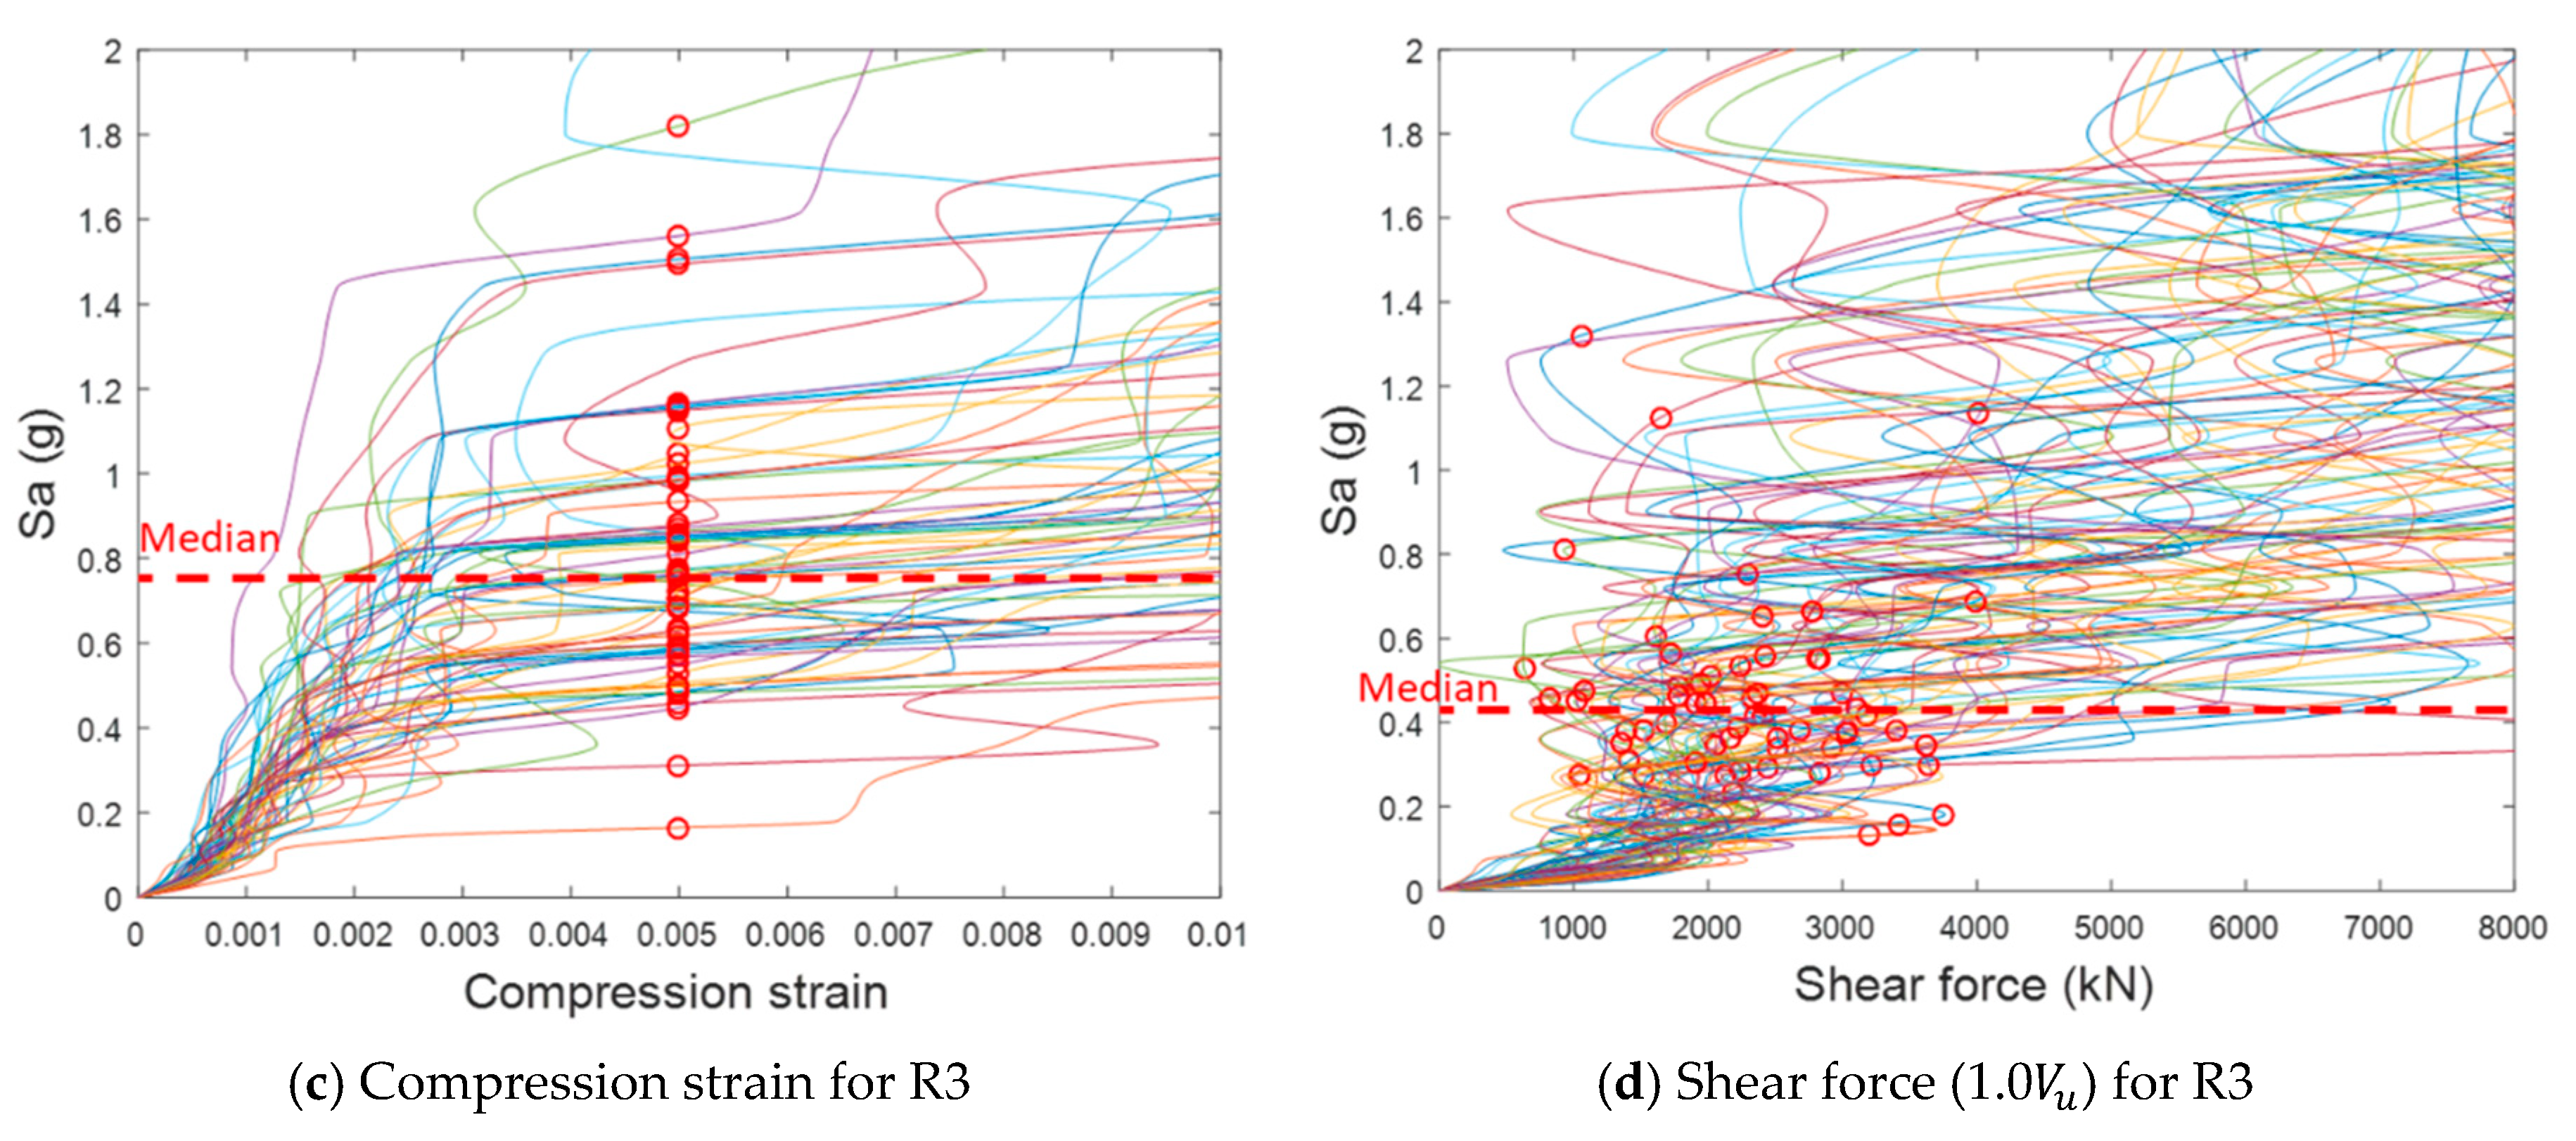
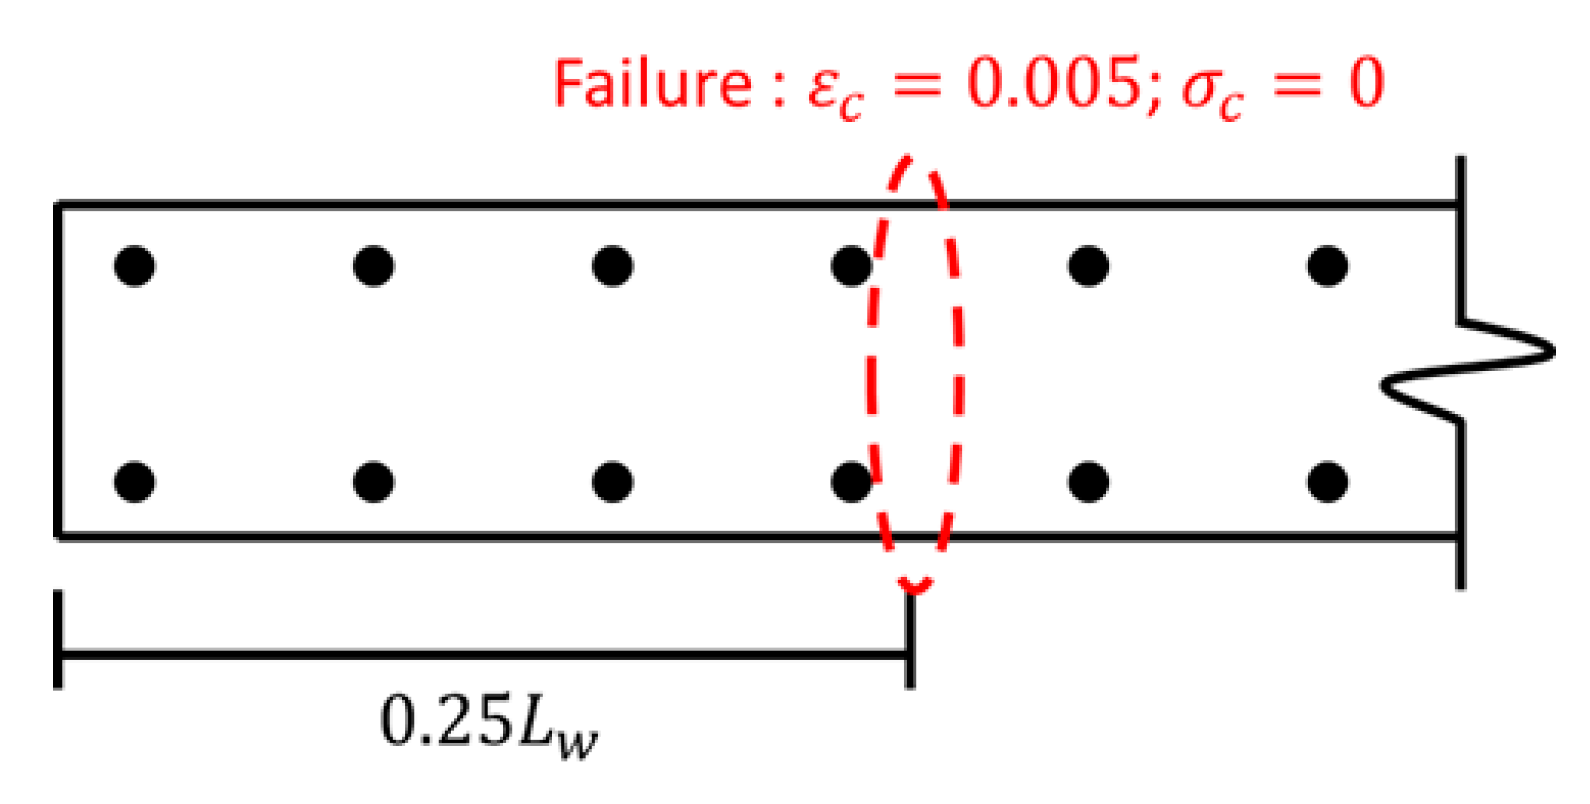
Thirdly, concrete compression failure at the boundary of the wall section can cause instability of the structure. The instability of the wall structure due to concrete compressive failure is assumed to occur when the compressive strain of concrete reaches a value where the stress drops to zero, passing through the peak stress at 25% of the wall length from the compressive extreme of the wall section as shown in Figure 12, according to the study of Gogus and Wallace and the NIST 10-917-8 report [6,7,38]. This is based on experiences showing that the instability of wall structures occurs in pushover analysis when concrete stress at such a place drops to zero. In this study, pushover analysis for the three analytical models was conducted to examine the adequacy of the acceptance criteria for the compressive strain at the specified location. The concrete model used in this study reaches residual strength (1% of the maximum strength) at the strain of 0.005, as mentioned in the preceding section. The results of the pushover analysis are shown in Figure 13, in which the roof drifts where the compressive strain reaches 0.005 at the point of 25% wall length, away from the compressive extreme of the section are also represented. As a result of the analysis, it is observed that a sharp drop of strength and the concrete compression failure at the specified location occur simultaneously. Therefore, the concrete compression failure criteria can predict collapse appropriately and included in collapse probability calculation. IDA curves with respect to the compression strain are plotted in Figure 11c for the component wall R3 in Model A. The circles represent a point where the compression strain reaches the acceptance criteria for the compression strain.

3.3.4. Shear Strength

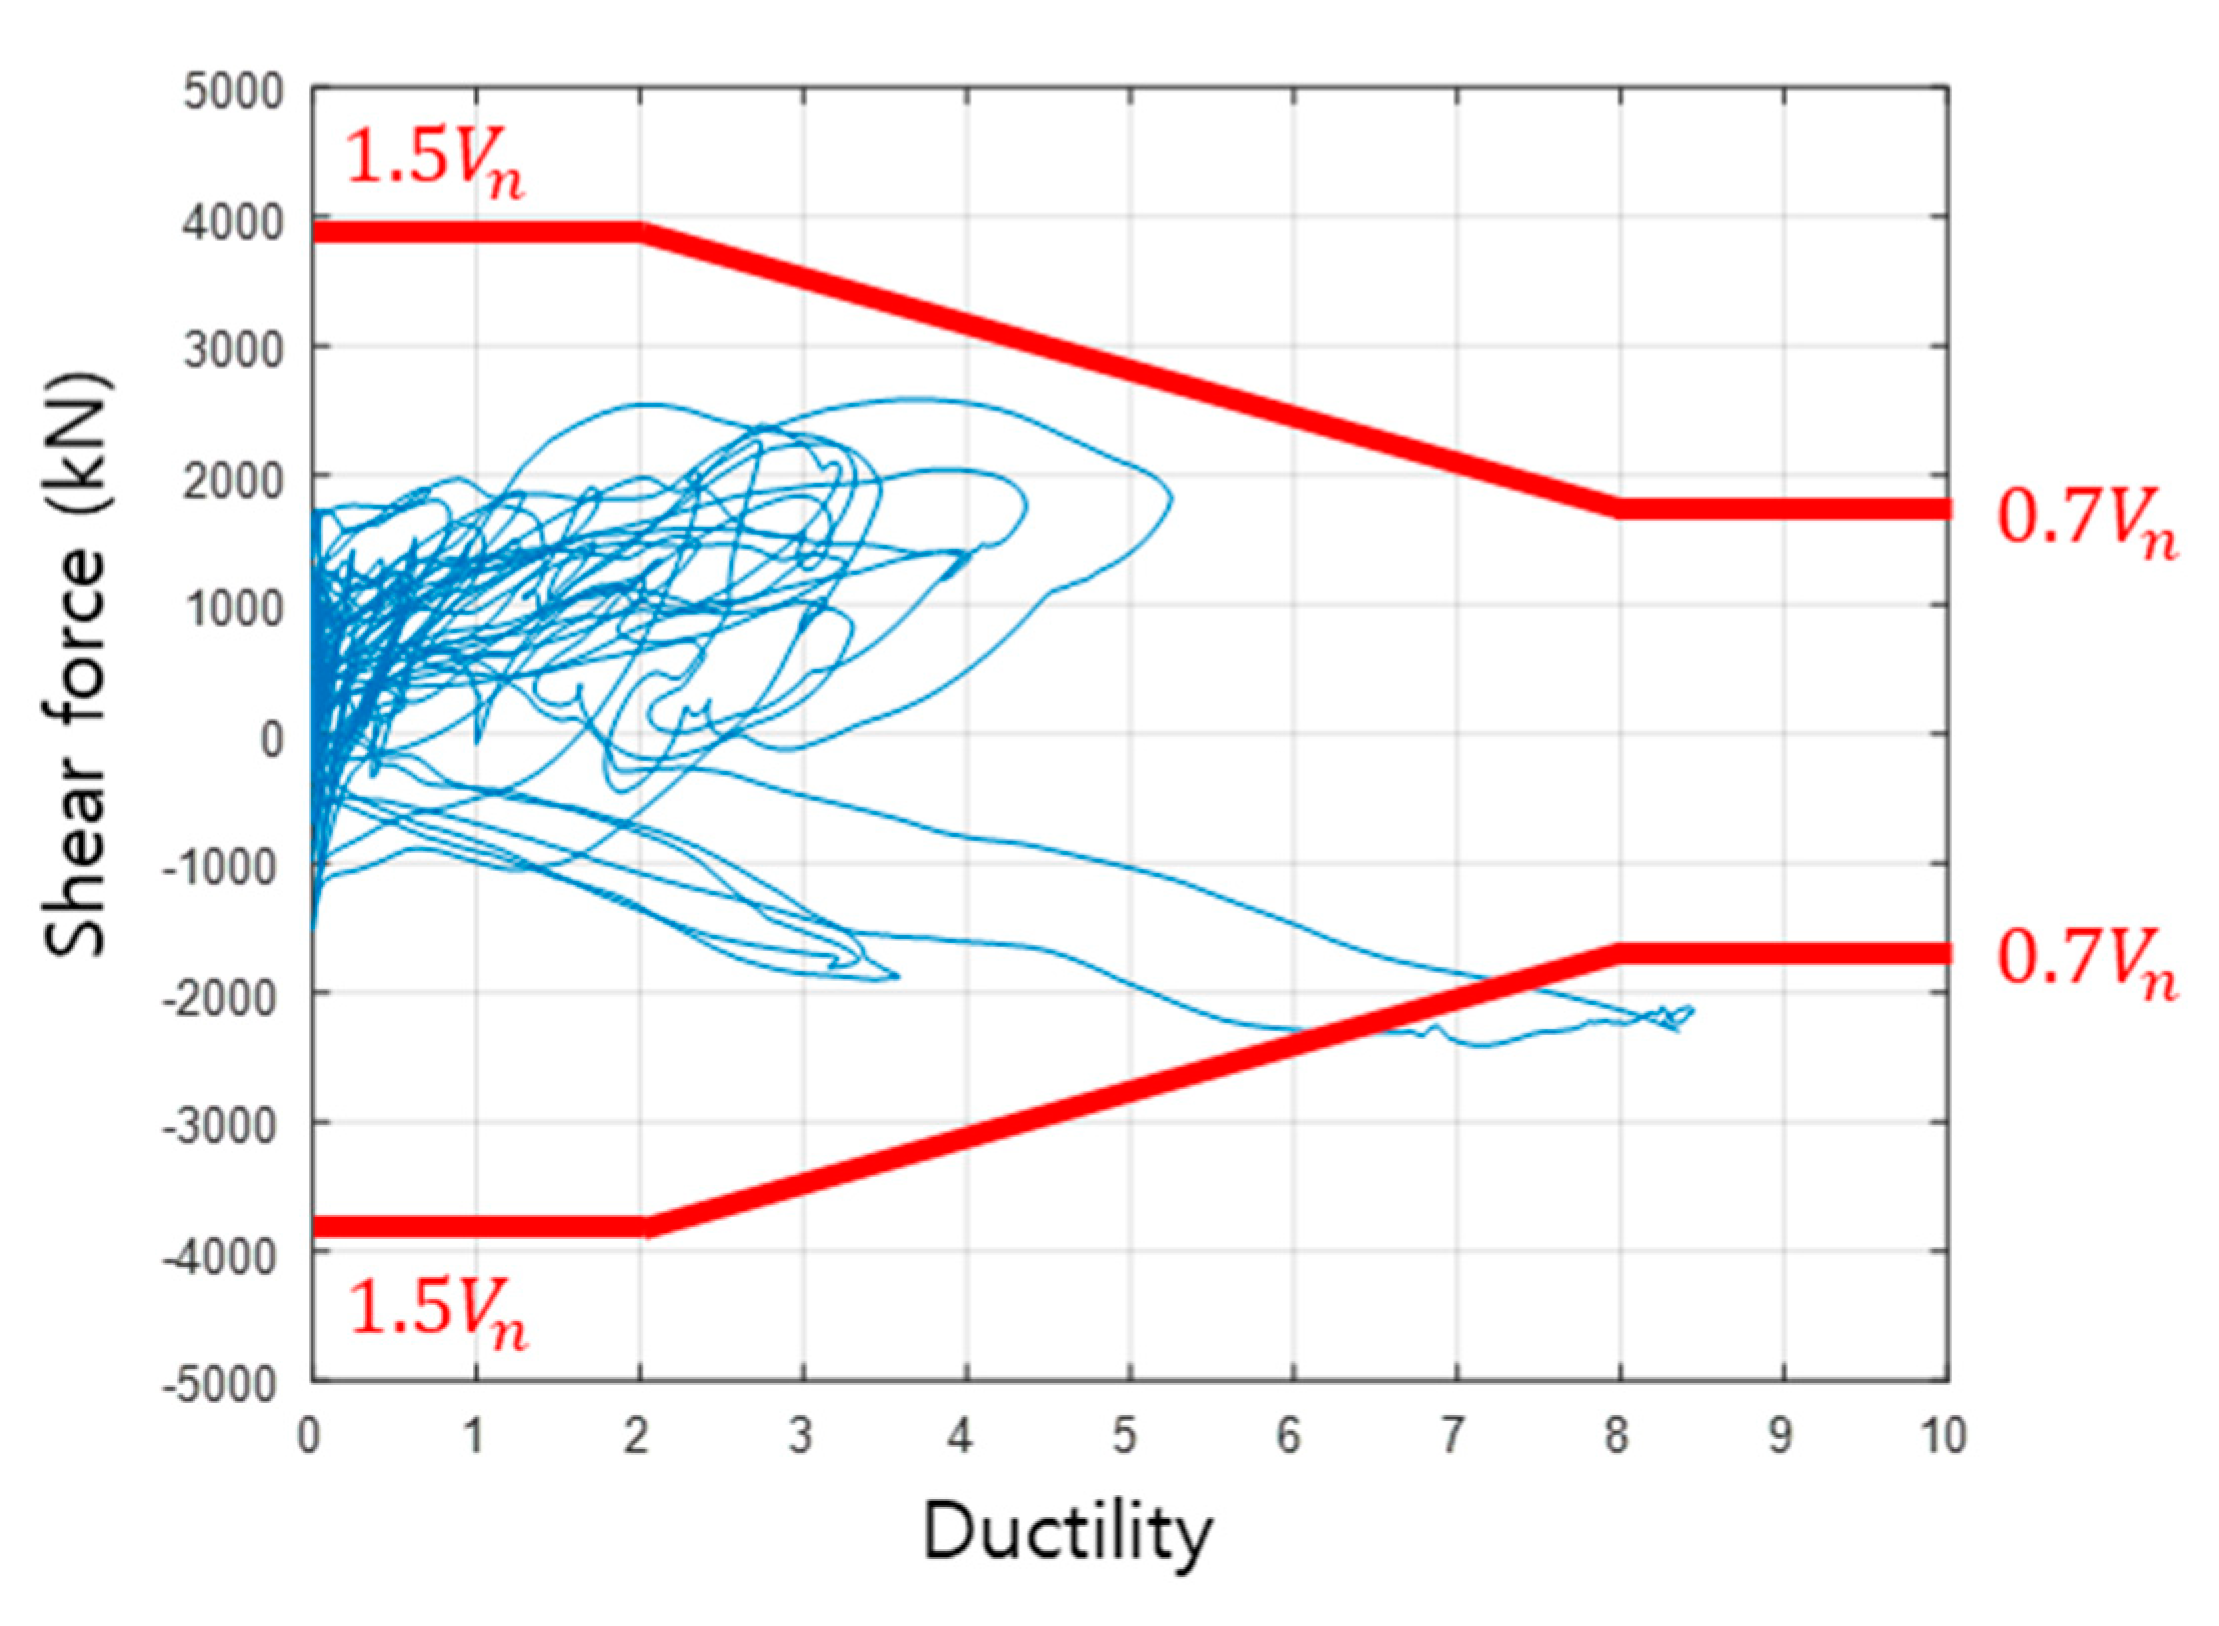
In literature, decrease in shear strength with respect to flexural ductility was considered in the seismic evaluation based on existing experimental data [20,39,40]. This reduction of shear strength is caused by increasing damage due to flexural deformation. In this study, the envelope of the shear strength with respect to the flexural ductility suggested in the study by Gogus was adopted to examine whether the failure of shear components that are modeled elastically occurs or not after each nonlinear dynamic analysis. An example of shear failure envelope and the history of shear force with respect to flexural ductility is illustrated in Figure 14. In the illustrated model, 1.5 times the nominal strength is permitted when the flexural ductility is 2 or less, but only 0.7 times the nominal strength is permitted when the flexural ductility reaches 8 or more. When the flexural ductility value is between 2 and 8, linear interpolation is used. IDA curves with respect to the shear force are plotted in Figure 11d for the component wall R3 in Model A. The circles represent a point where the shear force reaches the acceptance criteria. Shear forces at those circles are different because they are dependent on the flexural ductility of the wall.

3.4. Processing the Result of IDA

The peak value of an EDP was calculated, and the corresponding acceptance criterion was checked for each story and component wall. The most critical story or component wall determined whether the failure occurred or not by the EDP. The collapse of a whole analytical model was determined by the EDP that exceeded the acceptance criteria at the lowest IM in the IDA for a single ground motion record. By fitting the IM–collapse probability relation, the seismic fragility curve for each analytical model was calculated. In a similar way, the seismic fragility curve can be calculated for each component wall.

4. Seismic Fragility Assessment Results

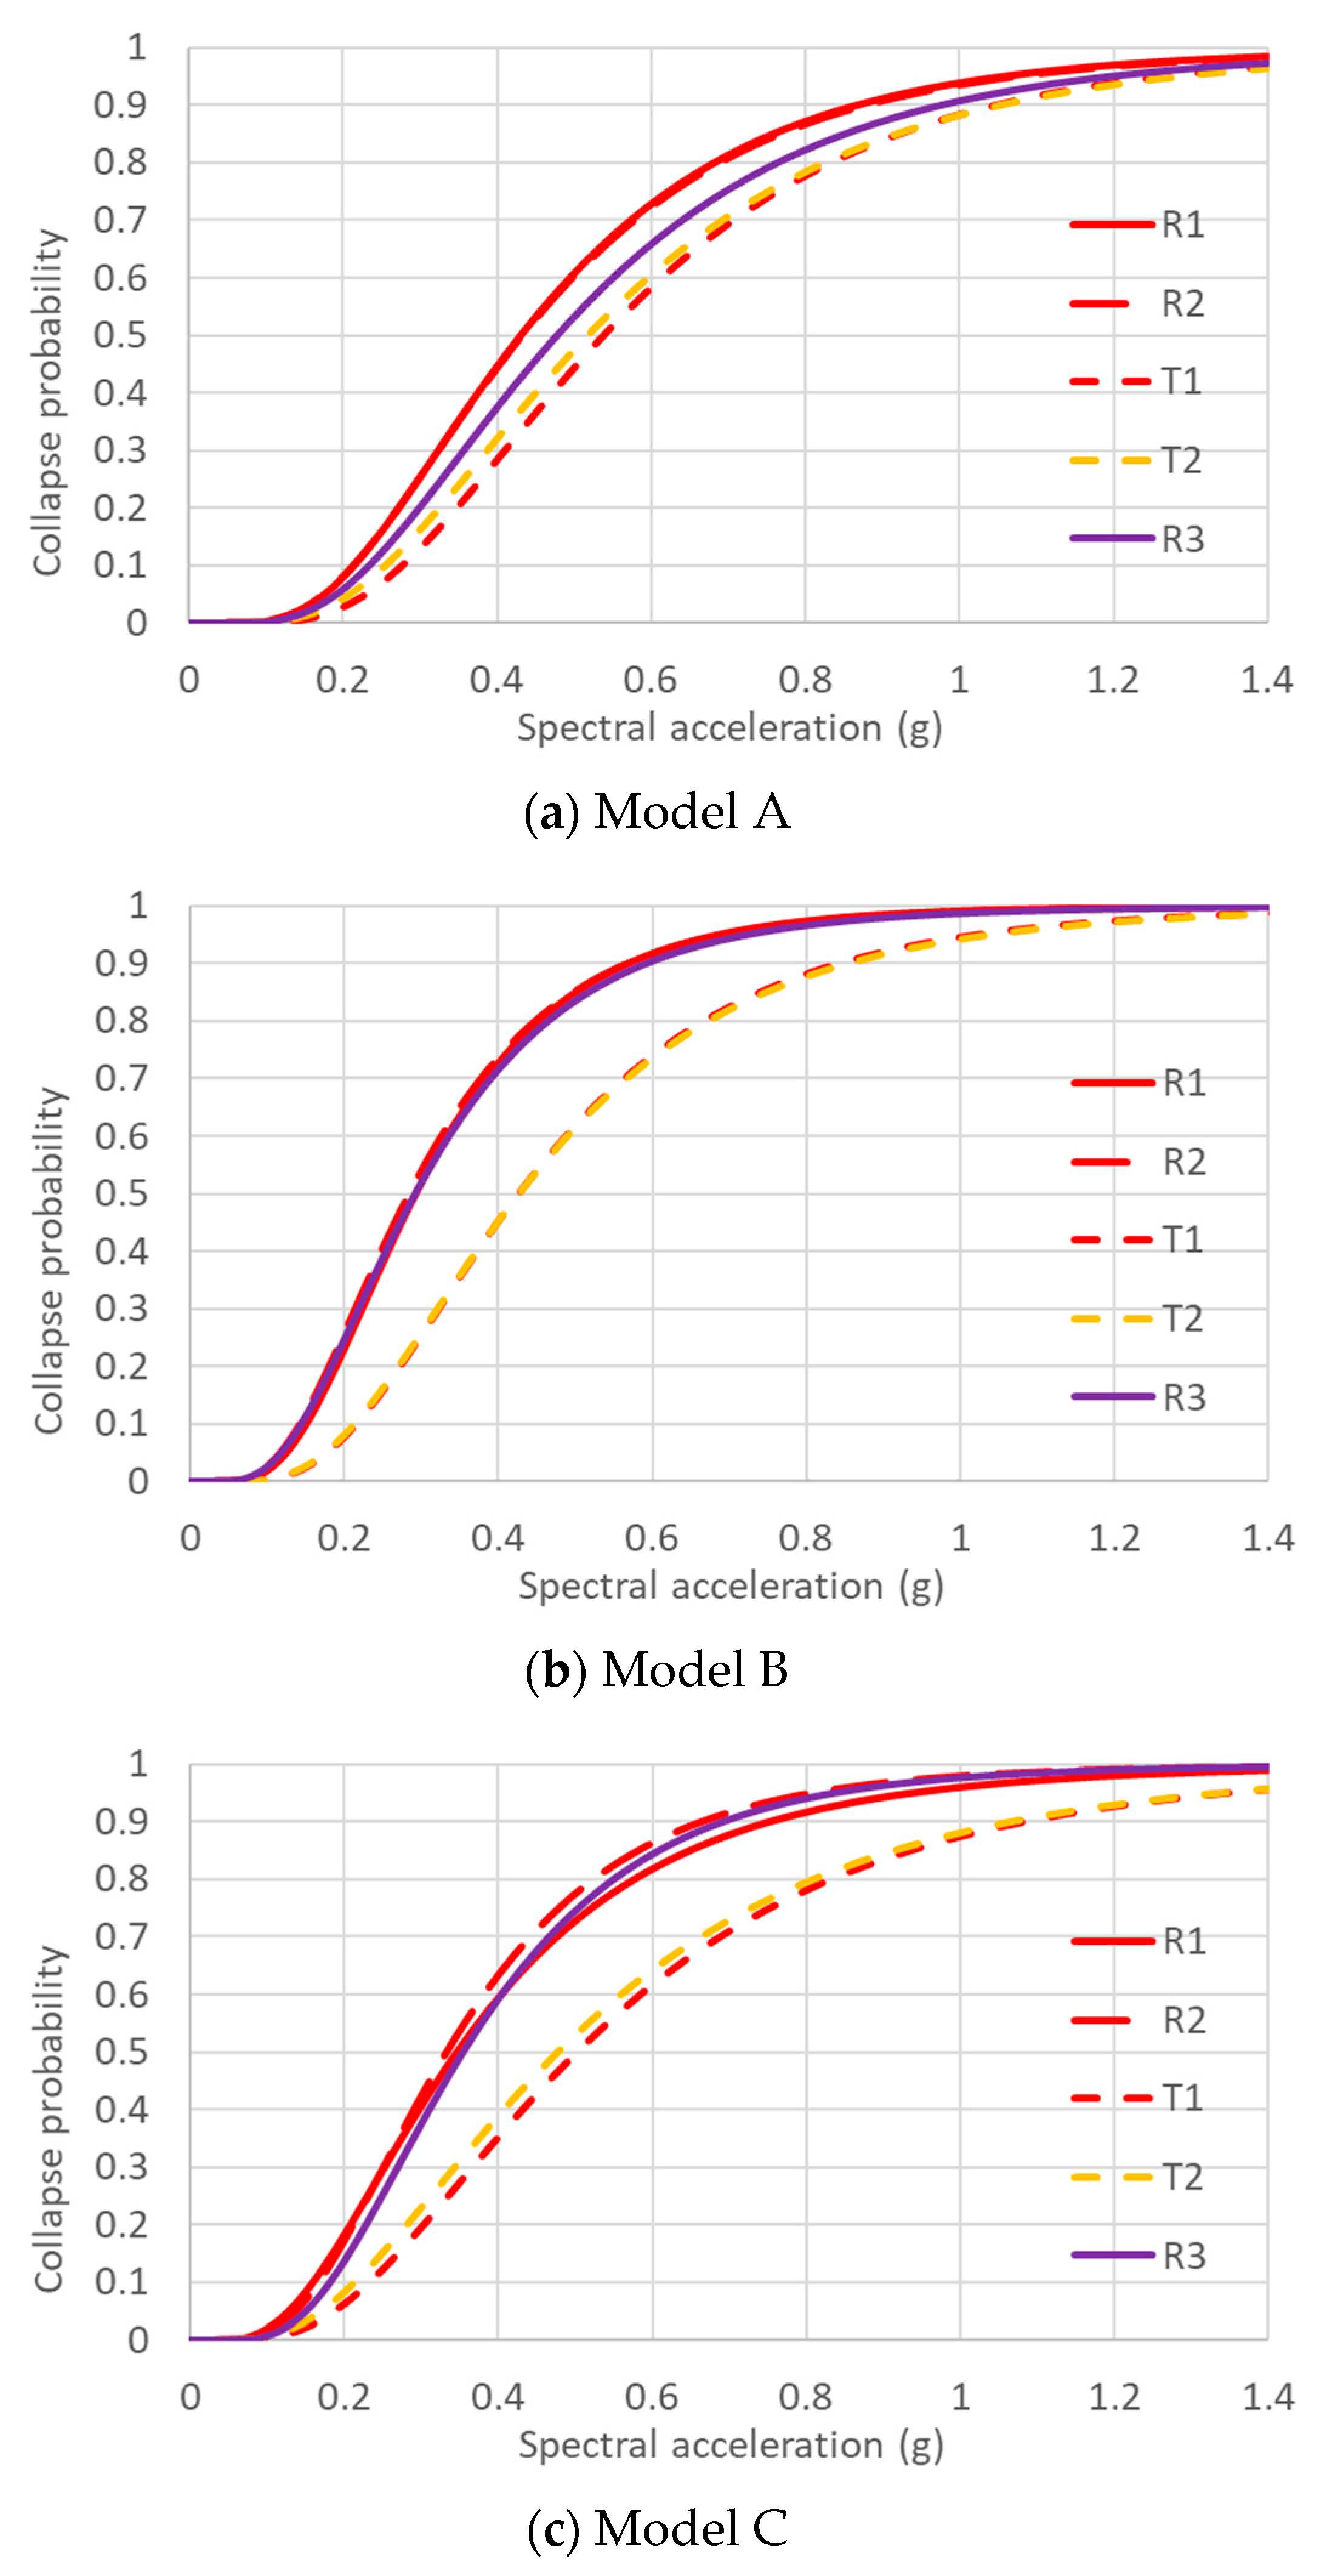
The result of seismic fragility assessment based on IDA is summarized for each component wall of three analytical models in Figure 15, and Table 10 and Table 11. All the shear wall groups were designed to satisfy shear force demand with an amplification factor 1.2 to the mean peak shear force in accordance with the AIK guidelines. The seismic fragility curves in Figure 15 were constructed based on the failure mode that occurred at the lowest intensity measure among four failure modes investigated in the IDA. That is, if one of the four EDPs does not satisfy its acceptance criteria earlier than others, the corresponding intensity measure was used for the calculation of fragility curves.
FEMA P695 requires the collapse probability of individual building model to be limited below 20%, and the average collapse probability for the performance group comprised of different structural models with the same structural system to be limited below 10%. All the three analytical models have a collapse probability less than 20% in Table 10 if the maximum collapse probability among the component walls is defined as the collapse probability of the analytical model. Additionally, the average collapse probability among the three analytical models is 8.1%, which is below the 10% limit. As a result, all of the three analytical models satisfy the requirement for collapse prevention as prescribed in FEMA P695.
The wall with the highest collapse probability in each wall group model has 2.5 m length and 30% axial force ratio from the observation of Model A, B, and C. In other words, it was found that the component walls with a high risk of collapse are short walls with large axial forces. This is supposed to be the result of the predominant effect of the compression failure at the wall boundary region, rather than shear failure.
ACMR is examined for individual models as well as the performance group comprised of all the three models in comparison with the FEMA P695 criteria ACMR10% and ACMR20%, respectively. In Table 11, it is observed that the lowest ratio of ACMR over ACMR20% in each wall group model is obtained for the wall with the highest collapse probability, e.g., R2 in Model A. It is observed that the ACMR20% criteria corresponding to the 20% collapse probability are met for all of the three wall group models. When three wall group models are grouped as a single performance group, the acceptance criteria ACMR10% corresponding to the 10% collapse probability should be met for the average ACMR. After identifying the ACMR of the most vulnerable wall in each wall group model as a representative ACMR, three ACMRs are averaged and compared with the ACMR10% acceptance criteria. As shown in the last row of Table 11, the performance group satisfies the ACMR10% acceptance criteria.
Table 12 summarizes performance evaluation results for the performance group designed using different shear force amplification factors 1.0, 1.2 and 1.5 to the design shear force considering record-to-record variability. The same procedure and criteria as used in Table 10 and Table 11 are used in the performance evaluation. It is observed that the collapse performance criteria of FEMA P695 were satisfied when the amplification factors 1.2 and 1.5 were used. However, the collapse performance criteria was not satisfied when the amplification factor 1.0 was used. In addition, amplification factor 1.5 improved the collapse probability at MCE and ACMR only minorly compared to amplification factor 1.2. Therefore, 1.2 can be a marginal value for the amplification factor of shear force.
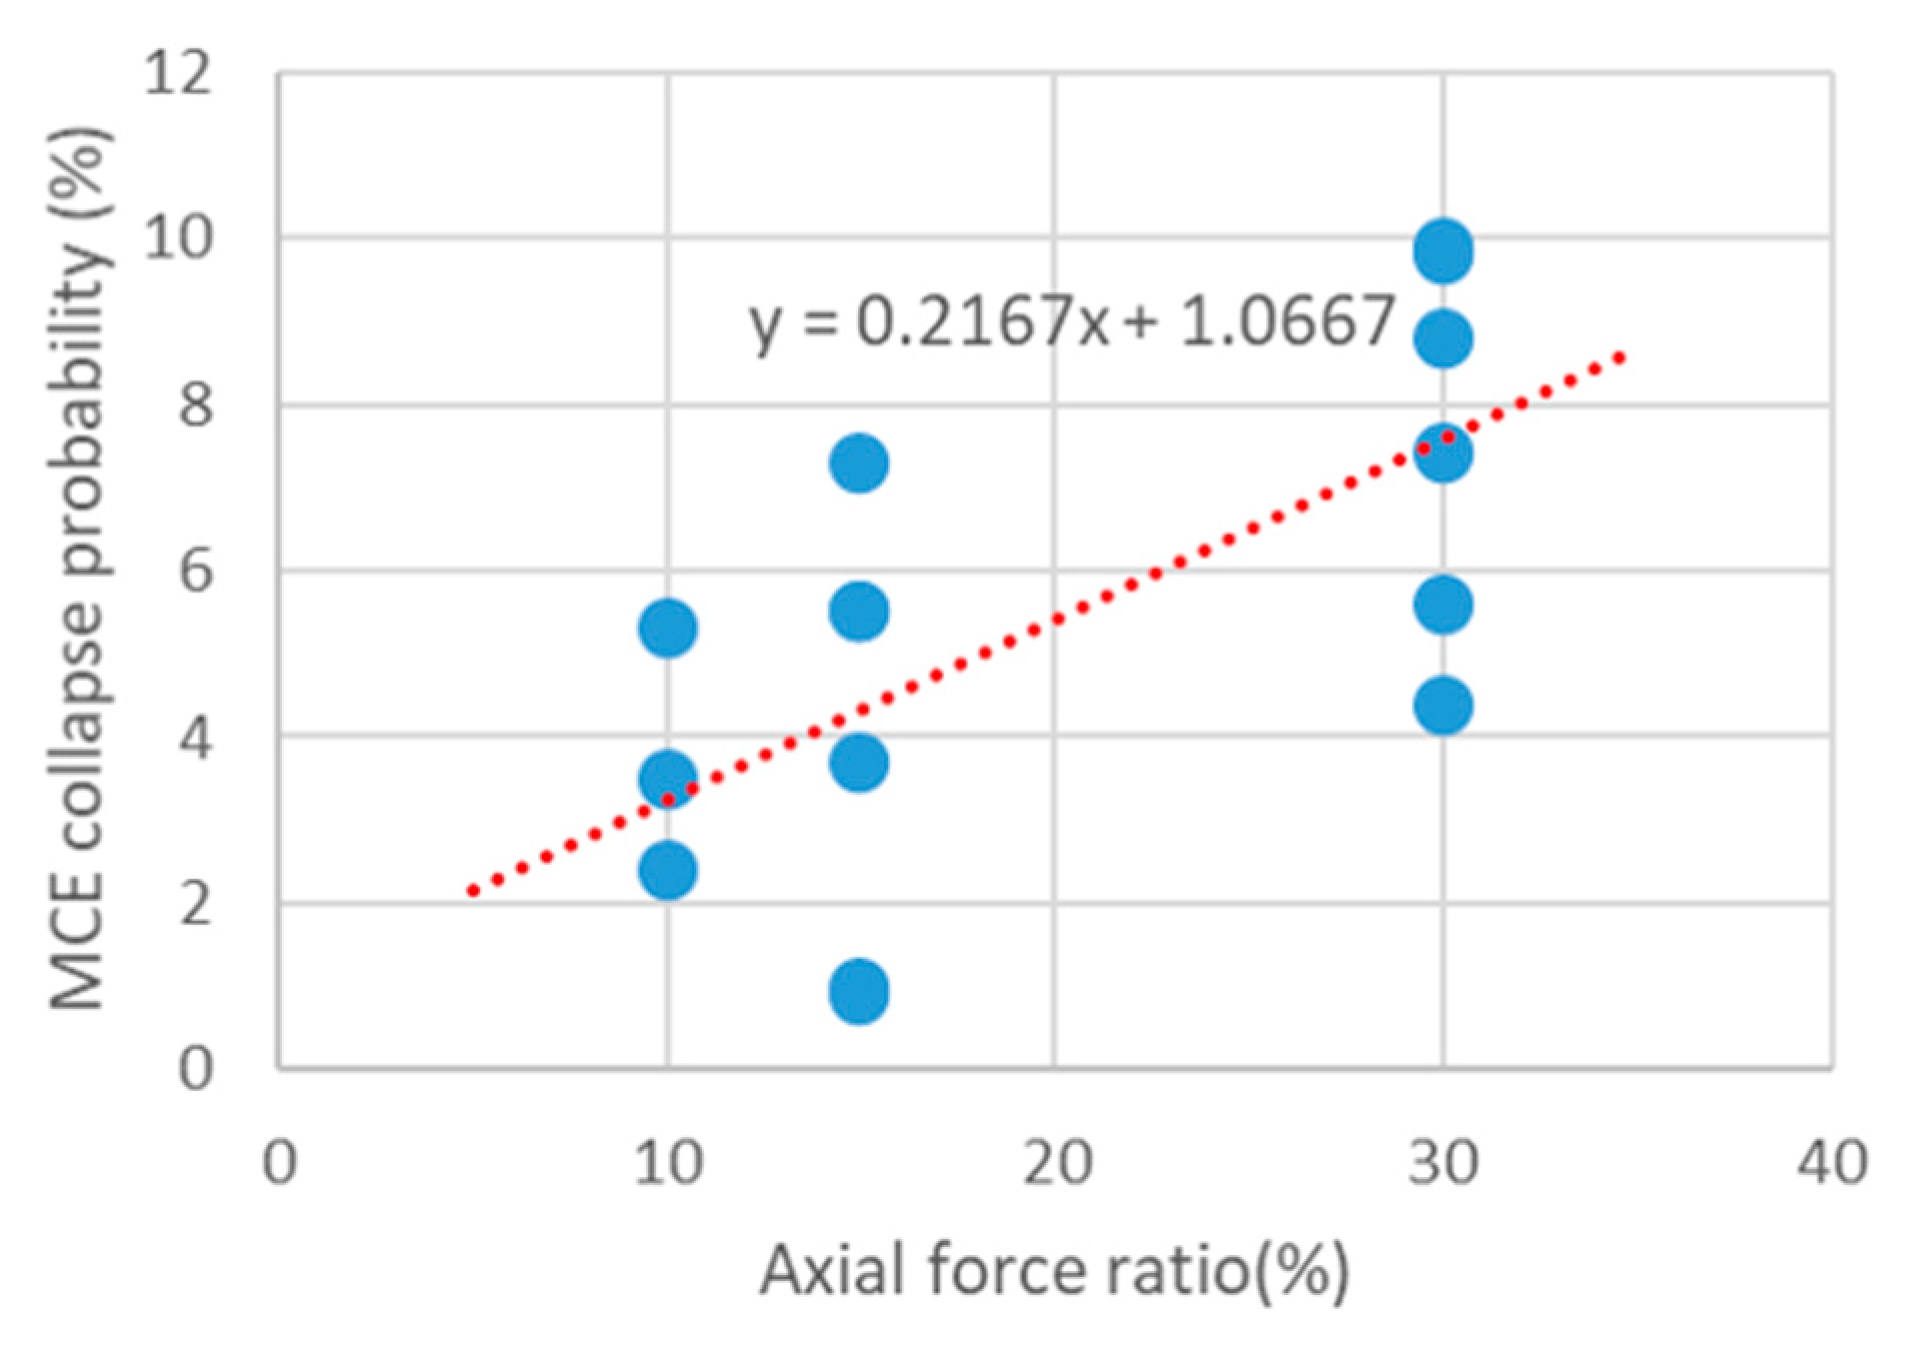
Figure 16 shows relationship between the axial force ratio and the collapse probability of individual component walls shown in Table 10. Component walls having an axial force ratio of 10% have collapse probabilities from 2.4 to 5.3% while component walls having an axial force ratio of 30% have a collapse probability from 4.4 to 9.9%. Therefore, the collapse probability of shear walls tend to increase as the axial force ratio of those walls increases. This result is consistent with the fact that the deformation capacity of shear walls usually decreases with higher axial force ratio.
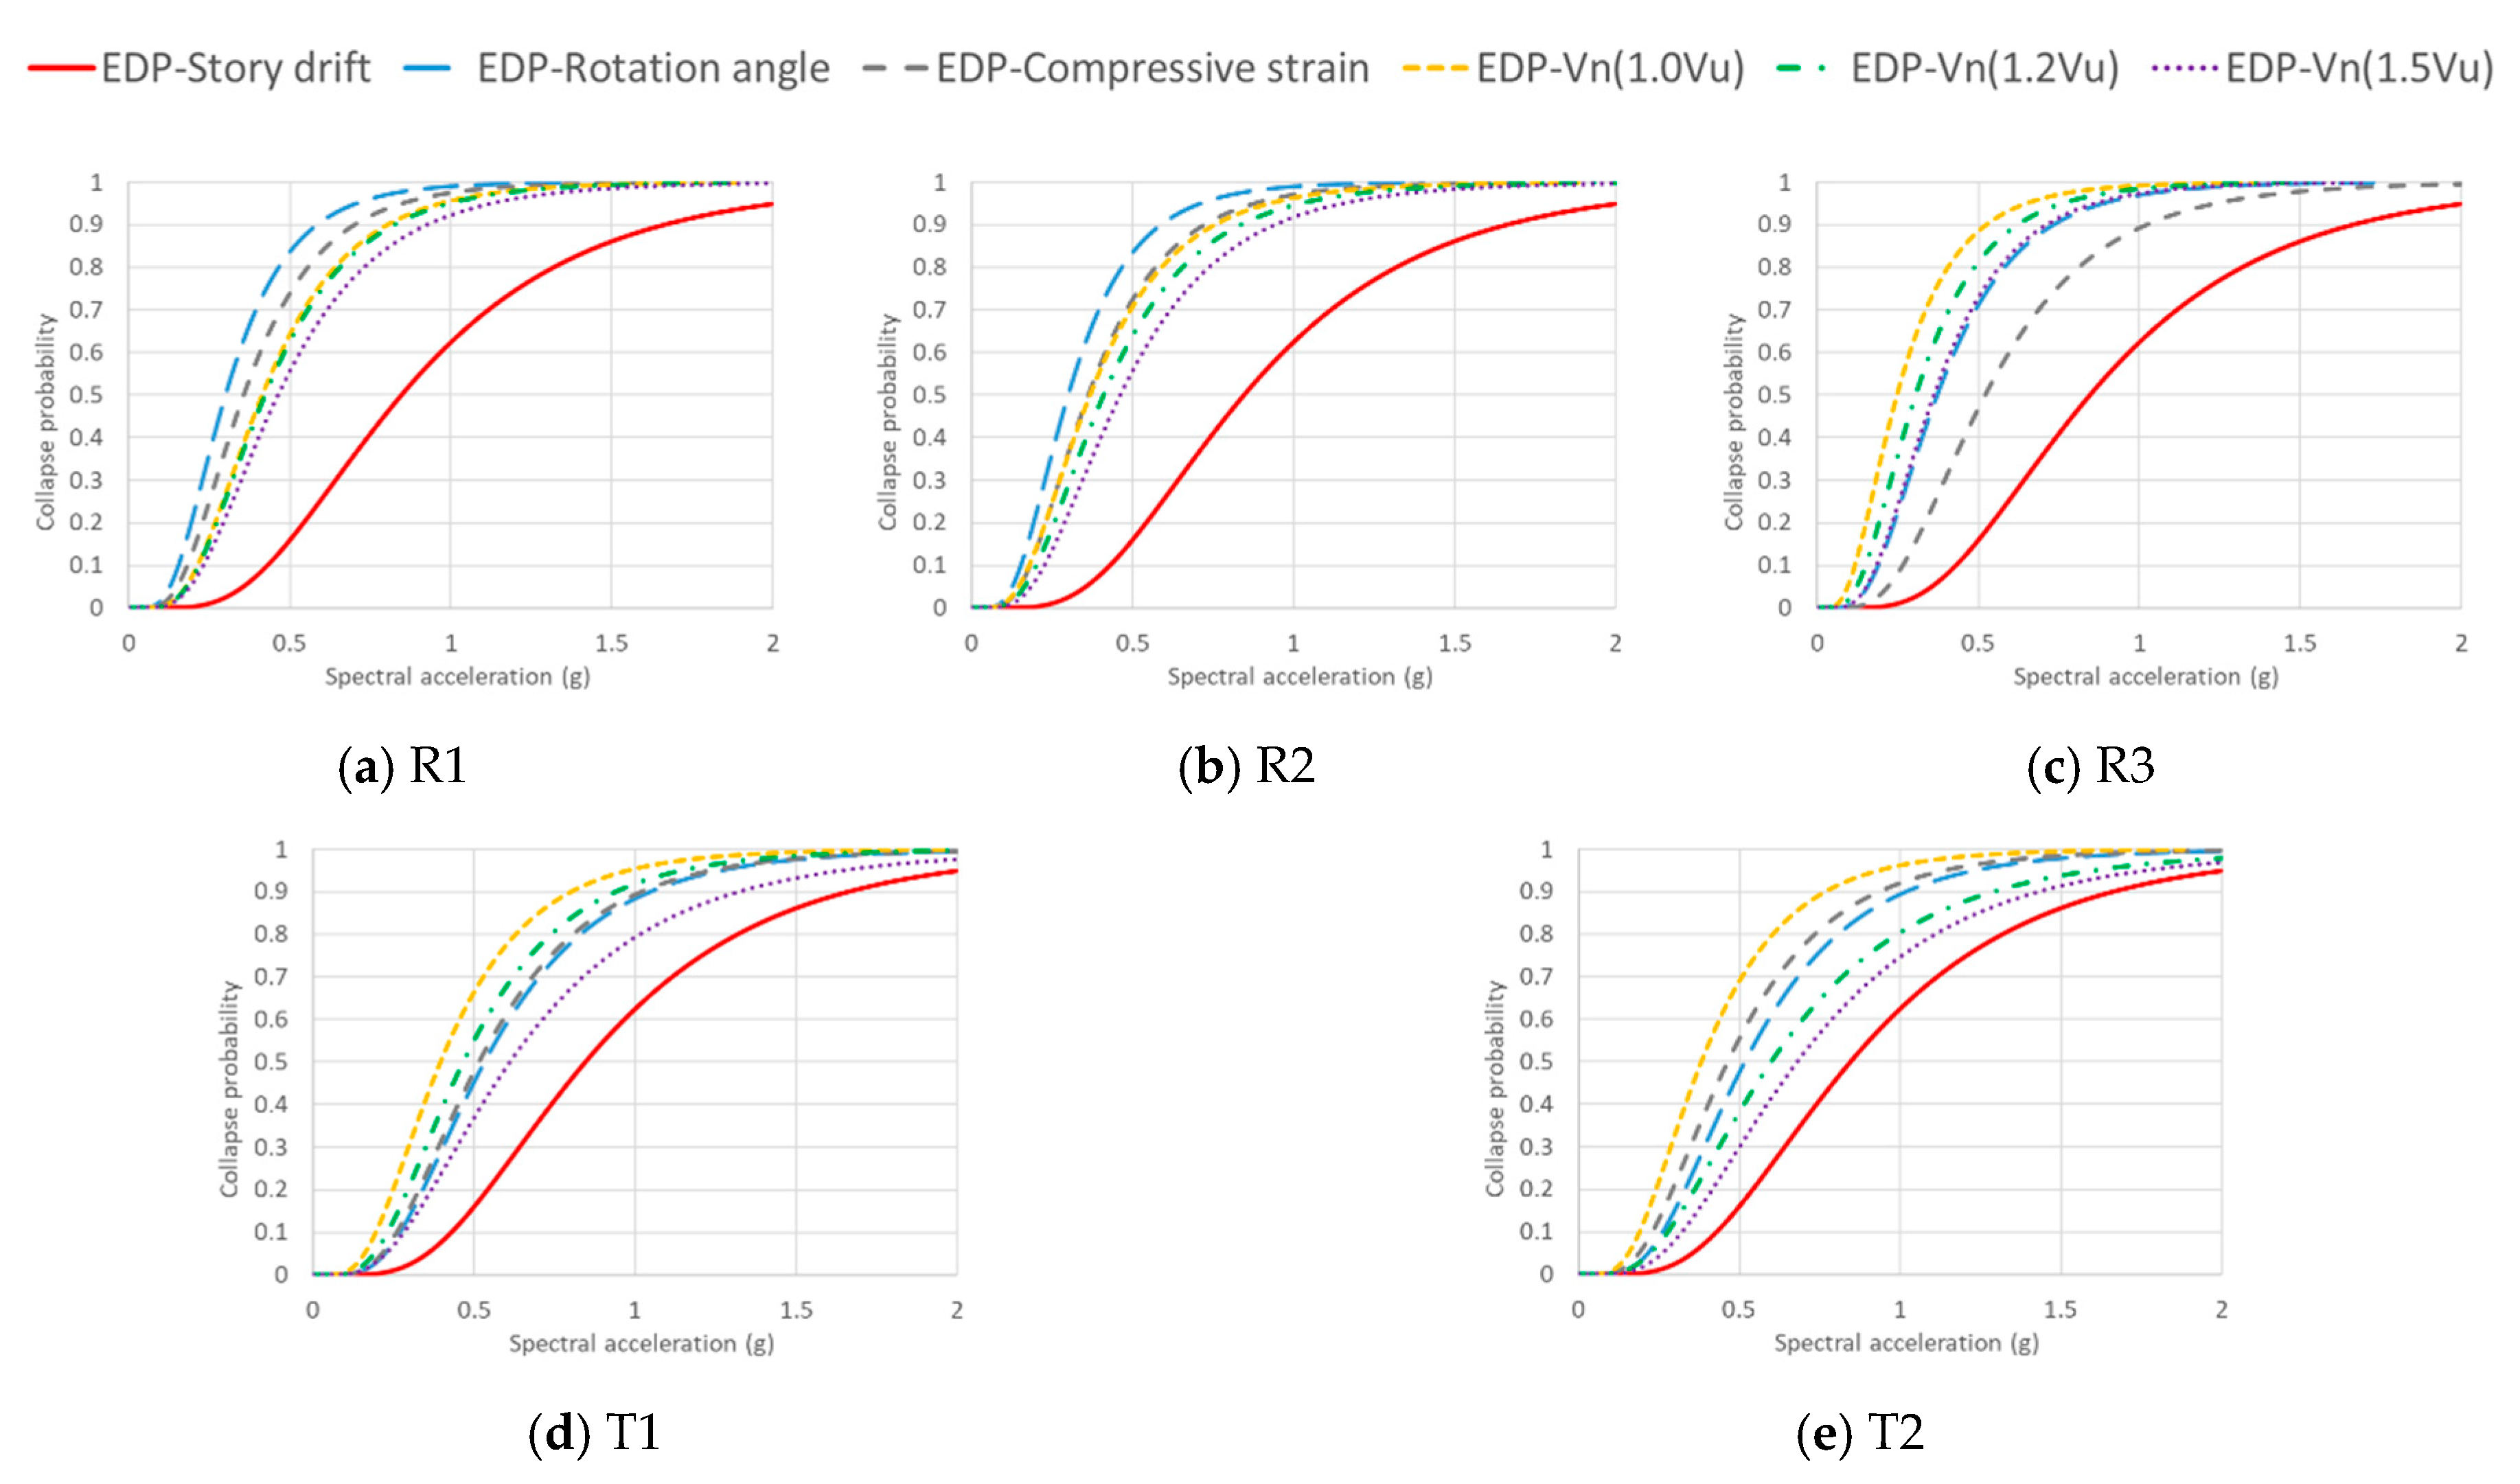
In Figure 17, collapse fragility curves for individual walls comprising Model A are shown as an example. Those fragility curves were calculated for each EDP, respectively. Table 13 presents failure probabilities at the MCE for each EDP obtained from the collapse fragility curve plotted in Figure 17. The failure probability for each EDP was calculated for individual walls to determine which EDP is dominant. The EDP with the highest collapse probability among the five individual walls comprising a wall group model was chosen as the primary failure mode of the wall group model and is shown in Table 13.
For individual component walls of Model A, the plastic hinge rotation angle has the highest collapse probability in most walls, but the highest collapse probability (11.2%) observed in the longest wall (R3) corresponds to the shear failure for amplification factor 1.0. As a result, the primary EDP changes from shear failure to plastic hinge rotation angle failure as the amplification factor to shear increases from 1.0 to 1.2 and 1.5, which reduces the potential of shear failure in the walls. Model B has a tendency similar to Model A, but shear failure is the primary failure mode of T1 and T2 as well as R3, and the transition from shear failure to plastic hinge rotation angle failure occurs at the amplification factor 1.2. In the case of the Model C, unlike the other two models, the wall with the highest collapse probability was R1, of which the failure mode is the compressive axial strain failure without change, in spite of the increasing amplification factor to shear force. This is due to the high axial force ratio of R1 caused by the small cross-section area and the characteristics of high-rise buildings. On the whole, the amplification factor to shear force 1.2 is enough to prevent shear failure from being the primary failure mode of the analytical model.
5. Conclusions

In this study, the seismic performance of the ordinary RC shear wall system, which is widely adopted for high-rise residential apartment buildings in South Korea, was assessed and an adequate amplification factor to wall shear forces was investigated. Three analytical models composed of five ordinary RC shear walls taller than 60 m were designed for seismic design category D using a performance-based procedure to circumvent limitations on the seismic force-resisting system in KBC 2016. Seismic performance evaluation was performed in accordance with the procedure and criteria of FEMA P695 based on incremental dynamic analysis. A total of four engineering parameters were taken into account, including inter-story drift, plastic hinge rotation angle, concrete compressive strain at the boundary of wall section, and shear force. Based on the result of seismic fragility assessment for the three analytical models, the ordinary RC shear walls designed with a shear force amplification factor higher than or equal to 1.2 can meet the performance criteria on collapse probability and the collapse margin ratio. Implications obtained for limited conditions of this study are summarized as follows.
  • The shear force of individual walls at each story is the primary engineering demand parameter contributing to the collapse probability most significantly when the shear force amplification factor 1.0 is applied to the design of individual walls. However, the collapse of analytical models designed with a shear force amplification factor higher than or equal to 1.2 is governed by flexural failure, determined by plastic hinge rotation angle. Therefore, the amplification factor 1.2 is recommended for the design shear force in the performance-based procedure to prevent brittle failure and the collapse of ordinary RC shear wall systems with regular configuration and rigid diaphragms. However, a 1.5 or higher amplification factor may be required for buildings with irregular configuration or flexible diaphragms due to contribution from higher modes.
  • Component walls with relatively high stiffness tend to fail in shear, given the collapse probability of individual component walls. Therefore, it is recommended that an amplified design shear force at the initial elastic design stage is used, considering the amplification expected in the nonlinear dynamic analysis in order to reduce the number of iterative nonlinear analyses. However, the amplification factor may be reduced for component walls with relatively low stiffness in which shear failure is anticipated to be insignificant.
  • Taller ordinary RC shear walls tend to be less sensitive to the shear force amplification factor than lower walls. In this case, increasing the shear force amplification factor has little impact on performance improvement. Therefore, the shear force amplification factor can be determined considering the primary failure mode.
  • In case of thin walls comprising the majority-part of residential buildings in Korea, it is very difficult to install hoops required for special RC shear walls, because the spacing is smaller than one third of the wall thickness. For buildings higher than 60 m and located at the area of seismic category D, the ordinary RC shear wall system with simple reinforcement details can be adopted as an alternative to the special RC shear wall and designed using a performance-based procedure with appropriate acceptance criteria satisfying required collapse margin as shown in this study.
  • The result of this study is limited to ordinary shear wall structures with regular configurations and rigid diaphragms, since there is a limited number of two-dimensional analytical models. This study can be utilized as a basis for further study, considering the effects of irregular configuration and flexible diaphragms that are present in actual building structures.

Author Contributions

S.-H.J. designed analytical models, performed numerical analysis, and wrote the original draft. J.-H.P. supervised the entire procedure, and revised and finalized the manuscript. All authors have read and agreed to the published version of the manuscript.

Funding

This work was supported by Incheon National University Research Grant in 2017.

Acknowledgments

This work was supported by Incheon National University Research Grant in 2017.

Conflicts of Interest

The authors declare no conflict of interest.

References

  1. Architectural Institute of Korea. Korean Building Code 2016; AIK: Seoul, Korea, 2016. [Google Scholar]
  2. Architectural Institute of Korea. Guidelines for Performance-Based Seismic Design of Residential Buildings; Korea Building Code Center: AIK: Seoul, Korea, 2017. [Google Scholar]
  3. ASCE 7-16. Minimum Design Loads and Associated Criteria for Buildings and Other Structures; ASCE: Reston, VA, USA, 2016. [Google Scholar]
  4. Applied Technology Council. Quantification of Building Seismic Performance Factors; FEMA P695; US Department of Homeland Security, FEMA: Washington, DC, USA, 2009.
  5. Chun, Y.S.; Lee, K.H.; Lee, H.W.; Park, Y.E.; Song, J.K. Seismic Performance of Special Shear Wall Structural System with Effectively Reduced Reinforcement Detail. Eesk J. Earthq. Eng. 2013, 25, 271–281. [Google Scholar]
  6. Gogus, A.; Wallace, J.W. Seismic safety evaluation of reinforced concrete walls through FEMA P695 methodology. J. Struct. Eng. 2015, 141, 04015002. [Google Scholar] [CrossRef]
  7. Gogus, A. Structural Wall Systems-Nonlinear Modeling and Collapse Assessment of Shear Walls and Slab-Column Frames; University of California: Berkeley, CA, USA, 2010. [Google Scholar]
  8. Nazari, Y.R. Seismic Fragility Analysis of Reinforced Concrete Shear Wall Buildings in Canada; Université d’Ottawa/University of Ottawa: Ottawa, ON, Canada, 2017. [Google Scholar]
  9. De Stefano, M.; Pintucchi, B. A review of research on seismic behaviour of irregular building structures since 2002. Bull Earthq. Eng. 2008, 6, 285–308. [Google Scholar] [CrossRef] [Green Version]
  10. Ruggieri, S.; Porco, F.; Uva, G. A practical approach for estimating the floor deformability in existing RC buildings: Evaluation of the effects in the structural response and seismic fragility. Bull Earthq. Eng. 2020, 18, 2083–2113. [Google Scholar] [CrossRef]
  11. Ruggieri, S.; Porco, F.; Uva, G. A numerical procedure for modeling the floor deformability in seismic analysis of existing RC buildings. J. Build Eng. 2018, 19, 273–284. [Google Scholar] [CrossRef]
  12. Architectural Institute of Korea. KDS 41 17 00, Seismic Building Design Code; Ministry of land: Seoul, Korea, 2019. [Google Scholar]
  13. PEER. Available online: https://ngawest2.berkeley.edu/site (accessed on 13 March 2018).
  14. Han, S.W.; Ha, S.J.; Cho, S.W. A Method for Selecting Ground Motions Considering Target Response Spectrum Mean, Variance and Correlation-I Algorithm. J. Struct. Eng. 2016, 20, 55–62. [Google Scholar] [CrossRef]
  15. MIDAS Gen. Available online: http://www.midasit.com (accessed on 13 March 2018).
  16. Mander, J.B.; Priestley, M.J. Theoretical stress-strain model for confined concrete. J. Struct. Eng. 1988, 144, 1804–1826. [Google Scholar] [CrossRef] [Green Version]
  17. Saatcioglu, M.; Razvi, S.R. Strength and ductility of confined concrete. J. Struct. Eng. 1988, 118, 1590–1607. [Google Scholar] [CrossRef]
  18. Dazio, A.; Beyer, K.; Bachmann, H. Quasi-static cyclic tests and plastic hinge analysis of RC structural walls. Eng. Struct. 2009, 31, 1556–1571. [Google Scholar] [CrossRef]
  19. Thomsen, J.H., IV; Wallace, J.W. Displacement-based design of slender reinforced concrete structural walls—Experimental verification. J. Struct. Eng. 2004, 130, 618–630. [Google Scholar] [CrossRef]
  20. Orakcal, K.; Wallace, J.W. Flexural modeling of reinforced concrete walls-experimental verification. ACI Mater. J. 2006, 103, 196. [Google Scholar]
  21. Tuna, Z. Seismic Performance, Modeling, and Failure Assessment of Reinforced Concrete Shear Wall Buildings; UCLA: Los Angeles, CA, USA, 2012. [Google Scholar]
  22. Korea Concrete Institute. KDS 14 20 80; Ministry of land: Seoul, Korea, 2016. [Google Scholar]
  23. PERFORM 3D V7. Computers and Structures, Inc.. Available online: https://www.csiamerica.com (accessed on 13 March 2018).
  24. Hassan, W.; Anwar, N.; Norachan, P.; Najam, F.A. The Seismic Performance Evaluation of RC High-rise Buildings Designed to Various Building Codes. In Proceedings of the IABSE Conference-Engineering the Developing World, Kuala Lumpur, Malaysia, 25–27 April 2018; pp. 25–27. [Google Scholar]
  25. Moehle, J.; Bozorgnia, Y.; Jayaram, N.; Jones, P.; Rahnama, M.; Shome, N. Case Studies of the Seismic Performance of Tall Buildings Designed by Alternative Means, Report for the Tall Buildings Initiative; Pacific Earthquake Engineering Research Center, Univ. of California at Berkeley: Berkeley, CA, USA, 2011. [Google Scholar]
  26. Tall Buildings Initiative. Guidelines for Performance-Based Seismic Design of Tall Buildings; Pacific Earthquake Engineering Research Center, College of Engineering, University of California: Berkeley, CA, USA, 2017. [Google Scholar]
  27. American Society of Civil Engineers. Seismic Evaluation and Retrofit of Existing Buildings; ASCE/SEI: Reston, VA, USA, 2017. [Google Scholar]
  28. Haselton, C.B.; Liel, A.B.; Lange, S.T.; Deierlein, G.G. Beam–Column Element Model Calibrated for Predicting Flexural Response Leading to Global Collapse of RC Framing Buildings; Pacific Earthquake Engineering Research Center, Univ. of California at Berkeley: Berkeley, CA, USA, 2007. [Google Scholar]
  29. Baker, J.W.; Allin Cornell, C. Spectral shape, epsilon and record selection. Earthq. Eng. Struct. Dyn. 2006, 35, 1077–1095. [Google Scholar] [CrossRef]
  30. Lin, T.; Haselton, C.B.; Baker, J.W. Conditional spectrum-based ground motion selection. Part I: Hazard consistency for risk-based assessments. Earthq. Eng. Struct. Dyn. 2013, 42, 1847–1865. [Google Scholar] [CrossRef] [Green Version]
  31. ASCE 7-05. Minimum Design Load for Buildings and other Structures; ASCE: Reston, VA, USA, 2006. [Google Scholar]
  32. Kazantzi, A.K.; Vamvatsikos, D. Intensity measure selection for vulnerability studies of building classes. Earthq. Eng. Struct. Dyn. 2015, 44, 2677–2694. [Google Scholar] [CrossRef] [Green Version]
  33. Baker, J.W.; Lee, C. An improved algorithm for selecting ground motions to match a conditional spectrum. J. Earthq. Eng. 2016, 22, 708–723. [Google Scholar] [CrossRef]
  34. Baltzopoulos, G.; Baraschino, R.; Iervolino, I. On the number of records for structural risk estimation in PBEE. Earthq. Eng. Struct. Dyn. 2019, 48, 489–506. [Google Scholar] [CrossRef]
  35. Boore, D.M.; Watson-Lamprey, J.; Abrahamson, N.A. Orientation-independent measures of ground motion. Bull. Seismol. Soc. Am. 2006, 96, 1502–1511. [Google Scholar] [CrossRef]
  36. Boore, D.M. Orientation-independent, nongeometric-mean measures of seismic intensity from two horizontal components of motion. Bull. Seismol. Soc. Am. 2010, 100, 1830–1835. [Google Scholar] [CrossRef]
  37. Vamvatsikos, D.; Cornell, C.A. Incremental dynamic analysis. Earthq. Eng. Struct. Dyn. 2002, 31, 491–514. [Google Scholar] [CrossRef]
  38. Kircher, C.; Deierlein, G.; Hooper, J.; Krawinkler, H.; Mahin, S.; Shing, B.; Wallace, J. Evaluation of the FEMA P-695 Methodology for Quantification of Building Seismic Performance Factors; National Institute of Standards and Technology: Gaithersburg, MD, USA, 2010. [Google Scholar]
  39. Wood, S.L. Shear strength of low-rise reinforced concrete walls. Aci Struct. J. 1990, 87, 99–107. [Google Scholar]
  40. Wallace, J.W. Evaluation of UBC-94 provision for seismic design of RC structural walls. Earthq. Spec. 1996, 12, 327–348. [Google Scholar] [CrossRef]
Figure 1. Configuration of Model A.
Applsci 10 04075 g001
Figure 2. Axial force ratio by wall length.
Applsci 10 04075 g002
Figure 3. Target response spectra and average response spectra by seven pairs of ground motion scaling (Site class: S 4 , maximum considered earthquake (MCE), Model B).
Applsci 10 04075 g003
Figure 4. Nonlinear model of concrete and rebar.
Applsci 10 04075 g004
Figure 5. Comparison of experimental result and analysis result [14].
Applsci 10 04075 g005
Figure 6. Example of design result for R3 in Model A.
Applsci 10 04075 g006aApplsci 10 04075 g006b
Figure 7. Example of seismic fragility curve.
Applsci 10 04075 g007
Figure 8. Target conditional spectrum and scaled GMRotD100 spectra for incremental dynamic analysis (Model B).
Applsci 10 04075 g008
Figure 9. Target and scaled response spectra for Model B.
Applsci 10 04075 g009
Figure 10. Mean SRSS Spectra of ground motion suites used for seismic design and performance evaluation.
Applsci 10 04075 g010
Figure 11. Incremental dynamic analysis (IDA) results by failure mode (Model A).
Applsci 10 04075 g011aApplsci 10 04075 g011b
Figure 12. Concrete crushing in unconfined wall.
Applsci 10 04075 g012
Figure 13. Result of pushover analysis and location of failure.
Applsci 10 04075 g013
Figure 14. Example of shear failure (Model A, R3).
Applsci 10 04075 g014
Figure 15. Seismic fragility curves for individual component wall based on governing failure modes.
Applsci 10 04075 g015
Figure 16. MCE collapse probability by axial force ratio.
Applsci 10 04075 g016
Figure 17. Seismic fragility curve for individual engineering demand parameters (EDPs) and acceptance criteria (Model A).
Applsci 10 04075 g017
Table 1. Characteristics of analysis model.
Analytical ModelComponent WallLength (m)Thickness (m)Axial Force RatioHeight (m)T1 (s)
FlangeWebFlangeWeb
Model AR1 2.5 0.20.3702.4
R2 2.5 0.20.3
R3 9 0.20.15
T11.530.220.220.15
T21.530.220.220.15
Model BR1 2.5 0.20.381.23.6
R2 2.5 0.20.3
R3 9 0.20.15
T11.53.50.250.250.15
T21.53.50.250.250.15
Model CR1 2.5 0.250.3109.23.2
R2 2.5 0.250.3
R3 9 0.30.1
T12.540.350.350.1
T22.540.350.350.1
Table 2. List of ground motion used in seismic design.
Analytical ModelNo.Earthquake NameStation NameMwRjb (km)Vs,30 (m/s)
Model A1Imperial Valley-06Delta6.5322.0242
2Northridge-01Northridge-17645 Saticoy St6.690.0281
3Superstition Hills-02Brawley Airport6.5417.0209
4Northridge-01Playa Del Rey-Saran6.6924.4346
5Loma PrietaFremont-Emerson Court6.9339.7285
6Kobe JapanSakai6.9028.1256
7Northridge-01Camarillo6.6934.8351
Model B1Imperial Valley-06Delta6.5322.0242
2Northridge-01LA-Century City CC North6.6915.5278
3Chuetsu-oki JapanNiigata Nishi Kaba District6.8027.8255
4Loma PrietaDumbarton Bridge West End FF6.9335.3238
5Chuetsu-oki JapanKashiwazaki NPP Unit 1: Ground surface6.800.0329
6Chi-Chi Taiwan-06CHY0366.3045.1233
7Chuetsu-oki JapanHinodecho Yoshida Tsubame City6.8020.4262
Model C1Imperial Valley-06Delta6.5322.0242
2Northridge-01LA-Century City CC North6.6915.5278
3Chi-Chi Taiwan-06CHY0366.3045.1233
4Northridge-01Playa Del Rey-Saran6.6924.4346
5Northridge-01LA-Pico & Sentous6.6927.8305
6Loma PrietaAPEEL 7-Pulgas6.9341.7415
7Chuetsu-oki JapanJoetsu Kita6.8029.0334
Table 3. Material property of analytical models.
Analytical ModelFloor f c   ( MPa ) f y   ( MPa )
Model A11–2521400
1–1024
Model B16–2921400
6–1524
1–527
Model C26–3921400
21–2524
11–2027
6–1030
1–535
Table 4. Engineering demand parameters for performance-based seismic design.
Engineering Demand ParameterAcceptance Criteria
Inter-story drift ratio2.0%
Plastic hinge rotation angleCollapse prevention in ASCE 41-17
Compressive extreme-fiber strains0.002
ShearAIK guideline [2] γ Q u ϕ Q n , γ   = 1.2, ϕ   = 1.0
Hassan et al., Moehle et al. [24,25] γ Q u ϕ Q n , γ   = 1.5,   ϕ   = 1.0
TBI v2.03 [26] γ Q u ϕ B Q n , γ   = 1.3, ϕ   = 0.75, B = 0.9 ( 1.5 Q e / Q n )
Simplified as follows if flexural rotation is not large
1.12 Q u Q n
Table 5. Reinforcement of shear walls.
Analytical ModelComponent WallVertical ReinforcementHorizontal Reinforcement
StoryReinforcementStory Design   to   1.0 V u Design   to   1.2 V u Design   to   1.5 V u
Model AR13~25D10@4004~25D10@360D10@360D10@360
2D13@4003D10@360D10@180D10@150
1D13@2001~2D10@250D10@180D10@150
R23~25D10@4004~25D10@360D10@360D10@360
2D13@4003D10@360D10@180D10@150
1D13@2001~2D10@250D10@180D10@150
T118~25D10@4006~25D10@330D10@330D10@330
11~17D13@4004~5D10@330D10@330D10@200
8~10D13@3003D10@330D10@200D10@140
3~7D13@2001~2D10@270D10@200D10@140
1~2D13@150
T218~25D10@4006~25D10@330D10@330D10@330
11~17D13@4004~5D10@330D10@330D10@200
8~10D13@3003D10@330D10@200D10@140
3~7D13@2001~2D10@270D10@200D10@140
1~2D13@150
R315~25D10@4006~25D10@360D10@360D10@360
4~5D10@360D10@360D10@210
1~14D13@4002~3D10@360D10@320D10@210
1D10@280D10@200D10@140
Model BR116~29D10@4004~29D10@360D10@360D10@360
6~15D10@300
3~5D13@4001~3D10@360D10@270D10@180
1~2D13@150
R216~29D10@4004~29D10@360D10@360D10@360
6~15D10@300
3~5D13@4001~3D10@360D10@270D10@180
1~2D13@150
T126~29D10@40027~29D10@290D10@290D10@290
22~25D13@30022~26D10@290D10@290D10@200
16~21D13@20013~21D10@290D10@290D10@150
9~15D19@40010~12D10@290D10@200D10@100
6~8D19@3007~9D10@240D10@160D10@100
2~5D19@2004~6D10@150D10@100D10@70
1D19@1501~3D10@100D10@70D10@50
T226~29D10@40027~29D10@290D10@290D10@290
22~25D13@30022~26D10@290D10@290D10@200
16~21D13@20013~21D10@290D10@290D10@150
9~15D19@40010~12D10@290D10@200D10@100
6~8D19@3007~9D10@240D10@160D10@100
2~5D19@2004~6D10@150D10@100D10@70
1D19@1501~3D10@100D10@70D10@50
R323~29D10@4009~29D10@360D10@360D10@360
7~8D10@360D10@360D10@280
1~22D13@4002~6D10@360D10@280D10@190
1D10@260D10@190D10@130
Model CR11~39D10@4001~39D10@290D10@290D10@290
R21~39D10@4001~39D10@290D10@290D10@290
T126~39D10@30014~39D10@210D10@210D10@210
21~25D10@2008~13D10@210D10@210D10@160
6~20D10@1506~7D10@210D10@140D10@110
3~5D16@3001~5D10@150D10@110D10@70
1~2D13@150
T226~39D10@30014~39D10@210D10@210D10@210
21~25D10@200
6~20D10@1508~13D10@210D10@210D10@160
3~5D16@3006~7D10@210D10@140D10@110
1~2D13@1501~5D10@150D10@110D10@70
R36~39D10@4002~39D10@240D10@240D10@240
1~5D13@3001D10@240D10@240D10@160
Table 6. Reinforcement of coupling beams.
Analytical ModelCoupling BeamStoryLongitudinal ReinforcementStirrup
TopBottom
Model ACB11~254-D134-D13D13@160
CB21~254-D134-D13D13@180
Model BCB11~294-D134-D13D13@160
CB21~294-D134-D13D13@180
Model CCB11~394-D134-D13D13@160
CB21~394-D134-D13D13@180
Table 7. Design results for average response of seven ground motions.
Analytical ModelComponent WallDCR (Demand/Capacity)
Story Drift RatioRotation AngleAxial StrainShear
Design   to   1.0 V u Design   to   1.2 V u Design   to   1.5 V u
Model AR10.700.19 0.53 0.40 0.48 0.60
R20.40 0.77 0.72 0.86 0.99
T10.26 0.75 0.64 0.77 0.97
T20.19 0.92 0.990.99 0.99
R30.39 0.83 0.99 0.98 0.99
Model BR10.610.19 0.95 0.98 0.97 0.99
R20.12 0.30 0.25 0.30 0.38
T10.31 0.50 0.46 0.55 0.69
T20.30 0.75 0.81 0.97 0.98
R30.17 0.82 0.990.98 0.98
Model CR10.480.15 0.55 0.70 0.84 0.99
R20.30 0.87 0.99 0.96 0.98
T10.15 0.26 0.06 0.08 0.10
T20.18 0.44 0.17 0.20 0.25
R30.17 0.51 0.28 0.34 0.42
Table 8. Spectral accelerations at the fundamental period for MCE.
Analytical ModelAcceleration at T 1 on the Mean SRSS SpectrumScale Factor (a)/(b) S M T S M T
For Seismic Design (a)Reference for IDA (b)
Model A0.2336 0.1979 1.18 0.180.21
Model B0.1338 0.1071 1.25 0.100.12
Model C0.1645 0.1350 1.22 0.120.15
Table 9. Engineering demand parameters for seismic fragility assessment.
Engineering Demand ParameterAcceptance Criteria
Inter-story drift ratio20% of initial slope
Plastic rotation angleCollapse prevention in ASCE 41-17
Compressive extreme-fiber strains0.005
Shear 1.5 V n > V u if θ / θ y < 2
0.7 V n > V u if θ / θ y > 8
1.5 V n and 0.7 V n are interpolated linearly when θ / θ y is between 2 and 8
Table 10. Summary of collapse probability for analytical models designed for the shear force amplification factor = 1.2.
Analytical ModelComponent WallLength (m)Axial Force Ratio (%)MCE Collapse Probability (%)Pass/Fail
Model AR12.5309.8-
R22.5309.9Pass
T13153.7-
T23155.5-
R39157.3-
Model BR12.5304.4-
R22.5305.6Pass
T13.5150.9-
T23.5151.0-
R39155.5-
Model CR12.5308.8Pass
R22.5307.4-
T14102.4-
T24103.5-
R39105.3-
Performance group (Average)8.1Pass
Table 11. Summary of collapse performance evaluation for analytical models designed for the shear force amplification factor = 1.2.
Analytical ModelComponent WallLength (m)Axial Load Ratio S M T S ^ C T ACMR (1)Acceptance ACMR20% (2)(1)/(2)Pass/FailRepresentative ACMR (3)Acceptance ACMR10% (4)(3)/(4)Pass/Fail
Model AR12.50.30.210.42 2.021.591.27Pass2.032.090.97-
R22.50.30.210.422.031.621.26
T190.150.210.52 2.531.561.62
T230.150.210.48 2.431.621.50
R330.150.210.41 2.251.621.39
Model BR12.50.30.120.29 2.421.561.55Pass2.362.021.17-
R22.50.30.120.282.361.591.48
T190.150.120.38 3.531.592.22
T23.50.150.120.35 3.531.592.22
R33.50.150.120.24 2.421.591.52
Model CR12.50.30.150.352.281.691.35Pass2.282.231.02-
R22.50.30.150.33 2.191.591.37
T190.10.150.50 3.301.661.99
T240.10.150.45 3.131.731.81
R340.10.150.35 2.331.561.49
Performance group A + B + C (Average)1.05Pass
Table 12. Evaluation results for each design shear.
Evaluation CategoryPerformance Evaluation of MCE Collapse Probability
Design   to   1.0 V u Design   to   1.2 V u Design   to   1.5 V u
MCE collapse probability (%)10.68.17.9
Performance evaluation of MCE collapse probability (Less than 10%)FailPassPass
ACMR/ACMR10%0.971.051.06
Performance evaluation of ACMR (ACMR ratio is 1 or higher)FailPassPass
Table 13. Primary failure mode by analysis model.
Analytical ModelComponent WallCollapse Probability by MCE (%)Primary Failure Mode
DriftRotation AngleCompressive StrainShear
Design   to   1.0 V u Design   to   1.2 V u Design   to   1.5 V u Design   to   1.0 V u Design   to   1.2 V u Design   to   1.5 V u
Model AR10.28.16.16.12.21.3ShearRotation angleRotation angle
R20.28.06.17.23.61.4
T10.23.80.22.31.00.6
T20.25.10.12.90.70.1
R30.21.40.211.26.94.2
Model BR10.14.22.10.90.90.7ShearRotation angleRotation angle
R20.14.32.22.51.40.9
T10.10.30.41.60.70.4
T20.10.30.81.80.40.2
R30.11.80.311.44.92.0
Model CR11.92.26.65.35.35.3CompressivestrainCompressivestrainCompressivestrain
R21.92.24.35.55.55.5
T11.90.61.02.01.51.6
T21.90.50.92.72.32.2
R31.91.00.54.24.22.5