Lower Limb Inter-Joint Coordination of Unilateral Transfemoral Amputees: Implications for Adaptation Control


 , ,
, , 
Abstract
1. Introduction
2. Materials and Methods
2.1. Participant Information
2.2. Experimental Procedure
2.3. Outcome Measures
2.4. Data Analysis
3. Results
3.1. Walking Speed and Stance–Swing Phase Duration Ratio
3.2. CRP
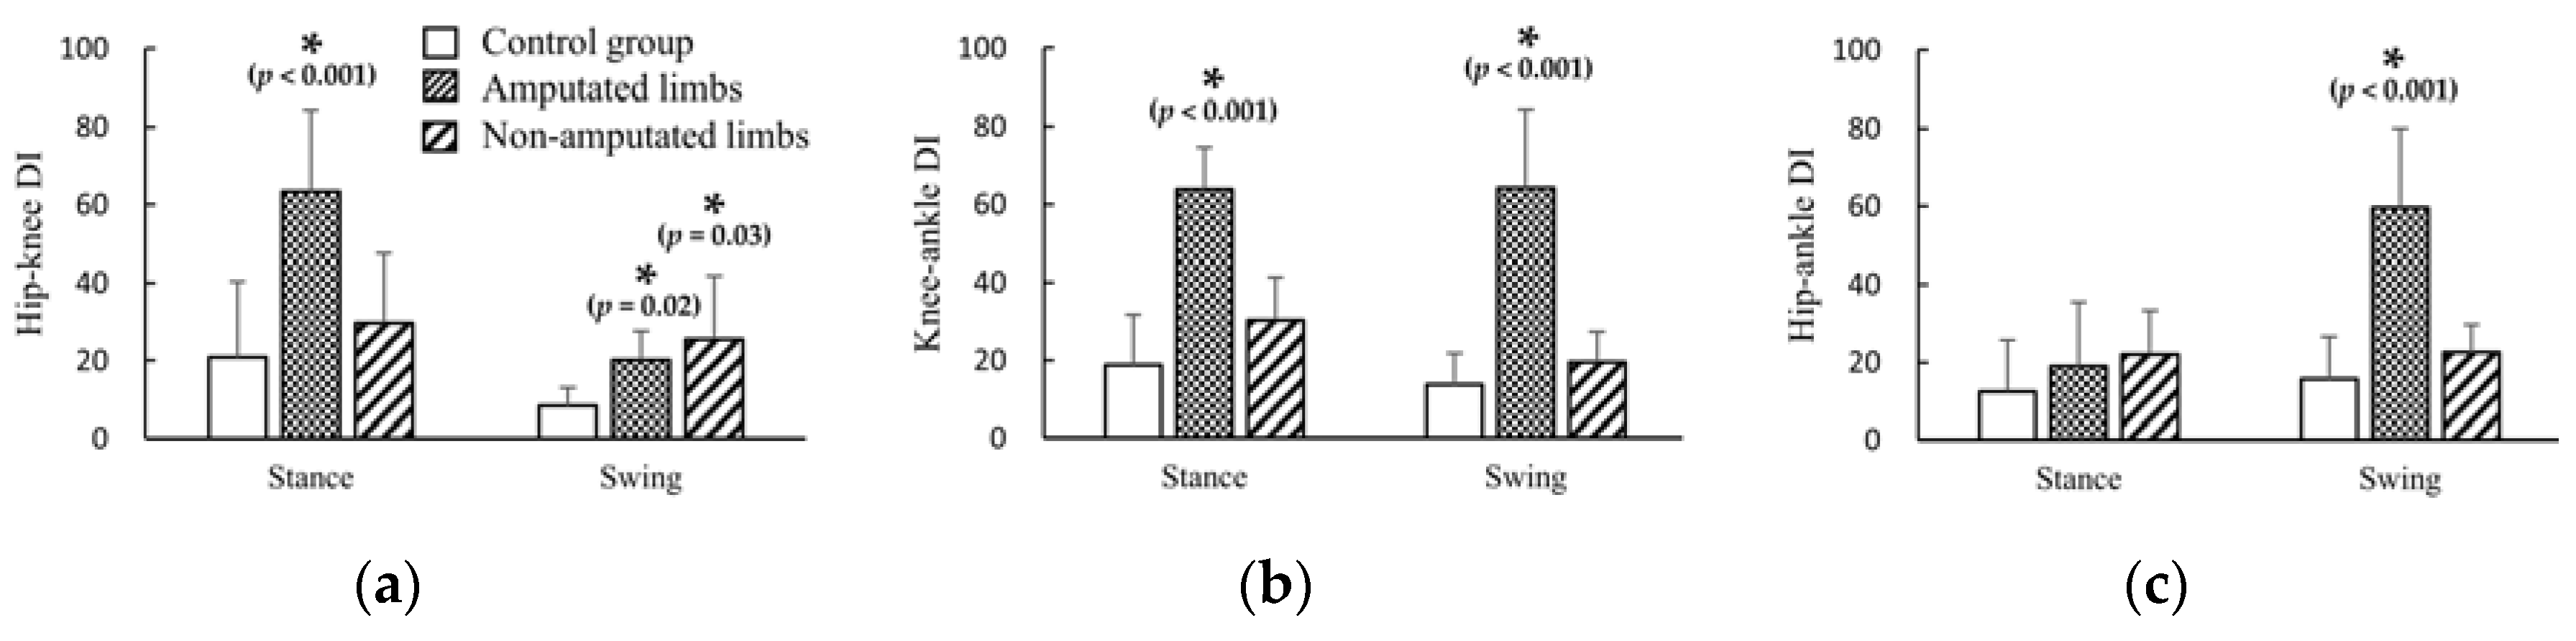
3.3. DI
4. Discussion
5. Conclusions
Supplementary Materials
Author Contributions
Funding
Conflicts of Interest
References
- Esposito, E.R.; Whitehead, J.M.A.; Wilken, J. Sound limb loading in individuals with unilateral transfemoral amputation across a range of walking velocities. Clin. Biomech. 2015, 30, 1049–1055. [Google Scholar] [CrossRef] [PubMed]
- Schaarschmidt, M.; Lipfert, S.; Meier-Gratz, C.; Scholle, H.-C.; Seyfarth, A. Functional gait asymmetry of unilateral transfemoral amputees. Hum. Mov. Sci. 2012, 31, 907–917. [Google Scholar] [CrossRef] [PubMed]
- Esposito, E.R.; Rábago, C.A.; Wilken, J. The influence of traumatic transfemoral amputation on metabolic cost across walking speeds. Prosthetics Orthot. Int. 2017, 42, 214–222. [Google Scholar] [CrossRef] [PubMed]
- Levine, D.; Richards, J.; Whittle, M. Whittle’s Gait Analysis; Elsevier LTD: Oxford, UK, 2012. [Google Scholar]
- Drevelle, X.; Villa, C.; Bonnet, X.; Loiret, I.; Fodé, P.; Pillet, H. Vaulting quantification during level walking of transfemoral amputees. Clin. Biomech. 2014, 29, 679–683. [Google Scholar] [CrossRef]
- Segal, A.D.; Orendurff, M.S.; Klute, G.; McDowell, M.L.; Pecoraro, J.A.; Shofer, J.; Czerniecki, J.M. Kinematic and kinetic comparisons of transfemoral amputee gait using C-Leg and Mauch SNS prosthetic knees. J. Rehabilitation Res. Dev. 2007, 43, 857. [Google Scholar] [CrossRef] [PubMed]
- Hobara, H.; Kobayashi, Y.; Nakamura, T.; Yamasaki, N.; Nakazawa, K.; Akai, M.; Ogata, T. Lower extremity joint kinematics of stair ascent in transfemoral amputees. Prosthetics Orthot. Int. 2011, 35, 467–472. [Google Scholar] [CrossRef]
- Schmalz, T.; Blumentritt, S.; Marx, B. Biomechanical analysis of stair ambulation in lower limb amputees. Gait Posture 2007, 25, 267–278. [Google Scholar] [CrossRef]
- Morgenroth, D.; Roland, M.; Pruziner, A.L.; Czerniecki, J.M. Transfemoral amputee intact limb loading and compensatory gait mechanics during down slope ambulation and the effect of prosthetic knee mechanisms. Clin. Biomech. 2018, 55, 65–72. [Google Scholar] [CrossRef]
- Carse, B.; Scott, H.; Brady, L.; Colvin, J. A characterisation of established unilateral transfemoral amputee gait using 3D kinematics, kinetics and oxygen consumption measures. Gait Posture 2019, 75, 98–104. [Google Scholar] [CrossRef]
- Vitali, A.; Colombo, G.; Regazzoni, D.; Rizzi, C. Virtual prototyping and physical experimentation of lower limb prosthesis. In Proceedings of the 5th Workshop on ICTs for improving Patients Rehabilitation Research Techniques, Popayán, Colombia, 11–13 September 2019; pp. 111–117. [Google Scholar]
- Pauw, K.D.; Serrien, B.; Baeyens, J.-P.; Cherelle, P.; Bock, S.D.; Ghillebert, J.; Bailey, S.P.; Lefeber, D.; Roelands, B.; Vanderborght, B.; et al. Prosthetic gait of unilateral lower-limb amputees with current and novel prostheses: A pilot study. Clin. Biomech. 2020, 71, 59–67. [Google Scholar] [CrossRef]
- Wong, D.W.-C.; Lam, W.-K.; Yeung, L.; Lee, W.C.; Lee, C.C.W. Does long-distance walking improve or deteriorate walking stability of transtibial amputees? Clin. Biomech. 2015, 30, 867–873. [Google Scholar] [CrossRef] [PubMed]
- St-Onge, N.; Feldman, A.G. Interjoint coordination in lower limbs during different movements in humans. Exp. Brain Res. 2003, 148, 139–149. [Google Scholar] [CrossRef] [PubMed]
- Iosa, M.; Marro, T.; Paolucci, S.; Morelli, D. Stability and harmony of gait in children with cerebral palsy. Res. Dev. Disabil. 2012, 33, 129–135. [Google Scholar] [CrossRef] [PubMed]
- A Winter, D. Foot Trajectory in Human Gait: A Precise and Multifactorial Motor Control Task. Phys. Ther. 1992, 72, 45–53. [Google Scholar] [CrossRef]
- Lu, T.-W.; Yen, H.-C.; Chen, H.-L. Comparisons of the inter-joint coordination between leading and trailing limbs when crossing obstacles of different heights. Gait Posture 2008, 27, 309–315. [Google Scholar] [CrossRef] [PubMed]
- Yen, H.-C.; Chen, H.-L.; Liu, M.-W.; Liu, H.-C.; Lu, T.-W. Age effects on the inter-joint coordination during obstacle-crossing. J. Biomech. 2009, 42, 2501–2506. [Google Scholar] [CrossRef] [PubMed]
- Chiu, S.-L.; Chou, L.-S. Effect of walking speed on inter-joint coordination differs between young and elderly adults. J. Biomech. 2012, 45, 275–280. [Google Scholar] [CrossRef]
- Cowley, J.; Gates, D.H. Inter-joint coordination changes during and after muscle fatigue. Hum. Mov. Sci. 2017, 56, 109. [Google Scholar] [CrossRef]
- Chiu, S.-L.; Chang, C.-C.; Chou, L.-S. Inter-joint coordination of overground versus treadmill walking in young adults. Gait Posture 2015, 41, 316–318. [Google Scholar] [CrossRef]
- Doherty, C.; Bleakley, C.; Hertel, J.; Caulfield, B.; Ryan, J.; Sweeney, K.; Delahunt, E. Inter-joint coordination strategies during unilateral stance following first-time, acute lateral ankle sprain: A brief report. Clin. Biomech. 2015, 30, 636–639. [Google Scholar] [CrossRef]
- Wang, T.-M.; Yen, H.-C.; Lu, T.-W.; Chen, H.-L.; Chang, C.-F.; Liu, Y.-H.; Tsai, W.-C. Bilateral knee osteoarthritis does not affect inter-joint coordination in older adults with gait deviations during obstacle-crossing. J. Biomech. 2009, 42, 2349–2356. [Google Scholar] [CrossRef]
- Lamb, P.; Stöckl, M. On the use of continuous relative phase: Review of current approaches and outline for a new standard. Clin. Biomech. 2014, 29, 484–493. [Google Scholar] [CrossRef] [PubMed]
- Bastian, A.J.; Martin, T.A.; Keating, J.G.; Thach, W.T. Cerebellar ataxia: Abnormal control of interaction torques across multiple joints. J. Neurophysiol. 1996, 76, 492–509. [Google Scholar] [CrossRef] [PubMed]
- Earhart, G.M.; Bastian, A.J. Selection and coordination of human locomotor forms following cerebellar damage. J. Neurophysiol. 2001, 85, 759–769. [Google Scholar] [CrossRef]
- Haddad, J.M.; Van Emmerik, R.E.; Whittlesey, S.N.; Hamill, J. Adaptations in interlimb and intralimb coordination to asymmetrical loading in human walking. Gait Posture 2006, 23, 429–434. [Google Scholar] [CrossRef] [PubMed]
- Chiu, S.-L.; Lu, T.-W.; Chou, L.-S. Altered inter-joint coordination during walking in patients with total hip arthroplasty. Gait Posture 2010, 32, 656–660. [Google Scholar] [CrossRef]
- Morton, S.M.; Bastian, A.J. Relative Contributions of Balance and Voluntary Leg-Coordination Deficits to Cerebellar Gait Ataxia. J. Neurophysiol. 2003, 89, 1844–1856. [Google Scholar] [CrossRef]
- Kim, J.H.; Lee, K.-K.; Kong, S.J.; An, K.O.; Jeong, J.H.; Lee, Y.S. Effect of Anticipation on Lower Extremity Biomechanics During Side- and Cross-Cutting Maneuvers in Young Soccer Players. Am. J. Sports Med. 2014, 42, 1985–1992. [Google Scholar] [CrossRef]
- Hutin, É.; Pradon, D.; Barbier, F.; Bussel, B.; Gracies, J.-M.; Roche, N. Walking velocity and lower limb coordination in hemiparesis. Gait Posture 2012, 36, 205–211. [Google Scholar] [CrossRef]
- Burgess-Limerick, R.; Abernethy, B.; Neal, R.J. Relative phase quantifies interjoint coordination. J. Biomech. 1993, 26, 91–94. [Google Scholar] [CrossRef]
- Versluys, R.; Beyl, P.; Van Damme, M.; Desomer, A.; Van Ham, R.; Lefeber, D. Prosthetic feet: State-of-the-art review and the importance of mimicking human ankle–foot biomechanics. Disabil. Rehabil. Assist. Technol. 2009, 4, 65–75. [Google Scholar] [CrossRef] [PubMed]
- Monno, A.; Temprado, J.; Zanone, P.-G.; Laurent, M. The interplay of attention and bimanual coordination dynamics. Acta Psychol. 2002, 110, 187–211. [Google Scholar] [CrossRef]
- Nolan, L.; Wit, A.; Dudziñski, K.; Lees, A.; Lake, M.; Wychowañski, M. Adjustments in gait symmetry with walking speed in trans-femoral and trans-tibial amputees. Gait Posture 2003, 17, 142–151. [Google Scholar] [CrossRef]
- Wong, D.W.-C.; Lam, W.-K.; Lee, W.C.-C. Gait asymmetry and variability in older adults during long-distance walking: Implications for gait instability. Clin. Biomech. 2020, 72, 37–43. [Google Scholar] [CrossRef] [PubMed]
- Ma, C.Z.-H.; Wan, A.H.-P.; Wong, D.W.-C.; Zheng, Y.; Lee, C.C.W. A Vibrotactile and Plantar Force Measurement-Based Biofeedback System: Paving the Way towards Wearable Balance-Improving Devices. Sensors 2015, 15, 31709–31722. [Google Scholar] [CrossRef]
- Wan, A.H.; Wong, D.W.-C.; Ma, C.Z.-H.; Zhang, M.; Lee, C.C.W. Wearable Vibrotactile Biofeedback Device Allowing Identification of Different Floor Conditions for Lower-Limb Amputees. Arch. Phys. Med. Rehabil. 2016, 97, 1210–1213. [Google Scholar] [CrossRef]
- Glowinski, S.; Łosiński, K.; Kowiański, P.; Waśkow, M.; Bryndal, A.; Grochulska, A. Inertial Sensors as a Tool for Diagnosing Discopathy Lumbosacral Pathologic Gait: A Preliminary Research. Diagn. 2020, 10, 342. [Google Scholar] [CrossRef]


| Code | Age (years) | BW (kg) | Height (m) | Yr. AMP | Yr. C.P. | Prosthetic Knee | Prosthetic Foot |
|---|---|---|---|---|---|---|---|
| 1 | 23 | 60.3 | 1.68 | 13 | 4 | Jingbo JB-850 | Jingbo FY-YDJ |
| 2 | 30 | 54.4 | 1.74 | 1.5 | 1.5 | Ottobock 3R80 | Ottobock 1A30 |
| 3 | 24 | 69.5 | 1.88 | 18 | 10 | Jingbo JB-850 | Jingbo FY-YDJ |
| 4 | 27 | 66.3 | 1.69 | 5 | 0.5 | Ottobock 3R80 | Ottobock 1S101 |
| 5 | 48 | 82.0 | 1.85 | 17 | 6 | Ottobock 3R80 | Ottobock 1C40 |
| 6 | 32 | 80.0 | 1.72 | 7 | 5 | Jingbo JB-951 | Jingbo FY-YDJ |
| 7 | 32 | 71.8 | 1.7 | 15 | 1 | Jingbo JB-810 | Jingbo FY-YDJ |
| 8 | 27 | 78.1 | 1.75 | 5 | 5 | Nabtesco NK-6 | Jingbo FPJ-4 |
| Parameters | Joint Pairs | Phase | Able-Bodied Controls | Amputated Limbs | Non-Amputated Limbs |
|---|---|---|---|---|---|
| RMS | Hip–knee | Stance | 0.24 | 0.65 | 0.78 |
| Swing | 0.003 | 0.86 | 0.53 | ||
| Knee–ankle | Stance | 0.16 | 0.09 | 0.55 | |
| Swing | 0.08 | 0.78 | 0.63 | ||
| Hip–ankle | Stance | 0.08 | 0.81 | 0.78 | |
| Swing | 0.02 | 0.39 | 0.28 | ||
| DP | Hip–knee | Stance | 0.48 | 0.40 | 0.75 |
| Swing | <0.001 | 0.86 | 0.57 | ||
| Knee–ankle | Stance | 0.22 | 0.07 | 0.49 | |
| Swing | 0.02 | 0.80 | 0.76 | ||
| Hip–ankle | Stance | 0.10 | 0.81 | 0.86 | |
| Swing | 0.02 | 0.36 | 0.31 | ||
| DI | Hip–knee | Stance | 0.32 | 0.23 | 0.27 |
| Swing | 0.67 | 0.20 | 0.28 | ||
| Knee–ankle | Stance | 0.87 | 0.15 | 0.92 | |
| Swing | 0.79 | 0.87 | 0.44 | ||
| Hip–ankle | Stance | 0.11 | <0.001 | 0.28 | |
| Swing | 0.71 | 0.57 | 0.19 |
| Cross-Correlation | RMS Differences | ||||
|---|---|---|---|---|---|
| Joint Pairs | Phase | Amputated Limb versus Control | Non-Amputated Limb versus Control | Amputated Limb versus Control | Non-Amputated Limb versus Control |
| Hip–knee | Stance | 0.79 (<0.001) | 0.89 (<0.001) | −3.5% (0.41) | 3.2% (0.93) |
| Swing | 0.79 (<0.001) | 0.93 (<0.001) | −5.4% (0.20) M | −1.7% (0.90) M | |
| Knee–ankle | Stance | −0.05 (0.61) | 0.78 (<0.001) | 21.2% (0.03) | 9.3% (0.54) |
| Swing | 0.23 (0.02) | 0.89 (<0.001) | 5.0% (0.70) | 18.6% (0.01) | |
| Hip–ankle | Stance | 0.296 (0.003) | 0.81 (<0.001) | 20.7% (0.04) | 13.5% (0.15) |
| Swing | 0.66 (<0.001) | 0.88 (<0.001) | 21.1% (0.20) M | 13.8% (0.20) M | |
© 2020 by the authors. Licensee MDPI, Basel, Switzerland. This article is an open access article distributed under the terms and conditions of the Creative Commons Attribution (CC BY) license (http://creativecommons.org/licenses/by/4.0/).
Share and Cite
Xu, Z.; Wong, D.W.-C.; Yan, F.; Chen, T.L.-W.; Zhang, M.; Jiang, W.-T.; Fan, Y.-B. Lower Limb Inter-Joint Coordination of Unilateral Transfemoral Amputees: Implications for Adaptation Control. Appl. Sci. 2020, 10, 4072. https://doi.org/10.3390/app10124072
Xu Z, Wong DW-C, Yan F, Chen TL-W, Zhang M, Jiang W-T, Fan Y-B. Lower Limb Inter-Joint Coordination of Unilateral Transfemoral Amputees: Implications for Adaptation Control. Applied Sciences. 2020; 10(12):4072. https://doi.org/10.3390/app10124072
Chicago/Turabian StyleXu, Zhi, Duo Wai-Chi Wong, Fei Yan, Tony Lin-Wei Chen, Ming Zhang, Wen-Tao Jiang, and Yu-Bo Fan. 2020. "Lower Limb Inter-Joint Coordination of Unilateral Transfemoral Amputees: Implications for Adaptation Control" Applied Sciences 10, no. 12: 4072. https://doi.org/10.3390/app10124072
APA StyleXu, Z., Wong, D. W.-C., Yan, F., Chen, T. L.-W., Zhang, M., Jiang, W.-T., & Fan, Y.-B. (2020). Lower Limb Inter-Joint Coordination of Unilateral Transfemoral Amputees: Implications for Adaptation Control. Applied Sciences, 10(12), 4072. https://doi.org/10.3390/app10124072