Article

Overlap Avoidance of Mobility Models for Multi-UAVs Reconnaissance

1
Department of Informatics, Gyeongsang National University, Jinju-daero, Jinju, Gyeongsangnamdo 52828, Korea
2
School of Computer Science and Engineering, Kyungpook National University, Daehak-ro, Buk-gu, Daegu 41566, Korea
*
Author to whom correspondence should be addressed.
Appl. Sci. 2020, 10(11), 4051; https://doi.org/10.3390/app10114051
Submission received: 21 May 2020 / Revised: 8 June 2020 / Accepted: 8 June 2020 / Published: 11 June 2020
(This article belongs to the Section Aerospace Science and Engineering)

Abstract

:
As avionics technologies have advanced, it is possible to perform many aerial applications which demand cooperative work with multiple Unmanned Aerial Vehicles (UAVs). Since one of the basic applications is reconnaissance, we focus on efficient cooperative reconnaissance. While random mobility models are useful for multi-UAVs reconnaissance, they suffer from overlapped reconnaissance problem that two or more UAVs reconnoiter a region at the same time. The overlapped reconnaissance also leads to imbalanced reconnaissance in which an area scanned by one UAV may be re-visited soon by the other UAV. Thus, we provide overlap avoidance schemes for the existing reconnaissance mobility models and enhance their performance. Throughout the simulations, we evaluate the effect of applying overlap avoidance in the existing models. The simulation results show that overlapped area is reduced by up to 20 times and 90%-coverage reaching time is improved by up to 19%.

1. Introduction

Exponential growth of recent technologies of computing, communications, and sensors has made it possible to perform various applications using multiple unmanned aerial vehicles (UAVs). Since a UAV is handled without human beings, it can perform various applications especially in inaccessible or perilous environments. Recently, multiple UAVs have been studied in civilian applications such as road patrol [1], load transportation [2], monitoring forest fire [3], etc. The UAV has been also used for military purposes such as patrol, surveillance, etc. [4,5,6,7,8,9,10,11].
One of the basic applications for many multi-UAVs applications is a reconnaissance mission. The reconnaissance scans a specific area through a camera mounted on a UAV. As multiple UAVs are available, it has been possible to reconnoiter the scanning area efficiently [12,13,14,15]. Thus, many recent studies have been conducted on efficient multi-UAVs reconnaissance.
The reconnaissance is classified in two ways: Path planning method and random mobility method. In the path planning method, UAVs are designed with pre-defined paths to be scanned by a mission planner before performing a mission. If the mission planner operates multiple UAVs simultaneously, areas should be allocated to each UAV. On the other hand, the random mobility method reconnoiters the area autonomously without any prior knowledge. It is not necessary to allocate an area to each UAV. In addition, it is also possible to perform a continuous mission even if some UAVs cannot be operated.
Much recent work [12,14,15,16] has provided random mobility models for multi-UAV reconnaissance as the random mobility model provides randomness and robustness. Since the random mobility model makes it difficult to predict each UAV’s path, it is more useful for reconnaissance compared to the path-planning method. In addition, it is also tolerable for the malfunctioning of UAVs. However, one weakness comes from a lower coverage rate since several UAVs occasionally reconnoiter a similar area at the same time. Thus, in this paper, we first define the overlapped reconnaissance problem in a multi-UAV reconnaissance application. Then, we provide appropriate overlap-avoidance schemes for well-known random mobility models for multi-UAVs reconnaissance.
The remainder of the paper is organized as follows. Section 2 deals with work related to mobility models and research motivation. In Section 3, we explain four existing random mobility models and describe how to extend each model for overlap avoidance. Section 4 outlines the simulation environment and analyzes the simulation results. Finally, Section 5 provides the conclusions and future work.

2. Related Work & Research Motivation

2.1. Related Work

Path planning-based reconnaissance establishes a path in advance by a central operator or planner before reconnoitering the scanning area. When the path is determined, a UAV flies along with the planned path [17]. In [18], the authors studied a path planning based on multiple UAVs for a polygonal-shaped area. The convex areas are partitioned into the same number as UAVs. The UAVs perform patrolling missions in their own assigned area. If a UAV malfunctions, the area allocated to each UAV is re-established. In [4,5,6,8,11], authors studied path-planning with optimization algorithms such as bee colony [4], ant colony [5], particle swarm [6,8,11], etc. They planed optimal paths to avoid threatening spots (e.g., an area easily detected by enemy radar) or to pass through important locations. On the other hand, if there are no important locations and threatening spots, the UAV moves straight to the destination established by the operator.
In [19], the authors categorized the Paparazzi mobility model [20] and the Semi-Random Circular Movement model [21] into the path-planned method because those models move with certain patterns. The Paparazzi mobility model has five movement patterns which are stay-at, oval, way-point, eight, and scan. The probabilities for performing stay-at, oval, and scan are 30% each, while those of selecting eight and way-point patterns are 5% each. The Semi-Random Circular Movement model is proposed to patrol specific areas based on orbiting movement. In this model, a UAV generates several destinations to fly with a spiral pattern. Once arriving at the final destination, the UAV generates new destinations and repeats this process.
The second approach is the reconnaissance based on the random mobility model which is well-known for modeling a movement of mobile node over a time period not only in mobile ad-hoc networks (MANET) but also in flying ad-hoc networks (FANET) [22]. The Random Waypoint model has been used as a basic model because of its simplicity [23]. A UAV generates a new destination randomly in the scanning area and then moves to that destination. When a UAV arrives at the destination, it repeats this process. The Random Markov Process model [12] is another random mobility model which stochastically decides one of three actions: Turn-left, straight ahead, and turn-right.
The Gauss–Markov mobility model [24] represents realistic movement of a node because it determines the next coordinate from the previous velocity and direction. This model was designed to adjust randomness of diverse levels by applying one tuning parameter. The Enhanced Gauss–Markov mobility model [16] applies the Gauss–Markov model for UAV reconnaissance. This model considers smooth movement within the scanning area and a smooth turn in the boundary area. When a node approaches near the boundary area, it avoids a collision by changing mean direction deviation and mean variance of direction deviation.
The Distributed Pheromone Repel (DPR) model [12] is inspired by the swarm intelligence which is the collective behavior of animals such as ants, bees, birds, etc. Ants interact by sharing their local information and move toward the strong pheromone. On the other hand, as the DPR model is designed for reconnaissance, UAVs move to areas with less pheromones. Each node has its own virtual map to store pheromone distribution and updates the map by broadcasting with nearby nodes. Other models based on pheromones are the Hybrid Markov Mobility Model with Pheromones (H3MP) [13] and the Multiple Pheromone UAV Mobility Model (MPUMM) [14]. H3MP is proposed for a patrol-surveillance scenario to detect targets in a realistic area that is non-square. It divides the area into N zones with the K-means algorithm. A UAV moves toward a zone with transition probabilities based on pheromones and the number of detections. In MPUMM, a UAV operates with two pheromones which are repulsive and attractive. The repulsive pheromone is used for reconnaissance. A UAV reconnoiters the scanning area with repulsive pheromone when there is no target. On the other hand, the attractive pheromone is employed for target tracking. If a UAV discovers a target, the UAV traces that target by attractive pheromone.
Random Destination with Partitioned Zone is another model which reconnoiters by communicating with each UAV [15]. This model divides the scanning area to be reconnoitered into n × n zones and manages the number of visited destinations in each zone by communicating with the nearby UAVs. When a UAV flies to the destination, it stochastically selects the zone with fewer destinations.

2.2. Research Motivation

Random mobility models are beneficial for multi-UAV reconnaissance due to their randomness and robustness to failure. In the path-planning reconnaissance, it is possible for targets or enemies to predict UAVs’ movement so that they can hide for the expected reconnaissance time. On the contrary, the random mobility model makes it difficult to predict the reconnaissance time. In addition, the random mobility model can endure some malfunctions of UAVs because a UAV can visit anywhere in the reconnaissance area.
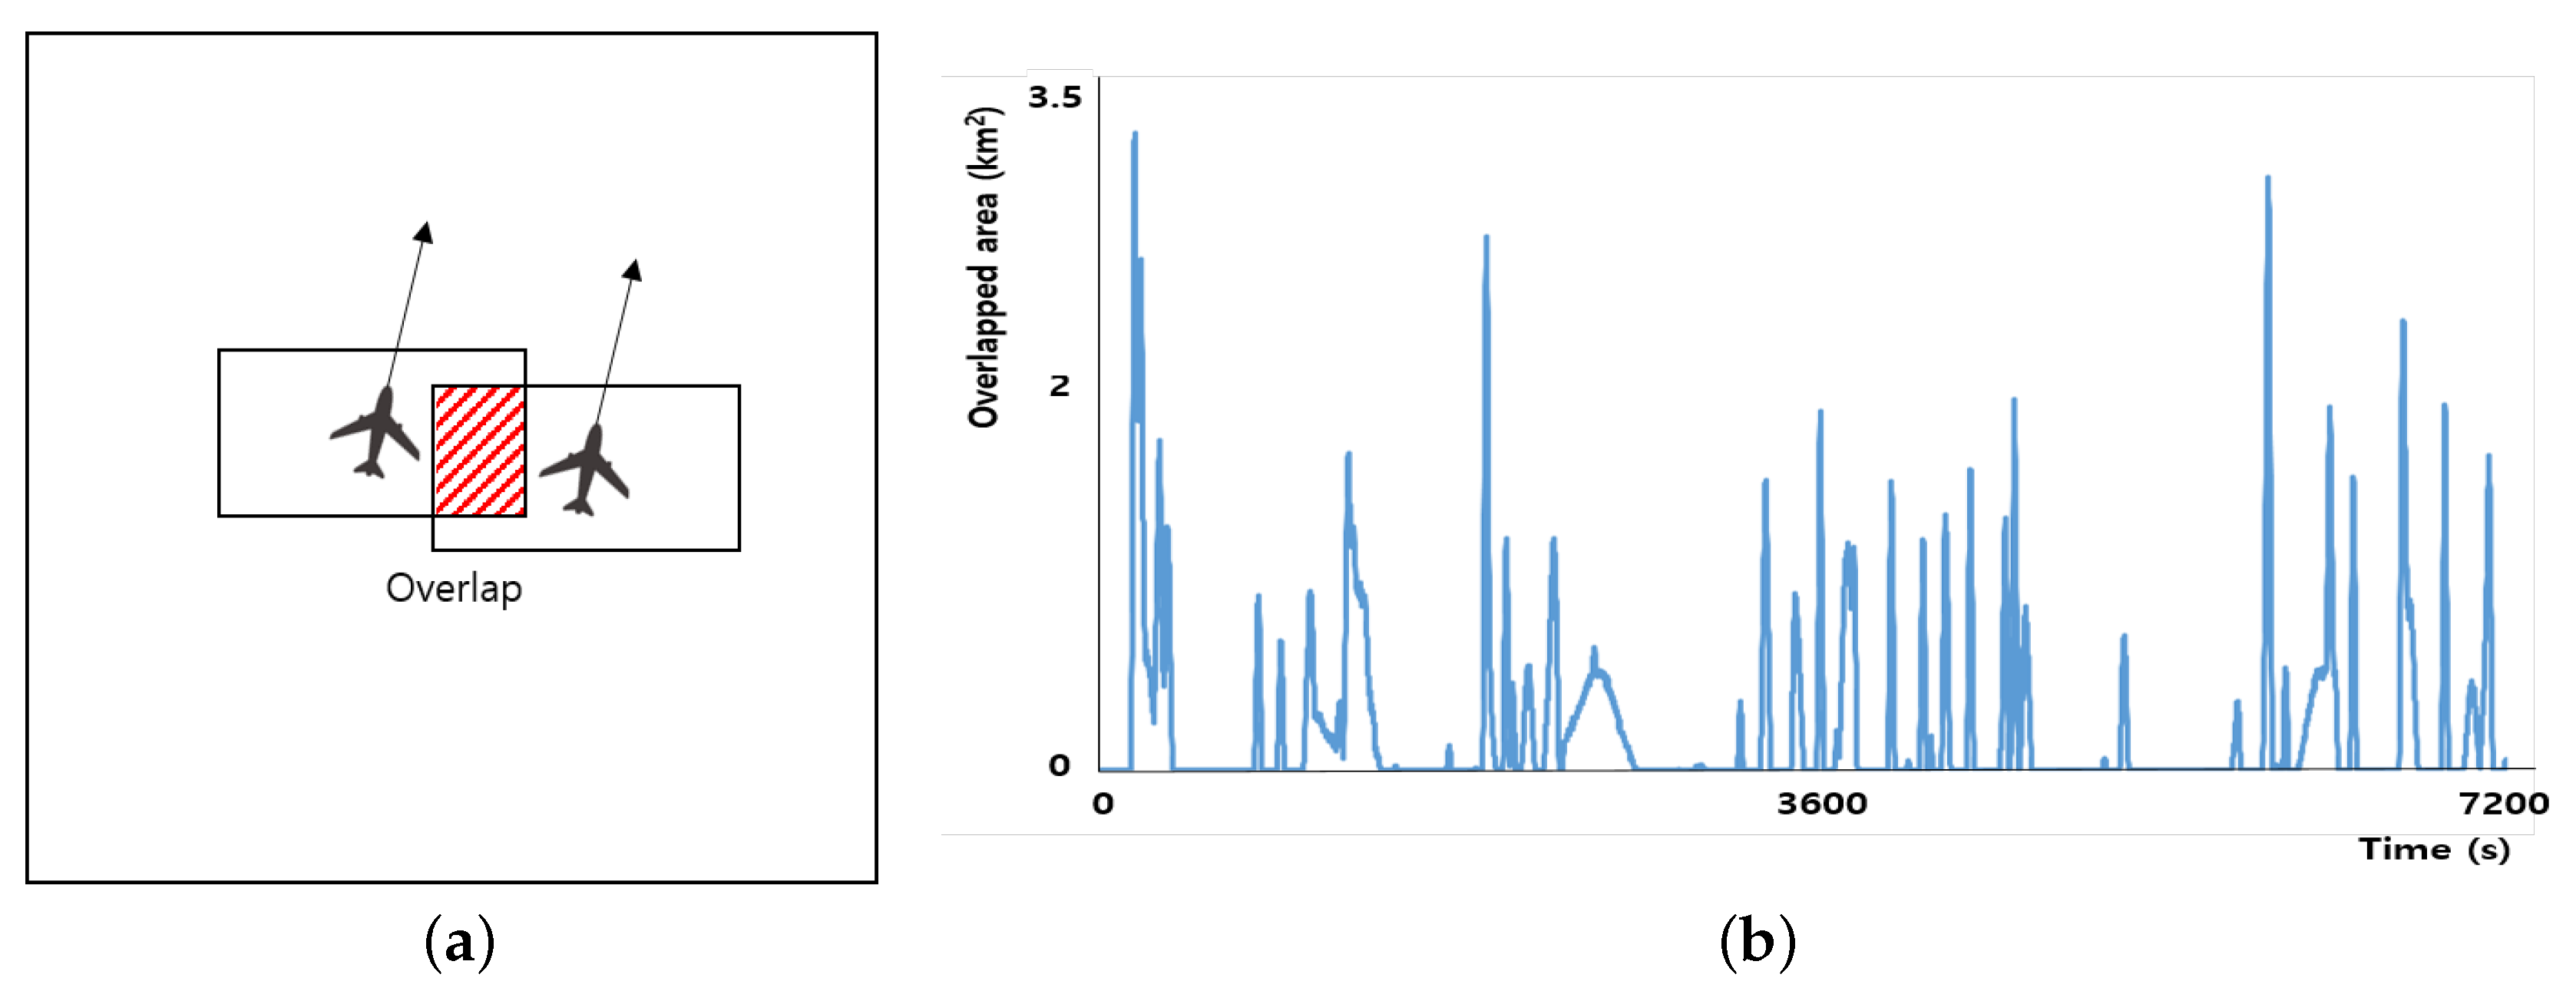
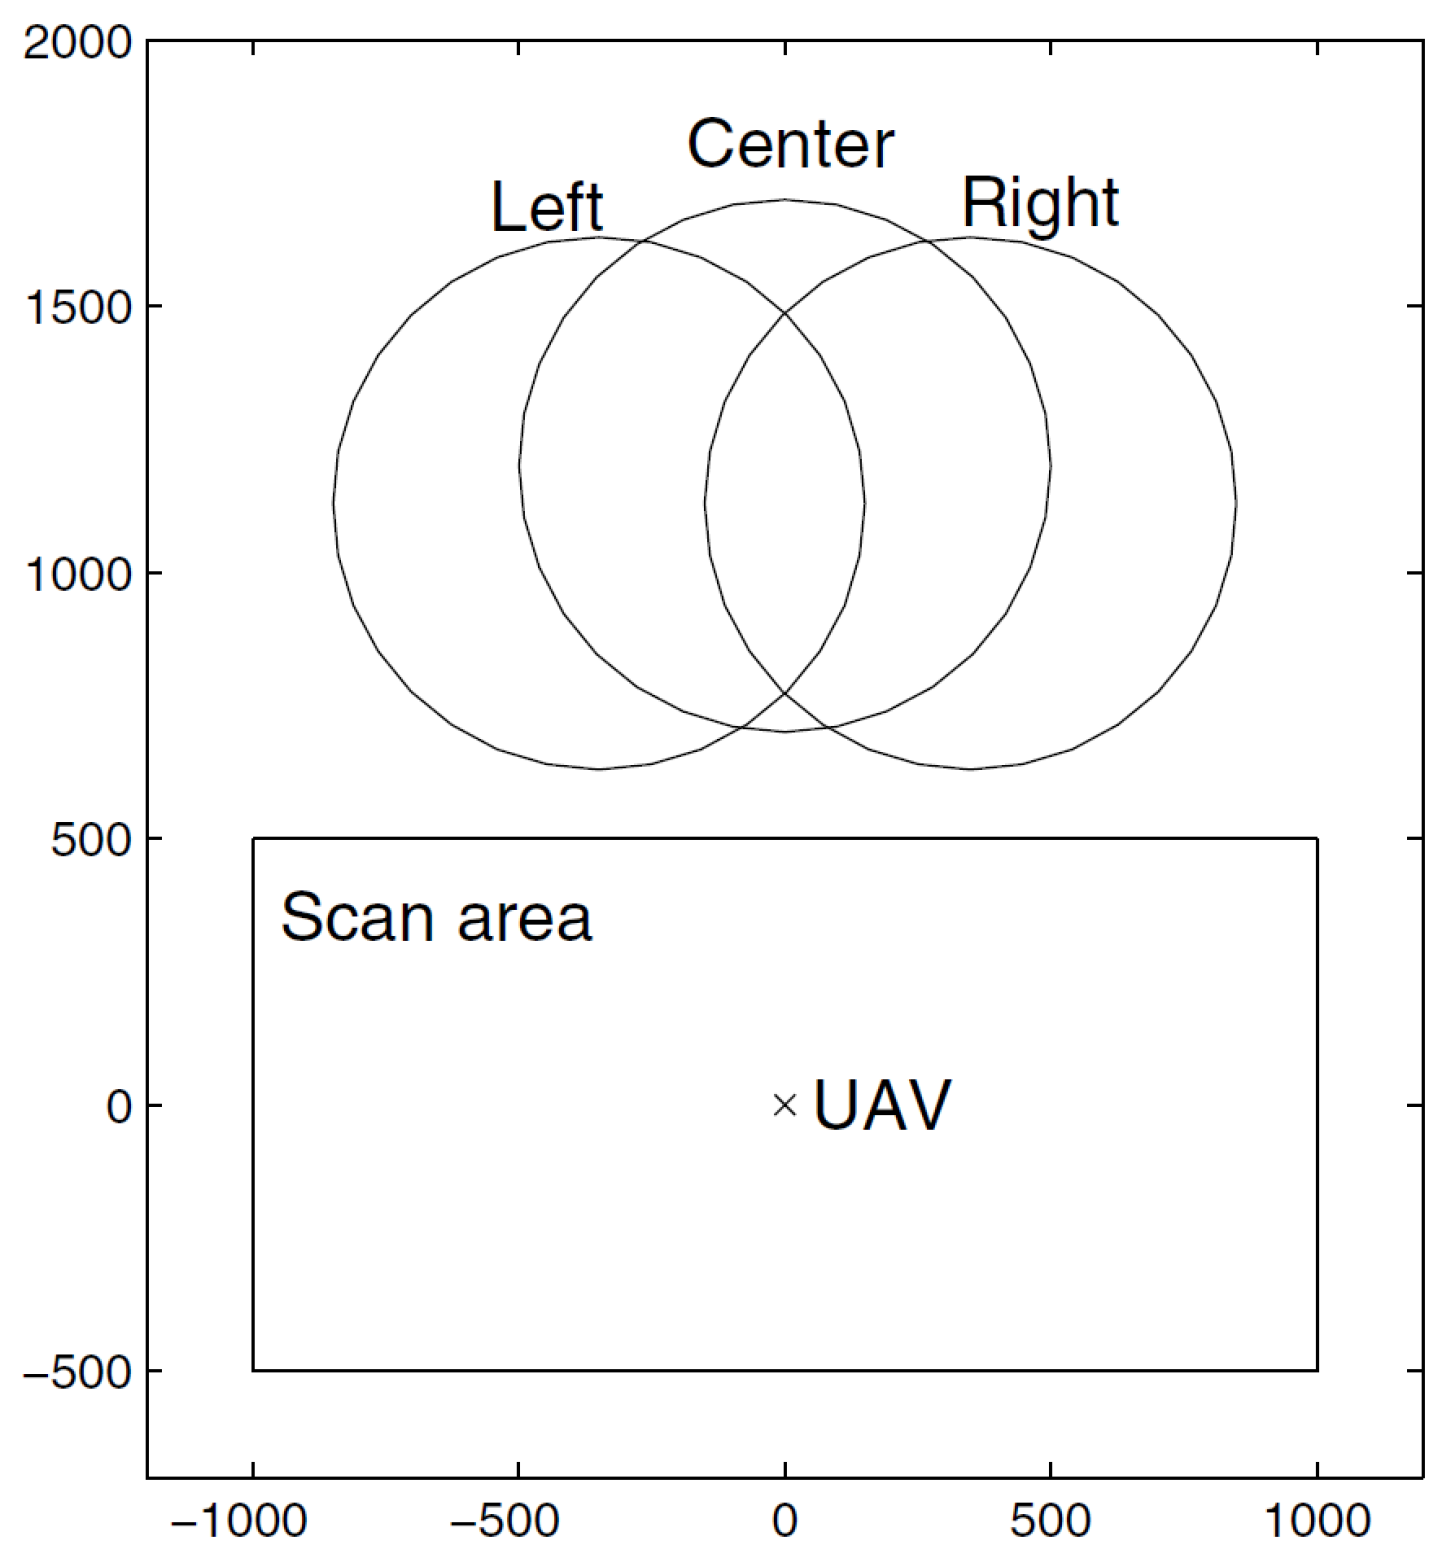
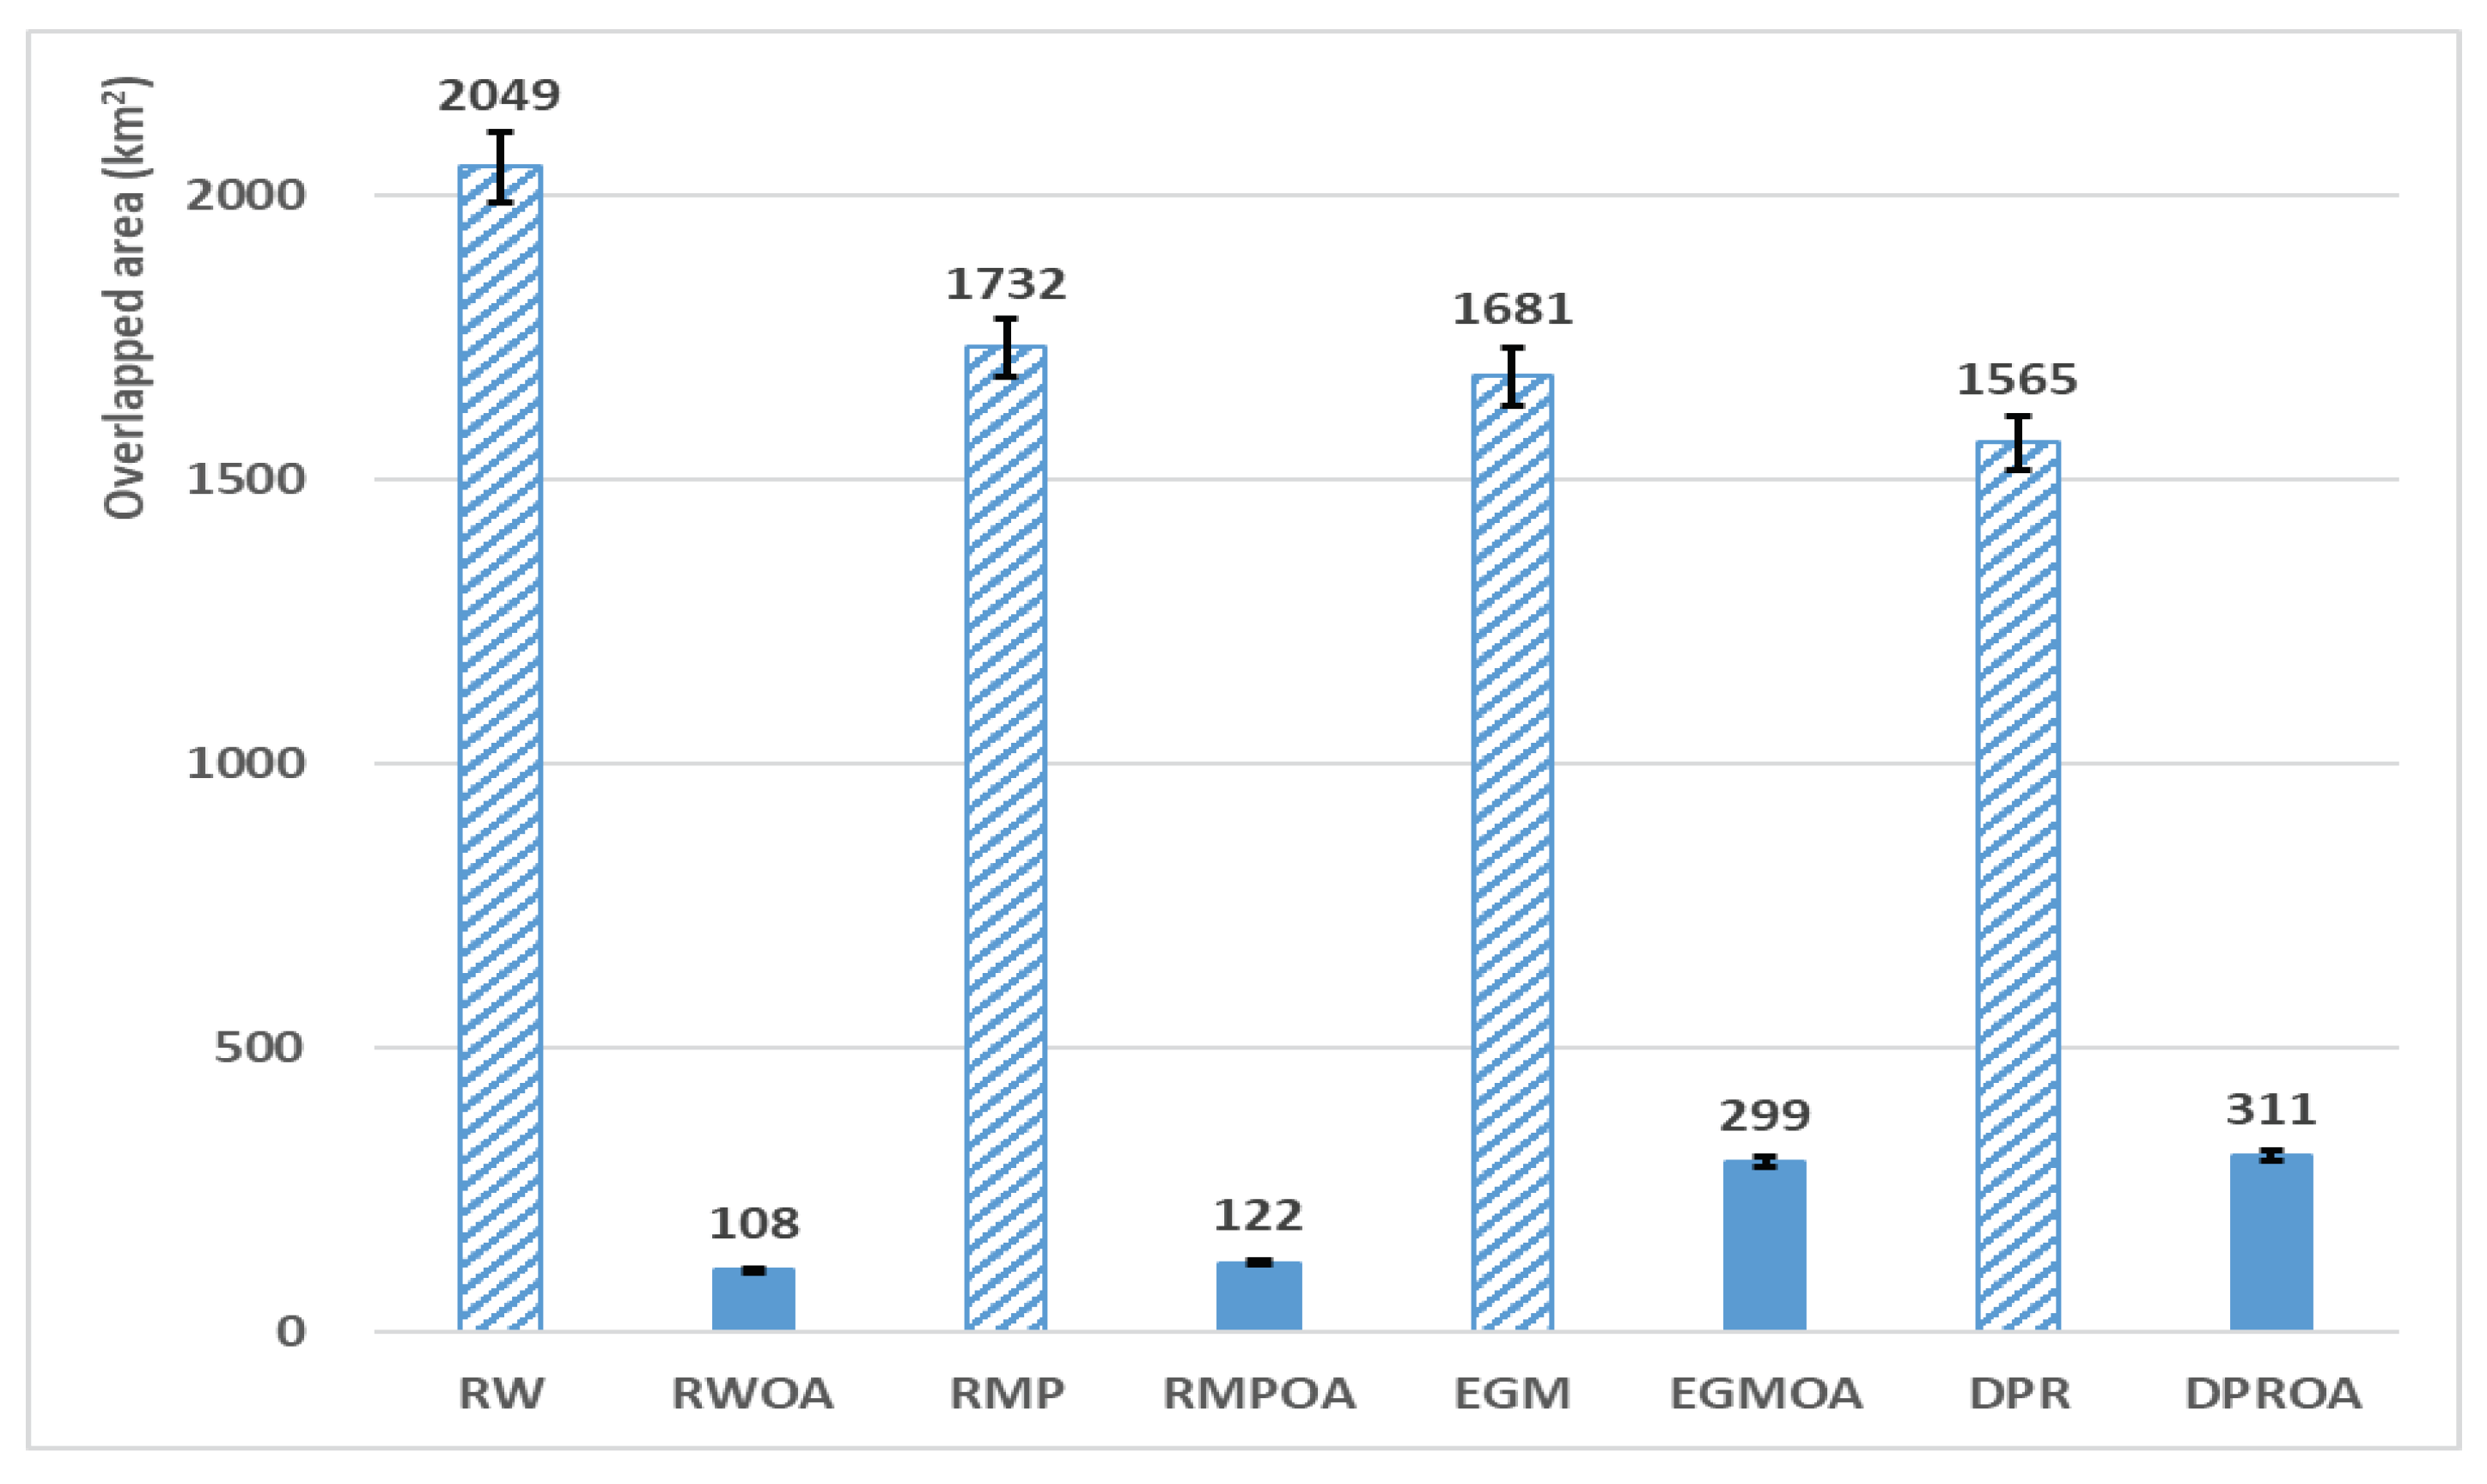
However, one weakness of multi-UAVs reconnaissance based on the random mobility model is overlapped reconnaissance which is defined by simultaneous reconnaissance of the same area by two or more UAVs. As the scan area or camera scanning area is larger than the UAV, a part of the scan area can be overlapped by multiple UAVs, as shown in Figure 1a. If two UAVs fly towards a similar destination with an overlapped area, the overlapped area becomes the loss in terms of coverage efficiency. Even in the case where two UAVs at the same instant fly in the opposite directions with overlapped areas, the area scanned by one UAV can be re-visited soon by the other UAV. This is a cause of imbalance of reconnaissance. The overlapped reconnaissance can also lead to collision of UAVs.
Figure 1a shows an example of overlapped reconnaissance area for random mobility model-based reconnaissance. We simulated Random Waypoint model in the range of 30 km × 30 km. The UAV model follows Table 1 and the camera scan range is given by 2 km × 1 km. Figure 1b shows the overlapped area for two hours by ten UAVs. As shown in Figure 1b, UAVs reconnoiter overlapped area frequently (about 40%) for two-hour reconnaissance.
While much recent work has proposed efficient random mobility models for multi-UAV reconnaissance [12,13,14,
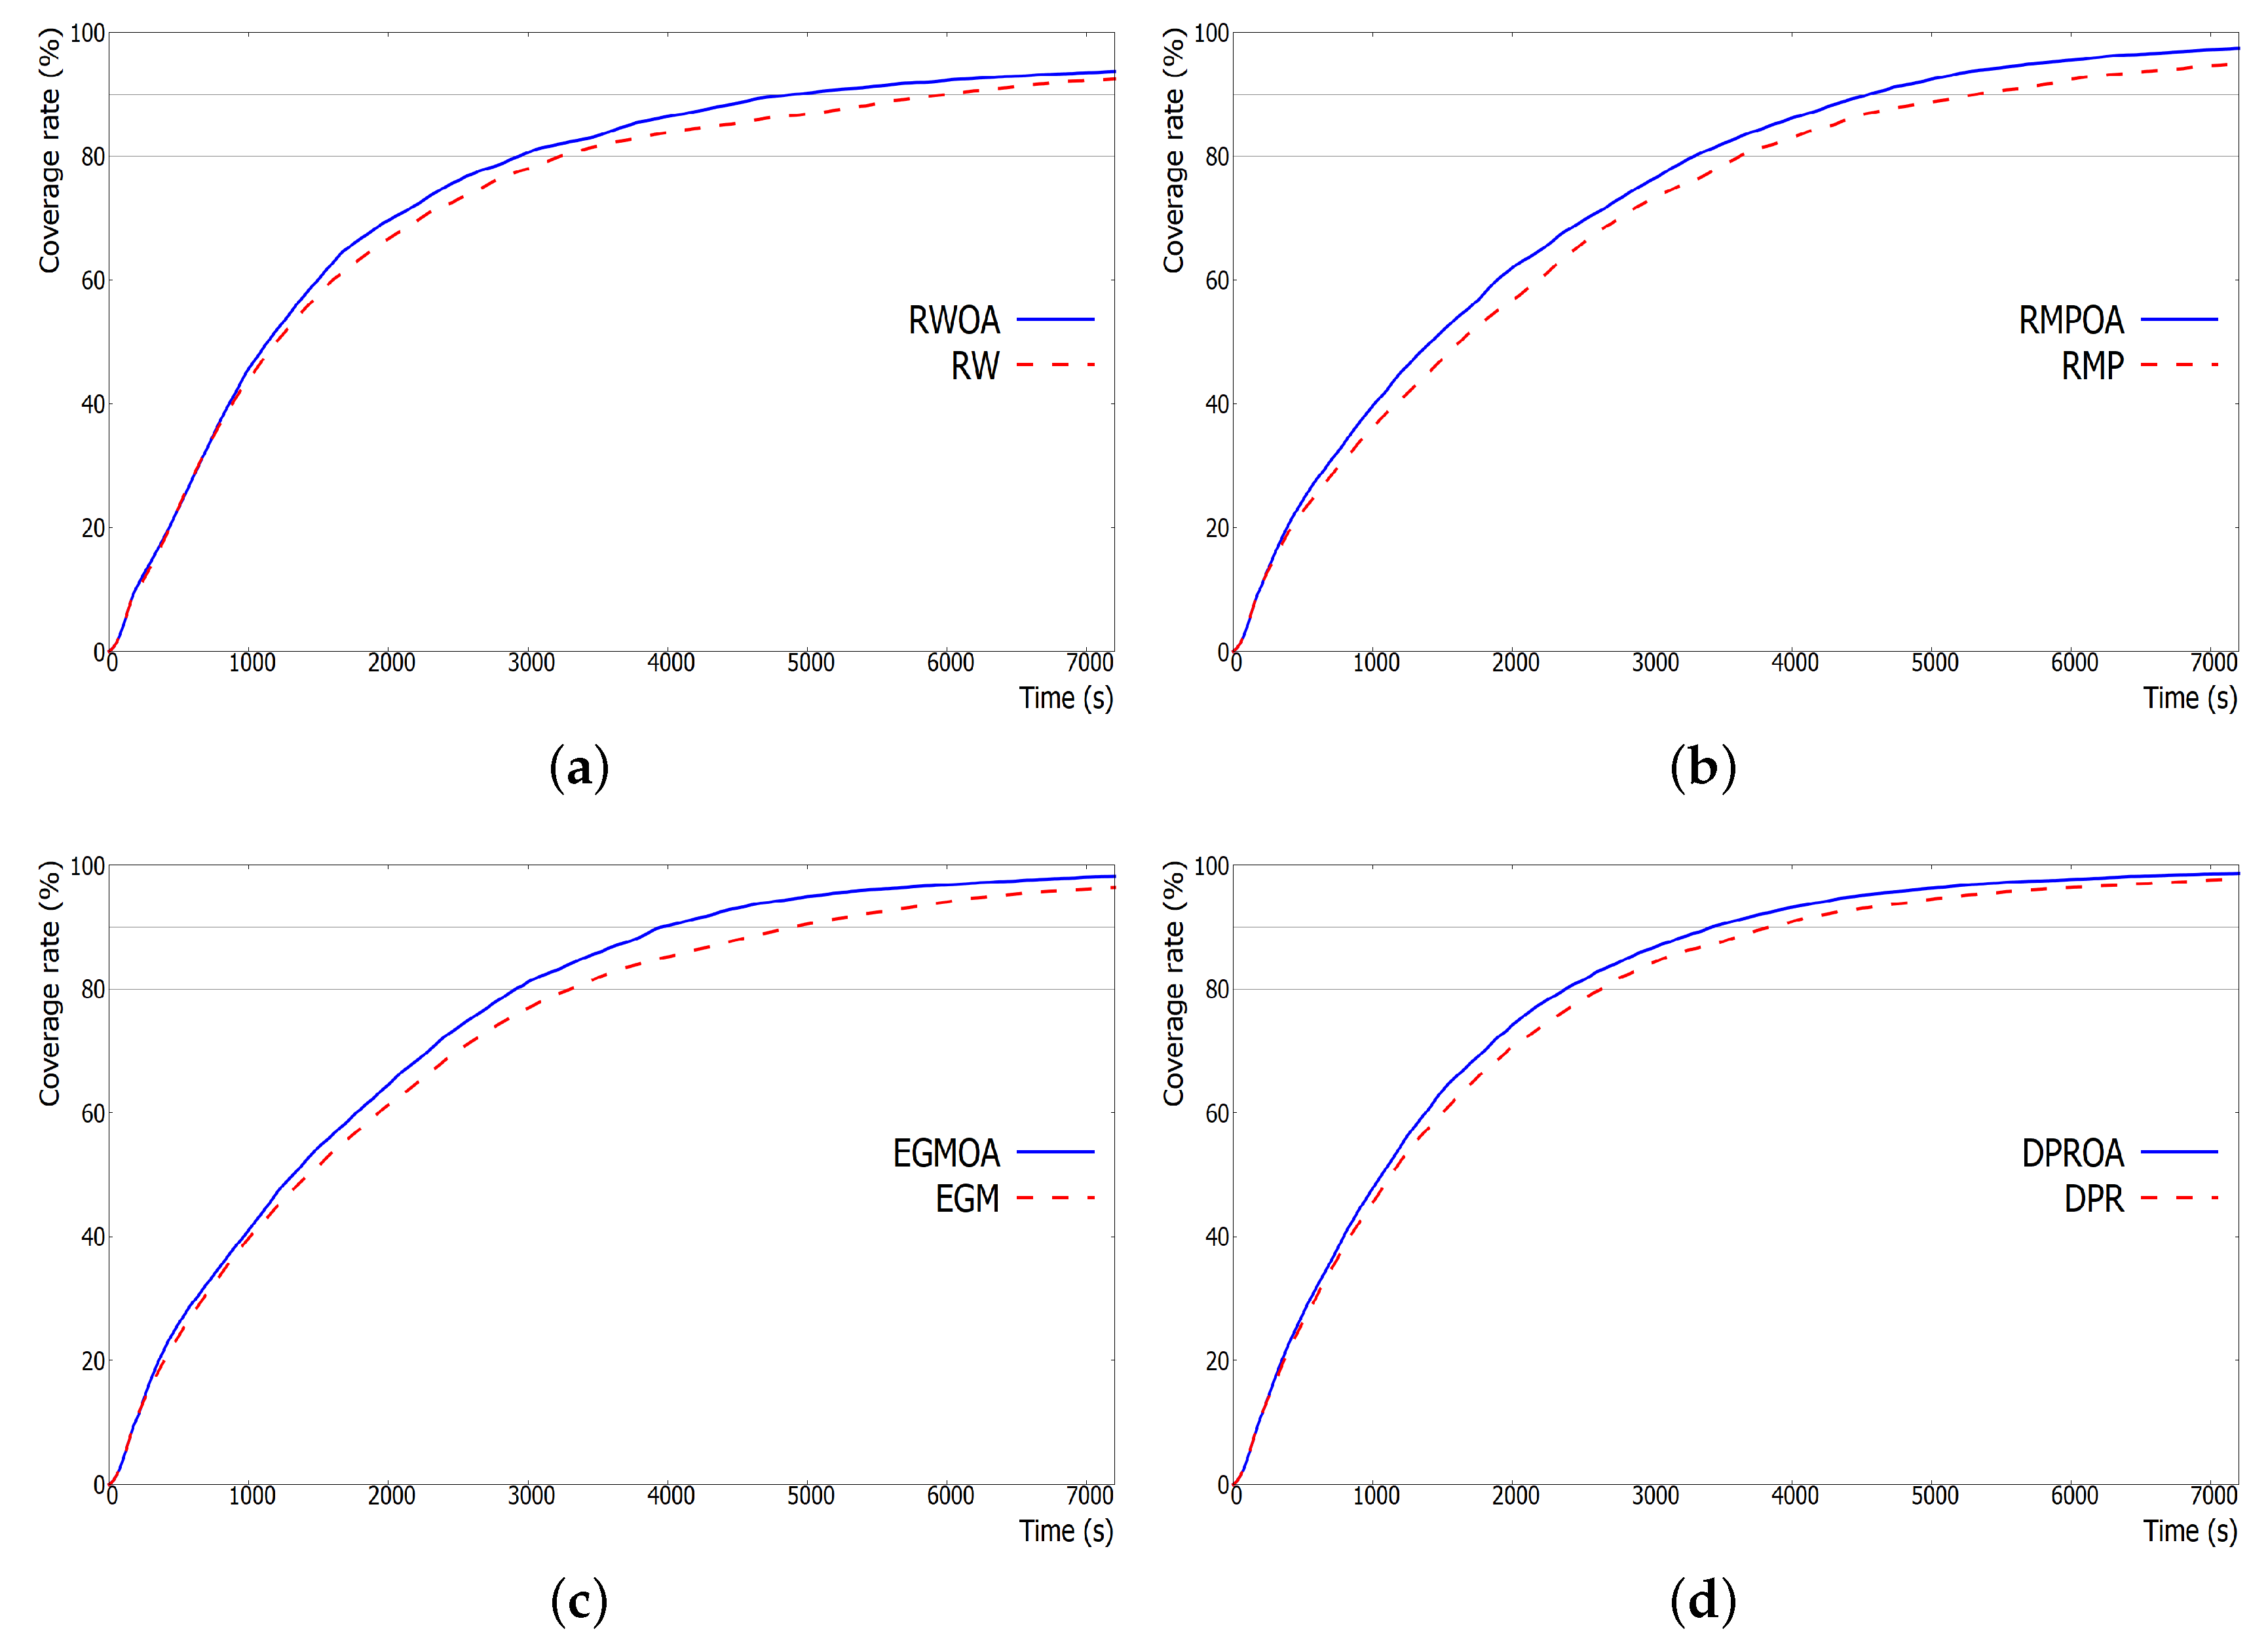
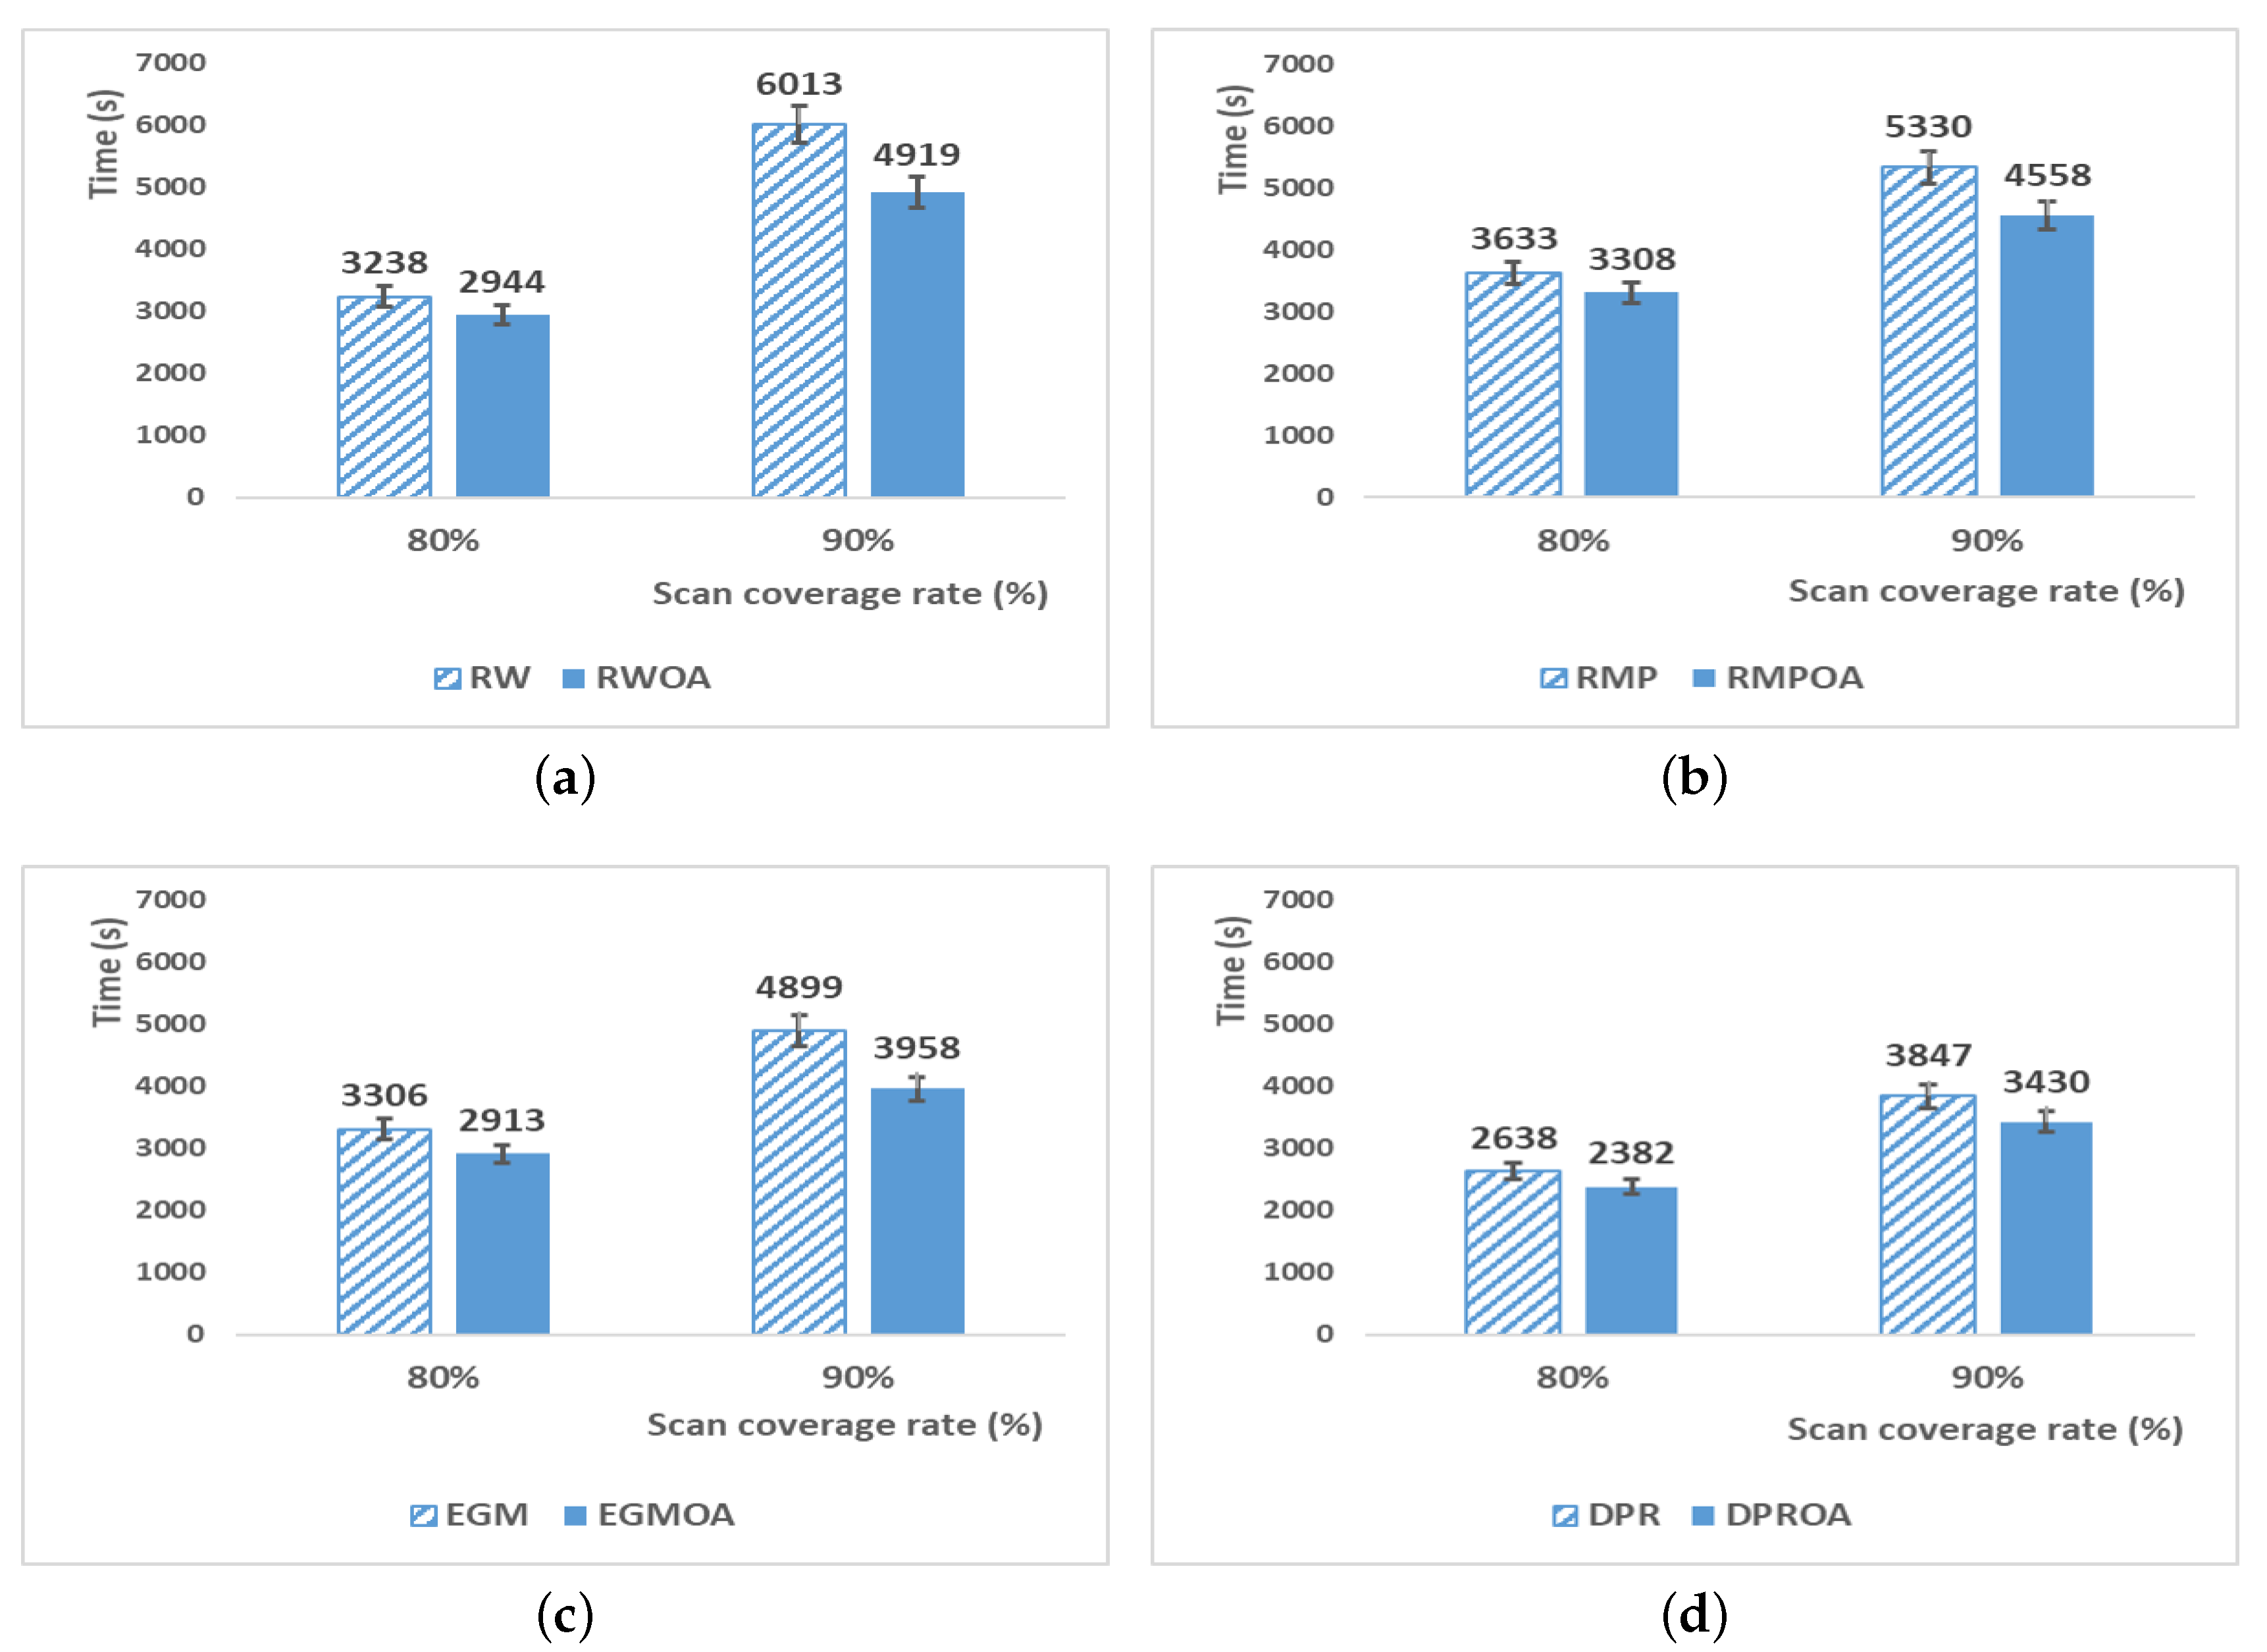
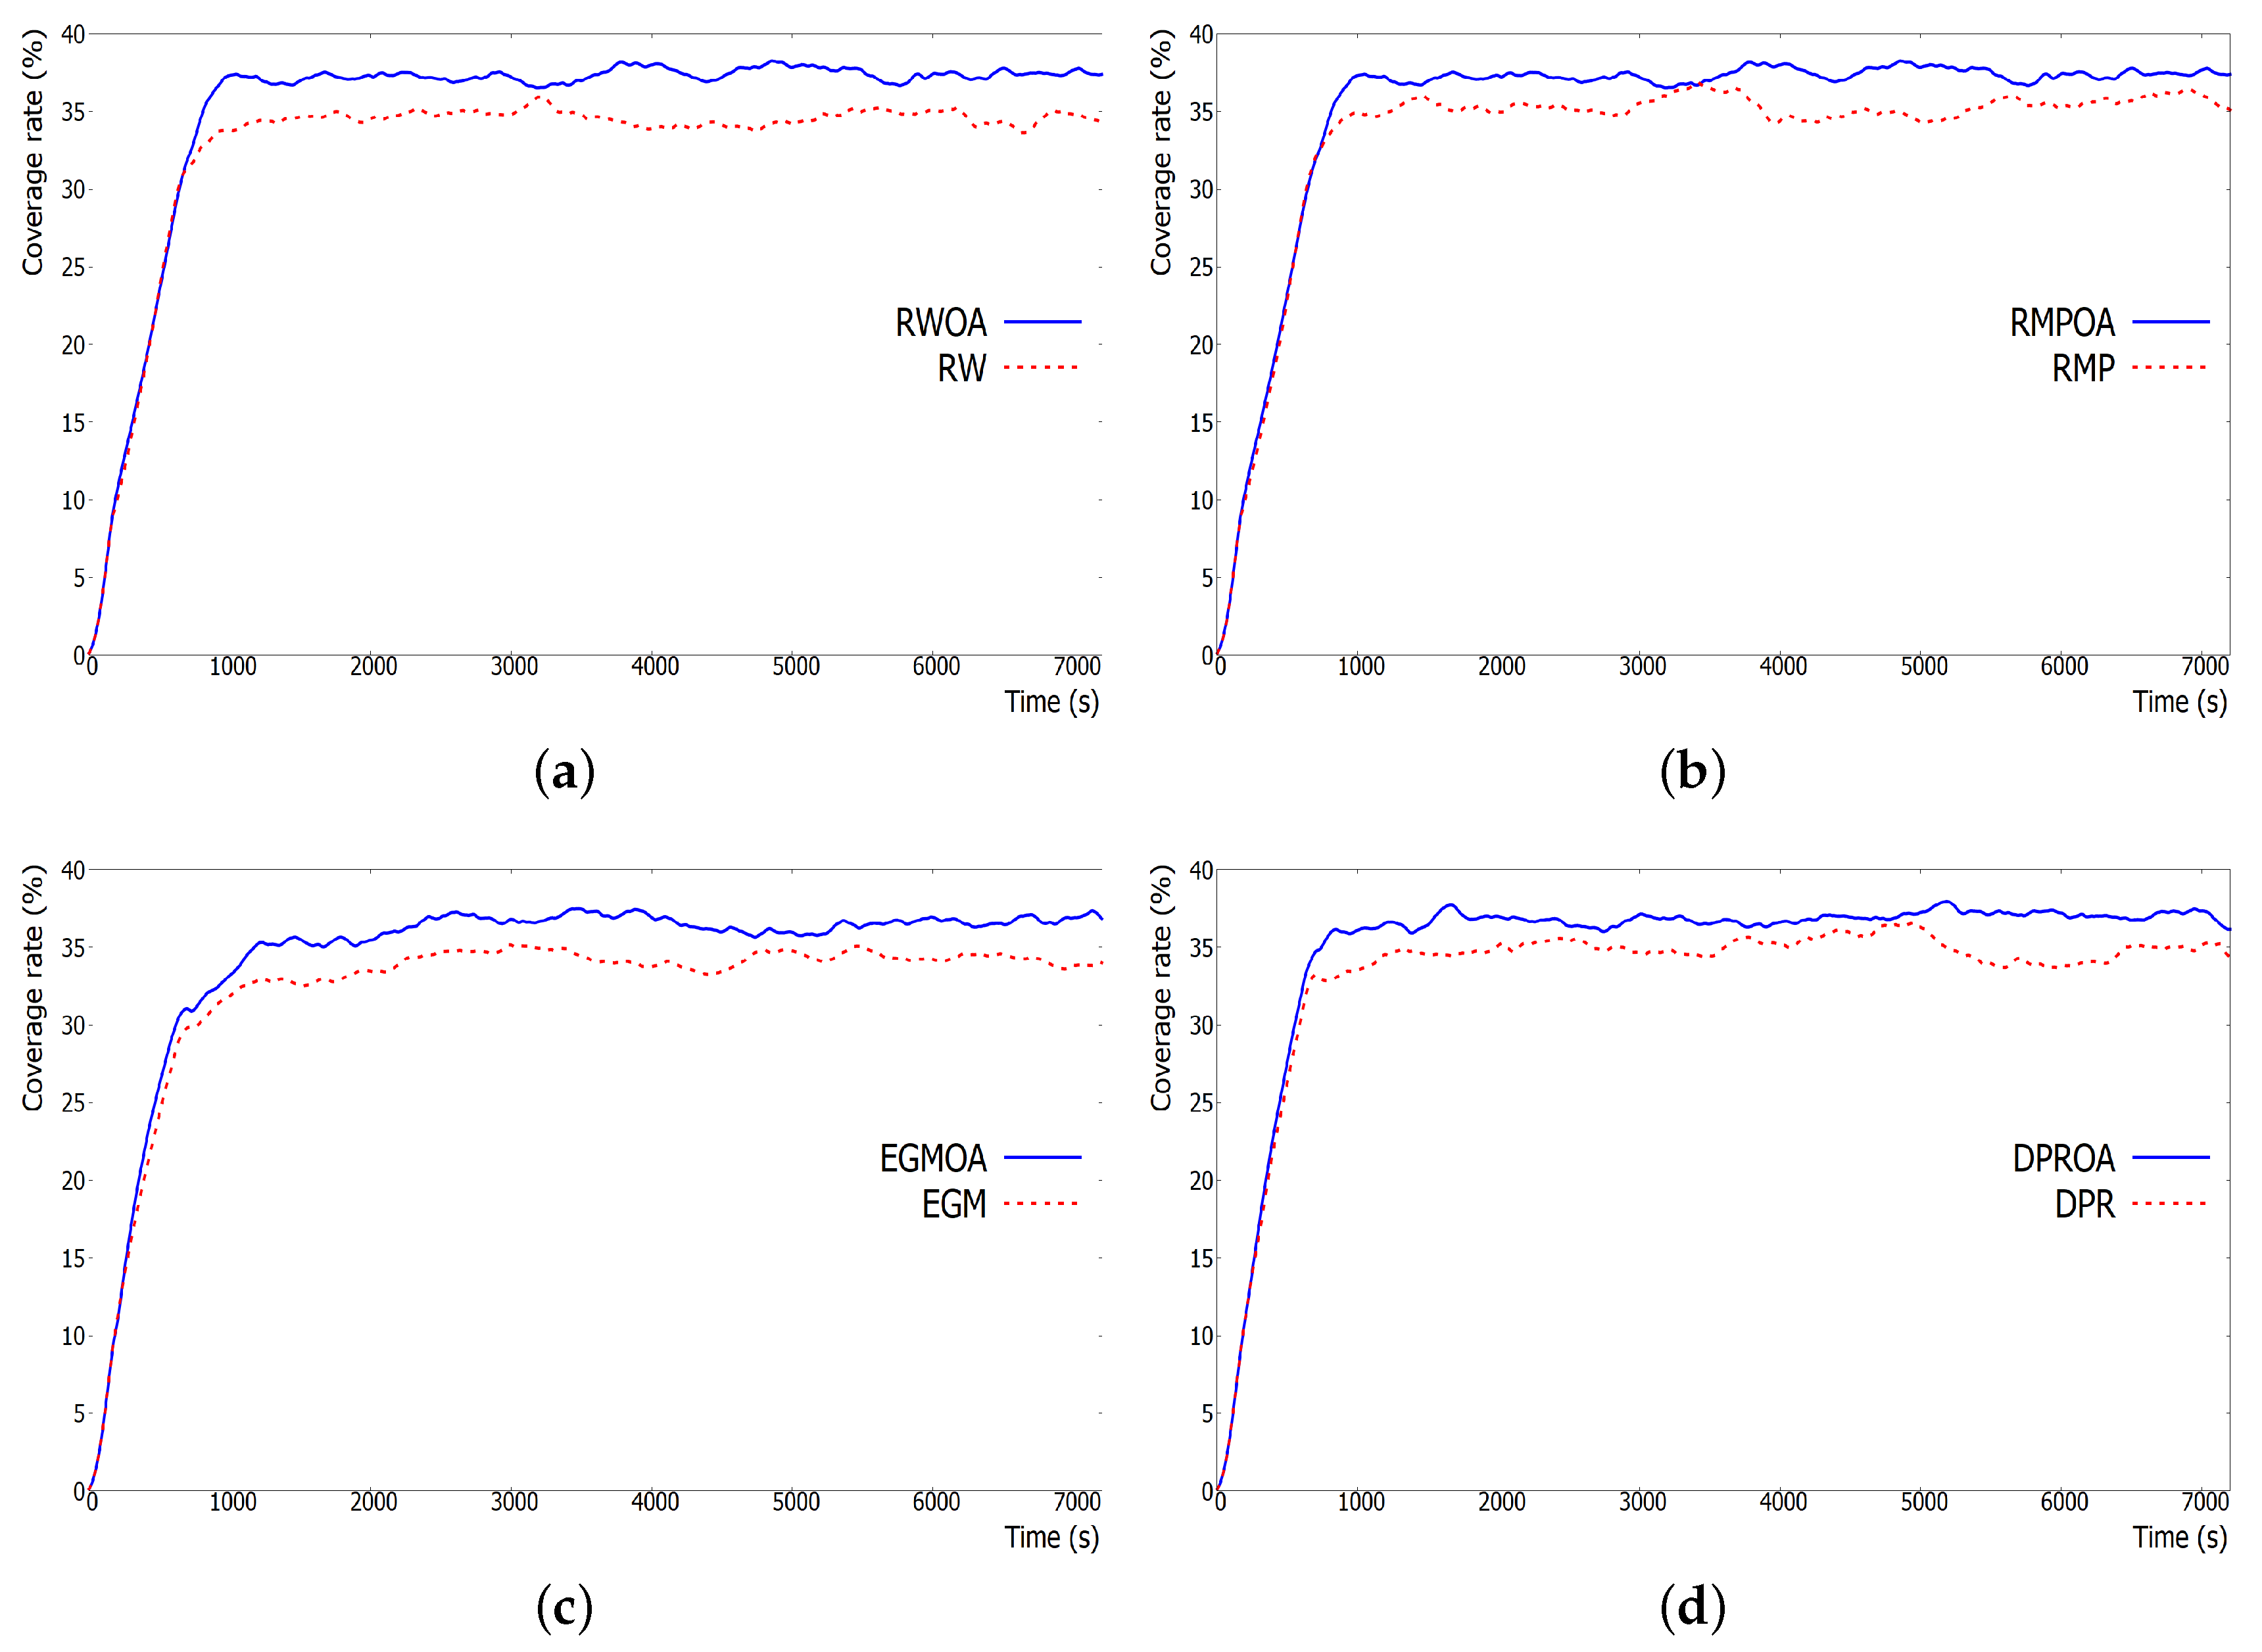
15], none of work considers overlapped reconnaissance. Thus, in this paper, we focus on avoiding overlapped reconnaissance by redesigning the existing reconnaissance mobility models. We provide overlap avoidance schemes for well-known random mobility models of multi-UAV reconnaissance. Those models include Random Waypoint, Random Markov Process, Enhanced Gauss–Markov, and Distributed Pheromone Repel models.

3. Proposed Model

3.1. UAV Model

In this paper, we assume a fixed-wing UAV which is generally efficient in wide-area reconnaissance. We use the simple UAV model used in [12], as shown in Table 1. To fulfill realistic motion for the turn of fixed-wing UAV, we set the rotation radius to 500 m. We set the communication range among UAVs to 8000 m. We do not take account of packet loss in communicating with each UAV. The UAV is furnished with a camera of which the scanning range is 2000 m × 1000 m. The UAV speed is fixed at 150 km/h and its altitude is fixed at 3500 m. Since UAVs fly at the same altitude, we denote the coordinate of a UAV u i as ( x i , y i ) for the simplicity.

3.2. Overlap Avoidance for Random Waypoint Mobility Model

3.2.1. Random Waypoint Mobility Model

In MANET, Random Waypoint model [23] has been used as a basic model due to its simplicity. A node generates a random destination in scanning area and travels toward the destination with a random speed between V m i n and V m a x . When the node reaches the destination, it pauses the time between T m i n and T m a x as shown in Figure 2a.
In the UAV reconnaissance scenario, however, Random Waypoint model is modified so that the UAV speed is fixed as V m a x and there is no pause time after arrival. Another modification is considering the smooth turn at the destination, which is required for a constant-speed flying of the UAV during its reconnaissance, as shown in Figure 2b. In Figure 2a, the node in MANET is a mobile object such as cellular telephone, laptop computer, handheld, etc. Since the speed is slow and there is a pause time, the node changes its direction sharply. However, in the reconnaissance scenario, as the node is a UAV with fast speed and no pause time, we consider its smooth turn as shown in Figure 2b.
In this model, UAVs mainly reconnoiter the center of the scanning area, although they move randomly. It results in insufficient search in the boundary of the scanning area. This is one of main reasons of the low reconnaissance coverage rate in the Random Waypoint model [15]. Another limitation is the overlapped reconnaissance. As this model does not consider avoiding overlap, UAVs tend to reconnoiter the same area simultaneously.

3.2.2. Proposed Overlap Avoidance Scheme for Random Waypoint

We enhance the performance of Random Waypoint model by preventing duplicated reconnaissance of each UAV in the scanning area. In Random Waypoint model, since a UAV chooses a waypoint randomly as a destination, some UAVs may generate a waypoint near the waypoint of another UAV. If UAVs move to similar destinations at the same time, coverage loss occurs because these UAVs reconnoiter the same area duplicately.
In order to avoid overlapped searches, we apply the trajectory-prediction scheme. Figure 2b is an example of predicting the trajectory for N time steps. The black points present destinations and the dotted line means predicted trajectory. As shown in Figure 2b, a UAV manages two destinations, the current and the next ones, because the predicting trajectory for N time steps can be passed over the current destination.
UAVs broadcast their trajectory information periodically to neighboring nodes in order to predict overlapped area among UAVs. UAVs detect all overlaps which occur in the predicted trajectory and they turn to avoid them. Thus, each UAV can decide whether it belongs to a group of UAVs with overlapped area. For example, Figure 3a shows that three UAVs have two overlapped areas. We regard UAVs with overlaps in the predicted trajectory as one group and then change the direction of UAVs belonging to that group.
We generate guidance lines for changing directions of UAVs which share the overlapped area. First, we calculate the central point of overlapped UAVs, denoted by p c   =   ( x c , y c ) , as follows:
x c   =   1 n u i U o x i
y c   =   1 n u i U o y i
where U o is a set of UAVs in an overlapped area and n is the number of UAVs in U o .
Once the center point is calculated, the guidance line is generated to determine the direction to which the UAV moves. The guidance line is defined by the intermediate line between two virtual lines which head to the central point from the UAV and its right-side UAV. For instance, Figure 3b,c show the examples of generating guidance lines when the number of UAVs are three and two, respectively. Thus, assuming that UAVs in the overlapped area are sorted in the counter-clockwise order, the guidance line of UAV u i is defined by:
y i   =   θ i + θ i + 1 2 ( x i c x ) + c y
where θ i is the degree from the u i toward central point and θ n + 1   =   θ 1 .
Each UAV creates a new waypoint on its guidance line and moves to that waypoint as shown in Figure 3b. When the UAV generates a waypoint, the next destination is also generated for trajectory prediction.

3.3. Overlap Avoidance for Random Markov Process Mobility Model

3.3.1. Random Markov Process Mobility Model

This model is based on the Markov process which is a probability process where the future state depends on the present state regardless of the state of the past [25]. The Random Markov Process model operates according to the probability table as shown in Table 2 [12]. For example, if the current direction of a UAV is straight ahead, the probability of keeping straight ahead is 80% while it turns either left or right with the probability of 10% each. On the contrary, if the current direction is turning right, the probability of keeping right-turn is given by 70%. A UAV determines its direction in every other second.
In this model, it is difficult to obtain high coverage when UAVs reconnoiter the scanning area owing to insufficient search in some areas. As UAVs fly with dynamic motion, they often tend to hover a point. Hence, it takes a long time in acquiring high coverage.

3.3.2. Proposed Overlap Avoidance Scheme for Random Markov Process

In Random Waypoint model, UAVs are able to predict trajectories because they have their own destinations. In Random Markov Process model, on the other hand, UAVs cannot predict their trajectories because the model does not have a destination but decides next direction. Instead, we define the protected zone as the area within a certain distance (e.g., twice of camera scanning distance) and detect overlaps in case that other UAVs are located in the protected zone. Figure 4a shows the example of detecting the overlap between two UAVs.
If the protected zones are duplicated, we generate guidance vectors to lead UAVs to change directions. The proposed model assigns more probability to the direction of the guidance vector in order to avoid overlapped reconnaissance. In case of two overlapped UAVs, the guidance vectors are simply two repulsive vectors from the central point to each UAV, as shown in Figure 4a.
However, when a UAV is overlapped with more than two UAVs, we need a mechanism to obtain the guidance vector. Let us define v i j as the repulsive vector of UAV u i due to u j . The direction of v i j is from the central point of u i and u j to the u i . The size or magnitude of v i j is given in proportion to the overlapped area. Then, the guidance vector of a UAV is defined by the summation of its all repulsive vectors. For example, the UAV u 2 in Figure 4b is overlapped with u 1 and u 3 . The guidance vector v 2 is obtained by adding two repulsive vectors v 21 and v 23 .
When the guidance vector is obtained, we give a higher probability to the direction of the guidance vector in order to avoid overlap area. For example in Figure 4a, UAV u 1 is guided to turn left, while u 2 is led to turn right. In case of u 4 in Figure 4b, it is guided to turn left since the UAV is much overlapped with UAV u 3 .
Thus, we need a new decision probability table different from Table 2, in order to avoid the overlap area depending on the direction of the guidance vector. If the guidance vector heads to the left side of the current direction, the next action probability follows the second row of Table 3. For example, when a UAV is currently turning right, its next probability of flying straight is 100% because the UAV cannot turn left immediately. If the current direction is flying straight, the probability for turning left is 70% and that of flying straight is 30%. Lastly, when a UAV turns left, we give 90% probability of turning left. Similarly, if the guidance vector is in the right side, the next action probability follows the third row of Table 2 so as to guide the UAV to the right direction.
Once a UAV has no more overlapped area, we maintain the UAV to fly straight for a while. This reduces the possible hovering due to overlap avoidance. Let us note that we use five time steps of straight head in our simulations. After a certain period of keeping straight, the UAV again follows Table 2 as usual.

3.4. Overlap Avoidance for Enhanced Gauss–Markov Mobility Model

3.4.1. Enhanced Gauss–Markov Mobility Model

Enhanced Gauss–Markov model is based on Gauss–Markov model in which a node is a mobile machine such as laptop, cellular phone, etc. On the contrary, in order to model the UAV motion for reconnaissance, Enhanced Gauss–Markov model is proposed so that a UAV node moves with smooth motion at the time of changing direction [16]. In Enhanced Gauss–Markov model, the speed s t and the direction deviation d _ d e v t of a UAV at time t are calculated by:
s t   =   α s t 1 + ( 1 α ) s ¯ + 1 α 2 s x t 1
d _ d e v t   =   α d _ d e v t 1 + ( 1 α ) d _ d e v ¯ + 1 α 2 d _ d e v x t 1
where s ¯ and d _ d e v ¯ are the mean speed and the mean direction deviation, respectively. We can select α from 0 to 1 for the random degree. In Equations (4) and (5), s x t 1 and d _ d e v x t 1 are the random Gaussian distributions represented by N ( 0 , σ 2 ) ; where, σ is the standard deviation, when t [16]. Once d _ d e v t is calculated, the next direction, d t , is computed by Equation [16], where d t 1 is the previous direction.
d t   =   d t 1 + d _ d e v t
Another modification of Enhanced Gauss–Markov model for UAV reconnaissance is considering boundary-avoidance scheme near the border area. When a UAV approaches to the border, it decides the turn direction either to left or to right. For a certain time period, the mean direction deviation is set to −22.5 for the left turn or 22.5 for the right turn [16], which results in the smooth avoidance to the border, as shown in Figure 5a.

3.4.2. Proposed Overlap Avoidance Scheme for Enhanced Gauss–Markov

We redesign the Enhanced Gauss–Markov (EGM) model for avoiding overlap by applying the guidance vector scheme as shown in Figure 4. As same in Section 3.4.1, the overlap avoidance scheme is initiated when the protected zones of UAVs are duplicated. The turn direction of each UAV is also determined as the direction to the guidance vector from the current direction.
For the purpose of avoiding overlaps, we use the boundary avoidance scheme of Enhanced Gauss–Markov model. When the UAV decides to turn left (or right) after detecting overlap of protected zones, the mean direction deviation is set to δ for continuous left turn (or + δ for right turn). Let us note that we use 2.5 for δ as shown in Figure 5b. Then, UAVs try to turn to different directions so as to avoid overlapped reconnaissance. After no protected zone is duplicated, the mean direction deviation is set to 0, as usual.

3.5. Overlap Avoidance for Distributed Pheromone Repel Mobility Model

3.5.1. Distributed Pheromone Repel Mobility Model

The Distributed Pheromone Repel (DPR) model is inspired by ant’s pheromone. When ants look for feed, they secrete pheromone in the pathway and return to the nest using their pheromone [12]. The higher the pheromone concentration, the higher the probability in which ants move along that path. Similarly, the work in [12] modeled the scanned unit region by a UAV as the pheromone. Thus, the DPR mobility model is proposed so that each UAV avoids other’s pheromones in order to increase the coverage rate. A UAV configures a virtual pheromone map and remembers the pheromone distribution in its map. When each UAV performs a reconnaissance mission, each UAV shares pheromone information by broadcasting its pheromone map periodically (e.g., every 10 s).
Figure 6 is an example of deciding direction. There are three circles in front of a UAV, which are left, straight, and right area. If there is no pheromone in three circles, the UAV moves based on Random Markov Process model as in Table 2. On the other hand, if pheromone information is located among the circles, the UAV moves based on probabilities of Table 4, where L p , C p , and R p are the numbers of pheromones in the left, center, and right circles, respectively ( T p   =   L p + C p + R p ).
Example 1.
Let us assume that there are 18 pheromones in the left circle, 17 pheromones in the center circle, and seven pheromones in the right circle. Then, as T p is 42, the probability of turn-left is given by 24 84   =   ( 42     18 ) / ( 2   ×   42 ) . Similarly, the probabilities of straight ahead and turn-right are given by 25 84 and 35 84 , respectively. Thus, the UAV has higher probability of turning right according to the action probabilities.
The DPR model also shows hovering problem as in the Markov Process model since it follows the Markov Process model in case of no pheromone information. Furthermore, when two UAVs meet each other to the same direction, they tend to fly in similar path because of sharing the same pheromone information. It results in overlapped reconnaissance and low coverage rate.

3.5.2. Proposed Overlap Avoidance Scheme for Distributed Pheromone Repel

We enhance DPR model by avoiding overlapped reconnaissance. We use the same overlap detection and guidance vector scheme as in Section 3.4.1. In order to assign the amount of increasing probability, we calculate the difference between the current direction and the guidance vector, which is denoted as ψ . For example, Figure 4a shows ψ 1 and ψ 2 of two UAVs. Thus, the action table of Table 4 of the DPR model is changed as Table 5.
Table 5 is the action table for avoiding overlap. In Figure 4a, u 2 ’s guidance vector heads the right direction so that we add the weighted value in turn right probability.
Example 2.
Let us consider the same UAV of Example 1 and assume that its guidance vector is located in the left side with ψ of 90°. Then, the probability of turning left is calculated as
T p L p 2 × T p × ( 1 + ψ 180 )   =   42 18 2 × 42 × ( 1 + 90 180 )   =   24 84 × 3 2   =   36 84 .
Since β L is 42 18 42 + 18 · 90 180   =   1 5 , the probability of straight ahead is given by
T p C p 2 × T p × ( 1 β L )   =   42 17 2 × 42 × ( 1 1 5 )   =   25 84 × 4 5 = 20 84 .
Similarly, the probability of turning right is obtained by 28 84 . Thus, the UAV turns to the left side with highest probability so that it can avoid from the overlapped area. (Let us note that the probability of turning right is highest in case of no overlapped area, as in Example 1.)

4. Performance Evaluation

We evaluated performance comparison with previous reconnaissance mobility models and those with overlap avoidance. We simulated ten UAVs reconnoitering the scanning area of 30 km × 30 km for two hours, where each UAV follows the model in Table 1. We developed the mobility model simulator using C++ language and designed those models in the simulator. We verified the average performance by repeating 20 times in each model.
We measured the coverage rate and the inter-arrival time of scanning in each unit region for overall scanning performance. We also measured the overlapped scanned area in order to show the effect of overlap avoidance scheme. The following subsections show various simulation results.

4.1. Coverage Rates

The coverage rate is defined by the ratio of scanned area in the whole area. Figure 7 shows simulation results of RW [23], RMP [12], EGM [16], and DPR [12] and those with overlap avoidance (OA). While Figure 7 shows the cumulative coverage rate, Figure 8 shows the time to reach the coverage rates of 80% and 90% of the whole area in the simulated mobility models.
As shown in Figure 7, the coverage rate of the overlap-avoidance scheme in each model shows slightly higher than each model without considering overlap avoidance. In Figure 8, we measured 80%- and 90%-coverage reaching time of both the proposed models and the previous models to verify the performance. Among those models, the performance of EGM with overlap avoidance model has improved the most. The 80%- and 90%-coverage reaching times are improved by 11.8% and 19.2%, respectively. That is, as UAVs are decentralized by avoiding overlap, they fly to areas which are not reconnoitered. On the contrary, the performance improvement of the DPR model is the lowest at 10.8% among overlap avoidance models in terms of 90% reaching time. Since the previous model attempts to avoid scanned areas based on local information, there is not much performance improvement although overlap avoidance scheme is included. Figure 7 and Figure 8 show that each random mobility model can be improved by applying the proposed overlap avoidance scheme.
In addition, we analyzed the effect of overlap avoidance in each mobility model by monitoring UAVs’ movements during the simulations. When two or more UAVs meet in the same region, they turn to other directions in the proposed models. The following are further analyses of each model.
  • Random Waypoint model: While the proposed scheme improves the RW model, it still has the same limitation as in the RW model itself. The overlap-avoidance model decides a destination randomly on the guidance line. Thus, the model still tends to reconnoiter the center area.
  • Random Markov Process model: The main problem of the RMP model is hovering sometimes due to higher turning probability in one direction as in Table 2. However, the proposed overlap-avoidance scheme shows the side-effect of breaking hovering of a UAV by guiding to some direction caused by the overlap avoidance.
  • Enhanced Gauss–Markov model: As we apply the overlap-avoidance scheme in the EGM model, UAVs turn to other directions when two or more UAVs meet in the center. Thus, the coverage rate is improved.
  • Distributed Pheromone Repel model: When two UAVs in the DPR model meet towards a same direction, they share almost the same pheromone information which induce both UAVs to fly to similar paths with much overlap. However, the DPR model with overlap avoidance scheme prevents those movements.
The measurement of coverage rate in Figure 7 does not distinguish how many times an area is scanned or how often an area is visited. As long as a UAV reconnoiters an area once, the area is regarded as covered during the reconnaissance for two hours. Thus, we define the interval coverage rate for a certain period (e.g., 10 min). This metric will be useful to indicate the amount of coverage for a certain time period.
Figure 9 shows the interval coverage rates of simulated models for 10 min. That is, the rates indicate how much the whole area is scanned for recent 10 min. As shown in Figure 9, the proposed overlap-avoidance schemes improves the interval coverage rate about 5%.

4.2. Overlapped Area

We measure the overlapped area to evaluate how much overlapped reconnaissances of each model occurred during the simulation. When a unit region is scanned by two or more UAVs at the same time, we cumulatively add the unit region. Figure 10 shows the result of the total overlapped area with the existing models and the proposed models. As shown in Figure 10, the overlapped area is reduced from five times to twenty times less than the previous schemes by applying the proposed overlap avoidance method.
Among the proposed models, the RW with overlap avoidance model shows the smallest overlapped area because it turns the directions to other ways deterministically. On the contrary, the other three models adjust their action probabilities. In the DPR model with overlap avoidance, the pheromone information still affects to the action probabilities, which results in more overlapped area than other overlap-avoidance schemes.
While the proposed avoidance schemes guide UAVs not to reconnoiter the same area, it also prohibits collision of UAVs. During our simulations, the proposed overlap-avoidance models show no collision. However, the simulations of previous models sometimes show two UAVs meeting at a point which implies collision of the UAVs. That is, the proposed avoidance scheme prohibits collision of UAVs as well.

4.3. Inter-Arrival Time

We also measure the average inter-arrival time of two consecutive visitings to a unit region in order to analyze whether UAVs reconnoiter the area uniformly or not. Table 6 shows the average inter-arrival times and scanned coverage rates of the simulated models. As shown in Table 6, the mobility models with overlap avoidance provide shorter inter-arrival time than those without overlap avoidance. Since the total scan coverage rate is more than the previous models, the overlap avoidance schemes seem to visit each unit region more frequently with covering more area.
Among simulated mobility models, the DPR model with overlap avoidance shows the best performance. Since UAVs communicate with each other to share pheromone information, they can be guided to unreconnoitered places with consideration of overlap avoidance.
Figure 11 illustrates the number of unit regions for each inter-arrival time from 1 to 900 s. Red dotted lines are existing models without overlap avoidance and blue solid lines are those with overlap avoidance. As shown in Figure 11, previous models have many regions with shorter inter-arrival time. This implies many regions are scanned almost at the same time which is inefficient for reconnaissance applications. On the contrary, the proposed schemes reduce not only the overlapped reconnaissance, but also the number of regions with shorter inter-arrival time. Let us see the much gap between red dotted lines and blue lines in the beginnings of the graphs.

5. Conclusions

5.1. Discussion

  • Communication interference: The node’s transmission activity may cause interference to all receiving nodes in its communication range, which can affect the entire nodes. A large communication volume of the node forms a strong interference area around the node, which impacts on communication activity of adjacent nodes. For example, in [26], they introduced a method of multi-UAVs target tracking with consideration of the communication interference and the propagation loss. Thus, we need more analysis of the effect of overlap avoidance scheme to the communication interference problem.
  • Heterogeneous altitudes: In this paper, we assume the UAV altitude is fixed. If the altitudes are different between UAVs, the collision can be avoided. However, the overlapped reconnaissance problem still exists. One modification in the proposed schemes is to consider different scan ranges caused by different altitudes of UAVs at the time of detecting overlapping of their protected zones.
  • Taking shift: In order to support long-time reconnaissance, UAVs should take shift due to some reasons such as battery replacement or malfunction. When a UAV returns to the ground station, it flies straight to the station without using the mobility models. During the return, the UAV does not apply the overlap avoidance scheme. Instead, other UAVs on reconnaissance mission use the overlap avoidance scheme if they overlap with the returning UAV. In the case of DPR model, the returned UAV may give its pheromone information to the other replaced UAV.
  • Useful scenario: As UAVs mainly explore the central part of the scanning area in RW model, it is efficient when an intensive reconnaissance is needed in the center area. RMP and EGM models use the current direction to determine the next direction, thus creating unpredictable movements. They are efficient in areas where targets are much distributed. In the DPR model, UAVs share pheromone information with each other, so that it is useful in the case that communication bandwidth is enough large.

5.2. Summary and Future Work

In this work, we proposed the four mobility models with overlap avoidance for reconnaissance based on multiple UAVs. The proposed models improved the performance of the scan coverage rate and scan uniformity in preventing collisions of UAVs. They are designed by applying overlap avoidance to the existing models of RW, RMP, EGM, and DPR. In the simulations, the 90%-coverage rate reaching times of RWOA, RMPOA, EGMOA, and DPROA are improved by 18.1%, 14.4%, 19.2%, and 10.6%, respectively. We also showed the balanced reconnaissance of proposed models by comparing the number of regions per inter-arrival time and average inter-arrival time. In this paper, we focused on redesigning representative mobility models by adding overlap avoidance schemes. Thus, a novel mobility model is needed to improve performance with consideration of overlap avoidance.
Our ongoing work will cover the mobility models for reconnaissance with heterogeneous UAVs. When a mission planner performs tasks, it may not have UAVs with the same specification such as camera area, maximum speed, turn radius, etc. We are planning to simulate models by assuming this scenario. Another practical issue is efficient reconnaissance of irregular area. Since the current work considers a rectangular area, we need to analyze the performance in an irregular area and design a suitable mobility model. Moreover, we are planning to design a new mobility model for reconnaissance applied with target tracking, scouting critical area, etc.

Author Contributions

Y.-i.J. and K.H.K. proposed the mobility model. Y.-i.J. implemented the model, conducted the experiments, and wrote manuscript under the supervision of K.H.K., S.L. assisted and performed model comparison experiments. All the authors have reviewed and revised final manuscript. All authors have read and agreed to the published version of the manuscript.

Acknowledgments

This work was supported partly by the Human Resources Development of the Korea Institute of Energy Technology Evaluation and Planning (KETEP) grant funded by the Ministry of Trade, Industry and Energy (No.20194030202430), and by Basic Science Research Program through the National Research Foundation of Korea (NRF) funded by the Ministry of Education (grant NRF-2018R1D1A1B07050093).

Conflicts of Interest

The authors declare no conflict of interest.

Abbreviations

The following abbreviations are used in this manuscript:
SymbolDescription
p c the center point
x c the x-coordinate of the center point
y c the y-coordinate of the center point
u i the location of a UAV
U o the set of UAVs in an overlapped area
nthe number of UAVs in U o
θ i the angle from the  u i toward central point
s t the speed of the UAV
α the weighted value between 0 and 1
s ¯ the mean speed deviation
s x t 1 the random Gaussian distributions by N ( 0 , σ 2 ) for speed
d _ d e v t the direction deviation
d t the next direction
d _ d e v ¯ the mean direction deviation
d _ d e v x t 1 the random Gaussian distributions by N ( 0 , σ 2 ) for direction
L p the number of pheromones in left scan range
C p the number of pheromones in center scan range
R p the number of pheromones in right scan range
T p the sum of L p , C p , and  R p
ψ i the angle between the current direction and the guidance vector
β L the weighted value added to straight ahead and turn right
β R the weighted value added to straight ahead and turn left

References

  1. Cheng, L.; Zhong, L.; Tian, S.; Xing, J. Task Assignment Algorithm for Road Patrol by Multiple UAVs with Multiple Bases and Rechargeable Endurance. IEEE Access 2019, 7, 144381–144397. [Google Scholar] [CrossRef]
  2. Shirani, B.; Najafi, M.; Izadi, I. Cooperative load transportation using multiple UAVs. Aerosp. Sci. Technol. 2019, 84, 158–169. [Google Scholar] [CrossRef]
  3. Zhang, Y.; Zhang, Y.; Yu, Z. A Solution for Searching and Monitoring Forest Fires Based on Multiple UAVs. In Proceedings of the 2019 International Conference on Unmanned Aircraft Systems (ICUAS), Atlanta, GA, USA, 11–14 June 2019. [Google Scholar]
  4. Lei, L.; Shiru, Q. Path Planning For Unmanned Air Vehicles Using an Improved Artificial Bee Colony Algorithm. In Proceedings of the Proceedings of the 31st Chinese Control Conference, Hefei, China, 25–27 July 2012. [Google Scholar]
  5. Zhang, C.; Zhen, Z.; Wang, D.; Li, M. UAV Path Planning Method Based on Ant Colony Optimization. In Proceedings of the 2010 Chinese Control and Decision Conference, Xuzhou, China, 26–28 May 2010. [Google Scholar]
  6. Bao, Y.; Fu, X.; Gao, X. Path Planning for Reconnaissance UAV Based on Particle Swarm Optimization. In Proceedings of the 2010 Second International Conference on Computational Intelligence and Natural Computing, Wuhan, China, 13–14 September 2010. [Google Scholar]
  7. Fan, Q.; Wang, F.; Shen, X.; Luo, D. Path Planning for a Reconnaissance UAV in Uncertain Environment. In Proceedings of the 2016 12th IEEE International Conference on Control and Automation, Kathmandu, Nepal, 1–3 June 2016. [Google Scholar]
  8. Dileep, M.V.; Seungkeun, K.; Jinyoung, S.; Hyemin, M. Receding-Horizon Trajectory Planning for Multiple UAVs Using Particle Swarm Optimization. In Proceedings of the AIAA Scitech 2019 Forum, San Diego, CA, USA, 7–11 January 2019. [Google Scholar]
  9. Yue, W.; Guan, X.; Wang, L. A Novel Searching Method Using Reinforcement Learning Scheme for Multi-UAVs in Unknown Environments. Appl. Sci. 2019, 9, 4964. [Google Scholar] [CrossRef] [Green Version]
  10. Xie, S.; Zhang, A.; Bi, W.; Tang, Y. Multi-UAV Mission Allocation under Constraint. Appl. Sci. 2019, 9, 2184. [Google Scholar] [CrossRef] [Green Version]
  11. Shao, Z.; Yan, F.; Zhou, Z.; Zhu, X. Path Planning for Multi-UAV Formation Rendezvous Based on Distributed Cooperative Particle Swarm Optimization. Appl. Sci. 2019, 9, 2621. [Google Scholar] [CrossRef] [Green Version]
  12. Kuiper, E.; Nadjm-Tehrani, S. Mobility Models for UAV Group Reconnaissance Applications. In Proceedings of the 2006 International Conference on Wireless and Mobile Communications, Bucharest, Romania, 29–31 July 2006. [Google Scholar]
  13. Kieffer, E.; Danoy, G.; Bouvry, P.; Nagih, A. Hybrid Mobility Model with Pheromones for UAV detection task. In Proceedings of the 2016 IEEE Symposium Series on Computational Intelligence, Athens, Greece, 6–9 December 2016. [Google Scholar]
  14. Atten, C.; Channouf, L.; Danoy, G.; Bouvry, P. UAV Fleet Mobility Model with Multiple Pheromones for Tracking Moving Observation Targets. In Proceedings of the 19th European Conference on the Applications of Evolutionary Computation, Porto, Portugal, 30 March–1 April 2016. [Google Scholar]
  15. Jo, Y.I.; Fathoni, M.F.; Kim, K.H. A New Mobility Model for Multi-UAVs Reconnaissance Based on Partitioned Zone. Appl. Sci. 2019, 9, 3810. [Google Scholar] [CrossRef] [Green Version]
  16. Biomo, J.M.M.; Kunz, T.; St-Hilaire, M. An Enhanced Gauss–Markov Mobility Model for Simulations of Unmanned Aerial Ad-Hoc Networks. In Proceedings of the 2014 7th IFIP Wireless and Mobile Networking Conference, Vilamoura, Portugal, 20–22 May 2014. [Google Scholar]
  17. Taua, M.C.; Lisane, B.B.; Paulo, R.F.J. Survey on Coverage Path Planning with Unmanned Aerial Vehicles. Drones 2019, 3, 4. [Google Scholar]
  18. Ivan, M.; Anival, O. Multiple UAV Cooperative Searching Operation Using Polygon Area decomposition and efficient coverage algorithms. Distrib. Auton. Robot. Syst. 2007, 6, 221–230. [Google Scholar]
  19. Bujari, A.; Calafate, C.T.; Cano, J.C.; Manzoni, P.; Palazzi, C.E.; Ronzani, D. Flying Ad-hoc Network Application Scenarios and Mobility Models. Int. J. Distrib. Sens. Netw. 2017, 13, 1550147717738192. [Google Scholar] [CrossRef] [Green Version]
  20. Bouachir, O.; Abrassart, A.; Garcia, F.; Larrieu, N. A Mobility Model for UAV Ad-Hoc Network. In Proceedings of the 2014 International Conference on Unmanned Aircraft Systems, Orlando, FL, USA, 27–30 May 2014. [Google Scholar]
  21. Wang, W.; Guan, X.; Wang, B.; Wang, Y. A Novel Mobility Model Based on Semi-Random Circular Movement in Mobile Ad-Hoc Netwroks. Inf. Sci. 2010, 180, 399–413. [Google Scholar] [CrossRef]
  22. Kanta, K.; Sunil, M.; Basant, S. A Brief Survey of Mobility Models for FANET. In Proceedings of the National Conference on Innovative Trends in Computer Science Engineering, Bahal, India, 21–22 April 2015. [Google Scholar]
  23. Johnson, D.B.; Maltz, D.A. Dynamic Source Routing in Ad Hoc Wireless Networks. In Mobile Computing; Springer: Boston, MA, USA, 1996; pp. 153–181. [Google Scholar]
  24. Liang, B.; Haas, Z.J. Predictive distance-based mobility management for PCS networks. In Proceedings of the IEEE INFOCOM ’99. Conference on Computer Communications, Eighteenth Annual Joint Conference of the IEEE Computer and Communications Societies, The Future is Now (Cat. No.99CH36320), New York, NY, USA, 21–25 March 1999; pp. 1377–1384. [Google Scholar]
  25. Pinsky, M.A.; Karlin, S. Markov Chains: Introduction. In An Introduction to Stochastic Modeling; Academic Press: Cambridge, MA, USA, 2011; pp. 79–163. [Google Scholar]
  26. Xu, B.; Dong, Z.; Jia, Z. The Multi-UAVs Cooperative Observation and Tracking Considering Communication Interference and Transmission Loss. In Proceedings of the 2016 IEEE International Conference on Aircraft Utility Systems, Beijing, China, 10–12 October 2016. [Google Scholar]
Figure 1. Overlapped reconnaissance and area: (a) An example of overlapped reconnaissance; and (b) overlapped area simulated for 7200 s.
Applsci 10 04051 g001
Figure 2. Examples of Random Waypoint model: (a) Random Waypoint model in mobile ad-hoc networks (MANET); and (b) Random Waypoint model in flying ad-hoc networks (FANET).
Applsci 10 04051 g002
Figure 3. Examples of overlap avoidance: (a) Overlap detection; (b) generating guidance lines among three UAVs; and (c) generating a guidance line between two UAVs.
Applsci 10 04051 g003
Figure 4. Examples of generating guidance vectors: (a) Two UAVs; and (b) three UAVs.
Applsci 10 04051 g004
Figure 5. Examples of changing direction: (a) Enhanced Gauss–Markov model; and (b) Enhanced Gauss–Markov with overlap avoidance model.
Applsci 10 04051 g005
Figure 6. An example of pheromone scanning pattern [12].
Applsci 10 04051 g006
Figure 7. Coverage rate results with/without Overlap Avoidance: (a) Random Waypoint; (b) Random Markov Process; (c) Enhanced Gauss–Markov; and (d) Distributed Pheromone Repel.
Applsci 10 04051 g007
Figure 8. The 80%- and 90%-coverage reaching times with/without Overlap Avoidance: (a) Random Waypoint; (b) Random Markov Process; (c) Enhanced Gauss–Markov; and (d) Distributed Pheromone Repel.
Applsci 10 04051 g008
Figure 9. The interval coverage rate results with/without Overlap Avoidance: (a) Random Waypoint; (b) Random Markov Process; (c) Enhanced Gauss–Markov; and (d) Distributed Pheromone Repel.
Applsci 10 04051 g009
Figure 10. The result of overlapped area.
Applsci 10 04051 g010
Figure 11. The number of unit regions per inter-arrival time with/without Overlap Avoidance: (a) Random Waypoint; (b) Random Markov Process; (c) Enhanced Gauss–Markov; and (d) Distributed Pheromone Repel.
Applsci 10 04051 g011
Table 1. The simple Unmanned Aerial Vehicle (UAV) model.
ParametersSpecifications
Type of aircraftFixed-wing
Rotation radius500 m
Communication range8000 m
Scan area of camera2000 × 1000 m
Flight speed150 km/h
Altitude3500 m
Table 2. UAV action table.
Next Action Probability
Current ActionTurn LeftStraight AheadTurn Right
Turn left70%30%0%
Straight ahead10%80%10%
Turn right0%30%70%
Table 3. UAV action table with direction of guidance vector.
Next Action Probability
Direction of Guidance VectorCurrent ActionTurn LeftStraight AheadTurn Right
LeftTurn left90%10%0%
Straight ahead70%30%0%
Turn right0%100%0%
RightTurn left0%100%0%
Straight ahead0%30%70%
Turn right0%10%90%
Table 4. UAV action table with pheromone.
Turn LeftStraight AheadTurn Right
T p L p 2 × T p T p C p 2 × T p T p R p 2 × T p
Table 5. Avoiding overlap action table ( β L   =   T p L p T p + L p · ψ 180 and β R   =   T p R p T p + R p · ψ 180 ).
Direction of Guidance VectorTurn LeftStraight AheadTurn Right
Left T p L p 2 × T p × ( 1 + ψ 180 ) T p C p 2 × T p × ( 1 β L ) T p R p 2 × T p × ( 1 β L )
Right T p L p 2 × T p × ( 1 β R ) T p C p 2 × T p × ( 1 β R ) T p R p 2 × T p × ( 1 + ψ 180 )
Table 6. The average inter-arrival time and scan coverage rate.
Mobility ModelAverage Inter-Arrival Time (s)Scan Coverage Rate (%)
RW222792.4
RWOA198193.6
RMP198094.9
RMPOA190897.4
EGM200796.3
EGMOA178398.2
DPR182697.7
DPROA175798.6

