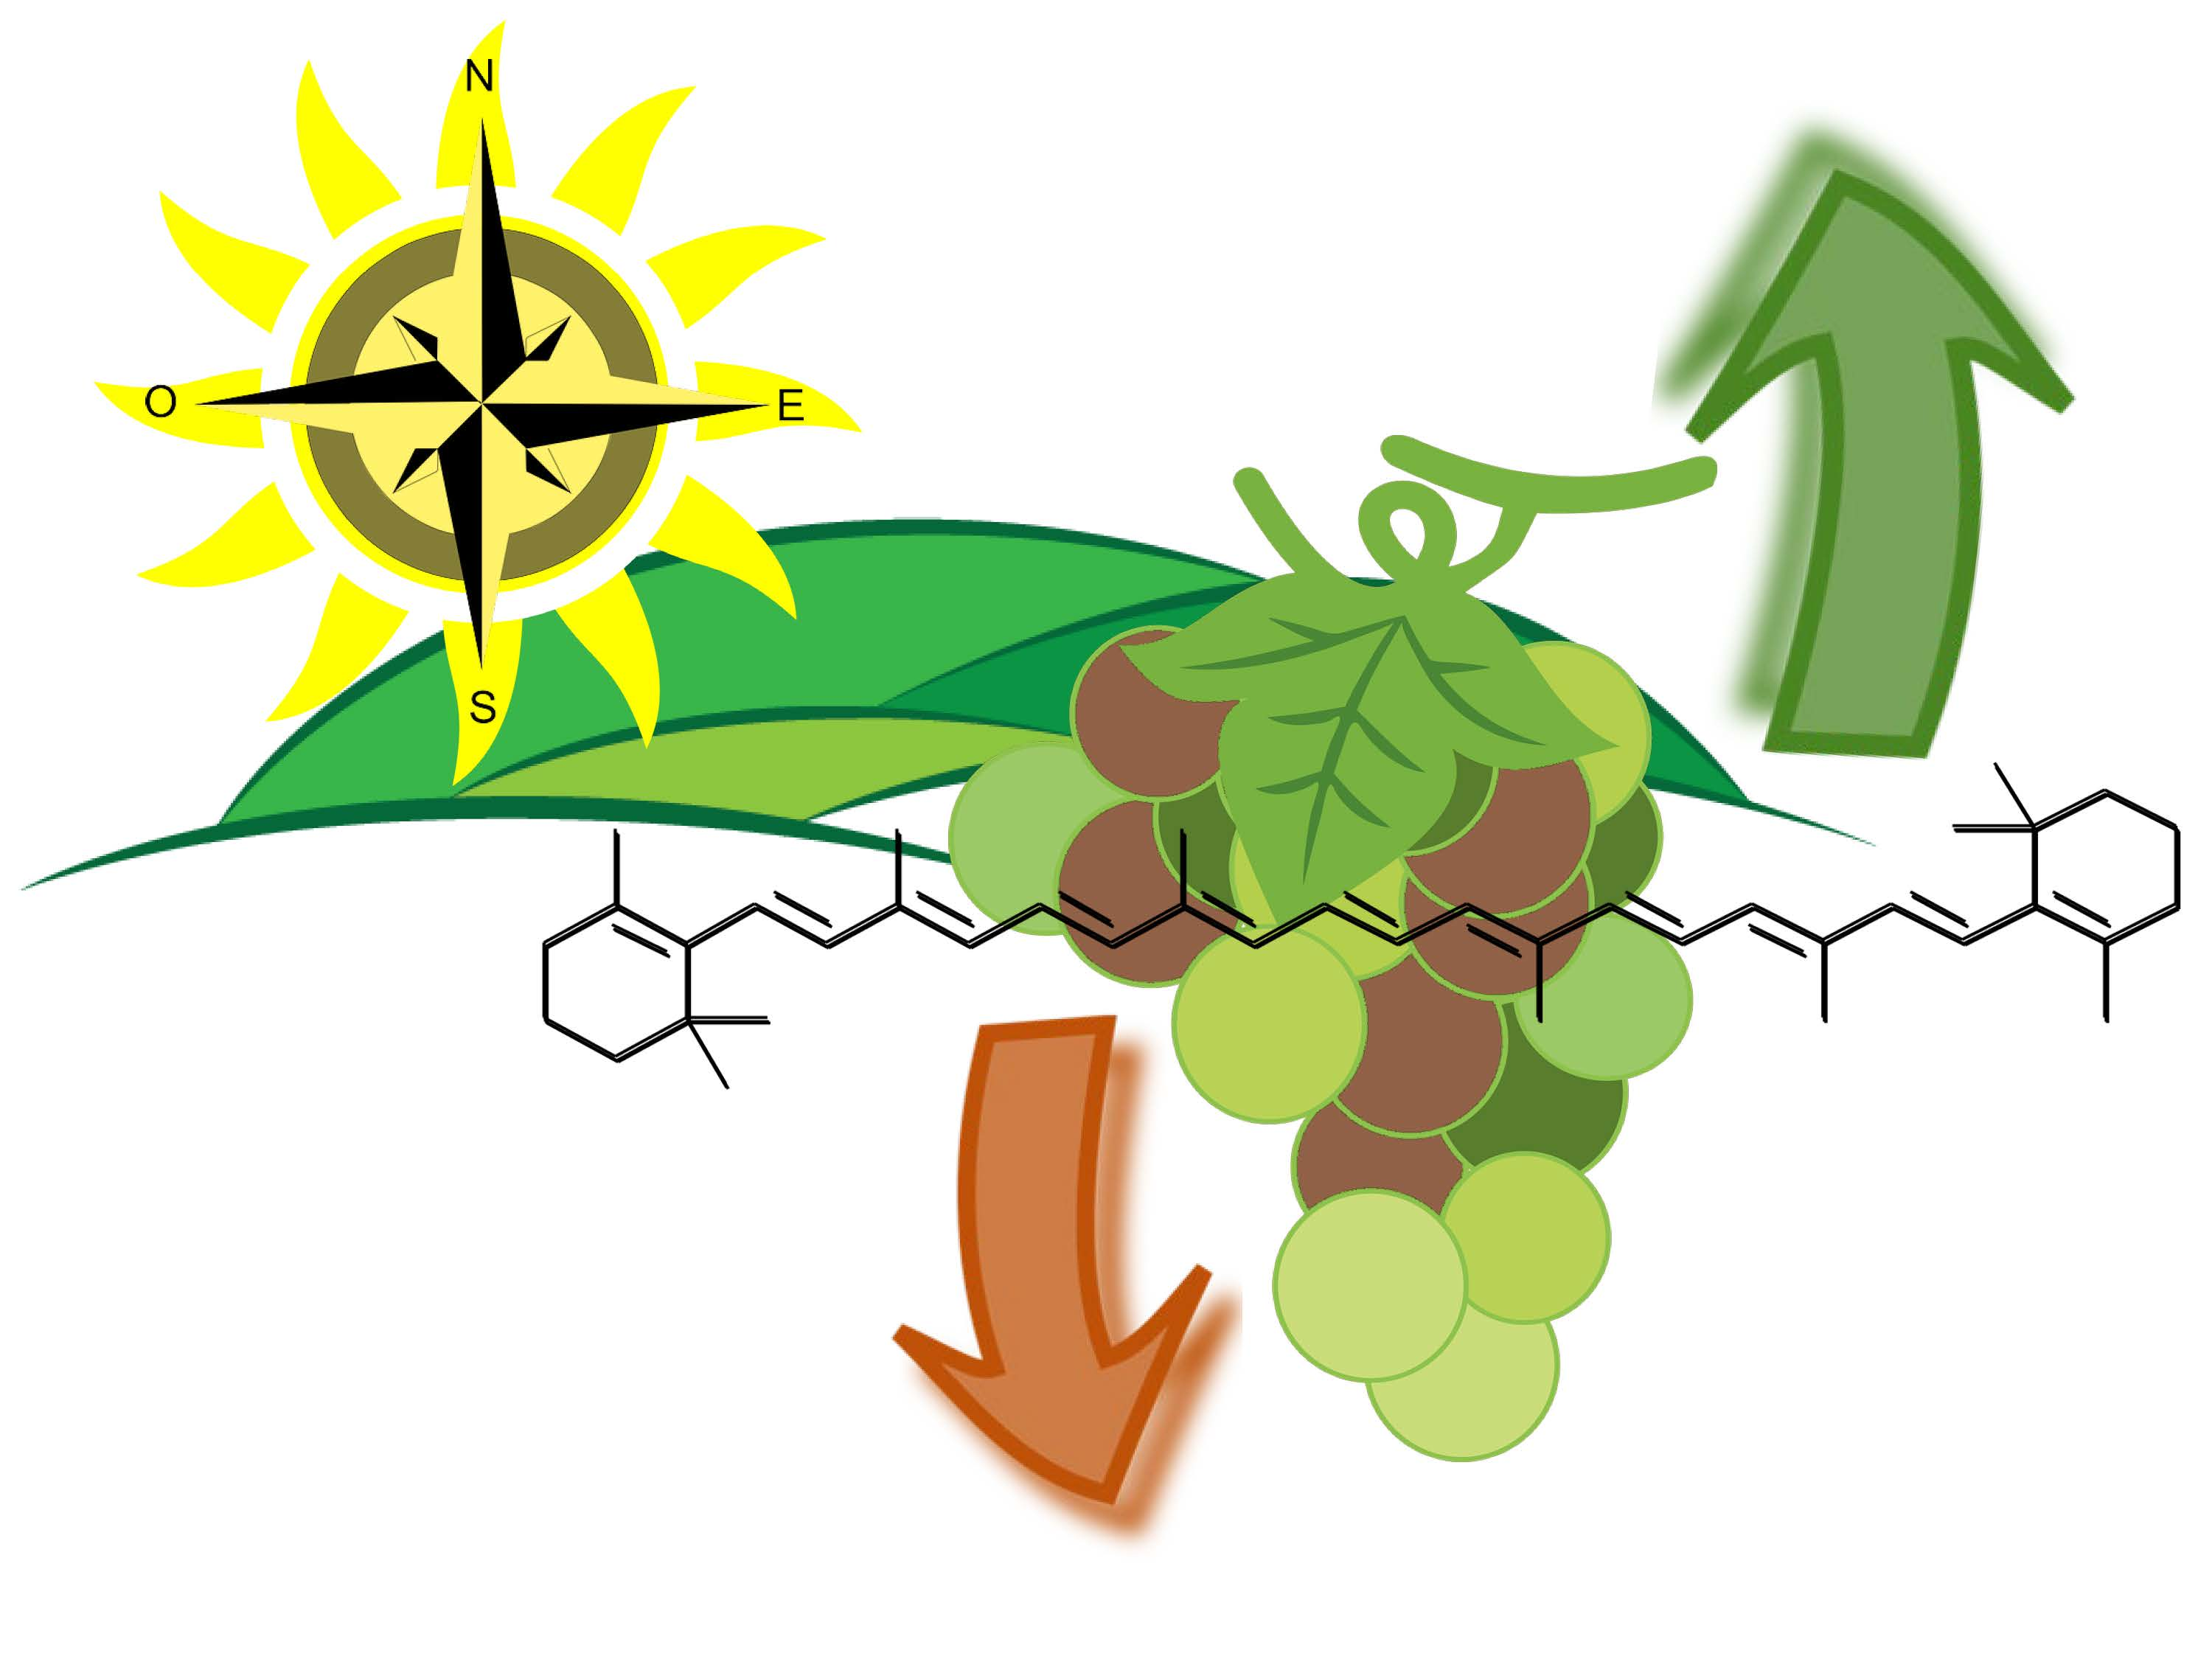
Bunch Microclimate Affects Carotenoids Evolution in cv. Nebbiolo (V. vinifera L.)


 ,
,  ,
, 
Abstract
:
1. Introduction
2. Materials and Methods
2.1. Vineyard Site and Treatments
2.2. Microclimate Assessment
2.3. Berry Sampling
2.4. Extraction and Determination of Carotenoids
2.4.1. Extraction from Grape Material
2.4.2. High Performance-Liquid Chromatography (HPLC) Determinations
2.4.3. Identification and Quantification
2.5. Statistical Analyses
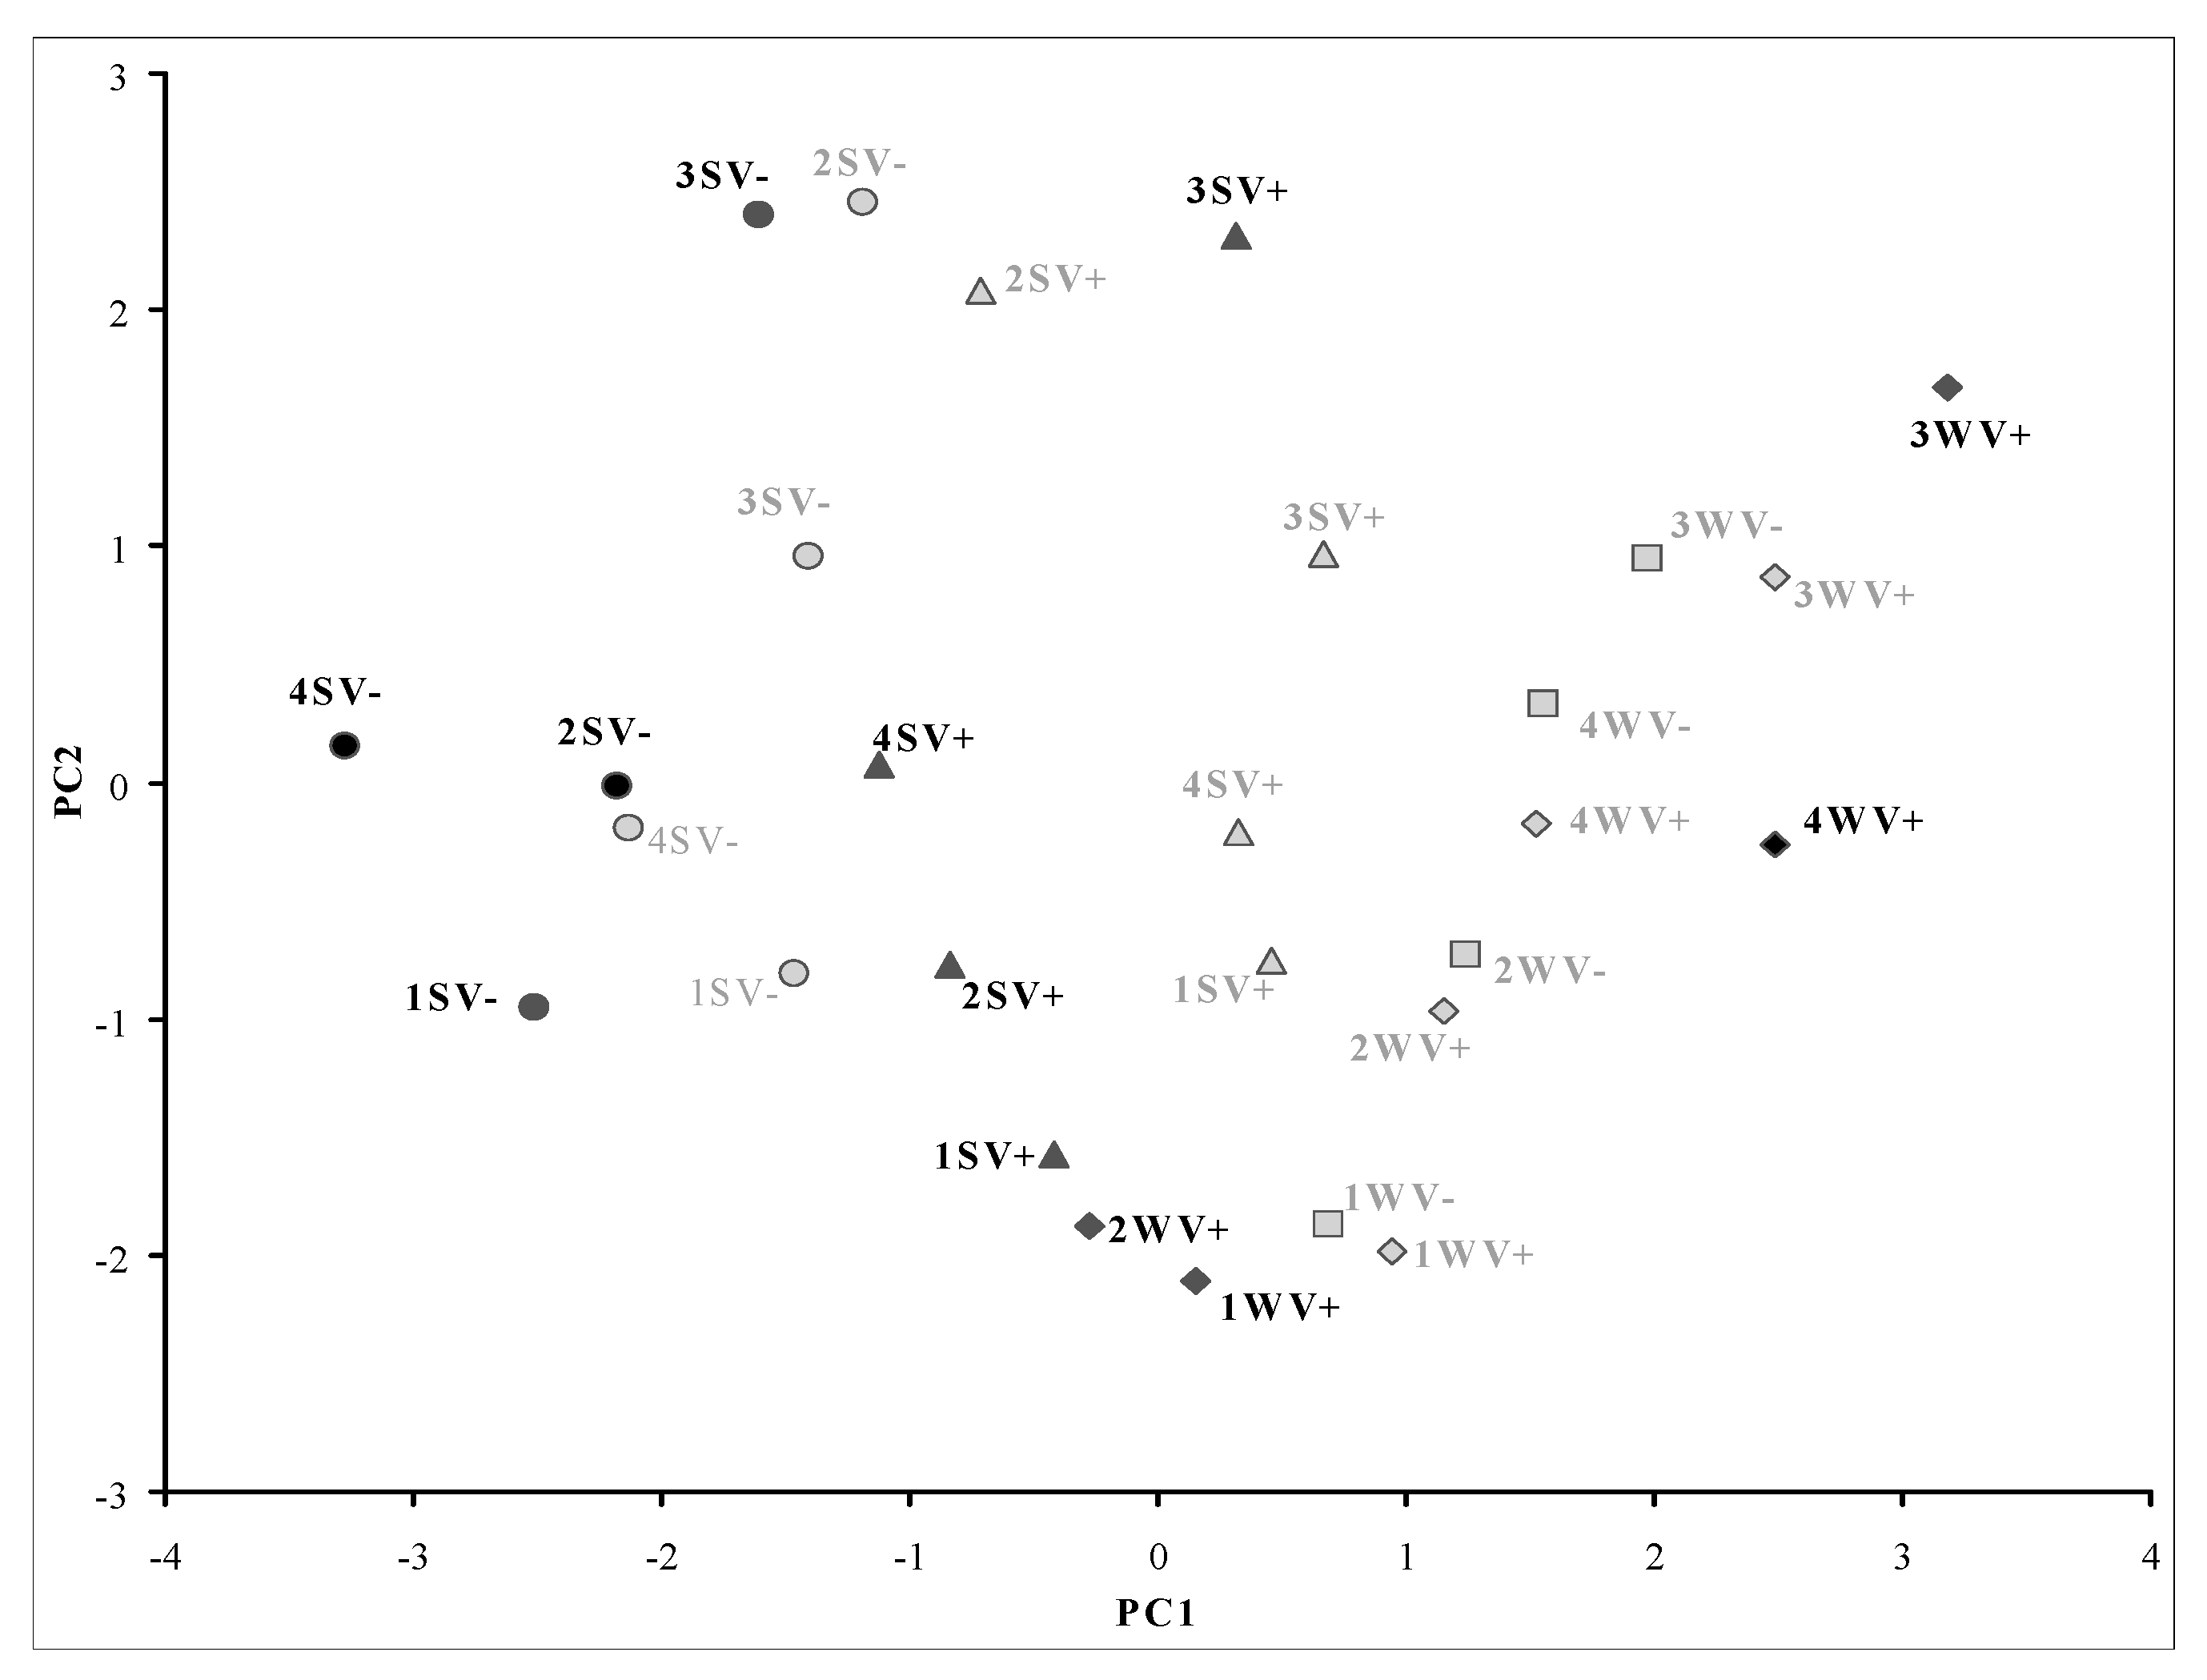
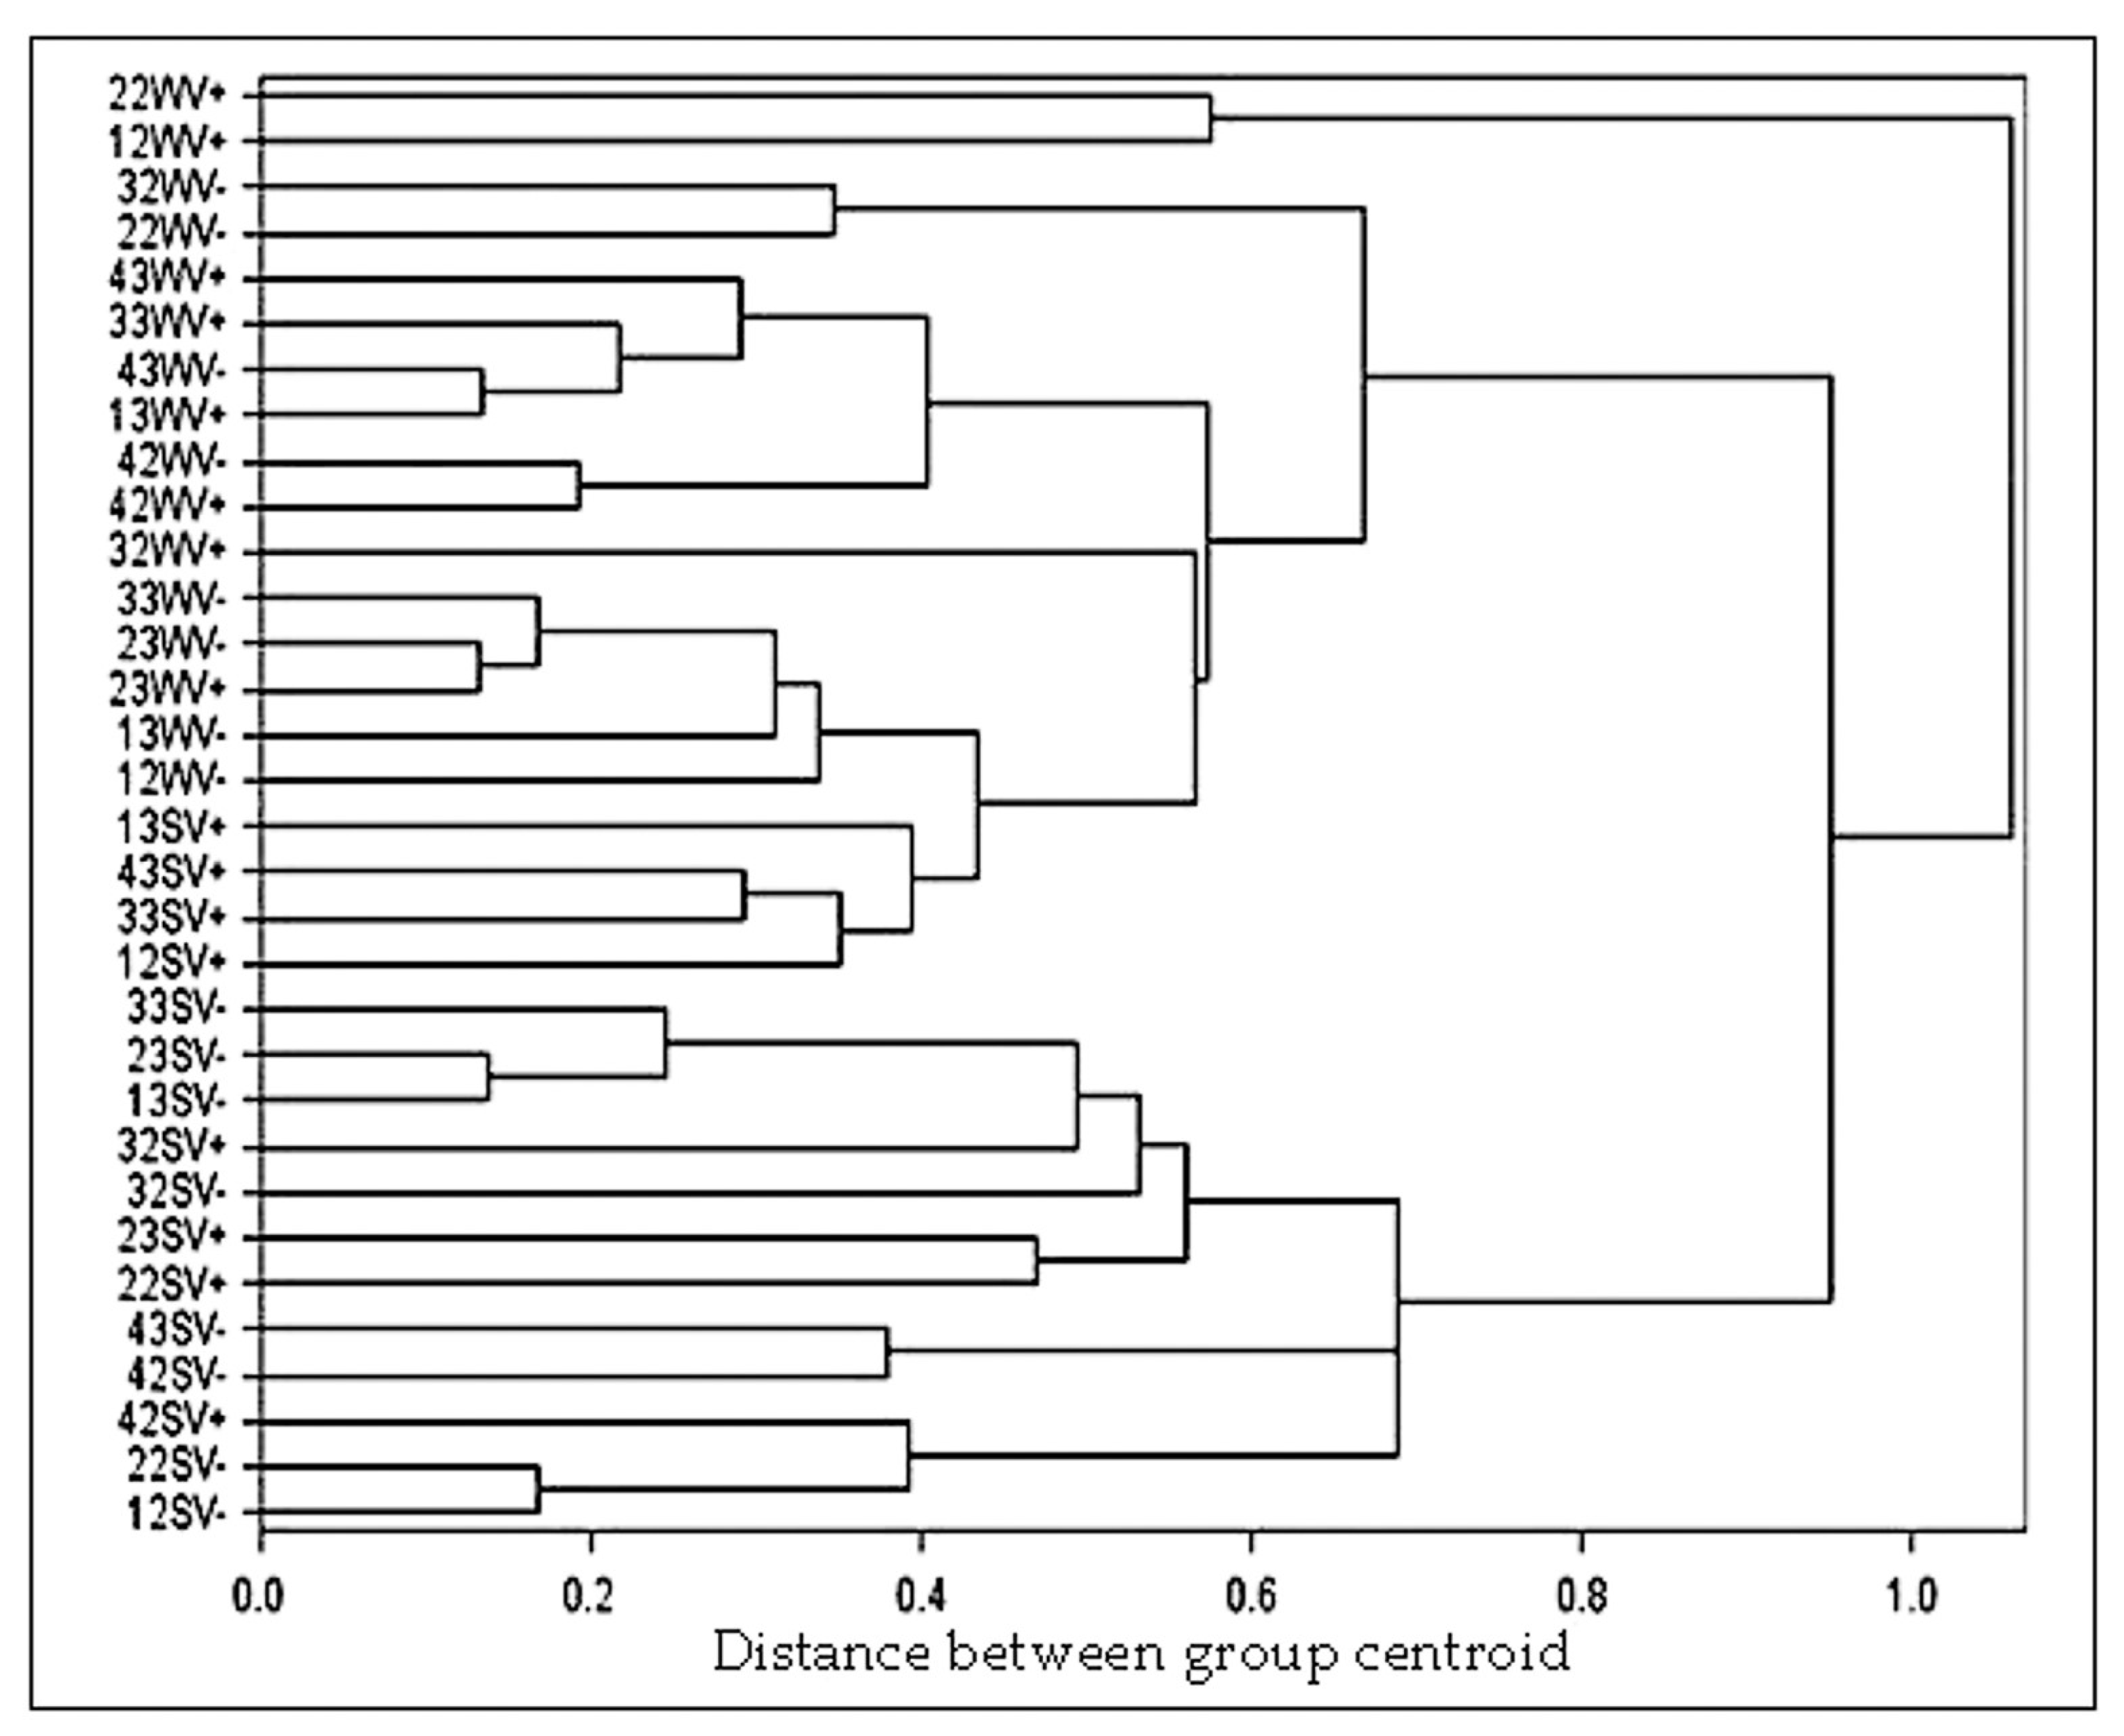
3. Results
3.1. Seasonal Meteorological Trends
3.2. Bunch Microclimate
3.3. Evolution of Carotenoids in Nebbiolo Grapes
4. Discussion
5. Conclusions
Supplementary Materials
Author Contributions
Funding
Acknowledgments
Conflicts of Interest
References
- Hirschberg, J. Carotenoid biosynthesis in flowering plants. Curr. Opin. Plant Biol. 2001, 4, 210–218. [Google Scholar] [CrossRef]
- Winterhalter, P.; Ebeler, S.E. Carotenoid cleavage products: An Introduction. In Carotenoid Cleavage Products; American Chemical Society: Washington, DC, USA, 2013; Volume 1134, pp. 3–9. ISBN 0-8412-2778-0. [Google Scholar]
- Mendes-Pinto, M.M. Carotenoid breakdown products the—norisoprenoids—in wine aroma. Arch. Biochem. Biophys. 2009, 483, 236–245. [Google Scholar] [CrossRef]
- Winterhalter, P.; Rouseff, R.L. Carotenoid-Derived Aroma Compounds; American Chemical Society: Washington, DC, USA, 2002; Volume 802. [Google Scholar]
- Skouroumounis, G.K.; Sefton, M.A. Acid-catalyzed hydrolysis of alcohols and their β-d-Glucopyranosides. J. Agric. Food Chem. 2000, 48, 2033–2039. [Google Scholar] [CrossRef] [PubMed]
- Mathieu, S.; Terrier, N.; Procureur, J.; Bigey, F.; Günata, Z. A carotenoid cleavage dioxygenase from Vitis vinifera L.: Functional characterization and expression during grape berry development in relation to C13-norisoprenoid accumulation. J. Exp. Bot. 2005, 56, 2721–2731. [Google Scholar] [CrossRef] [PubMed]
- Walter, M.H.; Strack, D. Carotenoids and their cleavage products: Biosynthesis and functions. Nat. Prod. Rep. 2011, 28, 663–692. [Google Scholar] [CrossRef] [PubMed]
- Young, P.R.; Lashbrooke, J.G.; Alexandersson, E.; Jacobson, D.; Moser, C.; Velasco, R.; Vivier, M.A. The genes and enzymes of the carotenoid metabolic pathway in Vitis vinifera L. BMC Genom. 2012, 13, 243. [Google Scholar] [CrossRef] [Green Version]
- Baumes, R. Wine Aroma Precursors. In Wine Chemistry and Biochemistry; Moreno-Arribas, M.V., Polo, M.C., Eds.; Springer: New York, NY, USA, 2009; pp. 251–274. ISBN 978-0-387-74116-1. [Google Scholar]
- Silva Ferreira, A.C.; Monteiro, J.; Oliveira, C.; Guedes de Pinho, P. Study of major aromatic compounds in port wines from carotenoid degradation. Food Chem. 2008, 110, 83–87. [Google Scholar] [CrossRef]
- Guedes de Pinho, P.; Silva Ferreira, A.C.; Mendes Pinto, M.; Benitez, J.G.; Hogg, T.A. Determination of carotenoid profiles in grapes, musts, and fortified wines from Douro varieties of Vitis vinifera. J. Agric. Food Chem. 2001, 49, 5484–5488. [Google Scholar] [CrossRef]
- Goodwin, T.W. Metabolism, nutrition, and function of carotenoids. Annu. Rev. Nutr. 1986, 6, 273–297. [Google Scholar] [CrossRef]
- Etievant, P.X. Wine. Volatile Compounds in Foods and Beverages; Maarse, H., Ed.; Marcel Dekker: New York, NY, USA, 1991; pp. 483–546. [Google Scholar]
- Baumes, R.; Wirth, J.; Bureau, S.; Gunata, Y.; Razungles, A. Biogeneration of C13-norisoprenoid compounds: Experiments supportive for an apo-carotenoid pathway in grapevines. Anal. Chim. Acta 2002, 458, 3–14. [Google Scholar] [CrossRef]
- Young, P.R.; Eyeghe-Bickong, H.A.; du Plessis, K.; Alexandersson, E.; Jacobson, D.A.; Coetzee, Z.; Deloire, A.; Vivier, M.A. Grapevine plasticity in response to an altered microclimate: Sauvignon Blanc modulates specific metabolites in response to increased berry exposure. Plant Physiol. 2016, 170, 1235–1254. [Google Scholar] [CrossRef] [Green Version]
- Ryona, I.; Sacks, G.L. Behavior of glycosylated monoterpenes, c13-norisoprenoids, and benzenoids in Vitis vinifera cv. Riesling during ripening and following hedging. In Carotenoid Cleavage Products; American Chemical Society: Washington, DC, USA, 2013; Volume 1134, pp. 109–124. ISBN 0-8412-2778-0. [Google Scholar]
- Gunata, Z. Biosynthesis of C13-Norisoprenoids in Vitis vinifera: Evidence of carotenoid cleavage dioxygenase (ccd) and secondary transformation of norisoprenoid compounds. In Carotenoid Cleavage Products; American Chemical Society: Washington, DC, USA, 2013; Volume 1134, pp. 97–107. ISBN 0-8412-2778-0. [Google Scholar]
- Razungles, A.; Bayonove, C.L.; Cordonnier, R.E.; Sapis, J.C. Grape carotenoids: Changes during the maturation period and localization in mature berries. Am. J. Enol. Vitic. 1988, 39, 44–48. [Google Scholar]
- Crupi, P.; Coletta, A.; Antonacci, D. Analysis of carotenoids in grapes to predict norisoprenoid varietal aroma of wines from Apulia. J. Agric. Food Chem. 2010, 58, 9647–9656. [Google Scholar] [CrossRef] [PubMed]
- Lutz, A.; Winterhalter, P. Bio-oxidative cleavage of carotenoids: Important route to physiological active plant constituents. Tetrahedron Lett. 1992, 33, 5169–5172. [Google Scholar] [CrossRef]
- Oliveira, C.; Silva Ferreira, A.C.; Mendes Pinto, M.; Hogg, T.; Alves, F.; Guedes de Pinho, P. Carotenoid compounds in grapes and their relationship to plant water status. J. Agric. Food Chem. 2003, 51, 5967–5971. [Google Scholar] [CrossRef]
- Gerdes, S.M.; Winterhalter, P.; Ebeler, S.E. Effect of sunlight exposure on norisoprenoid formation in White Riesling grapes. In Carotenoid-Derived Aroma Compounds; American Chemical Society: Washington, DC, USA, 2002; pp. 262–272. [Google Scholar] [CrossRef]
- Oliveira, C.; Ferreira, A.C.; Costa, P.; Guerra, J.; Guedes de Pinho, P. Effect of some viticultural parameters on the grape carotenoid profile. J. Agric. Food Chem. 2004, 52, 4178–4184. [Google Scholar] [CrossRef] [PubMed]
- Marais, J.; van Wyk, C.J.; Rapp, A. Carotenoid levels in maturing grapes as affected by climatic regions, sunlight and shade. S. Afr. J. Enol. Vitic. 1991, 12, 64–69. [Google Scholar] [CrossRef] [Green Version]
- Razungles, A.J.; Babic, I.; Sapis, J.C.; Bayonove, C.L. Particular behaviour of epoxy xanthophylls during veraison and maturation of grape. J. Agric. Food Chem. 1996, 44, 3821–3825. [Google Scholar] [CrossRef]
- Razungles, A.J.; Baumes, R.L.; Dufour, C.; Sznaper, C.N.; Bayonove, C.L. Effect of sun exposure on carotenoids and C(13)-norisoprenoid glycosides in Syrah berries (Vitis vinifera L.). Sci. Aliment. 1998, 18, 361–373. [Google Scholar]
- Schultz, H.R.; Lohnertz, O.; Bettner, W.; Balo, B.; Linsenmeier, A.; Jahnish, A.; Muller, M.; Gaubatz, B.; Varadi, G. Is grape composition affected by current levels of UV-B radiation? VITIS 1998, 37, 191–192. [Google Scholar]
- Giovanelli, G.; Brenna, O.V. Evolution of some phenolic components, carotenoids and chlorophylls during ripening of three Italian grape varieties. Eur. Food Res. Technol 2007, 225, 145–150. [Google Scholar] [CrossRef]
- Guidoni, S.; Ferrandino, A.; Novello, V. Effects of seasonal and agronomical practices on skin anthocyanin profile of Nebbiolo grapes. Am. J. Enol. Vitic. 2008, 59, 22–29. [Google Scholar]
- Guidoni, S.; Cavalletto, S.; Bartolomei, S.; Mania, E.; Gangemi, L. Microclimatic aspects in vineyards with different vigour and exposure. Progrès Agricole et Viticole 2011, 547–550. [Google Scholar]
- Asproudi, A.; Petrozziello, M.; Cavalletto, S.; Guidoni, S. Grape aroma precursors in cv. Nebbiolo as affected by vine microclimate. Food Chem. 2016, 211, 947–956. [Google Scholar] [CrossRef] [PubMed]
- Chorti, E.; Guidoni, S.; Ferrandino, A.; Novello, V. Effect of different cluster sunlight exposure levels on ripening and anthocyanin accumulation in Nebbiolo grapes. Am. J. Enol. Vitic. 2010, 61, 23–30. [Google Scholar]
- Guidoni, S.; Asproudi, A.; Mania, E.; Cavaletto, S.; Gangemi, L.; Matese, A.; Primicerio, J.; Borsa, D. Vineyard vigour, microclimate and secondary metabolites in cv Nebbiolo. Cienc Tec Vitivinic 2013, 28, 644–648. [Google Scholar]
- Crupi, P.; Milella, R.A.; Antonacci, D. Simultaneous HPLC-DAD-MS (ESI+) determination of structural and geometrical isomers of carotenoids in mature grapes. J. Mass Spectrom. 2010, 45, 971–980. [Google Scholar] [CrossRef]
- Crupi, P.; Coletta, A.; Milella, R.A.; Palmisano, G.; Baiano, A.; La Notte, E.; Antonacci, D. Carotenoid and chlorophyll-derived compounds in some wine grapes grown in Apulian region. J. Food Sci. 2010, 75, S191–S198. [Google Scholar] [CrossRef]
- Kamffer, Z.; Bindon, K.A.; Oberholster, A. Optimization of a method for the extraction and quantification of carotenoids and chlorophylls during ripening in grape berries (Vitis vinifera cv. Merlot). J. Agric. Food Chem. 2010, 58, 6578–6586. [Google Scholar] [CrossRef]
- Oliveira, C.; Barbosa, A.; Ferreira, A.C.S.; Guerra, J.; Guedes DE Pinho, P. Carotenoid profile in grapes related to aromatic compounds in wines from Douro Region. J. Food Sci. 2006, 71, S1–S7. [Google Scholar] [CrossRef]
- Razungles, A.; Bayonove, C.L.; Cordonnier, R.E.; Baumes, R.L. Etude des caroténoïdes du raisin a maturité. VITIS 1987, 26, 183–191. [Google Scholar]
- Rodriguez-Amaya, D.B.; Kimura, M.; Godoy, H.T.; Amaya-Farfan, J. Updated Brazilian database on food carotenoids: Factors affecting carotenoid composition. J. Food Compos. Anal. 2008, 21, 445–463. [Google Scholar] [CrossRef]
- Dall’Osto, L.; Lico, C.; Alric, J.; Giuliano, G.; Havaux, M.; Bassi, R. Lutein is needed for efficient chlorophyll triplet quenching in the major LHCII antenna complex of higher plants and effective photoprotection in vivo under strong light. BMC Plant. Biol. 2006, 6, 32. [Google Scholar] [CrossRef] [Green Version]
- Bureau, S.M.; Razungles, A.J.; Baumes, R.L.; Bayonove, C.L. Effect of vine or bunch shading on the carotenoid composition in Vitis vinifera L. berries. I. Syrah grapes. Wein-Wissenschaft 1998, 53, 64–71. [Google Scholar]
- Bindon, K.A.; Dry, P.R.; Loveys, B.R. Influence of plant water status on the production of c13-norisoprenoid precursors in Vitis vinifera L. Cv. Cabernet sauvignon grape berries. J. Agric. Food Chem. 2007, 55, 4493–4500. [Google Scholar] [CrossRef]


| Compound | k′ | λmax (nm) | % (III/II) a |
|---|---|---|---|
| (9′ Z)-Neoxanthin | 4.38 | 414; 436; 464 | |
| (all-E)-Lutein | 7.23 | (422); 445; 472 | 42 |
| β-Apo-8′-carotenal | 9.28 | 460 | |
| β-Carotene | 11.82 | (428); 452; 478 | 25 |
| Tmax Mean (°C) | Tmin Mean (°C) | Average of the Monthly Maximum Values of Tmax (°C) | Total Rainfall (mm) | Growing Degree Days (Base 10 °C) | Days with T > 30 °C (Number) | Rainy Days1 (Number) | |
|---|---|---|---|---|---|---|---|
| Annual Values | |||||||
| 2012 | 20.4 | 8.9 | 28.3 | 722 | 2329 | 78 | 63 |
| 2013 | 19.4 | 8.6 | 25.6 | 971 | 2119 | 66 | 83 |
| Values of April–October Period | |||||||
| 2012 | 26.0 | 13.8 | 32.2 | 491 | 2147 | 78 | 36 |
| 2013 | 25.6 | 13.4 | 31.8 | 563 | 2046 | 66 | 49 |
| Treatment | SDs Celsius (°C) | NHs Number of Hours NHT Number of Hours NHT | ST:SPAR | |||||
|---|---|---|---|---|---|---|---|---|
| 15–25 | 25–35 | ≥35 | 15–25 | 25–35 | ≥35 | |||
| 2012 | SouthV− | −0.54 a | 0.18 a | 0.12 a | −1.20 a | 0.50 a | 0.58 a | −0.56 a |
| SouthV+ | −0.10 ab | −0.06 a | −0.05 a | −0.37 b | −0.02 a | 0.20 a | −0.18 b | |
| WestV− | 0.40 b | 0.22 a | −0.43 a | 0.78 c | 0.45 a | −1.05 a | 0.29 c | |
| WestV+ | 0.23 b | −0.34 a | 0.36 a | 0.80 c | −0.92 a | 0.27 a | 0.44 c | |
| *** | ns | ns | *** | ns | ns | *** | ||
| 2013 | SouthV− | −0.59 a | −0.23 a | 0.66 c | −0.59 a | −0.34 a | 0.63 c | −0.59 b |
| SouthV+ | 0.03 b | 0.28 a | −0.07 b | −0.08 b | 0.12 a | −0.01 b | −0.22 b | |
| WestV− | 0.23 b | 0.22 a | −0.34 a | 0.29 b | 0.28 a | −0.37 a | 0.40 c | |
| WestV+ | 0.32 b | −0.27 a | −0.24 ab | 0.37 b | −0.06 a | −0.26 a | 0.41 c | |
| *** | ns | *** | *** | ns | *** | *** | ||
| Treatment | *** | ns | *** | *** | ns | *** | *** | |
| Year | ns | ns | ns | ns | ns | ns | ns | |
| Year*Treatment | ns | ns | *** | *** | ns | ns | ns | |
| Year | Treatment | 2012 | 2013 | |||||||||||
|---|---|---|---|---|---|---|---|---|---|---|---|---|---|---|
| Sampling Date | 12 Jun | 31 Jul | 27 Aug | 5 Oct | sig. § | 22 Jul | 21 Aug | 9 Sep | 15 Oct | sig. § sig. § | ||||
| Phenological Phase | 24dbV | 5dbV | 22dpV | 60dpV | date | 25dbV | 5dpV | 24dpV | 60dpV | date | T | Y | Y*T | |
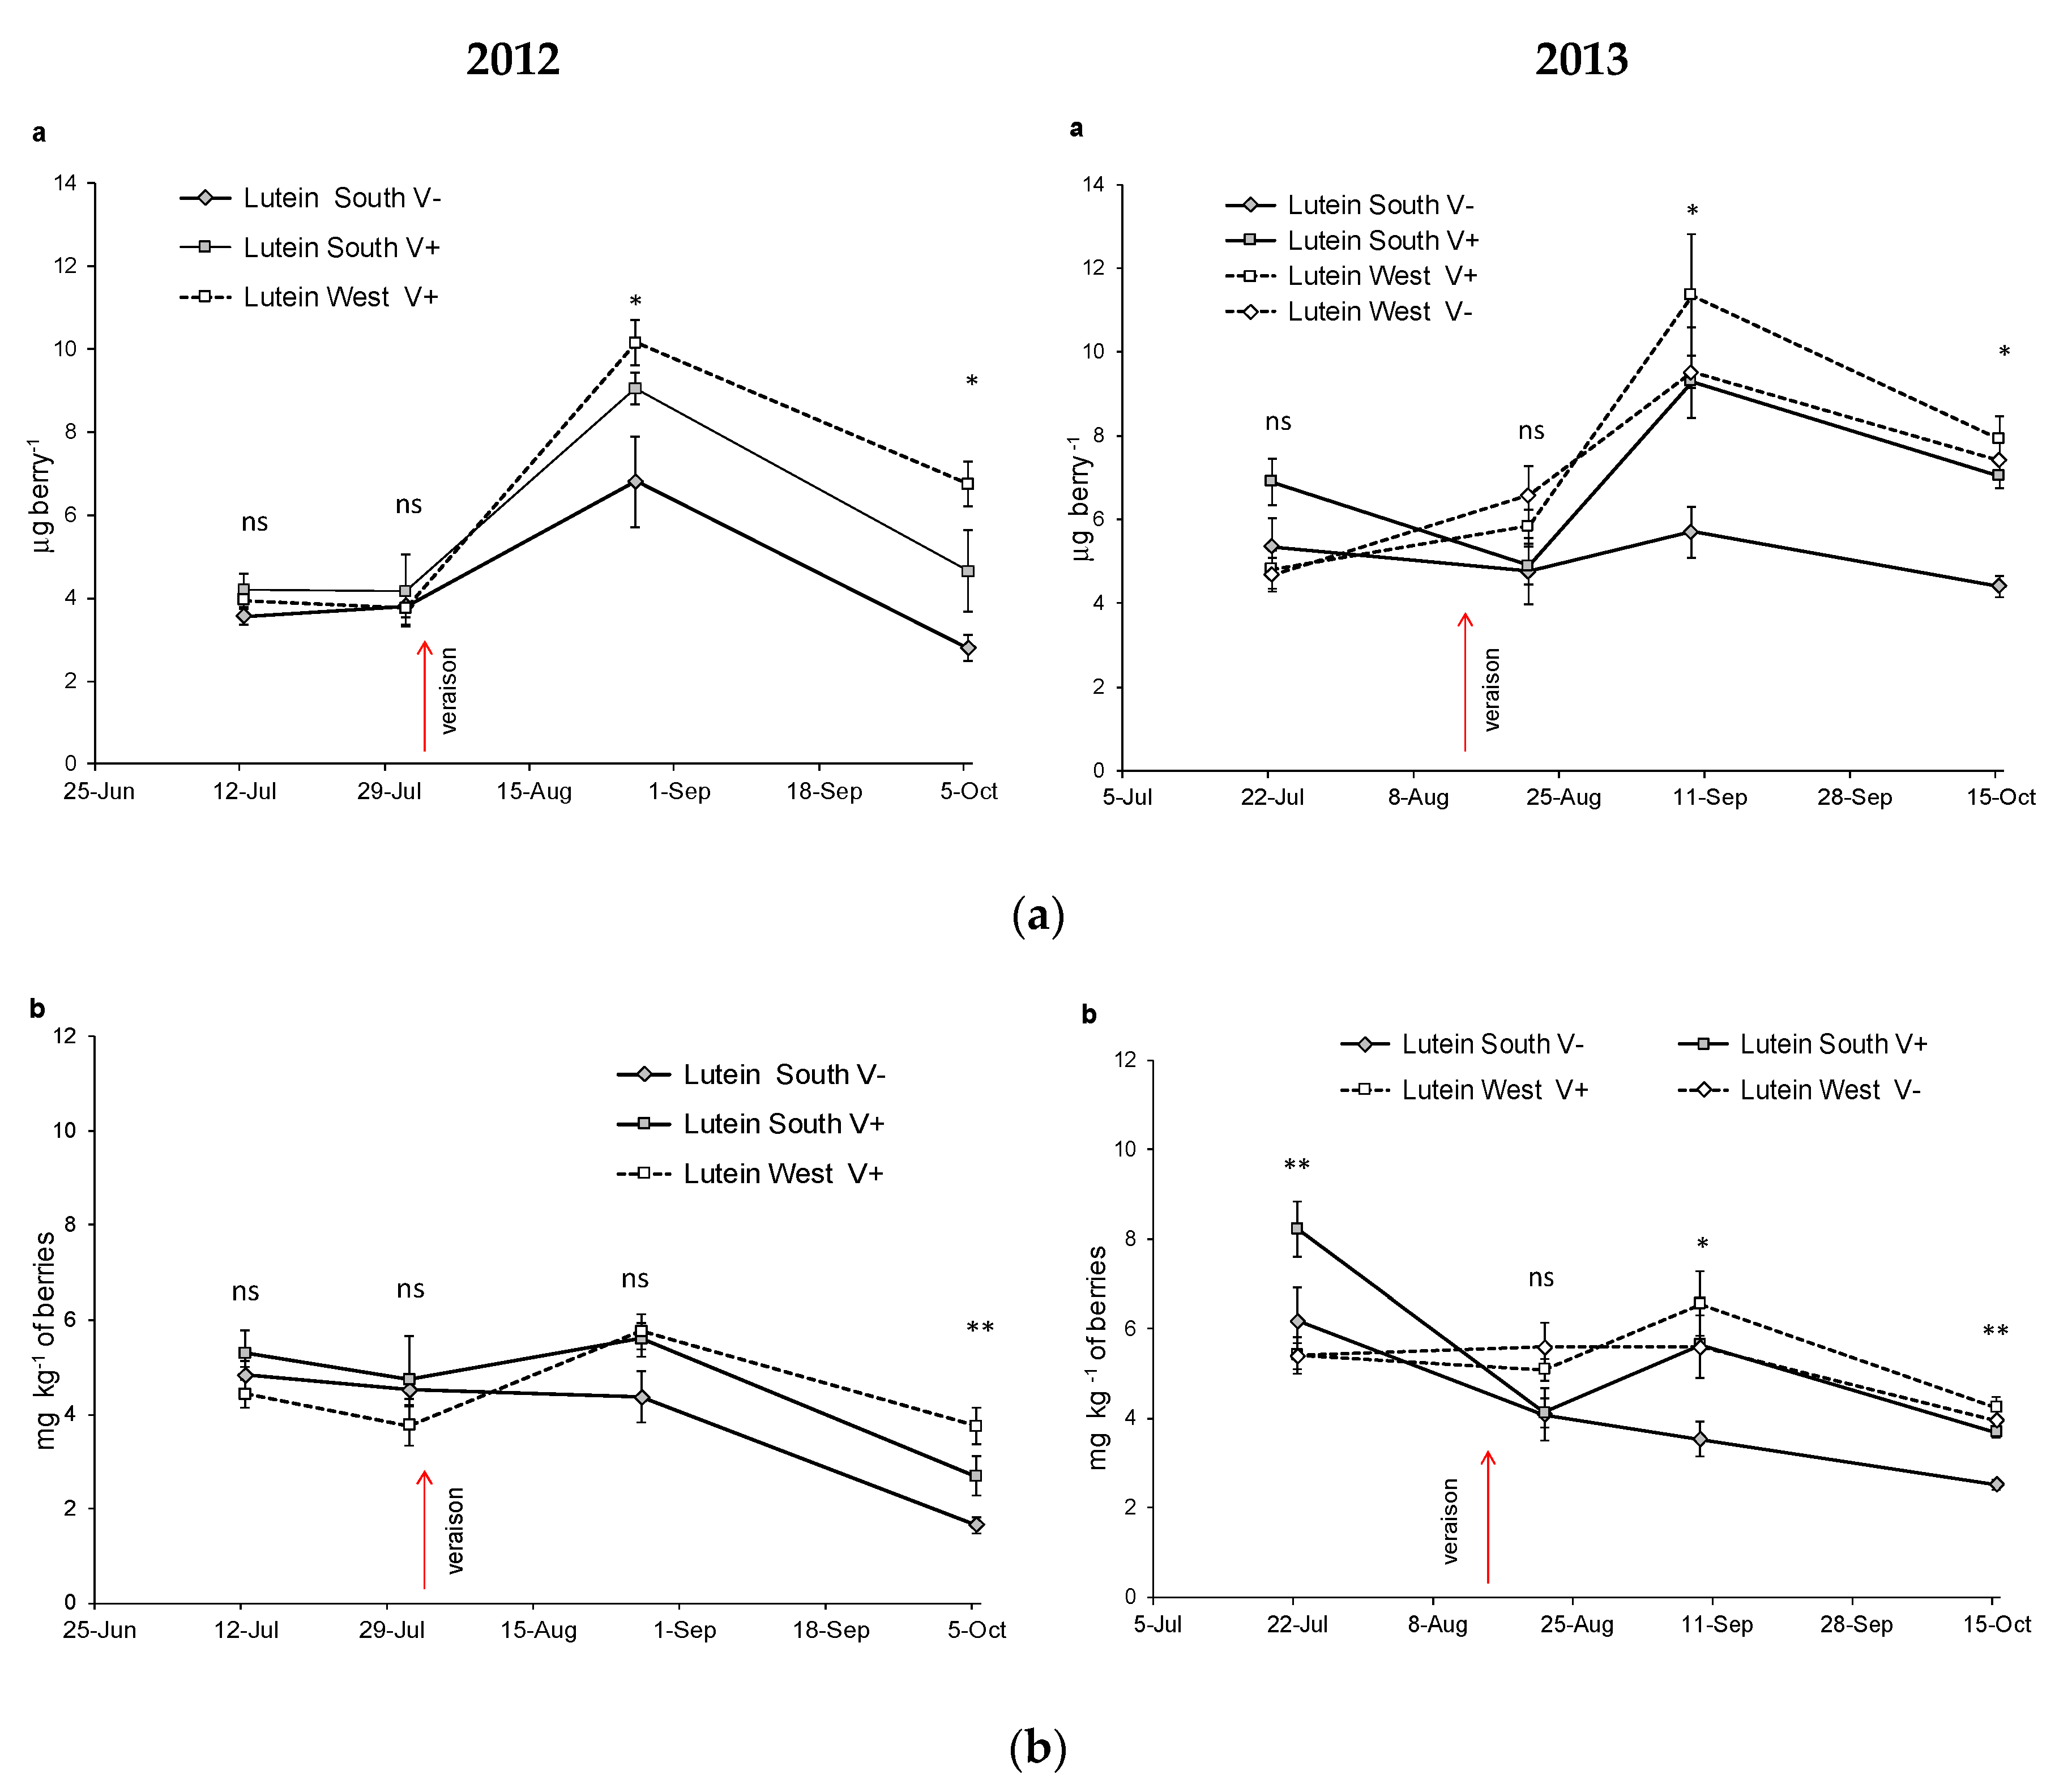
| Lutein mg kg−1 | SouthV− | 4.84b | 4.52b | 4.37b | 1.65a | ** | 6.19b | 4.09a | 3.53a | 2.52a | * | |||
| SouthV+ | 5.29b | 4.73b | 5.60b | 2.68a | * | 9.69b | 4.13a | 5.64a | 3.70a | * | *** | *** | ns | |
| WestV− | - | - | - | - | 5.39a | 5.60a | 5.59a | 3.95a | ns | |||||
| WestV+ | 4.42ab | 3.76a | 5.76b | 3.75a | ** | 5.41ab | 5.09ab | 6.55b | 4.25a | * | ||||
| Sig. among treat. | ns | ns | ns | * | ** | ns | * | ** | ||||||
| Lutein μg berry−1 | SouthV− | 3.56a | 3.81a | 6.80 b | 2.78a | ** | 5.35a | 4.76a | 5.70a | 4.40a | ns | |||
| SouthV+ | 4.21a | 4.18a | 9.07b | 4.66a | ** | 6.90b | 4.89a | 9.30c | 7.04b | ** | *** | *** | ns | |
| WestV− | - | - | - | - | 4.68a | 6.58ab | 9.51b | 7.41ab | ** | |||||
| WestV+ | 3.94a | 3.76a | 10.1c | 6.75b | ** | 4.80a | 5.84a | 11.3b | 7.91ab | * | ||||
| Sig. among treat. | ns | ns | * | * | ns | ns | * | ** | ||||||
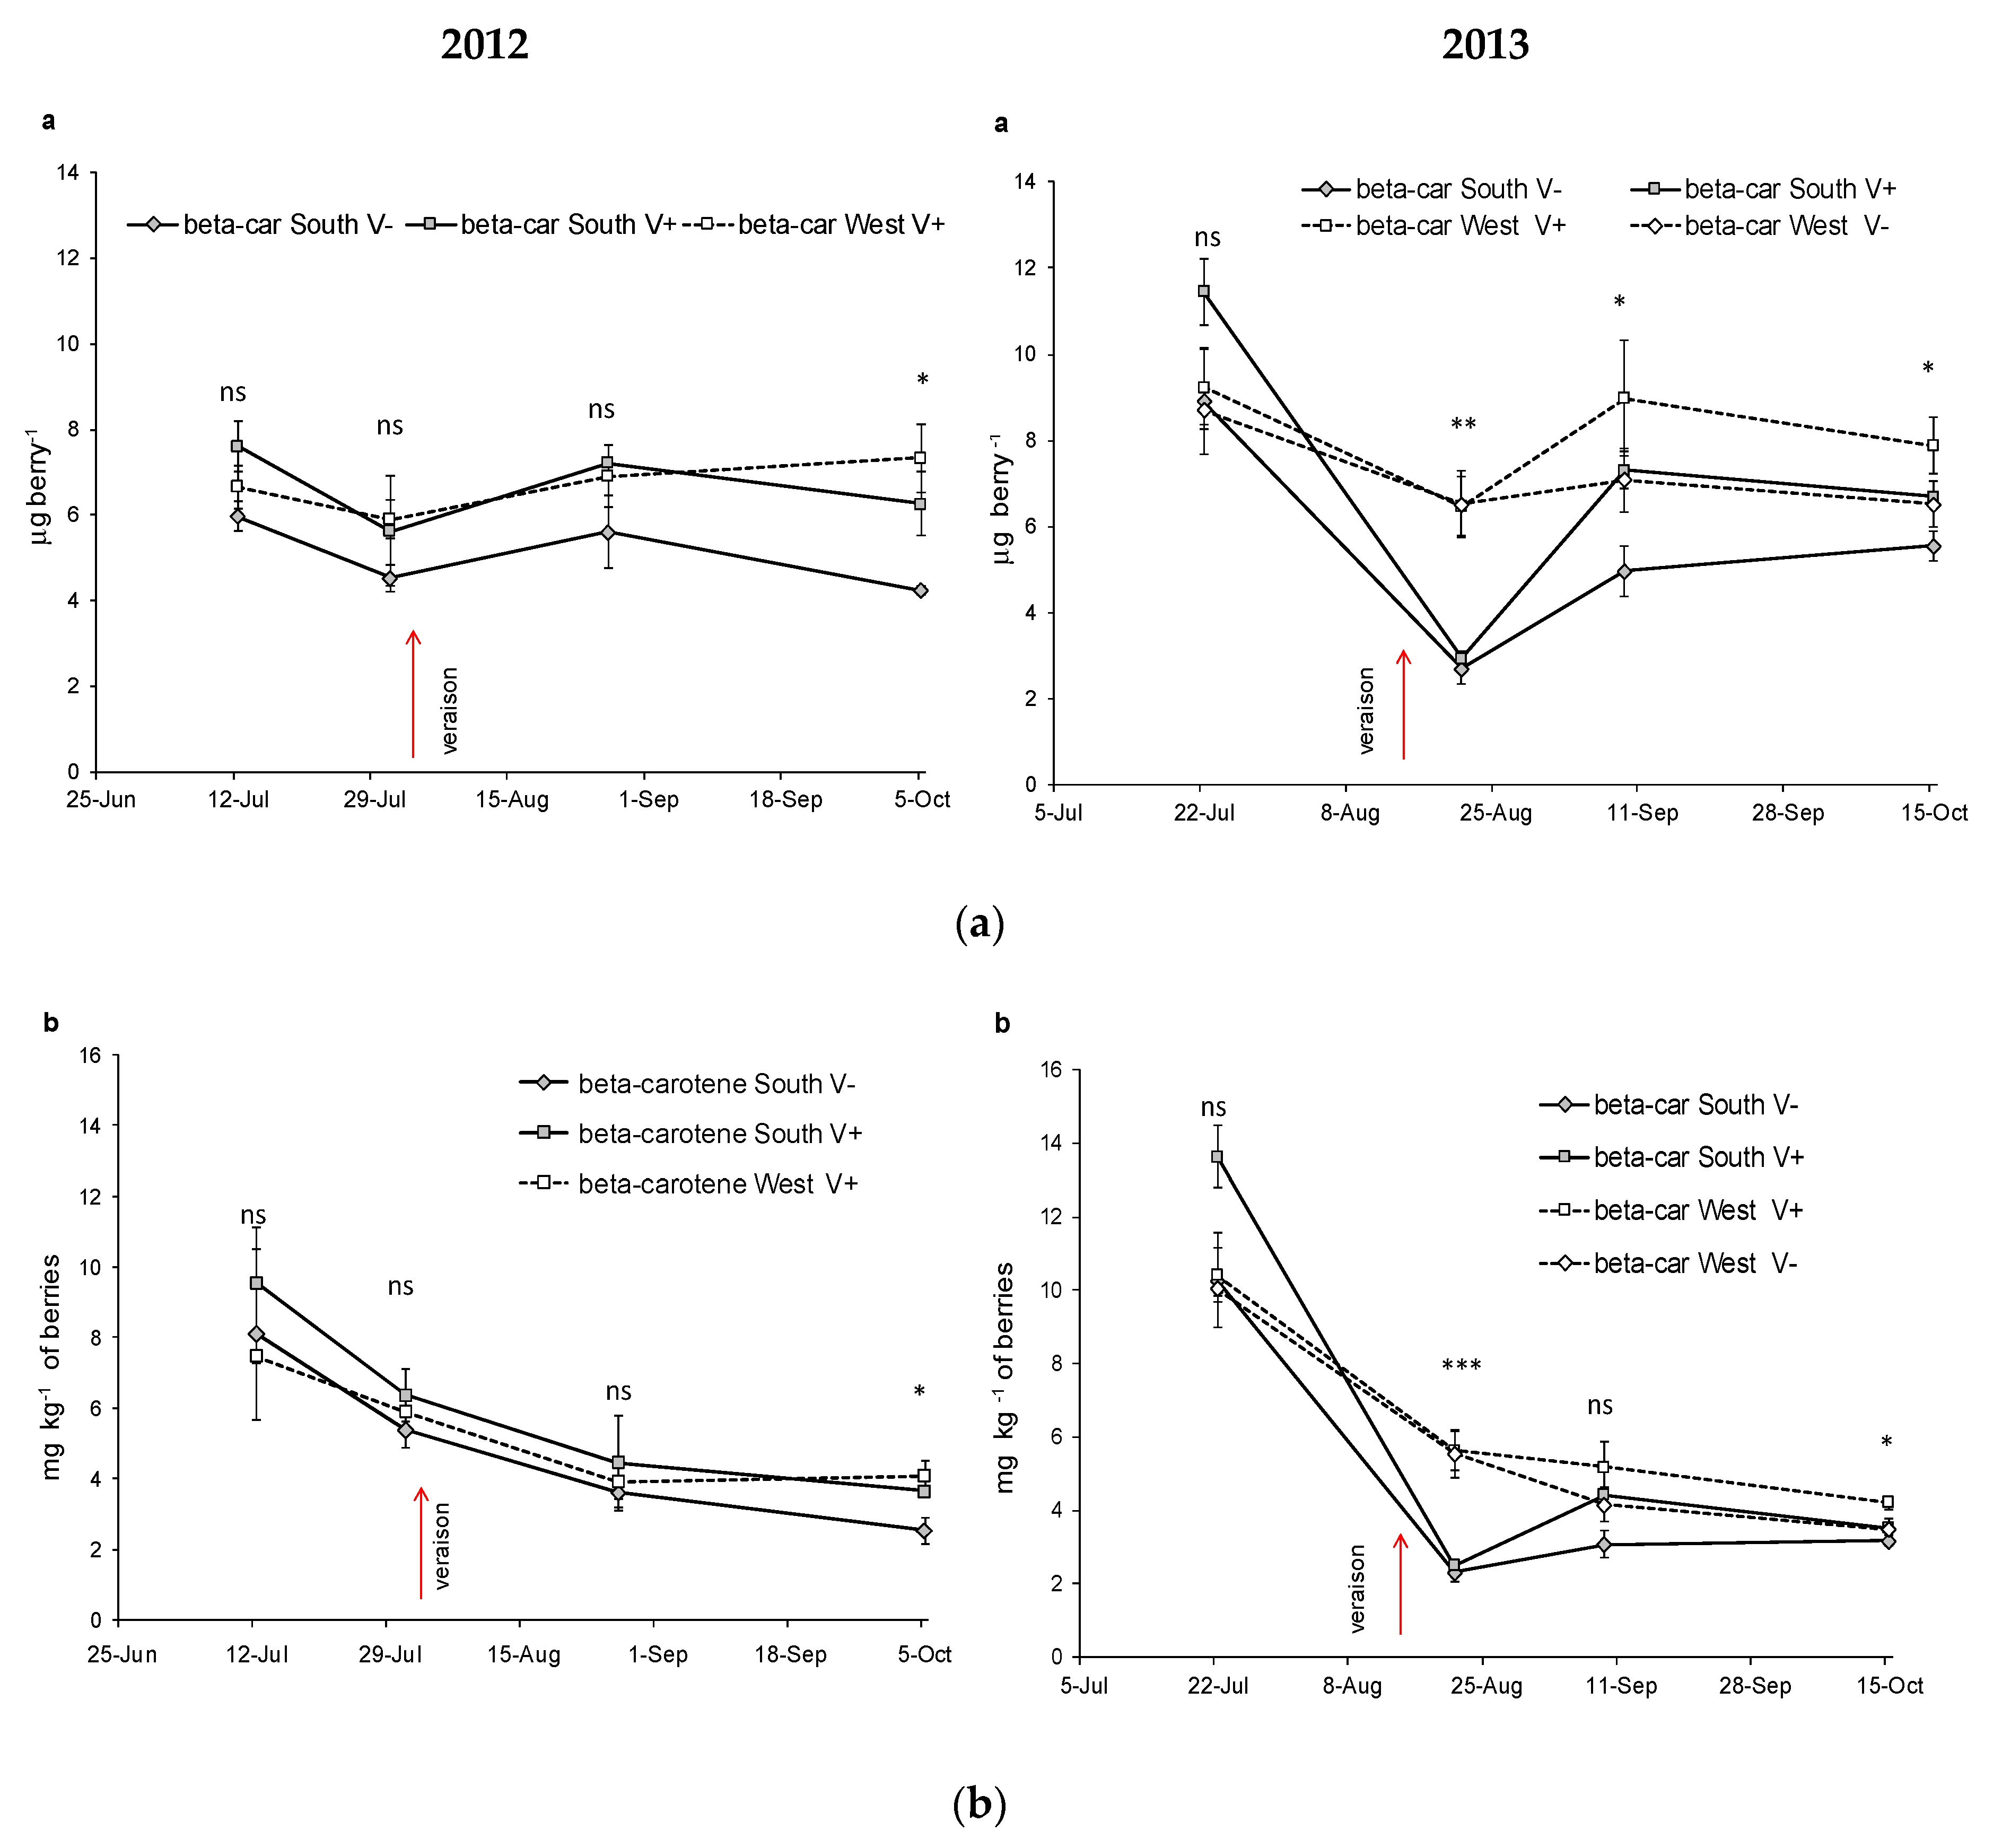
| β-carotene mg kg−1 | SouthV− | 8.11b | 5.37ab | 3.60a | 2.53a | ** | 10.3b | 2.32a | 3.08a | 3.18a | ** | |||
| SouthV+ | 9.57b | 6.37ab | 4.46a | 3.64a | ** | 13.7c | 2.49a | 4.43b | 3.51ab | ** | *** | ns | ns | |
| WestV− | 10.1c | 5.55b | 4.17ab | 3.48a | ** | |||||||||
| WestV+ | 7.47b | 5.91ab | 3.92a | 4.07a | ** | 10.4b | 5.64a | 5.18a | 4.22a | ** | ||||
| Sig. among T | ns | ns | ns | * | ns | *** | ns | * | ||||||
| β-carotene μg berry−1 | SouthV− | 5.97a | 4.53a | 5.61a | 4.24a | ns | 8.91b | 2.70a | 4.97a | 5.56a | ** | |||
| SouthV+ | 7.61a | 5.63a | 7.21a | 6.26a | ns | 11.4c | 2.95a | 7.31b | 6.70ab | ** | *** | ** | ns | |
| estV− | - | - | - | - | 8.70a | 6.52a | 7.08a | 6.52a | ns | |||||
| WestV+ | 6.66a | 5.91a | 6.91a | 7.33a | ns | 9.24a | 6.47a | 8.98a | 7.88a | ns | ||||
| Sig. among T | ns | ns | ns | * | ns | ** | * | * | ||||||
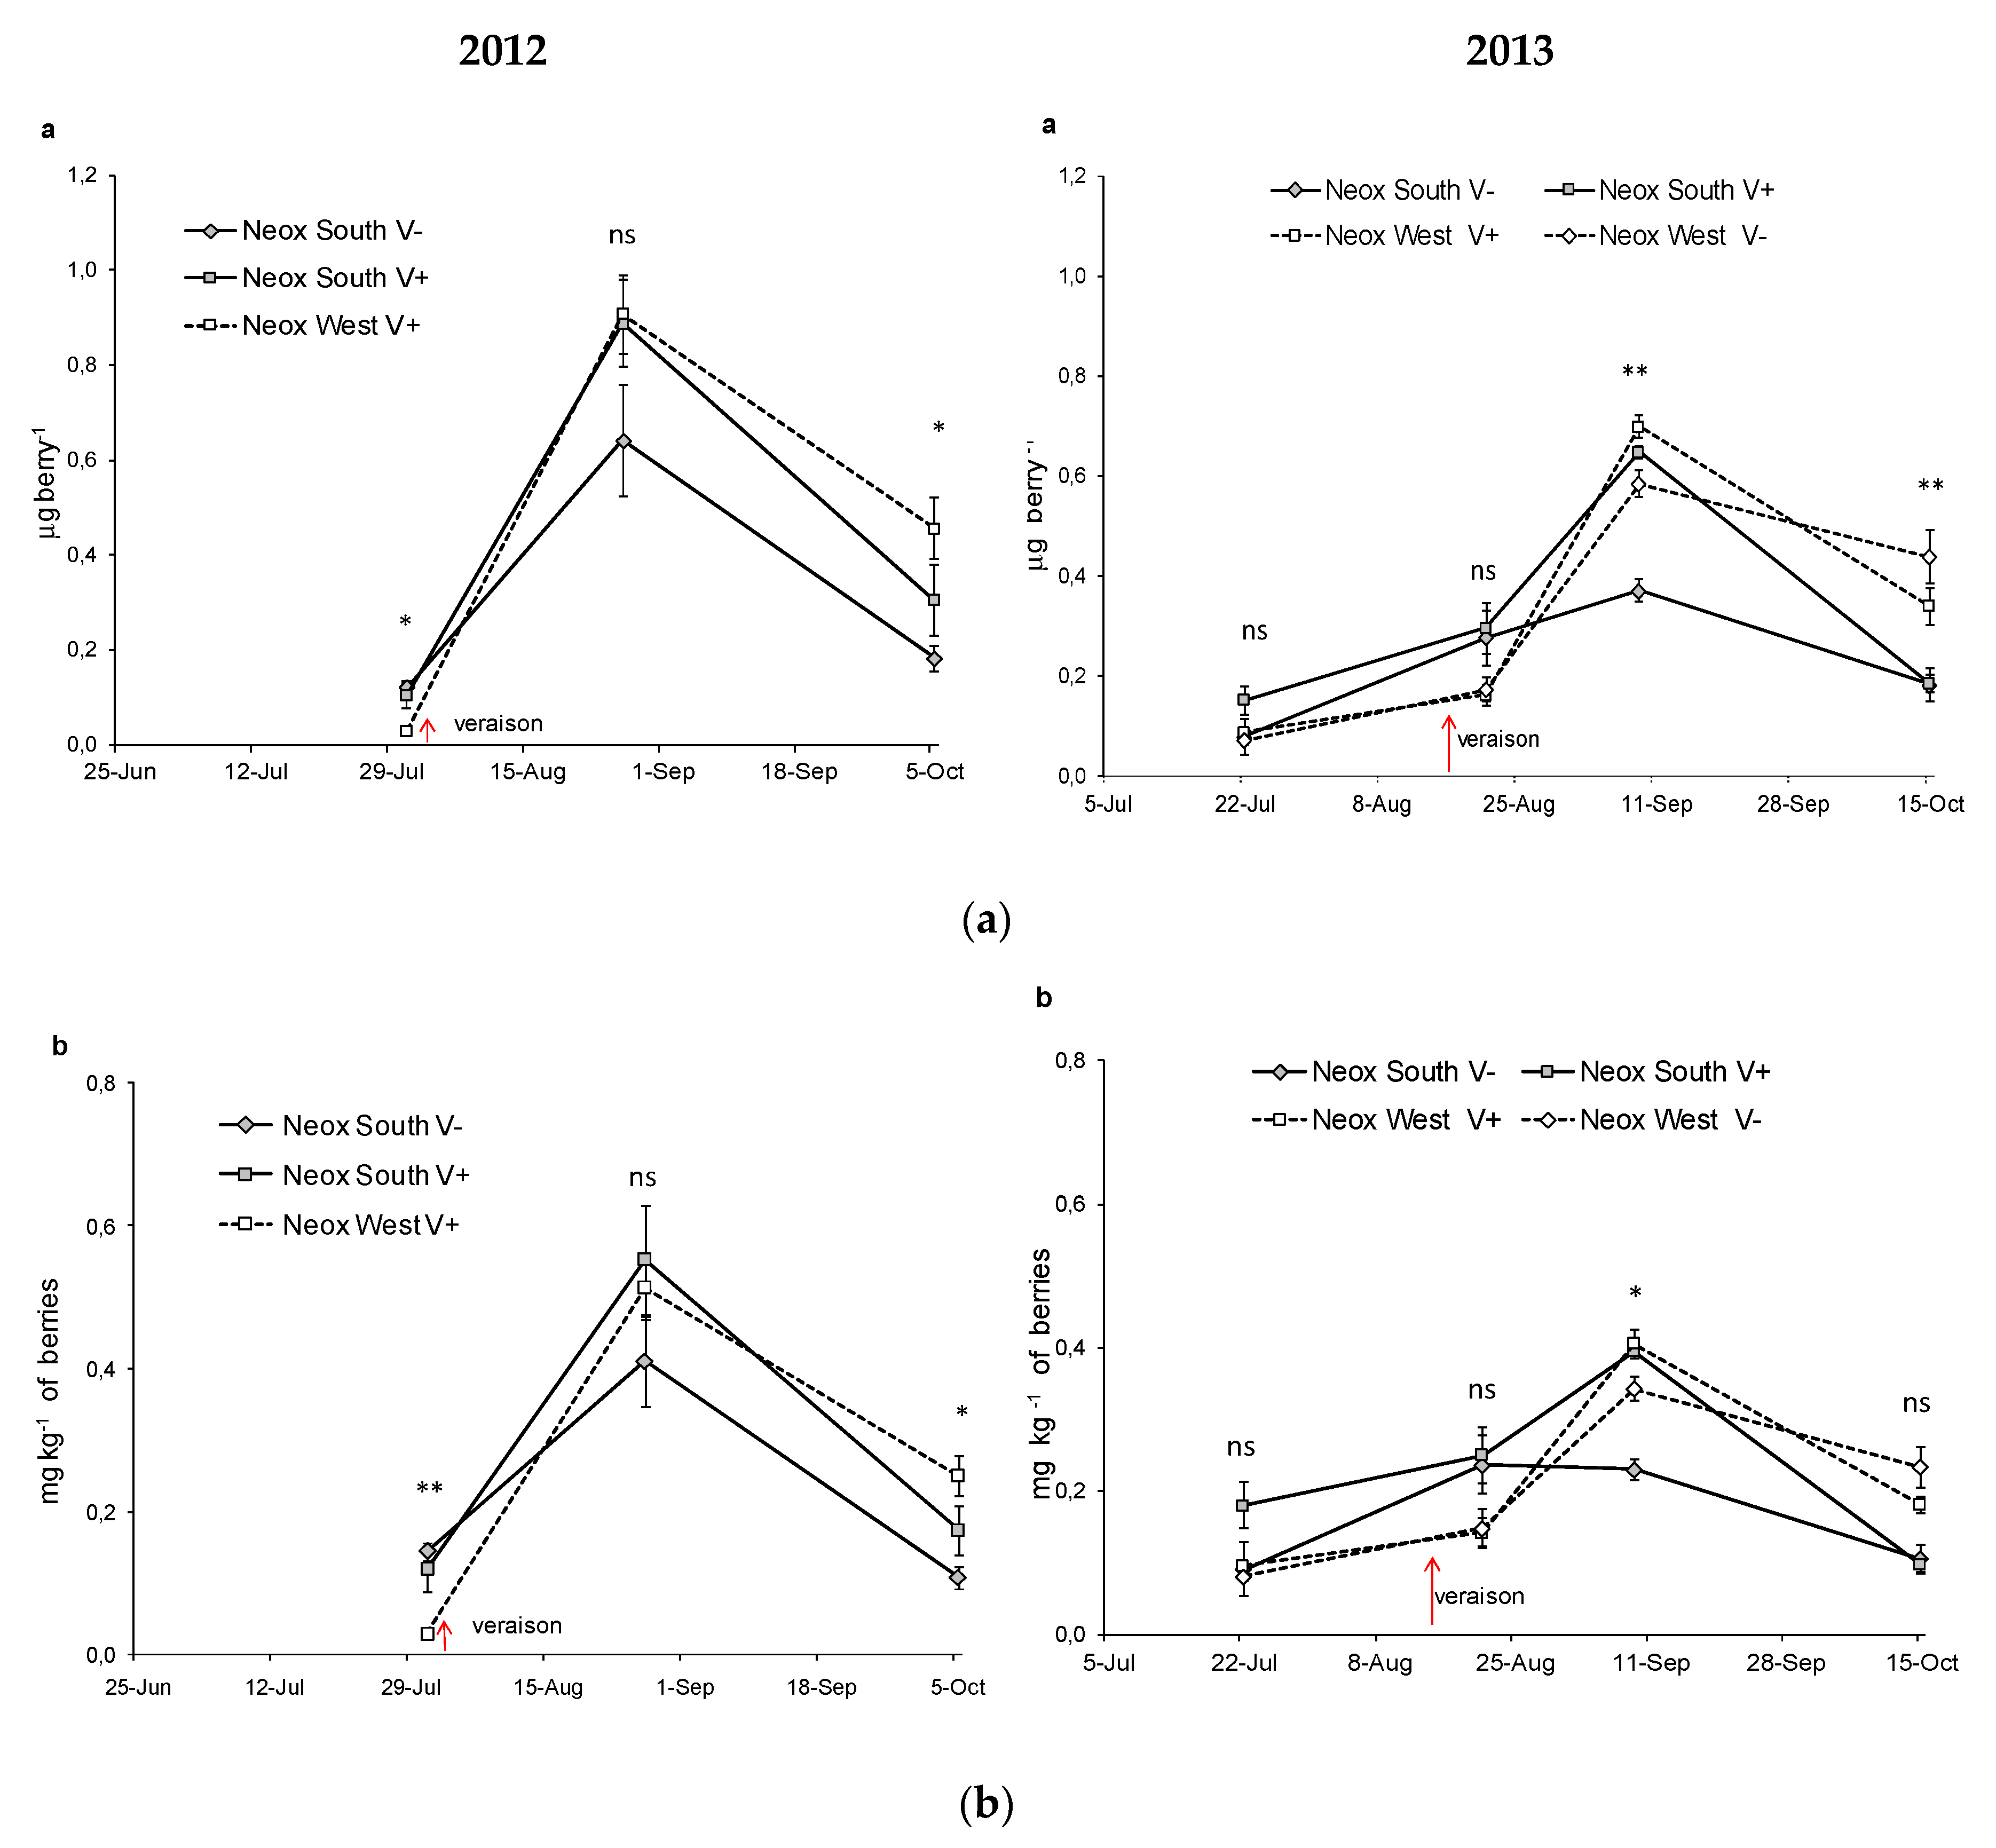
| Neoxantine mg kg−1 | SouthV− | nd | 0.14a | 0.41b | 0.11a | ** | 0.06a | 0.24a | 0.15a | 0.07a | ns | |||
| SouthV+ | nd | 0.12a | 0.55b | 0.17a | ** | 0.18ab | 0.25b | 0.26c | 0.10a | ** | * | ns | ns | |
| WestV− | - | - | - | - | 0.08a | 0.15ab | 0.34c | 0.23b | ** | |||||
| WestV+ | nd | 0.03a | 0.51c | 0.25b | ** | 0.06a | 0.14ab | 0.41c | 0.18b | ** | ||||
| Sig. among T | - | ** | ns | * | ns | ns | ns | ** | ||||||
| Neoxantine μg berry−1 | SouthV− | nd | 0.12a | 0.64b | 0.18a | ** | 0.08a | 0.28ab | 0.25b | 0.12ab | * | |||
| SouthV+ | nd | 0.11a | 0.89b | 0.30a | ** | 0.15a | 0.30a | 0.43b | 0.19a | ** | ** | ns | *** | |
| WestV− | - | - | - | - | 0.07a | 0.17a | 0.58b | 0.44b | ** | |||||
| WestV+ | nd | 0.03a | 0.91c | 0.46b | ** | 0.06a | 0.16a | 0.70c | 0.34b | ** | ||||
| Sig. among T | -- | * | ns | * | ns | ns | ns | ** | ||||||
| Lutein:β-carotene | SouthV− | 0.60a | 0.84a | 1.21b | 0.65a | ** | 0.60a | 1.75b | 1.15ab | 0.79a | *** | |||
| SouthV+ | 0.55a | 0.75a | 1.25b | 0.73a | ** | 0.72a | 1.65b | 1.28ab | 1.05ab | ** | ** | *** | *** | |
| WestV− | - | - | - | - | 0.52a | 0.91ab | 1.27b | 1.01a | * | |||||
| WestV+ | 0.59a | 0.63a | 1.49c | 0.93b | ** | 0.54a | 1.01b | 1.34b | 1.13b | * | ||||
| Sig. among T | * | *** | ns | * | ns | *** | * | *** | ||||||
| 1 Sum of carotenoids mg kg-1 of berries | SouthV− | 13.0c | 10.0bc | 8.38b | 4.30a | ** | 16.6b | 6.6a | 6.84a | 5.81a | ** | |||
| SouthV+ | 14.9b | 11.2ab | 10.6ab | 6.49a | * | 23.5c | 6.9a | 10.5b | 7.31a | *** | *** | ** | ns | |
| WestV− | - | - | - | - | 15.5b | 10.9a | 10.1a | 7.67a | * | |||||
| WestV+ | 11.9a | 9.7a | 10.2a | 8.07a | ** | 15.9b | 11.3ab | 12.1ab | 8.65a | * | ||||
| Signif. among T | ns | ns | ns | * | ** | ** | * | * | ||||||
| Sum of carotenoids μg berry−1 | SouthV− | 9.53ab | 8.46ab | 13.1b | 7.21a | ** | 14.3b | 7.73a | 11.0ab | 10.1ab | * | |||
| SouthV+ | 11.9ab | 9.91a | 17.2b | 11.2ab | ** | 18.5c | 8.14a | 17.3bc | 13.9b | ** | *** | *** | ns | |
| WestV− | - | - | - | - | 13.4a | 12.5a | 17.2a | 14.4a | ns | |||||
| WestV+ | 10.6ab | 9.67a | 18.0c | 14.5bc | ** | 14.1a | 13.3a | 21.0a | 16.1a | ns | ||||
| Sig. among T | ns | ns | ns | * | ns | * | * | ** | ||||||
| Prin1 | Prin2 | Prin3 | |
|---|---|---|---|
| Explained variance (%) | 39 | 27 | 20 |
| Eigenvalues | 2.7 | 1.9 | 1.4 |
| Loadings of the variables | |||
| Neoxanthin (%) | 0.15 | 0.67 | 0.02 |
| Sum of carotenoids (μg berry−1) | 0.46 | 0.09 | −0.12 |
| Lutein: β-carotene | 0.18 | 0.65 | 0.04 |
| NH15–25 | 0.53 | −0.20 | 0.23 |
| NH25 -35 | −0.13 | −0.02 | −0.79 |
| NH35 | −0.41 | 0.05 | 0.54 |
| ST:SPAR | 0.51 | −0.26 | 0.09 |
© 2020 by the authors. Licensee MDPI, Basel, Switzerland. This article is an open access article distributed under the terms and conditions of the Creative Commons Attribution (CC BY) license (http://creativecommons.org/licenses/by/4.0/).
Share and Cite
Asproudi, A.; Petrozziello, M.; Cavalletto, S.; Ferrandino, A.; Mania, E.; Guidoni, S. Bunch Microclimate Affects Carotenoids Evolution in cv. Nebbiolo (V. vinifera L.). Appl. Sci. 2020, 10, 3846. https://doi.org/10.3390/app10113846
Asproudi A, Petrozziello M, Cavalletto S, Ferrandino A, Mania E, Guidoni S. Bunch Microclimate Affects Carotenoids Evolution in cv. Nebbiolo (V. vinifera L.). Applied Sciences. 2020; 10(11):3846. https://doi.org/10.3390/app10113846
Chicago/Turabian StyleAsproudi, Andriani, Maurizio Petrozziello, Silvia Cavalletto, Alessandra Ferrandino, Elena Mania, and Silvia Guidoni. 2020. "Bunch Microclimate Affects Carotenoids Evolution in cv. Nebbiolo (V. vinifera L.)" Applied Sciences 10, no. 11: 3846. https://doi.org/10.3390/app10113846
APA StyleAsproudi, A., Petrozziello, M., Cavalletto, S., Ferrandino, A., Mania, E., & Guidoni, S. (2020). Bunch Microclimate Affects Carotenoids Evolution in cv. Nebbiolo (V. vinifera L.). Applied Sciences, 10(11), 3846. https://doi.org/10.3390/app10113846