Multi-Channel Feature Pyramid Networks for Prostate Segmentation, Based on Transrectal Ultrasound Imaging


Abstract
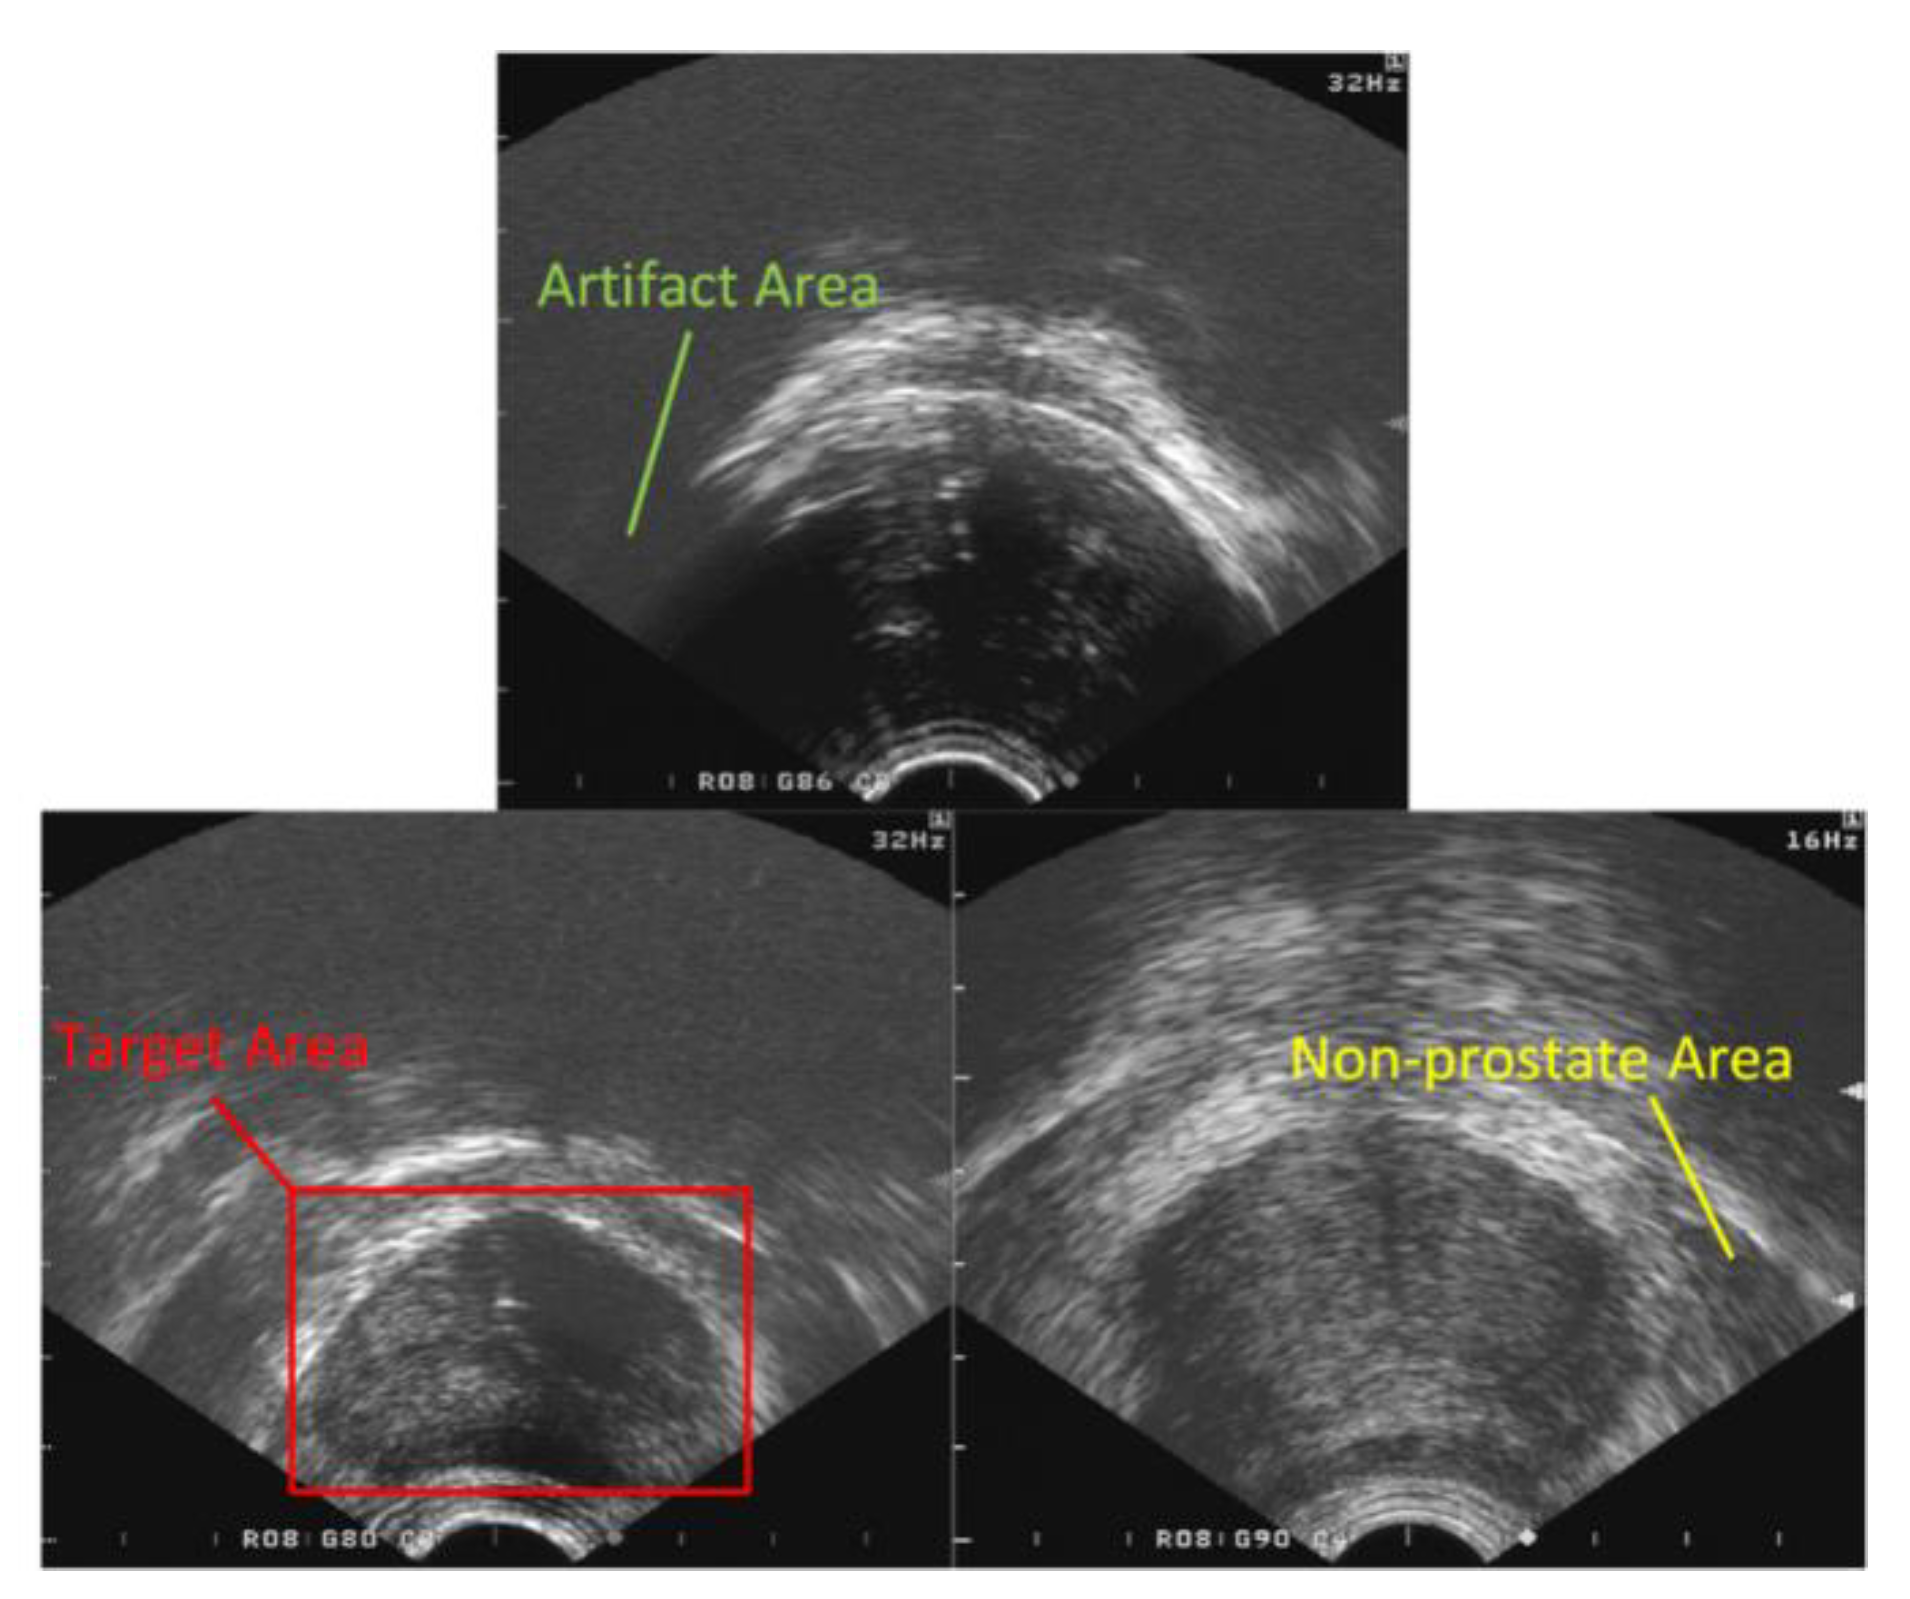
:1. Introduction
- (1)
- We propose that a MFPN network can strengthen a feature set by controlling the channel scale on a multi-scale feature map.
- (2)
- We solve the problem of inaccurate segmentation caused by weak edge features.
- (3)
- The Anchor size ratio of each anchor point in the Anchor mechanism was modified and a new bounding box regression algorithm was proposed, which not only improves the convergence speed of the target region. At the same time, the process effectively avoids the problem that the target region covers the inside of the prostate’s contour and causes the segmentation accuracy to decrease.
2. Methods
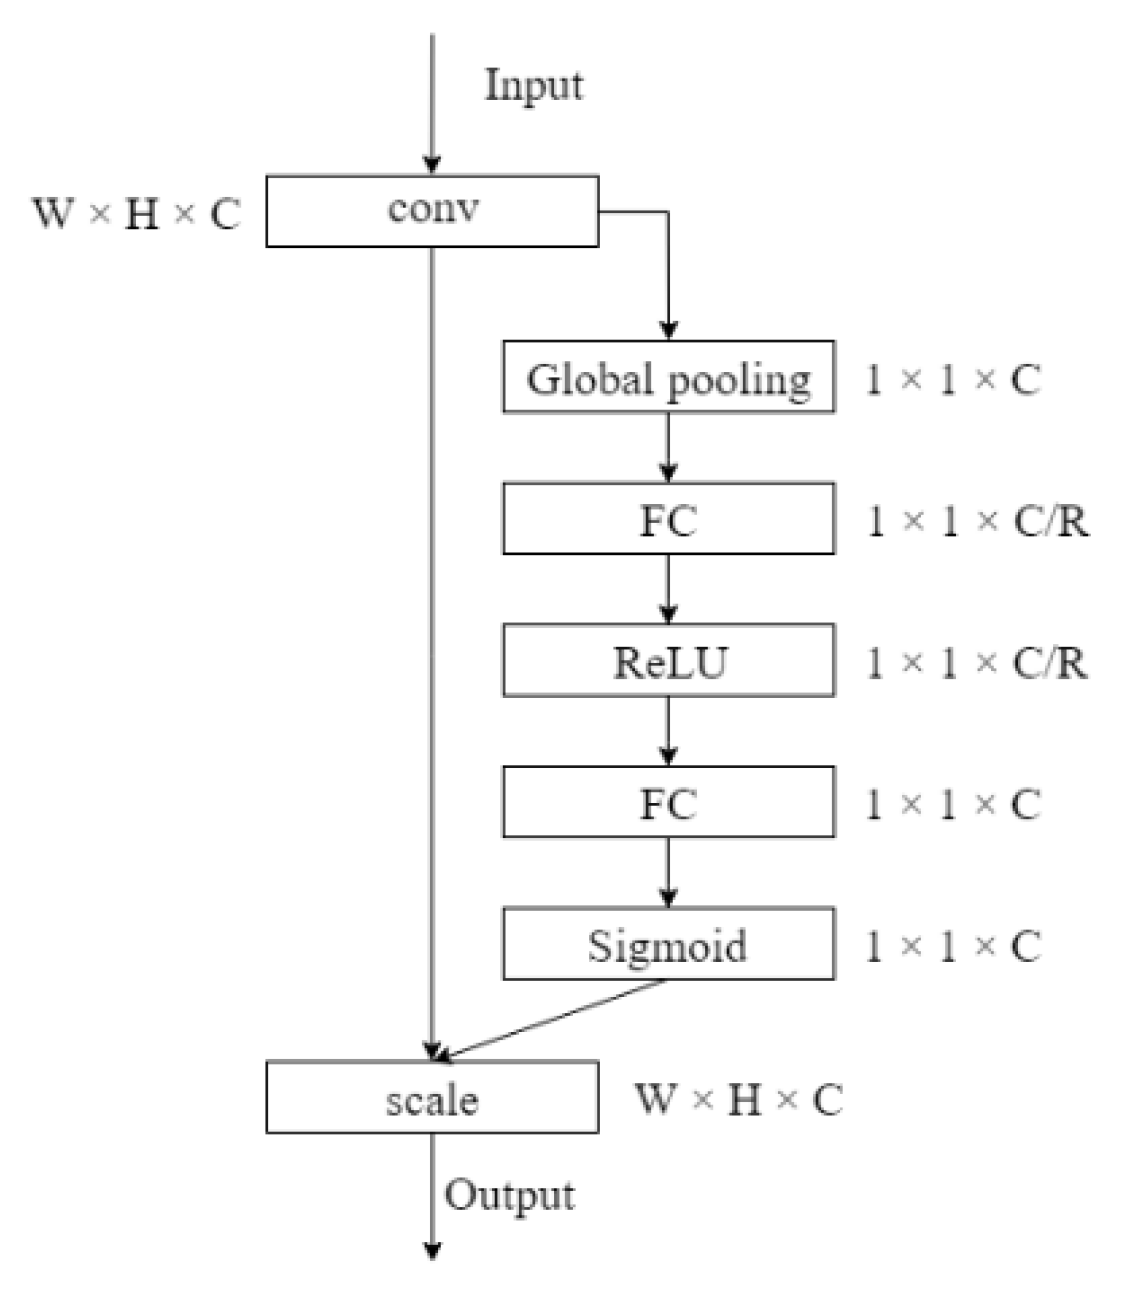
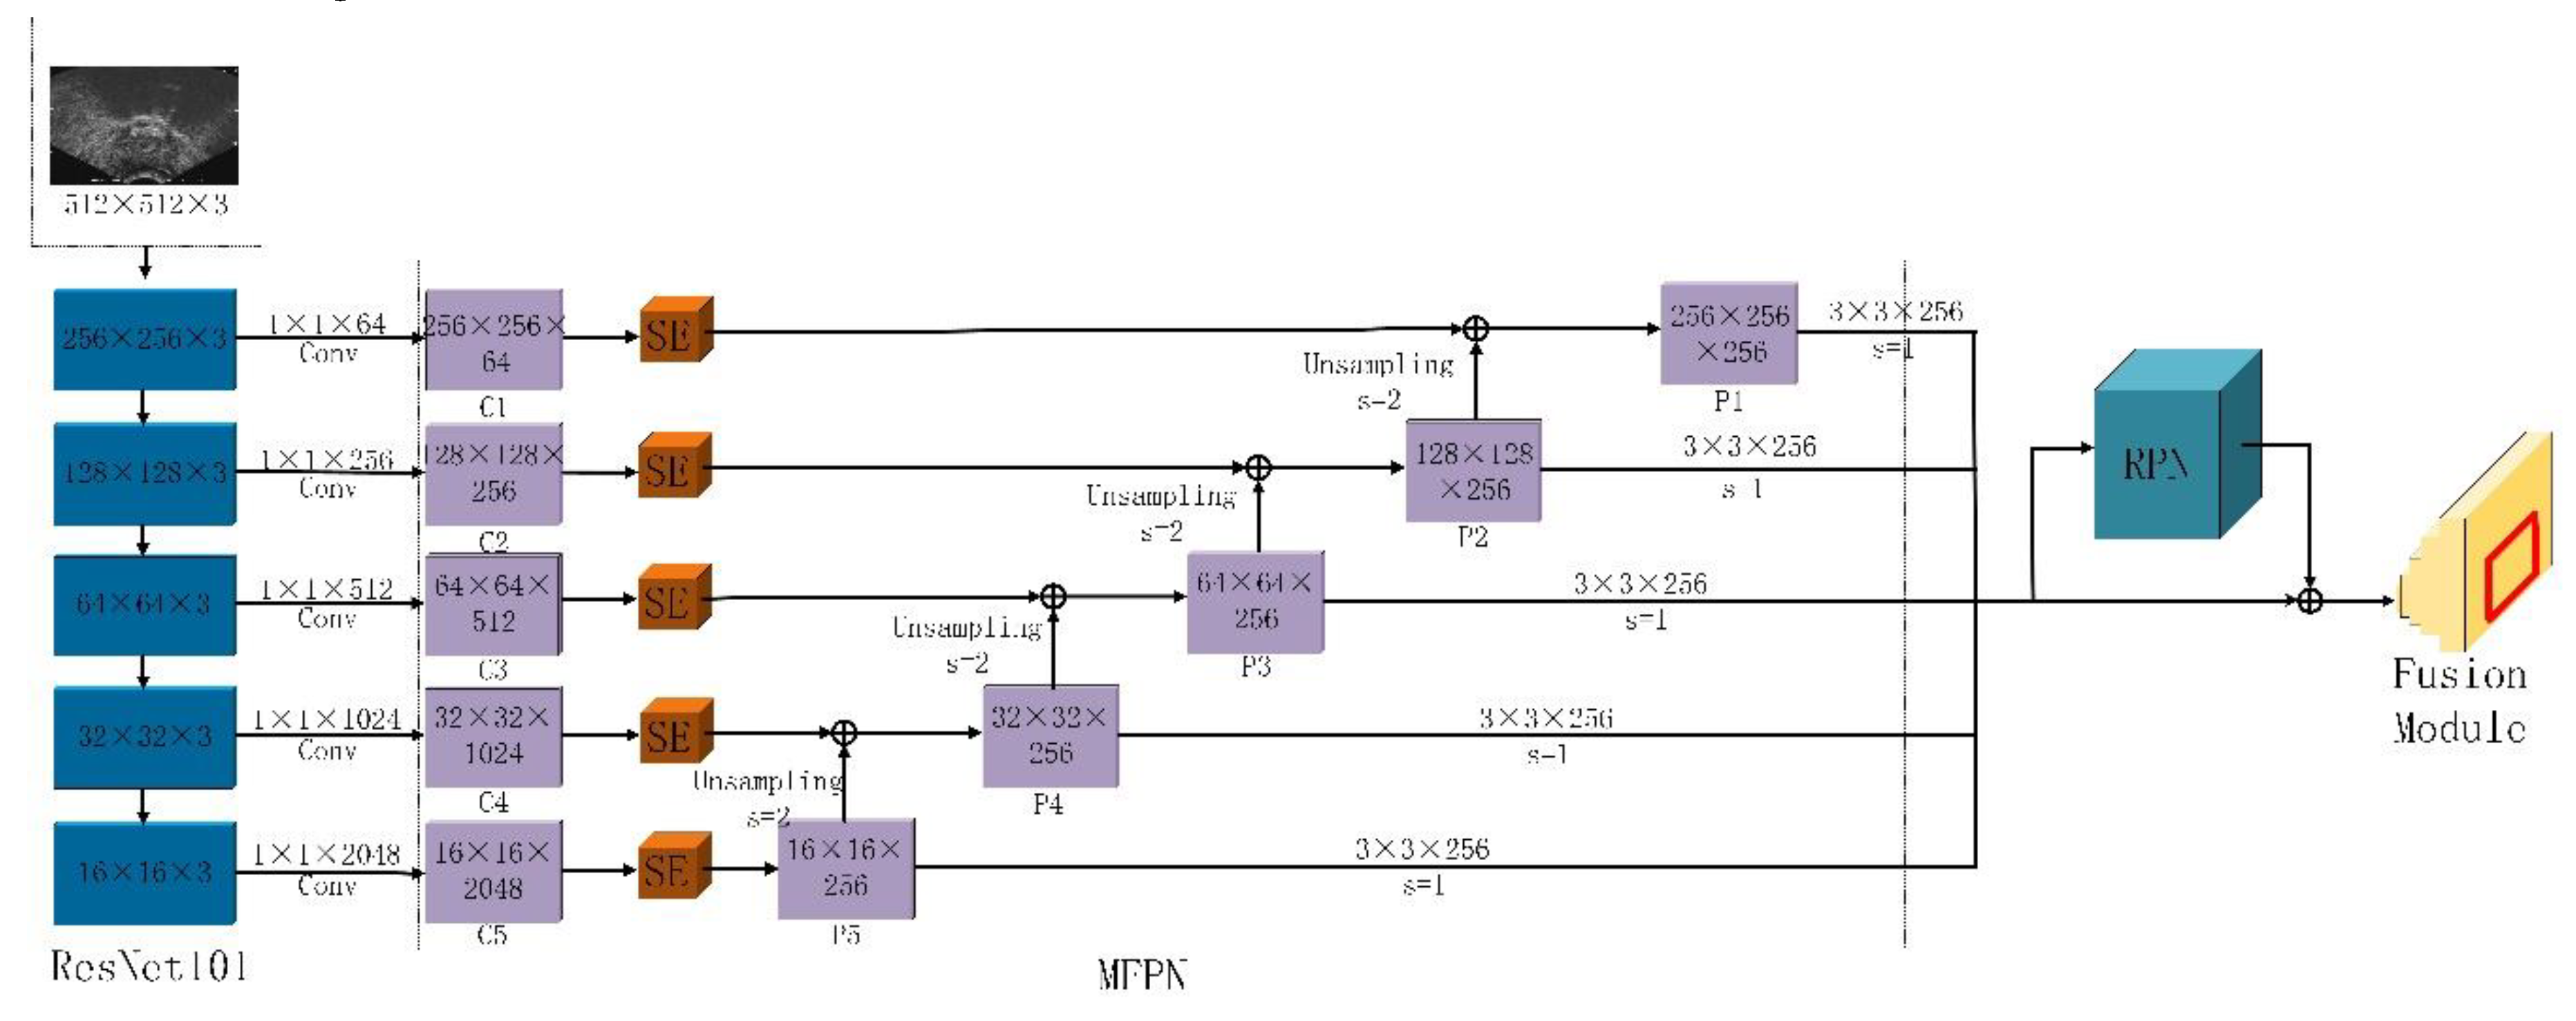
2.1. Multi-Scale Feature Extraction
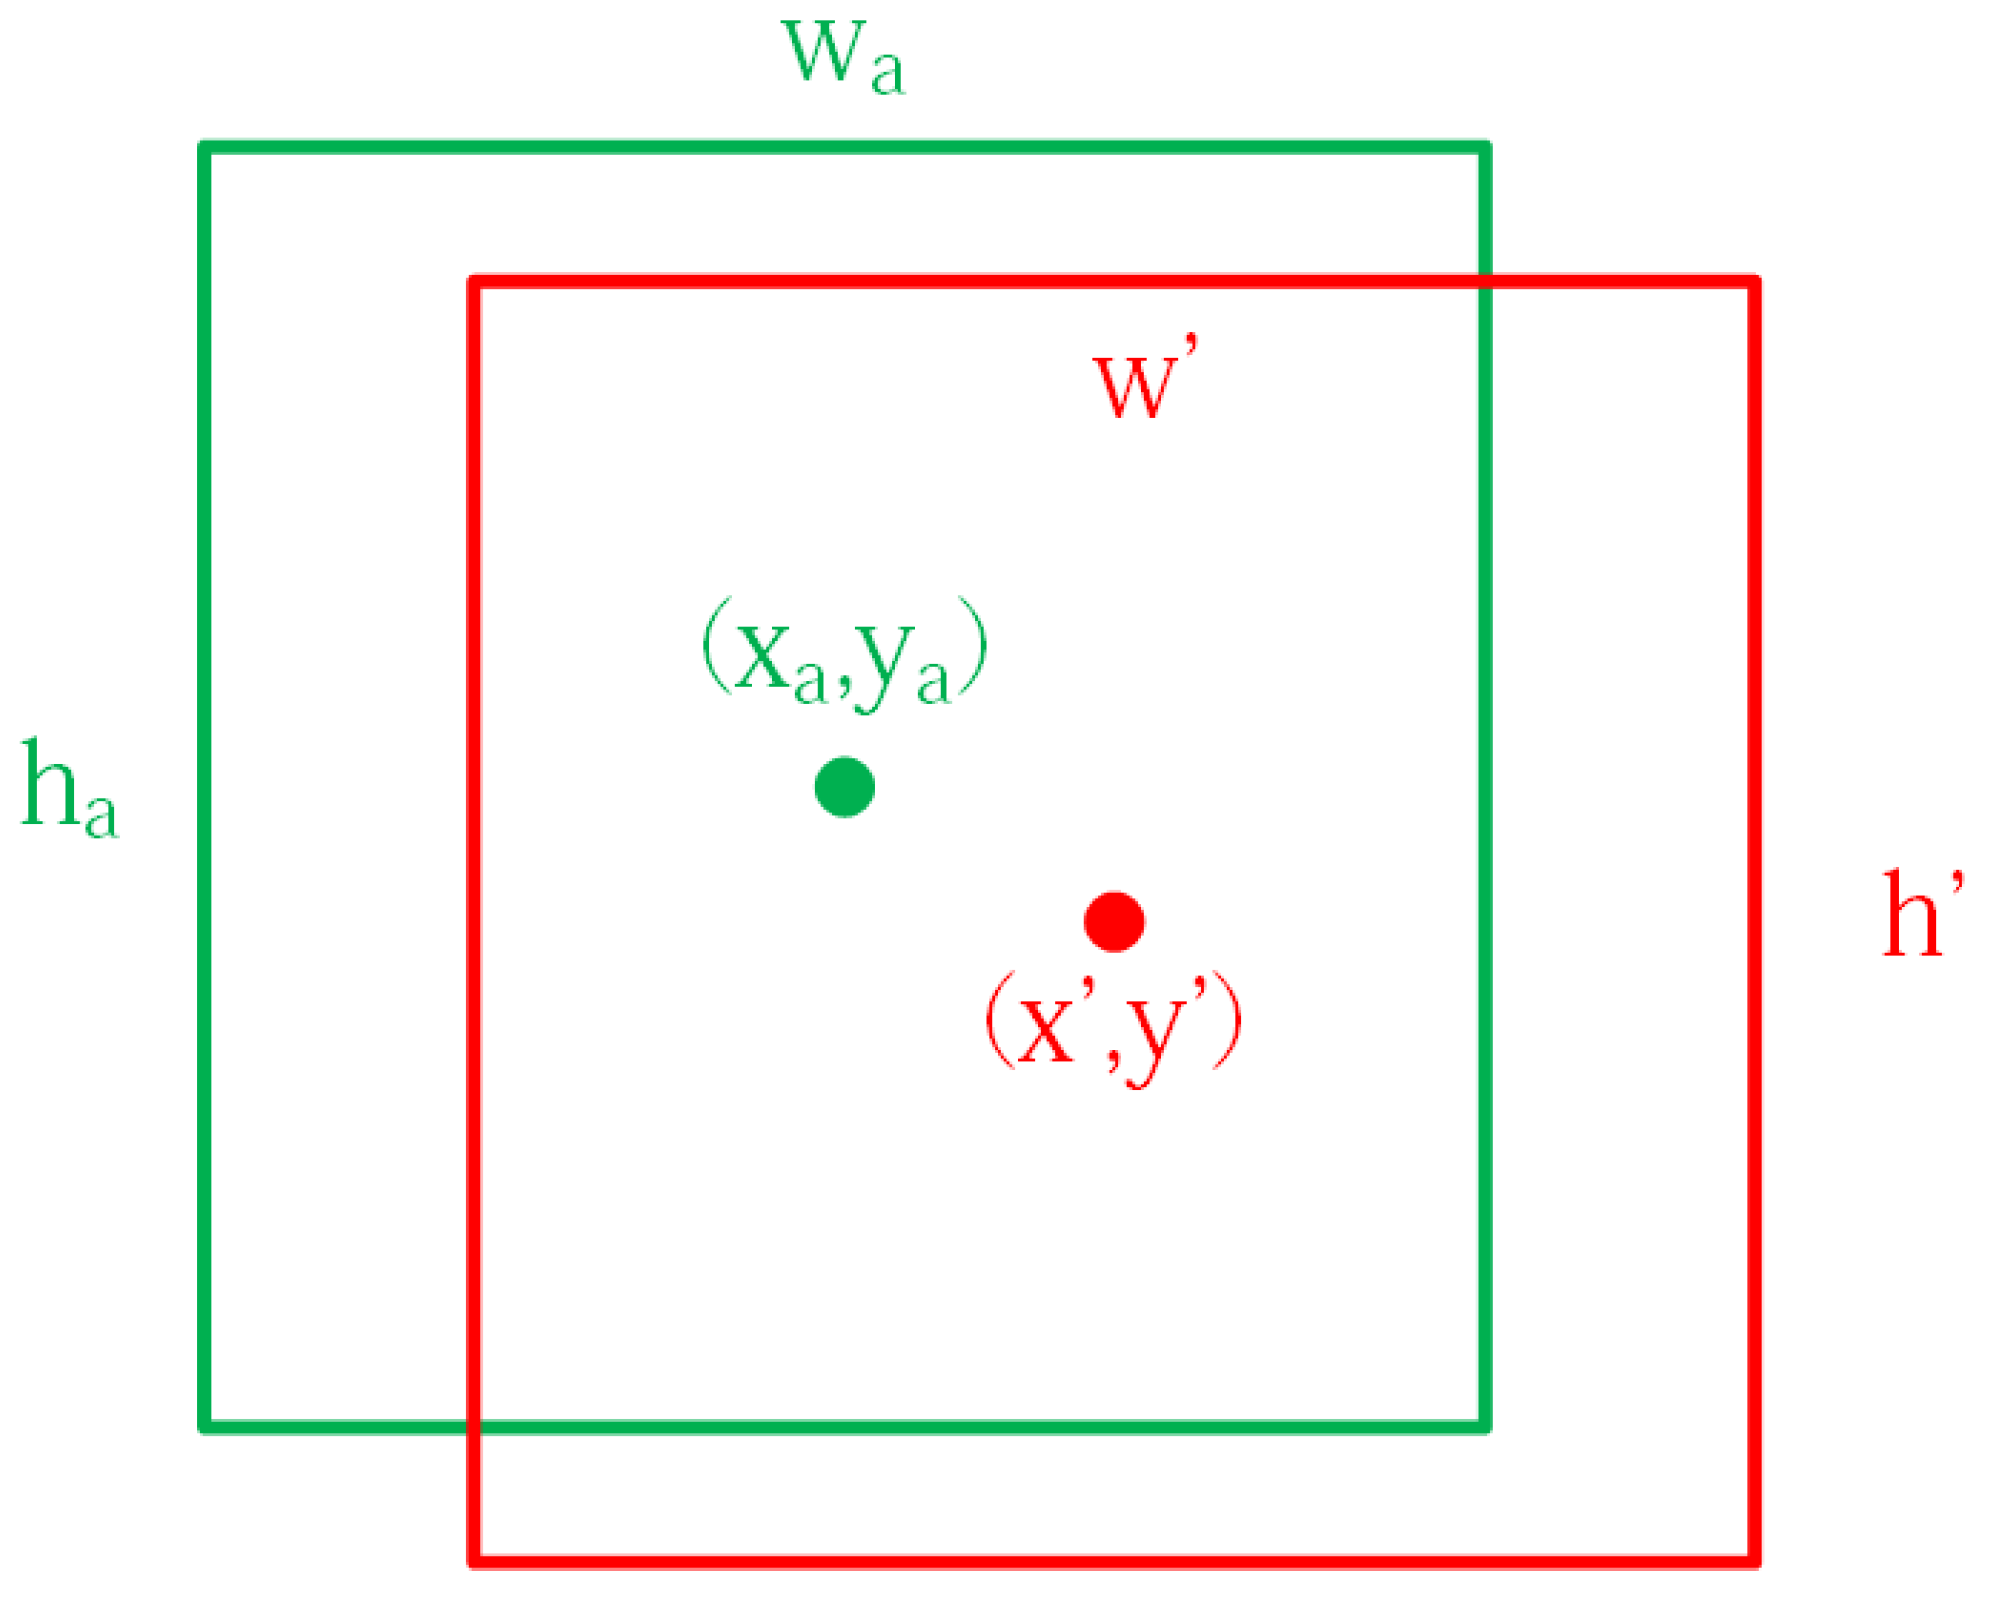
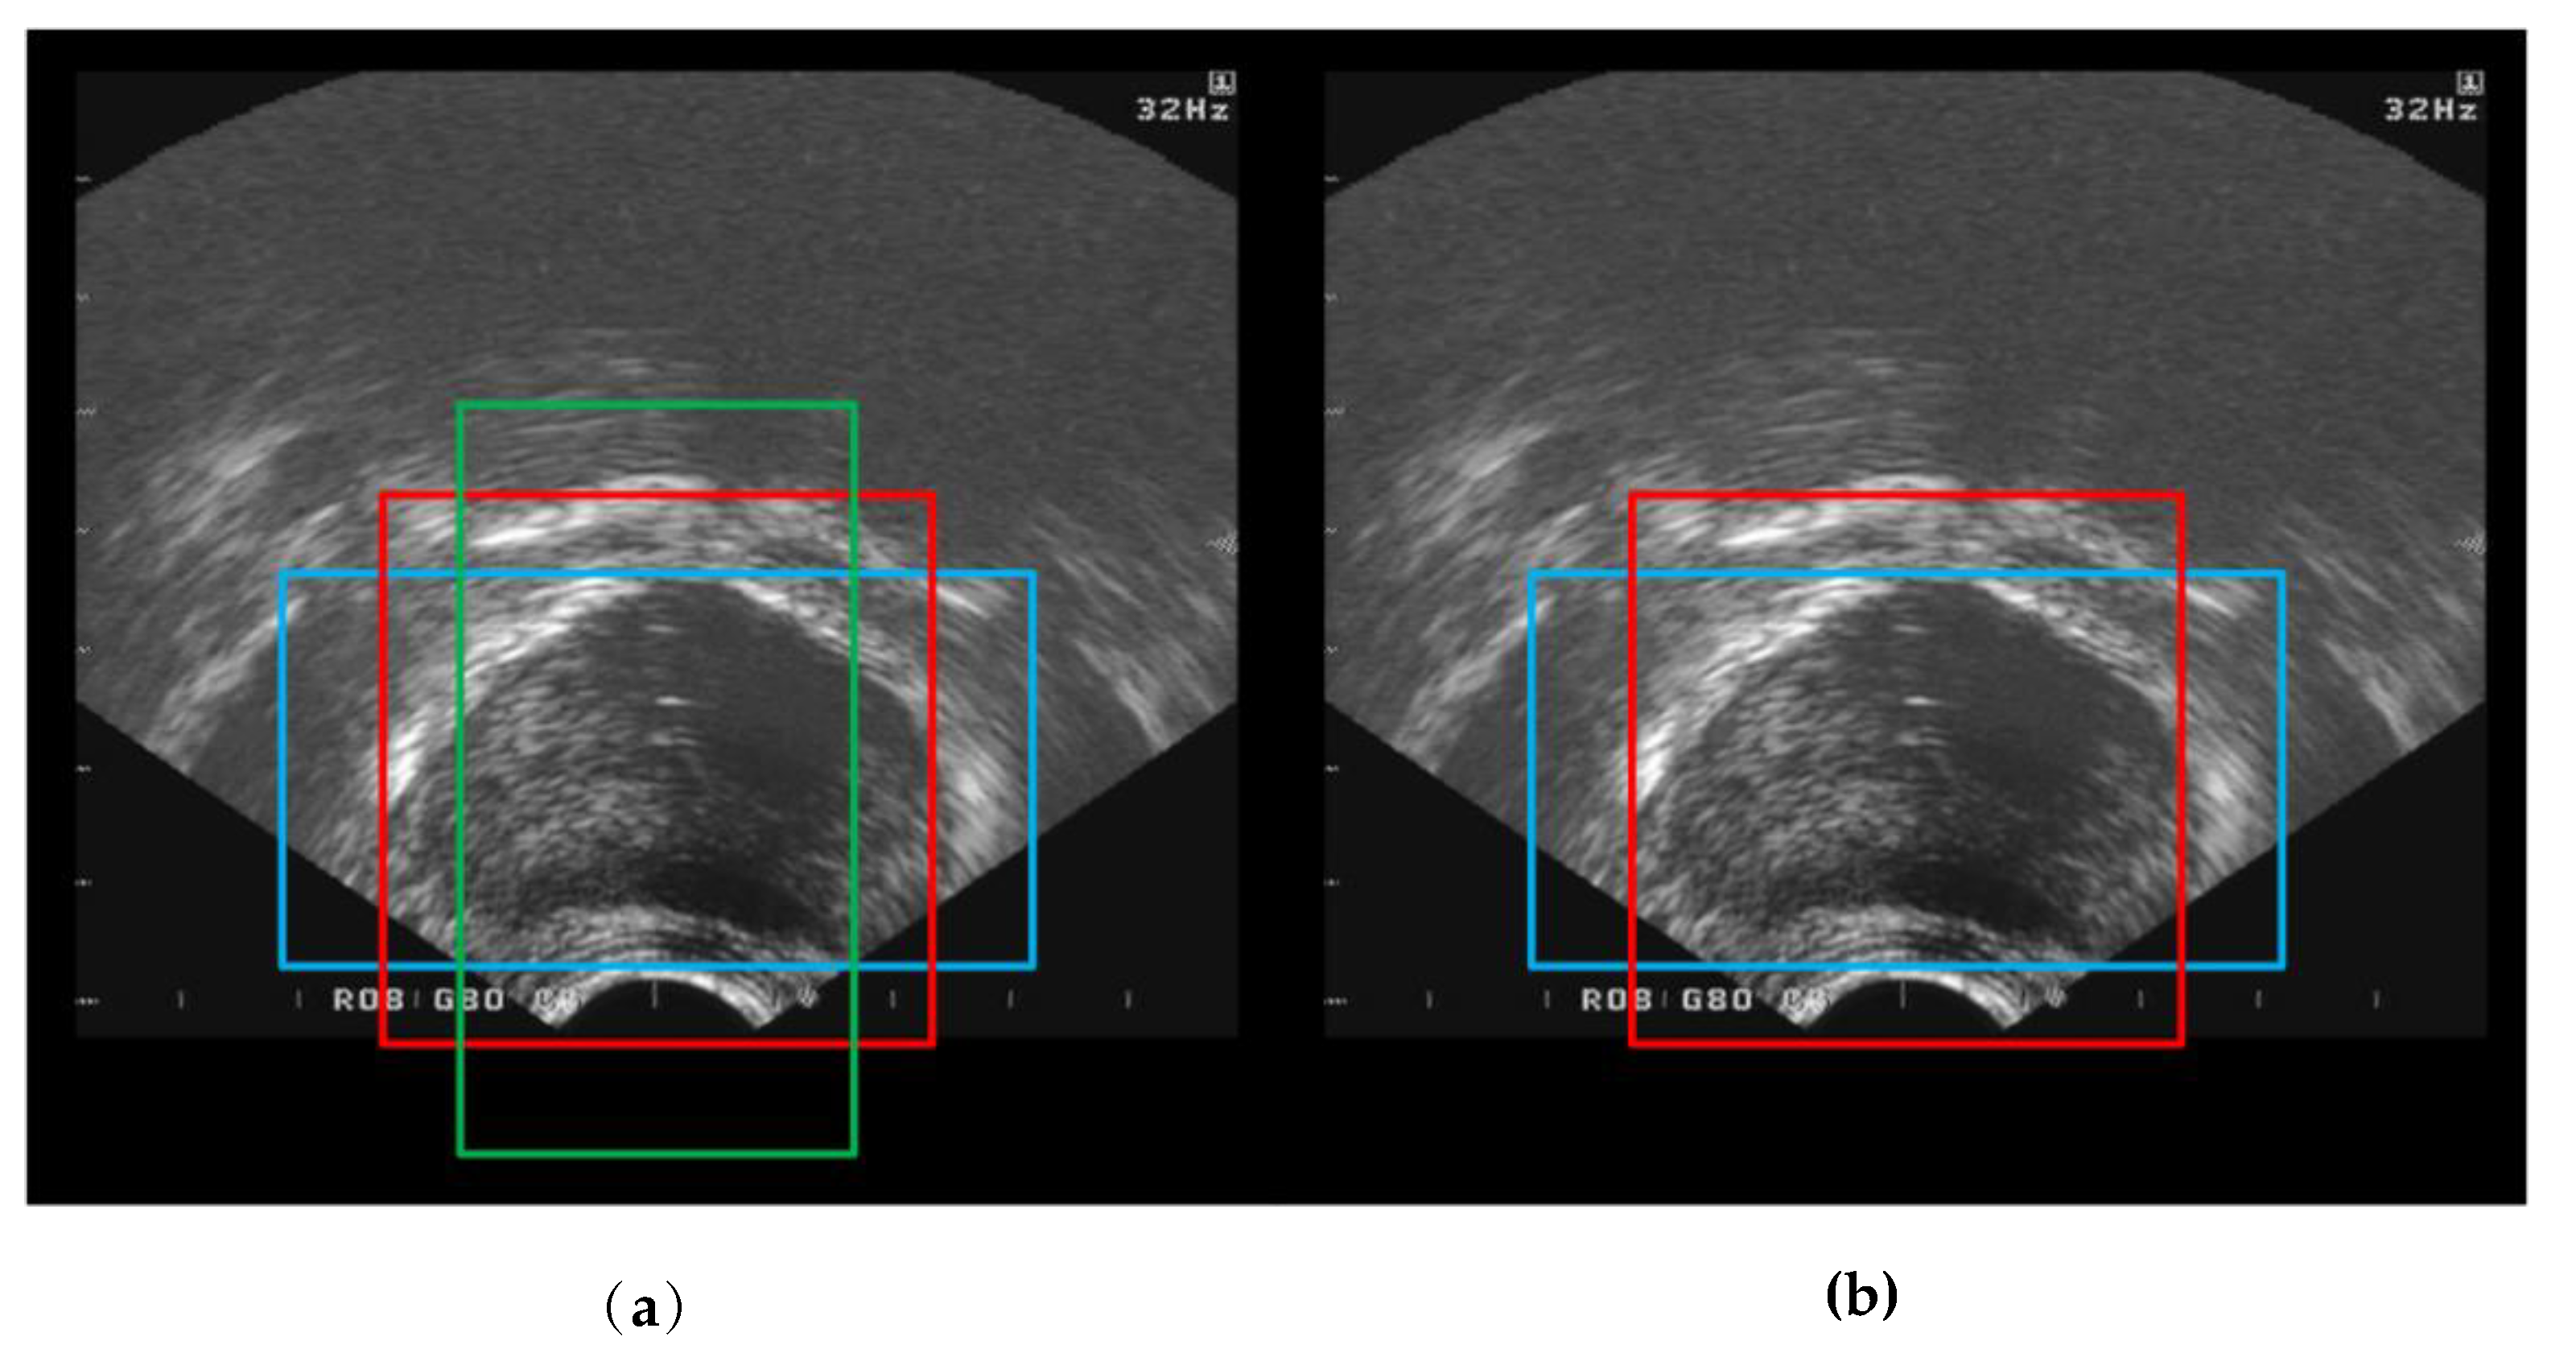
2.2. Target Area Screening Module
2.3. Target Area Screening Module
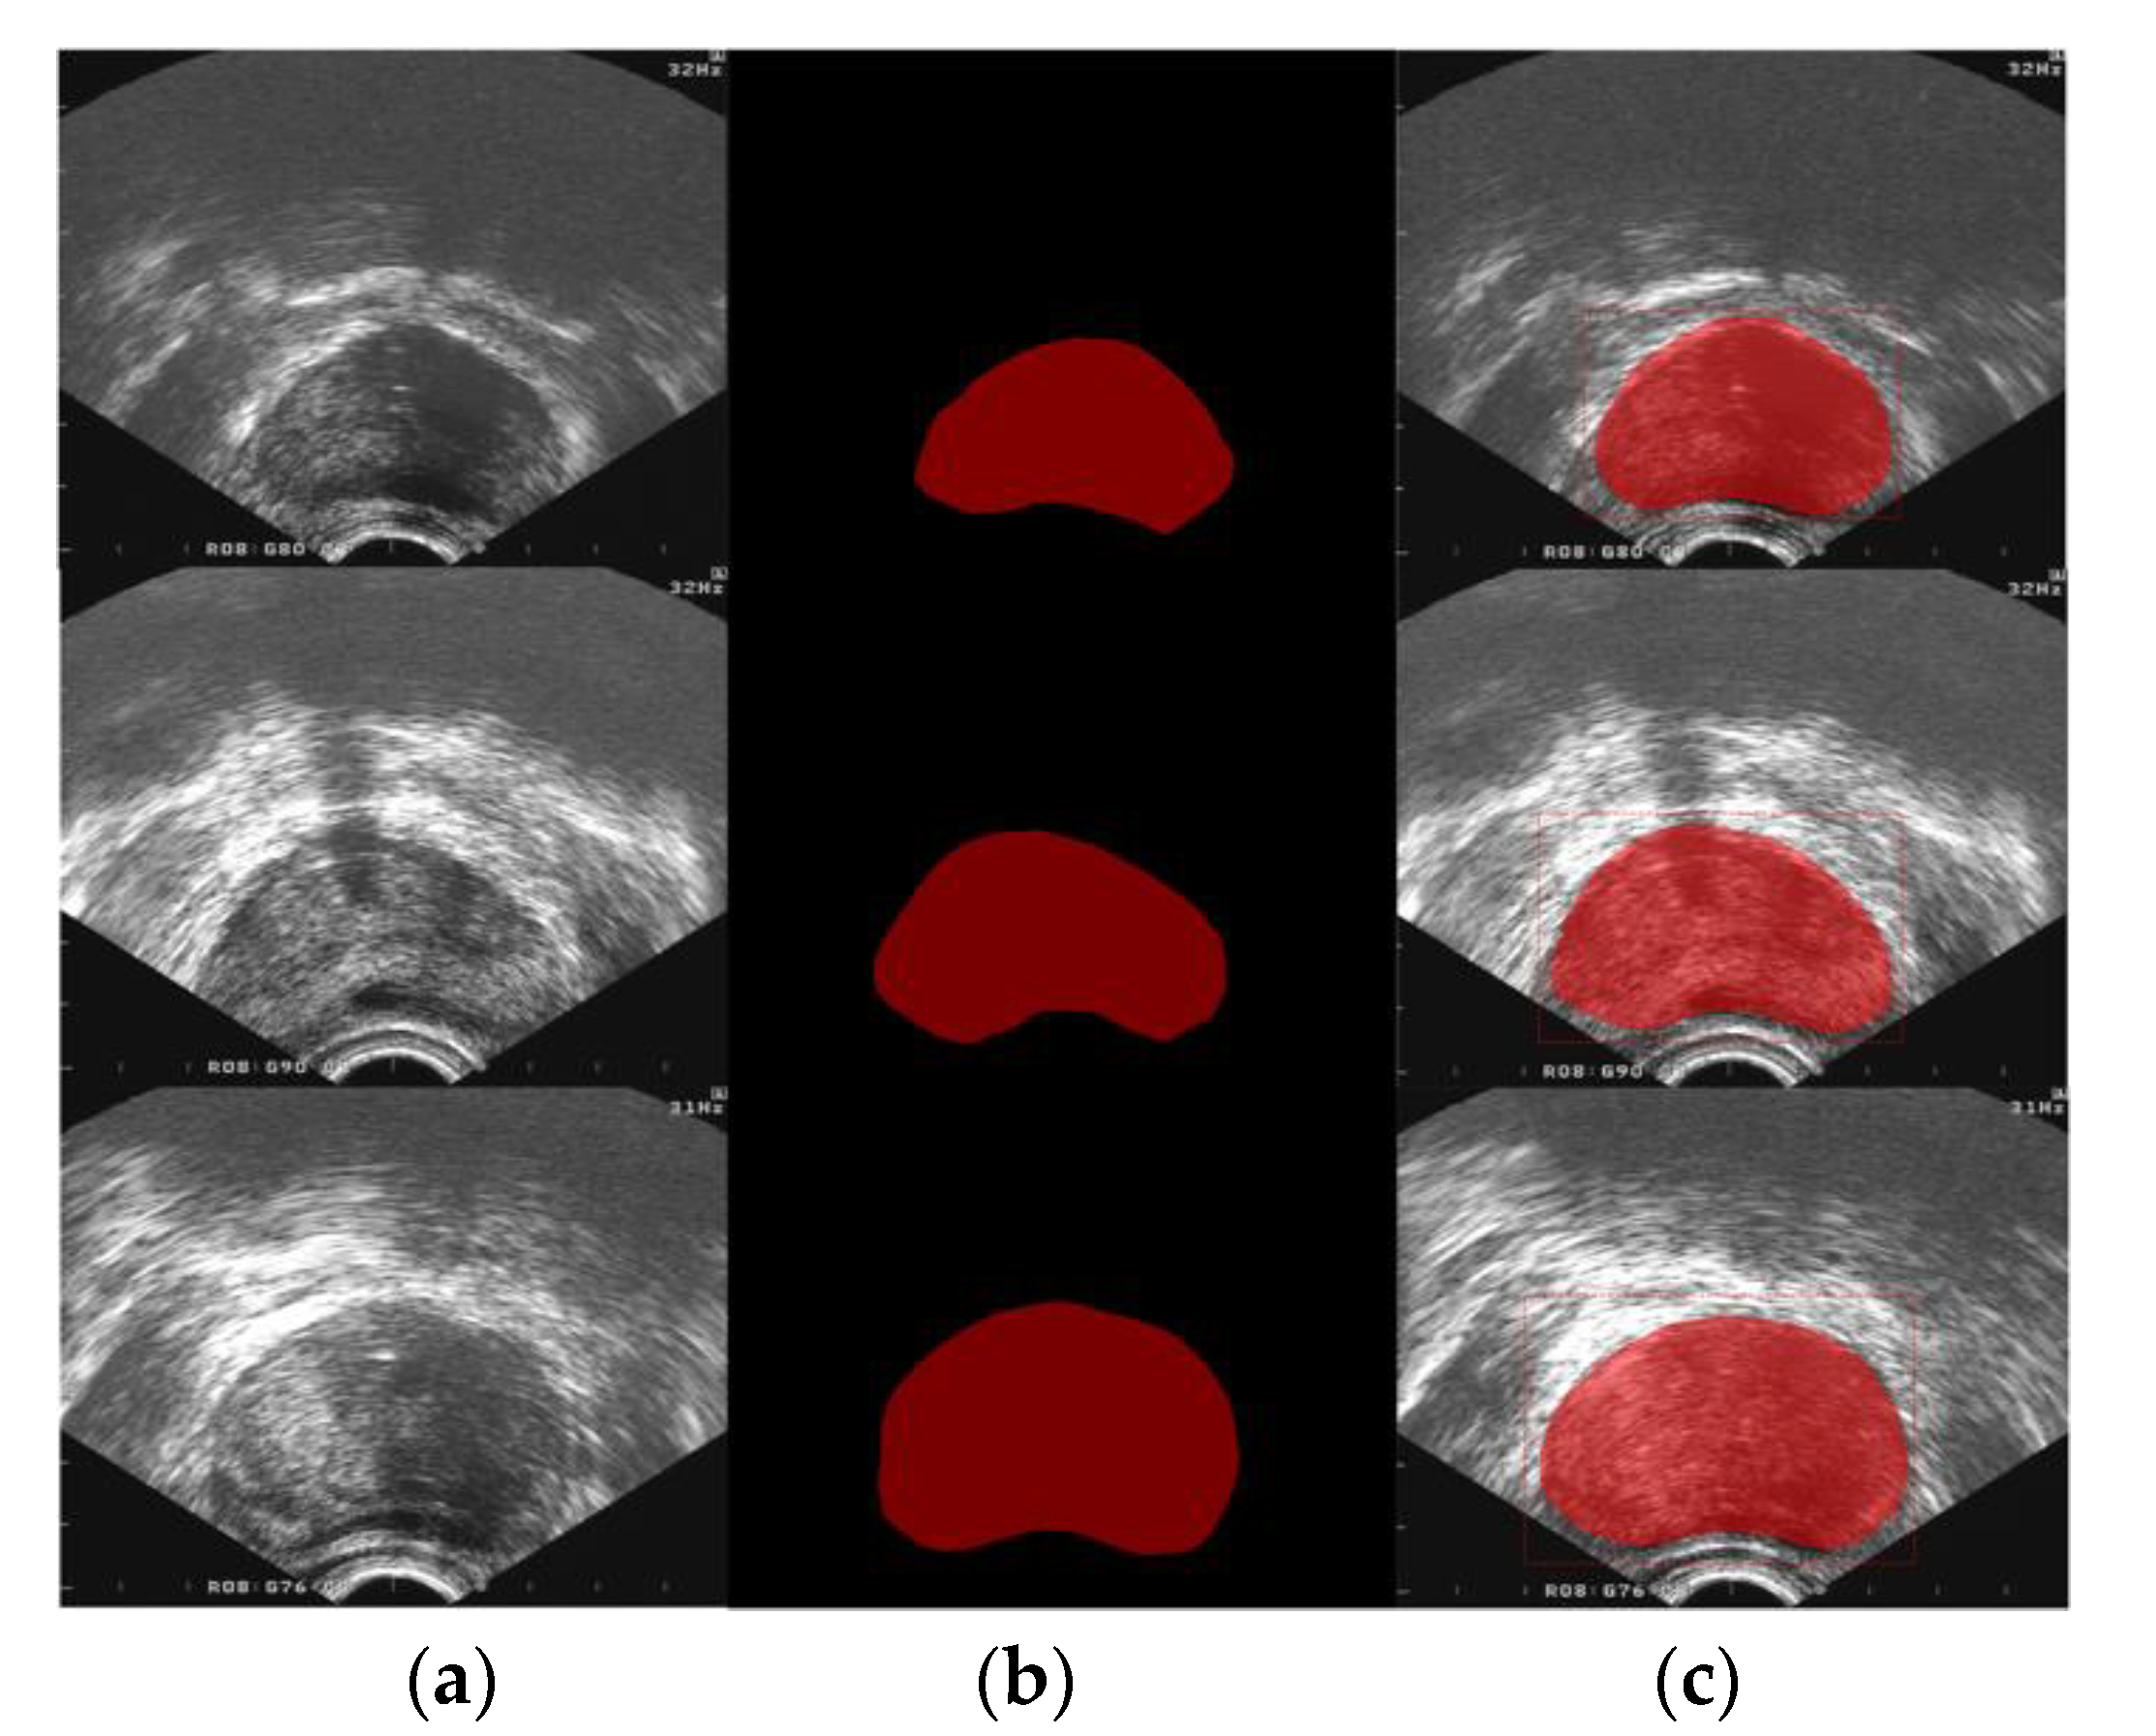
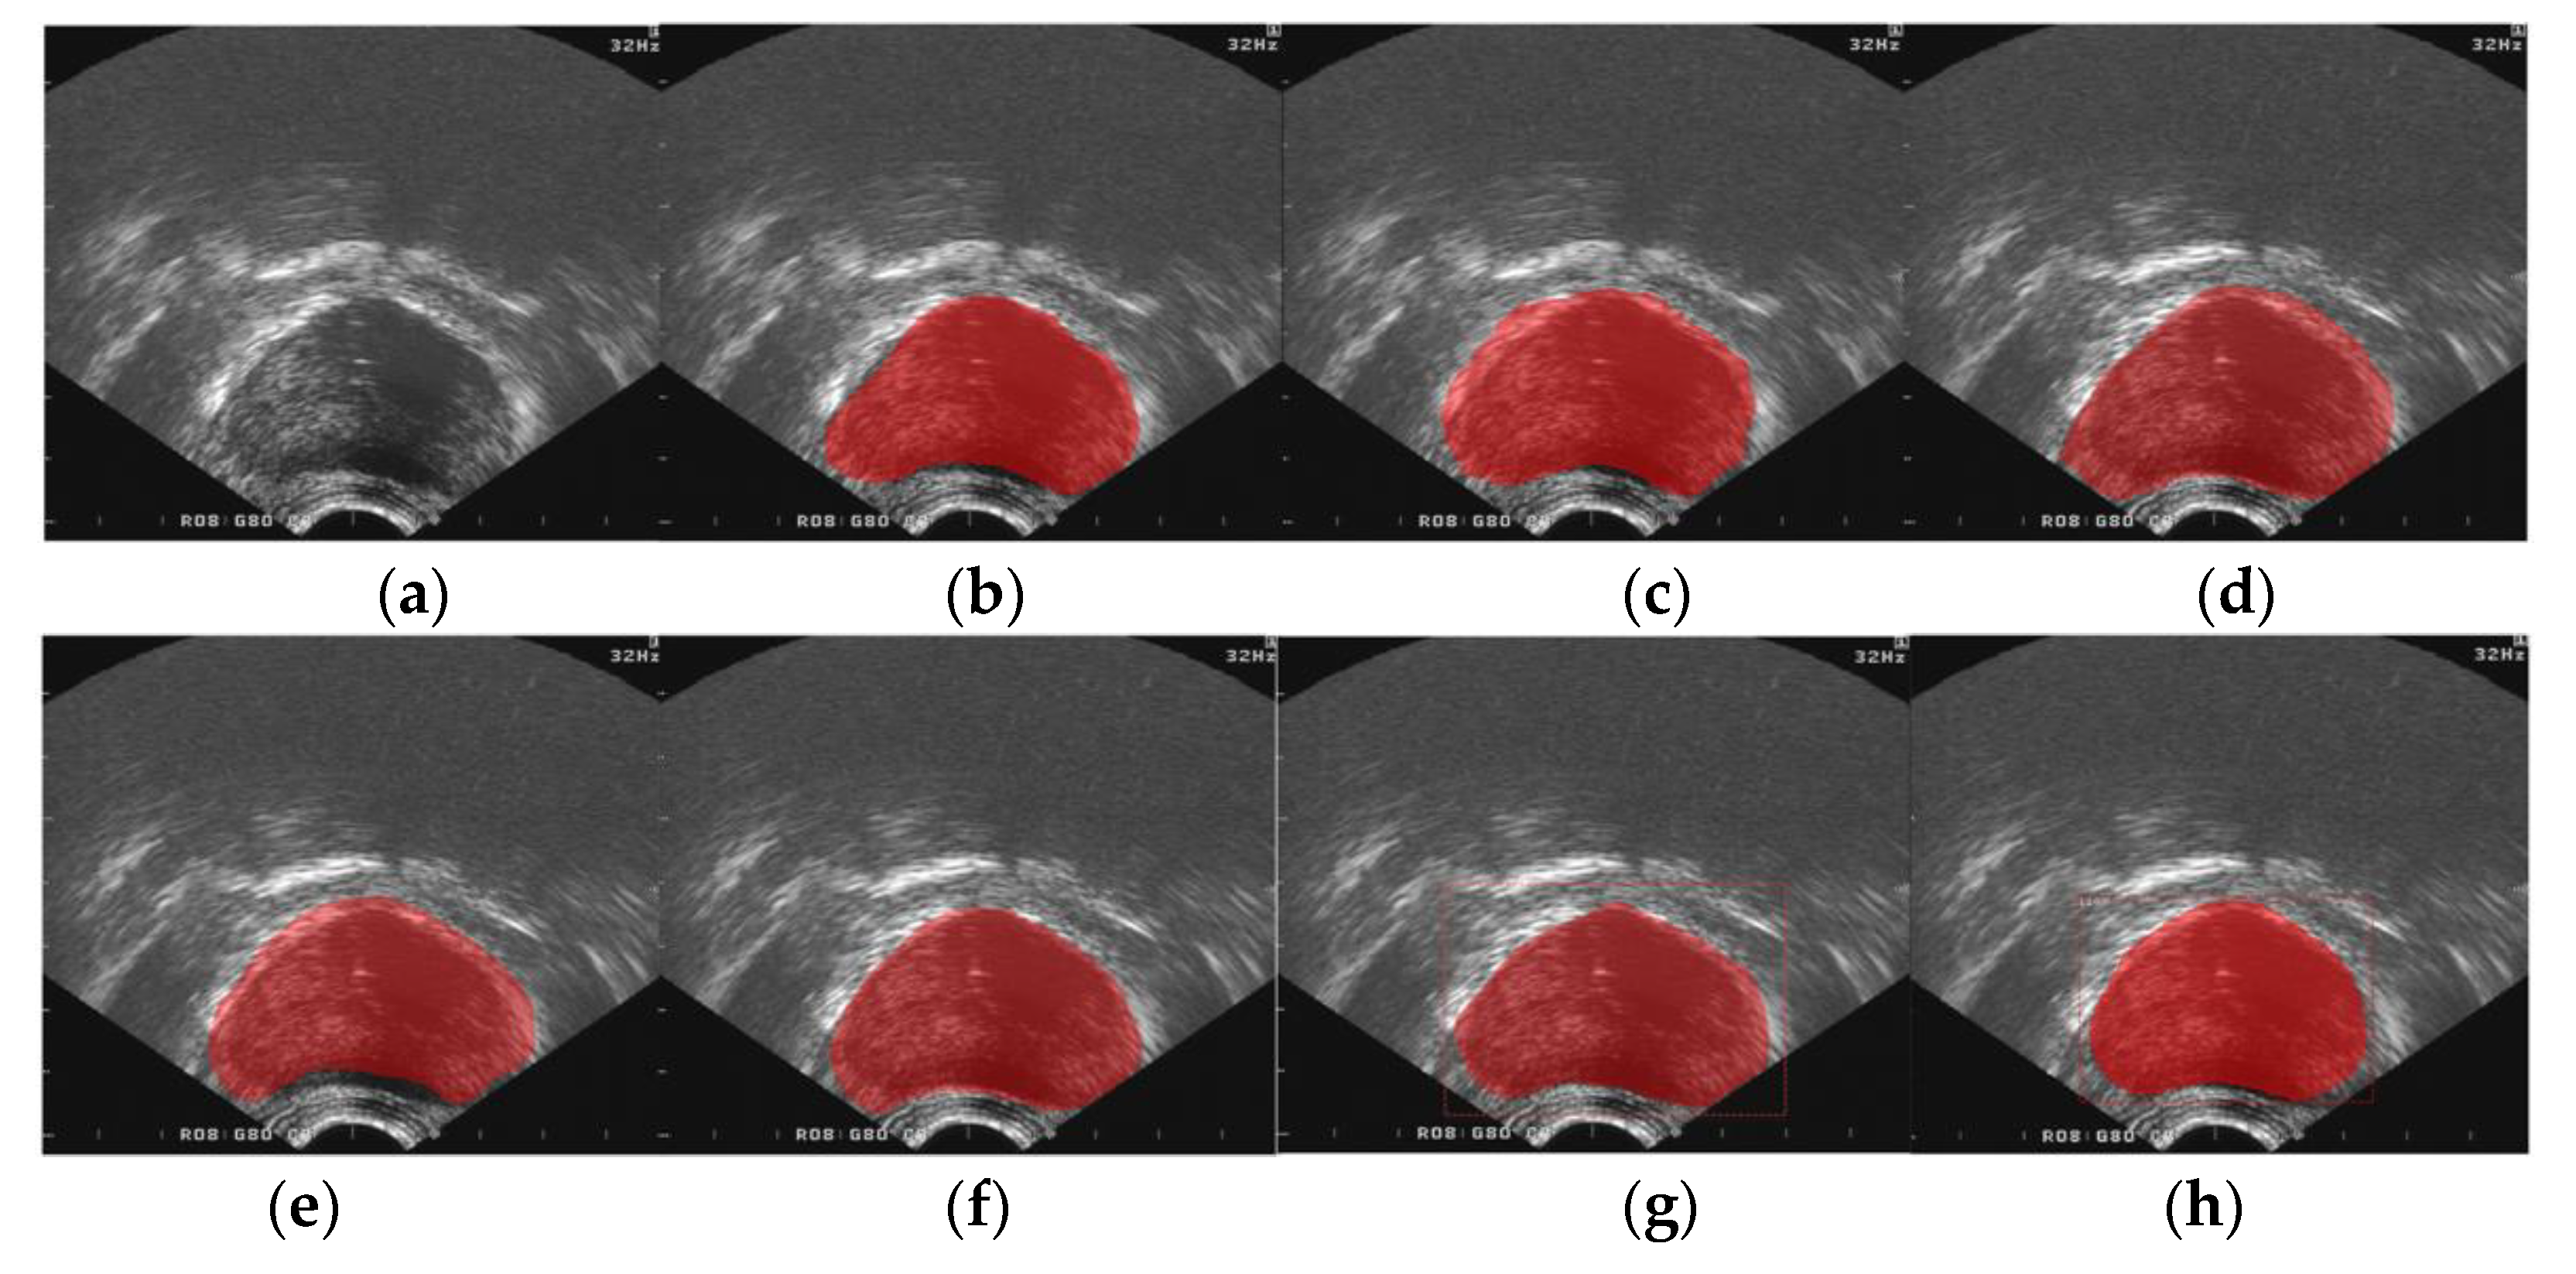
3. Results
3.1. Materials
3.2. Quality Assessment Methods
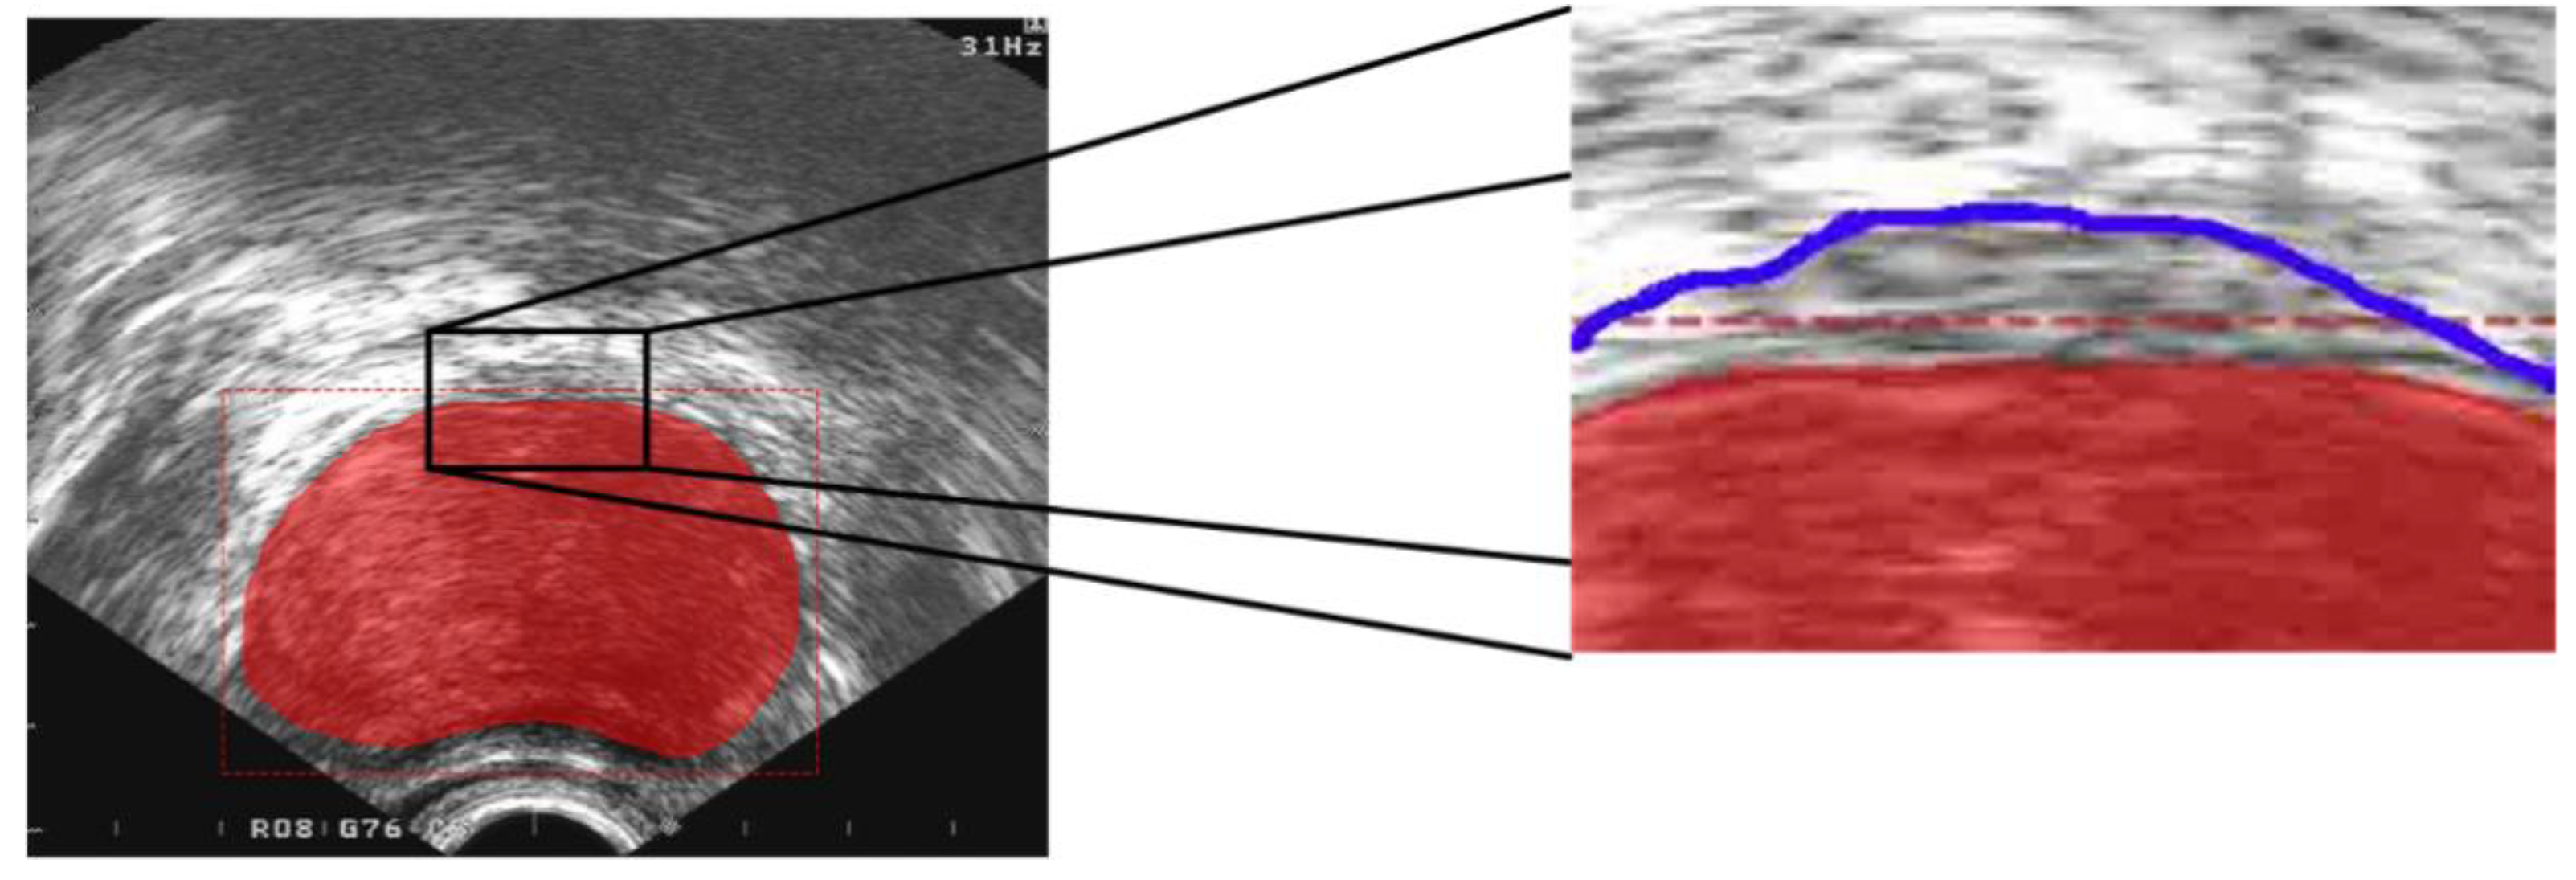
3.2.1. Evaluation Method of the Target Area
3.2.2. Segmentation Evaluation Method
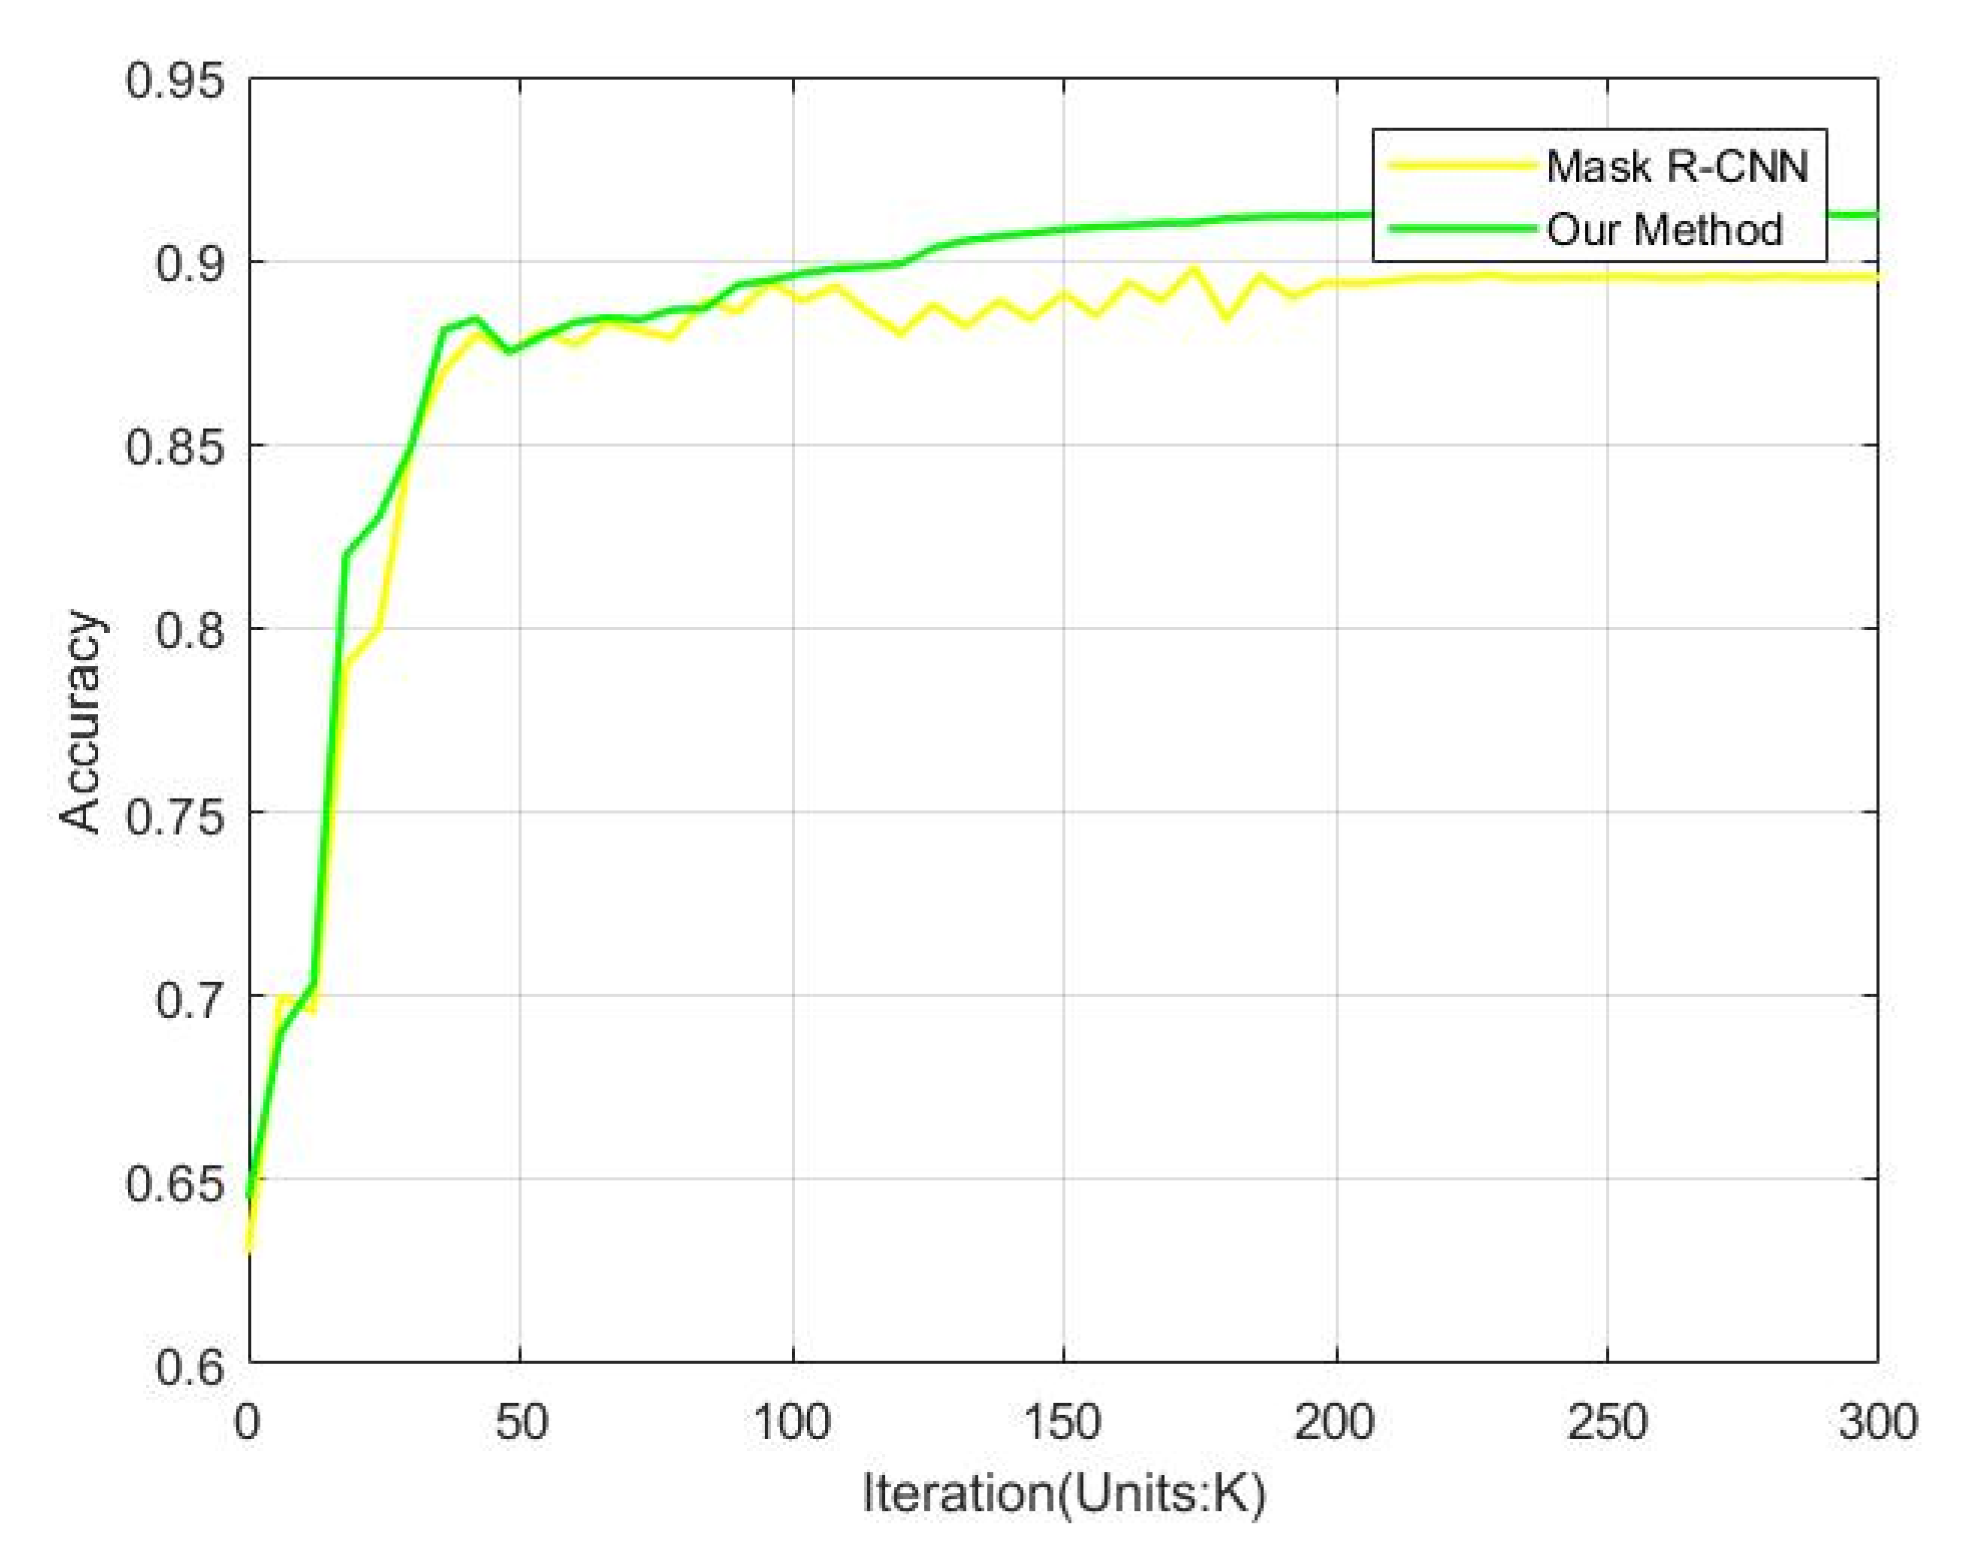
3.3. Performance Comparisons
4. Discussion
5. Conclusions
Author Contributions
Funding
Conflicts of Interest
References
- American Cancer Society. Available online: http://www.cancer.org/ (accessed on 15 December 2019).
- Canada Cancer Society. Available online: http://www.cancer.ca/ (accessed on 4 August 2019).
- Tian, Z.; Liu, L.; Fei, B. Deep convolutional neural network for prostate MR segmentation. In Society of Photo-Optical Instrumentation Engineers (SPIE) Conference Series; SPIE Medical Imaging: Orlando, FL, USA, 2017; p. 101351L. [Google Scholar]
- Arámbula Cosío, F.; Hèctor Acosta, G.; Conde, E. Improved edge detection for object segmentation in ultrasound images using Active Shape Models. In Proceedings of the International Symposium on Medical Information Processing & Analysis, Cartagena de Indias, Columbia, 1 January 2015; pp. 9287–9293. [Google Scholar]
- Ali, S.; Madabhushi, A. An integrated region-, boundary-, shape-based active contour for multiple object overlap resolution in histological imagery. IEEE Trans. Med. Imaging 2012, 31, 1448–1460. [Google Scholar] [CrossRef] [PubMed]
- Zhan, Y.; Shen, D. Automated Segmentation of 3D US Prostate Images Using Statistical Texture-Based Matching. In Proceedings of the Medical Image Computing and Computer-Assisted Intervention-MICCAI, Montréal, QC, Canada, 15–18 November 2003. [Google Scholar]
- He, K.; Zhang, X.; Ren, S.; Sun, J. Deep residual learning for image recognition. In Proceedings of the IEEE Conference on Computer Vision and Pattern Recognition, Las Vegas, NV, USA, 26 June–1 July 2016. [Google Scholar]
- He, K.; Gkioxari, G.; Dollar, P.; Girshick, R. Mask R-CNN. IEEE Trans. Pattern Anal. Mach. Intell. 2017, 8, 1–6. [Google Scholar]
- Belogay, E.; Cabrelli, C.; Molter, U.; Shonkwiler, R. Calculating the Hausdorff distance between curves. Inf. Process. Lett. 1997, 64, 17–22. [Google Scholar] [CrossRef]
- Yan, P.; Xu, S.; Kruecker, J.; Turkbey, B. Optimal search guided by partial active shape model for prostate segmentation in TRUS images. In Proceedings of the Medical Imaging 2009: Visualization, Image-Guided Procedures, and Modeling, Lake Buena Vista, FL, USA, 8–10 February 2009; pp. 7261–7272. [Google Scholar]
- Dice, L.R. Measures of the Amount of Ecologic Association between Species. Ecology 1945, 26, 297–302. [Google Scholar] [CrossRef]
- Badiei, S.; Salcudean, S.E.; Varah, J.; Morris, W.J. Prostate Segmentation in 2D Ultrasound Images Using Image Warping and Ellipse Fitting. In Proceedings of the International Conference on Computing and Computer-Assisted Intervention, Copenhagen, Denmark, 1 February 2006; pp. 17–24. [Google Scholar]
- Diaz, K.; Castaneda, B. Semi-automated segmentation of the prostate gland boundary in ultrasound images using a machine learning approach. In Proceedings of the Medical Imaging 2008: Image Processing. International Society for Optics and Photonics, San Diego, CA, USA, 17–19 February 2008; pp. 9144–9147. [Google Scholar]
- Long, J.; Shelhamer, E.; Darrell, T. Fully Convolutional Networks for Semantic Segmentation. IEEE Trans. Pattern Anal. Mach. Intell. 2014, 39, 640–651. [Google Scholar]
- Ronneberger, O.; Fischer, P.; Brox, T. U-Net: Convolutional Networks for Biomedical Image Segmentation. In Proceedings of the International Conference on Medical Image Computing & Computer-assisted Intervention, Munich, Germany, 18 May 2015; pp. 234–241. [Google Scholar]
- Badrinarayanan, V.; Kendall, A.; Cipolla, R. SegNet: A Deep Convolutional Encoder-Decoder Architecture for Scene Segmentation. IEEE Trans. Pattern Anal. Mach. Intell. 2017, 39, 2481–2495. [Google Scholar] [CrossRef] [PubMed]
- Chen, L.C.; Papandreou, G.; Schroff, F.; Adam, H. Rethinking Atrous Convolution for Semantic Image Segmentation. In Proceedings of the 2017 IEEE Conference on Computer Vision and Pattern Recognition, Honolulu, HI, USA, 21–26 July 2017; pp. 1–14. [Google Scholar]


| Aspect Ratio | >1:1 | 1:1 | <1:1 |
|---|---|---|---|
| Quantity | 2249 | 145 | 6 |
| Method | Accuracy (%) |
|---|---|
| Mask R-CNN | 89.57 |
| Our | 91.28 |
| Method | DSC | SP | SN | MAD (mm) | HD (mm) | RSD (10−2) | Time(s) |
|---|---|---|---|---|---|---|---|
| ASM | 0.9680 | 0.9884 | 0.9694 | 0.352 | 1.140 | 4.259 | 1.976 |
| FCN [14] | 0.8828 | 0.9275 | 0.8981 | 0.423 | 1.229 | 10.574 | 0.462 |
| U-Net [15] | 0.8953 | 0.9395 | 0.9069 | 0.405 | 1.220 | 9.636 | 0.483 |
| SegNet [16] | 0.9072 | 0.9501 | 0.9112 | 0.401 | 1.217 | 8.344 | 0.497 |
| Deeplab v3 [17] | 0.9439 | 0.9762 | 0.9386 | 0.372 | 1.185 | 6.015 | 0.348 |
| Mask R-CNN [8] | 0.9775 | 0.9974 | 0.9712 | 0.340 | 1.112 | 3.580 | 0.330 |
| Our | 0.9810 | 0.9983 | 0.9764 | 0.332 | 1.106 | 2.412 | 0.342 |
© 2020 by the authors. Licensee MDPI, Basel, Switzerland. This article is an open access article distributed under the terms and conditions of the Creative Commons Attribution (CC BY) license (http://creativecommons.org/licenses/by/4.0/).
Share and Cite
Geng, L.; Li, S.; Xiao, Z.; Zhang, F. Multi-Channel Feature Pyramid Networks for Prostate Segmentation, Based on Transrectal Ultrasound Imaging. Appl. Sci. 2020, 10, 3834. https://doi.org/10.3390/app10113834
Geng L, Li S, Xiao Z, Zhang F. Multi-Channel Feature Pyramid Networks for Prostate Segmentation, Based on Transrectal Ultrasound Imaging. Applied Sciences. 2020; 10(11):3834. https://doi.org/10.3390/app10113834
Chicago/Turabian StyleGeng, Lei, Simu Li, Zhitao Xiao, and Fang Zhang. 2020. "Multi-Channel Feature Pyramid Networks for Prostate Segmentation, Based on Transrectal Ultrasound Imaging" Applied Sciences 10, no. 11: 3834. https://doi.org/10.3390/app10113834
APA StyleGeng, L., Li, S., Xiao, Z., & Zhang, F. (2020). Multi-Channel Feature Pyramid Networks for Prostate Segmentation, Based on Transrectal Ultrasound Imaging. Applied Sciences, 10(11), 3834. https://doi.org/10.3390/app10113834