A Machine Learning Approach to Predict an Early Biochemical Recurrence after a Radical Prostatectomy

Abstract
1. Introduction
2. Materials and Methods
2.1. Patients
2.2. Acquisition of MR Images
2.3. Clinical, Imaging, and Surgical Parameters
2.4. Statistical Analysis and Machine Learning Model Development
2.4.1. Prediction of Early BCR Using Classification Methods
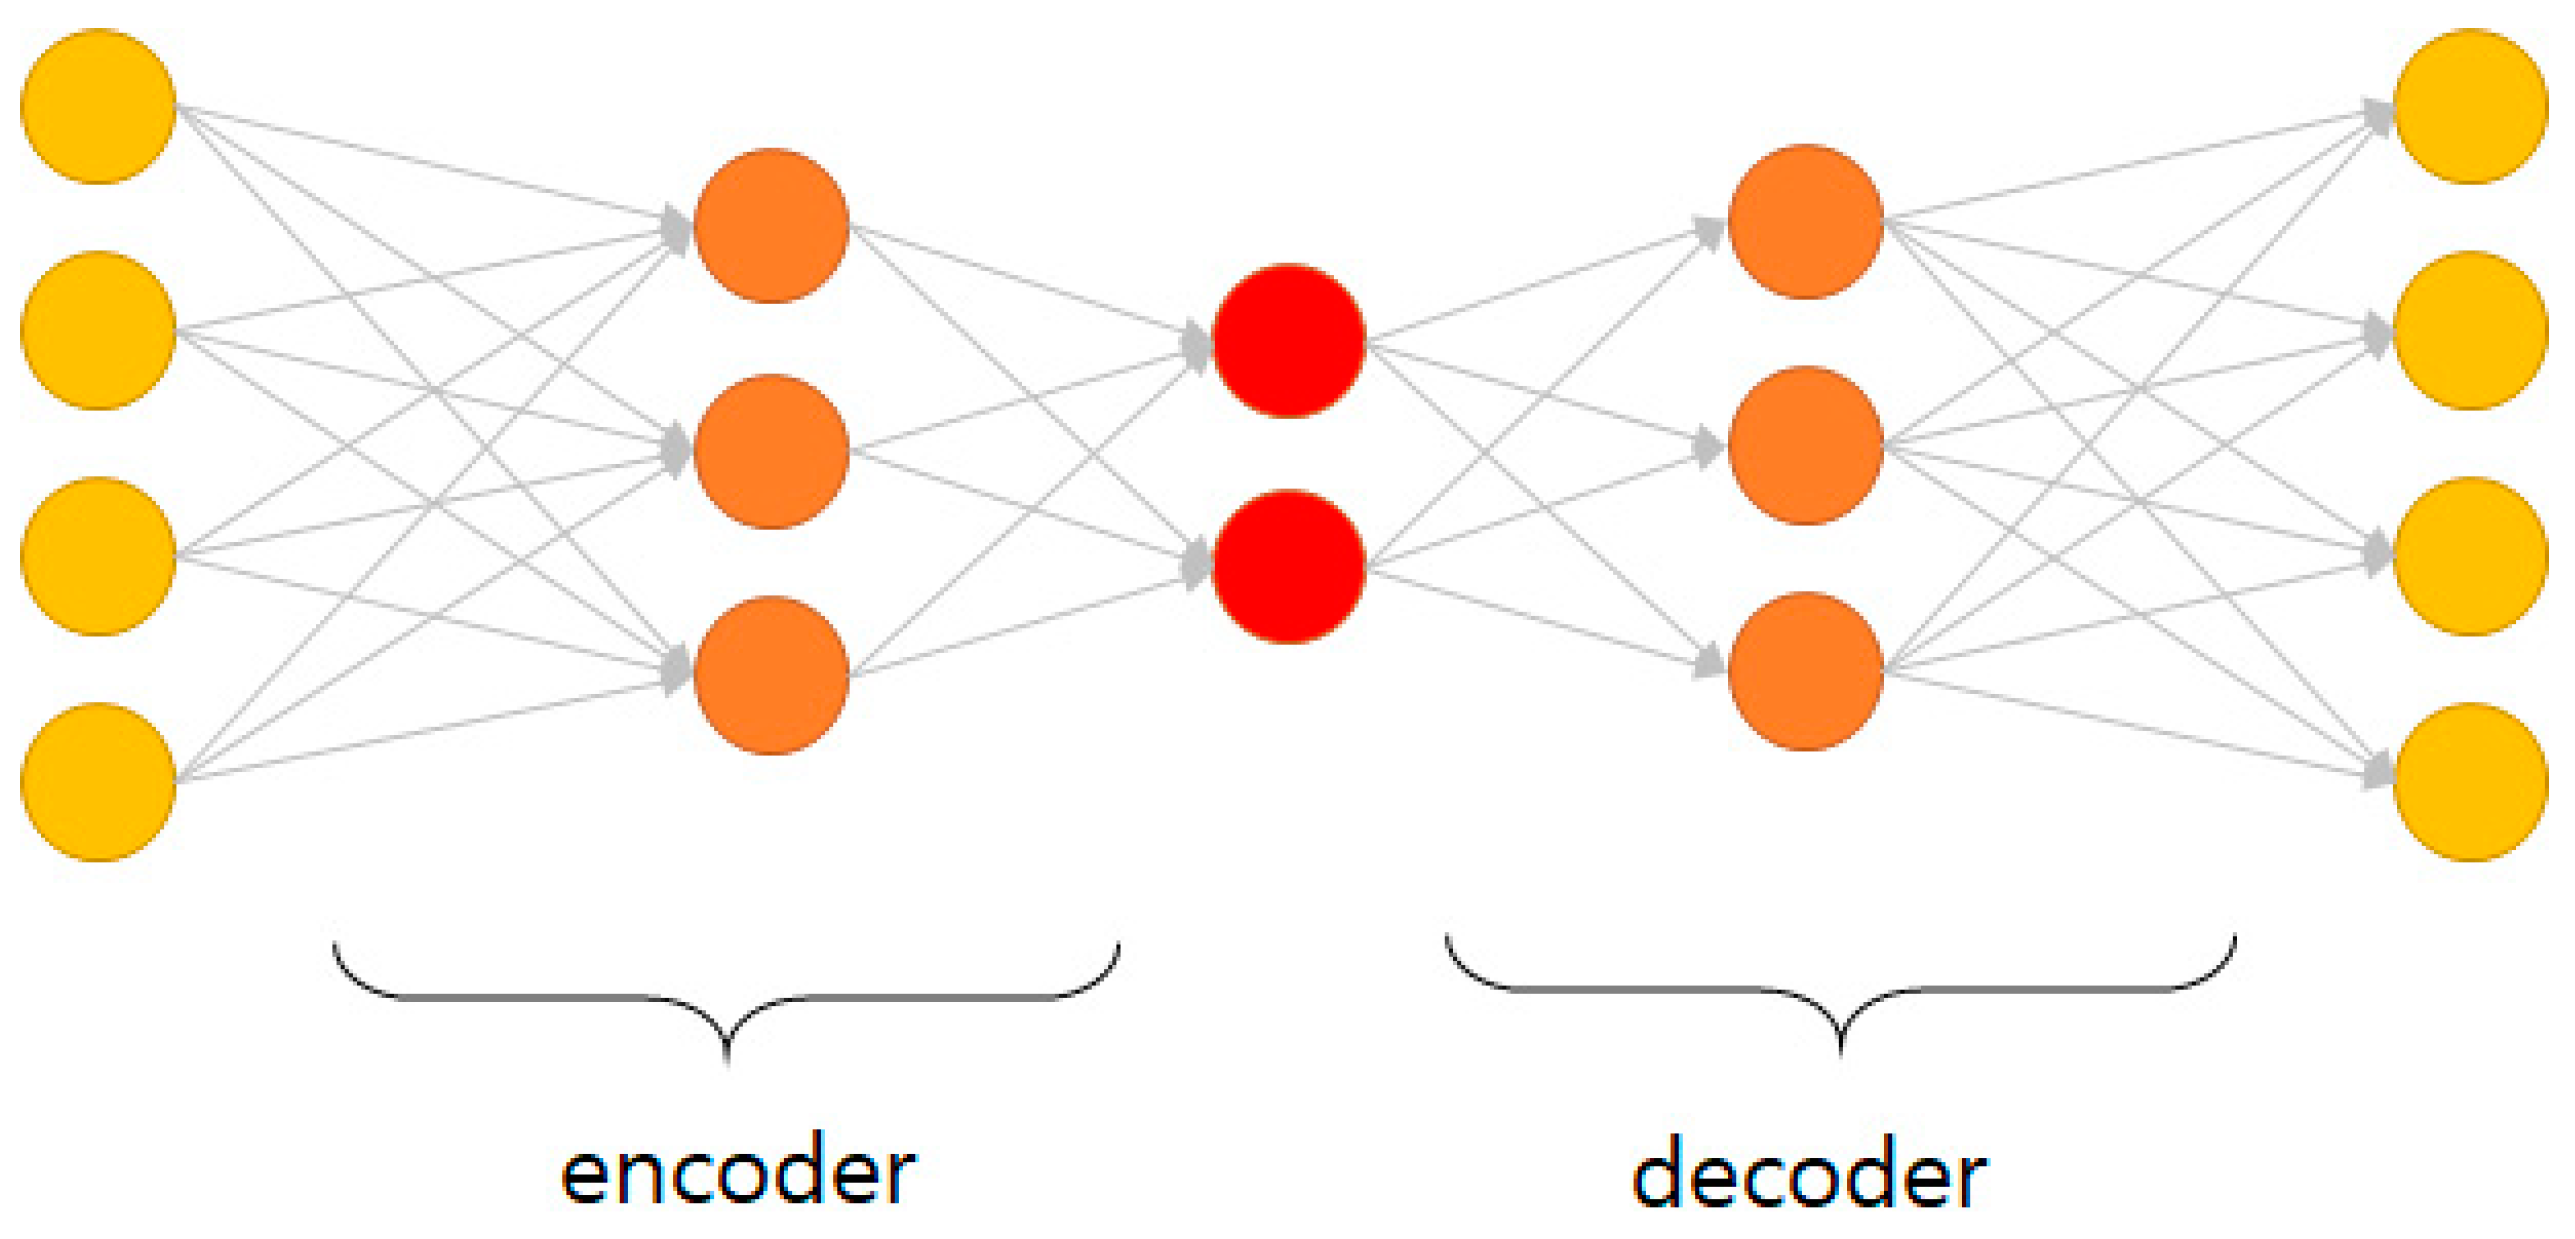
2.4.2. Prediction of Early BCR Using Auto-Encoder Methods
3. Results
3.1. Patient Demographics and Distribution
3.2. Prediction Models
4. Discussion
5. Conclusions
Author Contributions
Funding
Acknowledgments
Conflicts of Interest
References
- Stephenson, A.J.; Scardino, P.T.; Eastham, J.A.; Bianco, F.J.; Dotan, Z.A.; Fearn, P.A.; Kattan, M.W. Preoperative nomogram predicting the 10-year probability of prostate cancer recurrence after radical prostatectomy. J. Natl. Cancer Inst. 2006, 98, 715–717. [Google Scholar] [CrossRef]
- Pound, C.R.; Partin, A.W.; Eisenberger, M.A.; Chan, D.W.; Pearson, J.D.; Walsh, P.C. Natural History of Progression After PSA Elevation Following Radical Prostatectomy. JAMA 1999, 281, 1591. [Google Scholar] [CrossRef]
- Boorjian, S.A.; Thompson, R.H.; Tollefson, M.K.; Rangel, L.J.; Bergstralh, E.J.; Blute, M.L.; Karnes, R.J. Long-Term Risk of Clinical Progression After Biochemical Recurrence Following Radical Prostatectomy: The Impact of Time from Surgery to Recurrence. Eur. Urol. 2011, 59, 893–899. [Google Scholar] [CrossRef] [PubMed]
- Uchio, E.M.; Aslan, M.; Wells, C.K.; Calderone, J.; Concato, J. Impact of Biochemical Recurrence in Prostate Cancer Among US Veterans. Arch. Intern. Med. 2010, 170, 1390. [Google Scholar] [CrossRef] [PubMed]
- Cooperberg, M.R.; Pasta, D.; Elkin, E.P.; Litwin, M.S.; Latini, D.; Du Chane, J.; Carroll, P.R. The University of California, San Francisco Cancer of the Prostate Risk Assessment Score: A Straightforward And Reliable Preoperative Predictor of Disease Recurrence After Radical Prostatectomy. J. Urol. 2005, 173, 1938–1942. [Google Scholar] [CrossRef] [PubMed]
- Fuchsjäger, M.H.; Hricak, H.; Wang, L.; Touijer, K.; Donohue, J.F.; Eastham, J.A.; Kattan, M.W.; Shukla-Dave, A. Magnetic resonance imaging in the prediction of biochemical recurrence of prostate cancer after radical prostatectomy. BJU Int. 2009, 104, 315–320. [Google Scholar] [CrossRef]
- Zakian, K.L.; Hricak, H.; Ishill, N.; Reuter, V.E.; Eberhardt, S.; Moskowitz, C.S.; Shukla-Dave, A.; Wang, L.; Scardino, P.T.; Eastham, J.A.; et al. An Exploratory Study of Endorectal Magnetic Resonance Imaging and Spectroscopy of the Prostate as Preoperative Predictive Biomarkers of Biochemical Relapse After Radical Prostatectomy. J. Urol. 2010, 184, 2320–2327. [Google Scholar] [CrossRef][Green Version]
- Park, S.Y.; Kim, C.K.; Park, B.K.; Lee, H.M.; Lee, K.S. Prediction of biochemical recurrence following radical prostatectomy in men with prostate cancer by diffusion-weighted magnetic resonance imaging: Initial results. Eur. Radiol. 2010, 21, 1111–1118. [Google Scholar] [CrossRef]
- Park, J.J.; Kim, C.K.; Park, S.Y.; Park, B.K.; Lee, H.M.; Cho, S.W. Prostate Cancer: Role of Pretreatment Multiparametric 3-T MRI in Predicting Biochemical Recurrence After Radical Prostatectomy. Am. J. Roentgenol. 2014, 202, W459–W465. [Google Scholar] [CrossRef]
- Westphalen, A.C.; Koff, W.J.; Coakley, F.V.; Muglia, V.F.; Neuhaus, J.M.; Marcus, R.T.; Kurhanewicz, J.; Smith-Bindman, R. Prostate cancer: Prediction of biochemical failure after external-beam radiation therapy—Kattan nomogram and endorectal MR imaging estimation of tumor volume. Radiology 2011, 261, 477–486. [Google Scholar] [CrossRef]
- Riaz, N.; Afaq, A.; Akin, O.; Pei, X.; Kollmeier, M.A.; Cox, B.; Hricak, H.; Zelefsky, M.J. Pretreatment Endorectal Coil Magnetic Resonance Imaging Findings Predict Biochemical Tumor Control in Prostate Cancer Patients Treated with Combination Brachytherapy and External-Beam Radiotherapy. Int. J. Radiat. Oncol. 2012, 84, 707–711. [Google Scholar] [CrossRef] [PubMed]
- Park, S.Y.; Oh, Y.T.; Jung, D.C.; Cho, N.H.; Choi, Y.D.; Rha, K.H.; Hong, S.J. Prediction of biochemical recurrence after radical prostatectomy with PI-RADS version 2 in prostate cancers: Initial results. Eur. Radiol. 2015, 26, 2502–2509. [Google Scholar] [CrossRef] [PubMed]
- Cookson, M.S.; Aus, G.; Burnett, A.L.; Canby-Hagino, E.D.; D’Amico, A.V.; Dmochowski, R.R.; Eton, D.; Forman, J.D.; Goldenberg, S.L.; Hernández, J.; et al. Variation in the Definition of Biochemical Recurrence in Patients Treated for Localized Prostate Cancer: The American Urological Association Prostate Guidelines for Localized Prostate Cancer Update Panel Report and Recommendations for a Standard in the Reporting of Surgical Outcomes. J. Urol. 2007, 177, 540–545. [Google Scholar] [CrossRef] [PubMed]
- Tanimoto, R.; Fashola, Y.; Scotland, K.B.; E Calvaresi, A.; Gomella, L.G.; Trabulsi, E.J.; Lallas, C.D. Risk factors for biochemical recurrence after robotic assisted radical prostatectomy: A single surgeon experience. BMC Urol. 2015, 15, 27. [Google Scholar] [CrossRef]
- Murphy, K.P. Machine Learning: A Probabilistic Perspective; MIT Press: Cambridge, MA, USA, 2012. [Google Scholar]
- Lee, S.; Yu, S.; Kim, Y.; Kim, J.K.; Hong, J.; Kim, C.S.; Seo, S.; Byun, S.-S.; Jeong, C.W.; Lee, J.Y.; et al. Prediction System for Prostate Cancer Recurrence Using Machine Learning. Appl. Sci. 2020, 10, 1333. [Google Scholar] [CrossRef]
- Han, M.; Partin, A.W.; Zahurak, M.; Piantadosi, S.; Epstein, J.I.; Walsh, P.C. Biochemical (prostate specific antigen) recurrence probability following radical prostatectomy for clinically localized prostate cancer. J. Urol. 2003, 169, 517–523. [Google Scholar] [CrossRef]
- Sooriakumaran, P.; Haendler, L.; Nyberg, T.; Grönberg, H.; Nilsson, A.; Carlsson, S.; Hosseini, A.; Adding, C.; Jonsson, M.; Ploumidis, A.; et al. Biochemical Recurrence after Robot-assisted Radical Prostatectomy in a European Single-centre Cohort with a Minimum Follow-up Time of 5 Years. Eur. Urol. 2012, 62, 768–774. [Google Scholar] [CrossRef]
- Brajtbord, J.S.; Leapman, M.S.; Cooperberg, M.R. The CAPRA Score at 10 Years: Contemporary Perspectives and Analysis of Supporting Studies. Eur. Urol. 2017, 71, 705–709. [Google Scholar] [CrossRef]
- Brockman, J.A.; Alanee, S.; Vickers, A.; Scardino, P.T.; Wood, D.P.; Kibel, A.S.; Lin, D.W.; Bianco, F.J., Jr.; Rabah, D.; Klein, E.A.; et al. Nomogram Predicting Prostate Cancer-specific Mortality for Men with Biochemical Recurrence after Radical Prostatectomy. Eur. Urol. 2014, 67, 1160–1167. [Google Scholar] [CrossRef]
- The SEARCH Database Study Group; Freedland, S.J.; Aronson, W.J.; Terris, M.K.; Kane, C.J.; Amling, C.L.; Dorey, F.; Presti, J.C. Percent of Prostate Needle Biopsy Cores with Cancer is Significant Independent Predictor of Prostate Specific Antigen Recurrence Following Radical Prostatectomy: Results from SEARCH Database. J. Urol. 2003, 169, 2136–2141. [Google Scholar] [CrossRef]
- Grossfeld, G.D.; Latini, D.; Lubeck, D.P.; Broering, J.M.; Li, Y.P.; Mehta, S.S.; Carroll, P.R. Predicting disease recurrence in intermediate and high-risk patients undergoing radical prostatectomy using percent positive biopsies: Results from CaPSURE. Urology 2002, 59, 560–565. [Google Scholar] [CrossRef]
- Freedland, S.J.; Humphreys, E.B.; Mangold, L.A.; Eisenberger, M.; Dorey, F.J.; Walsh, P.C.; Partin, A.W. Risk of Prostate Cancer–Specific Mortality Following Biochemical Recurrence after Radical Prostatectomy. JAMA 2005, 294, 433. [Google Scholar] [CrossRef] [PubMed]
- Egevad, L.; Granfors, T.; Karlberg, L.; Bergh, A.; Stattin, P. Prognostic value of the Gleason score in prostate cancer. BJU Int. 2002, 89, 538–542. [Google Scholar] [CrossRef] [PubMed]
- Goto, Y.; Ohori, M.; Scardino, P.T. Use of systematic biopsy results to predict pathologic stage in patients with clinically localized prostate cancer: A preliminary report. Int. J. Urol. 1998, 5, 337–342. [Google Scholar] [CrossRef] [PubMed]
- Wills, M.L.; Sauvageot, J.; Partin, A.W.; Gurganus, R.; Epstein, J.I. Ability of sextant biopsies to predict radical prostatectomy stage. Urology 1998, 51, 759–764. [Google Scholar] [CrossRef]
- Ravery, V.; Schmid, H.P.; Toublanc, M.; Boccon-Gibod, L. Is the percentage of cancer in biopsy cores predictive of extracapsular disease in T1-T2 prostate carcinoma? Cancer 1996, 78, 1079–1084. [Google Scholar] [CrossRef]
- Huang, I.-S.; Lin, A.T.L.; Wu, H.H.; Chung, H.-J.; Kuo, J.-Y.; Lin, T.-P.; Huang, W.J.; Chang, Y.-H.; Huang, E.Y.-H.; Chen, K.-K. Prostate cancer detection and complication rates with transrectal ultrasound-guided prostate biopsies among different operators. Urol. Sci. 2012, 23, 78–81. [Google Scholar] [CrossRef]
- Barentsz, J.O.; Richenberg, J.; Clements, R.; Choyke, P.; Verma, S.; Villeirs, G.; Rouvière, O.; Løgager, V.B.; Fütterer, J.J.; Radiology, E.S.O.U. ESUR prostate MR guidelines 2012. Eur. Radiol. 2012, 22, 746–757. [Google Scholar] [CrossRef]
- Weinreb, J.; Barentsz, J.O.; Choyke, P.L.; Cornud, F.; Haider, M.A.; Macura, K.J.; Margolis, D.; Schnall, M.D.; Shtern, F.; Tempany, C.M.; et al. PI-RADS Prostate Imaging-Reporting and Data System: 2015, Version 2. Eur. Urol. 2015, 69, 16–40. [Google Scholar] [CrossRef]
- Turkbey, B.; Rosenkrantz, A.B.; Haider, M.A.; Padhani, A.R.; Villeirs, G.; Macura, K.J.; Tempany, C.M.; Choyke, P.L.; Cornud, F.; Margolis, D.J.; et al. Prostate Imaging Reporting and Data System Version 2.1: 2019 Update of Prostate Imaging Reporting and Data System Version 2. Eur. Urol. 2019, 76, 340–351. [Google Scholar] [CrossRef]
- Vargas, H.A.; Akin, O.; Franiel, T.; Mazaheri, Y.; Zheng, J.; Moskowitz, C.; Udo, K.; Eastham, J.; Hricak, H. Diffusion-weighted endorectal MR imaging at 3 T for prostate cancer: Tumor detection and assessment of aggressiveness. Radiology 2011, 259, 775–784. [Google Scholar] [CrossRef] [PubMed]
- Vos, E.; Litjens, G.; Kobus, T.; Hambrock, T.; De Kaa, C.A.H.-V.; Barentsz, J.O.; Huisman, H.; Scheenen, T.W. Assessment of Prostate Cancer Aggressiveness Using Dynamic Contrast-enhanced Magnetic Resonance Imaging at 3 T. Eur. Urol. 2013, 64, 448–455. [Google Scholar] [CrossRef] [PubMed]
- American Collage of Radiology. PI-RADS v2. Available online: https://www.acr.org/-/media/ACR/Files/RADS/Pi-RADS/PIRADS-V2.pdf (accessed on 23 April 2020).
- Wong, N.C.; Lam, C.; Patterson, L.; Shayegan, B. Use of machine learning to predict early biochemical recurrence after robot-assisted prostatectomy. BJU Int. 2018, 123, 51–57. [Google Scholar] [CrossRef] [PubMed]
- Peduzzi, P.; Concato, J.; Kemper, E.; Holford, T.R.; Feinstein, A.R. A simulation study of the number of events per variable in logistic regression analysis. J. Clin. Epidemiol. 1996, 49, 1373–1379. [Google Scholar] [CrossRef]
- Katz, M.H. Multivariable analysis: A primer for readers of medical research. Ann. Intern. Med. 2003, 138, 644–650. [Google Scholar] [CrossRef]


| BCR (n = 20) | Non-BCR (n = 84) | p-Value | |
|---|---|---|---|
| preoperative clinical characteristics | |||
| Age (yr, range) † | 70.5 (62–82) | 2.0 (52–83) | 0.911 |
| PSA (ng/mL) † | 14.8 (4.2–153.3) | 7.165 (2.7–426.6) | 0.031 |
| Greatest percentage of biopsy core † | 64.0 (19–100) | 29.0 (1–100) | 0.000 |
| Number of positive biopsy cores † | 6 (2–12) | 3 (1–12) | 0.000 |
| ISUP category and biopsy Gleason score | 0.034 | ||
| 1, 6 (3 + 3) | 0 (0.0%) | 13 (15.5%) | |
| 2, 7 (3 + 4) | 2 (10.0%) | 17 (20.2%) | |
| 3, 7 (4 + 3) | 5 (25.0%) | 29 (34.5%) | |
| 4, 8 | 8 (40.0%) | 13 (15.5%) | |
| 5, 9–10 | 5 (25.0%) | 12 (14.3%) | |
| preoperative imaging finding | |||
| prostate volume at MRI (mL) | 34.0 (24.0–93.6) | 40.4 (19.3–98.3) | 0.632 |
| PIRADS | 0.029 | ||
| 2 | 1 (5.0%) | 9 (10.7%) | |
| 3 | 0 (0.0%) | 18 (21.4%) | |
| 4 | 7 (35.0%) | 32 (38.1%) | |
| 5 | 12 (60.0%) | 25 (29.8%) | |
| Extracapsular extension at MRI | 0.001 | ||
| negative | 7 (35.0%) | 65 (77.4%) | |
| probable positive | 8 (40.0%) | 13 (15.5%) | |
| positive | 5 (25.0%) | 6 (7.1%) | |
| Seminal vesical invasion at MRI | 0.156 | ||
| negative | 15 (75.0%) | 75 (89.3%) | |
| probable positive | 5 (25.0%) | 8 (9.5%) | |
| positive | 0 (0.0%) | 1 (1.2%) | |
| postoperative parameters | |||
| ISUP category and surgical Gleason score | 0.089 | ||
| 1, 6 (3 + 3) | 0 (0.0%) | 14 (16.7%) | |
| 2, 7 (3 + 4) | 3 (15.0%) | 26 (31.0%) | |
| 3, 7 (4 + 3) | 9 (45.0%) | 26 (31.0%) | |
| 4, 8 | 4 (20.0%) | 8 (9.5%) | |
| 5, 9–10 | 4 (20.0%) | 10 (11.9%) | |
| tumor volume (mL) | 11.0 (1.8–51.1) | 3.8 (0.3–74.2) | 0.002 |
| Positive surgical margin | 0.027 | ||
| Positive | 6 (30.0%) | 49 (58.3%) | |
| Negative | 14 (70.0%) | 35 (41.7%) | |
| Lymphovascular invasion | 0.020 | ||
| Positive | 13 (65.0%) | 74 (88.1%) | |
| Negative | 7 (35.0%) | 10 (11.9%) | |
| Perineural invasion | 0.016 | ||
| Positive | 2 (10.0%) | 32 (38.1%) | |
| Negative | 18 (90.0%) | 52 (61.9%) | |
| Extracapsular extension | 0.185 | ||
| Positive | 11 (55.0%) | 60 (71.4%) | |
| Negative | 9 (45.0%) | 24 (28.6%) | |
| Seminal vesical invasion | 0.186 | ||
| Positive | 15 (75.0%) | 73 (86.9%) | |
| Negative | 5 (25.0%) | 11 (13.1%) | |
| Accuracy | Sensitivity | Specificity | AUC | |
|---|---|---|---|---|
| preoperative and postoperative parameters | ||||
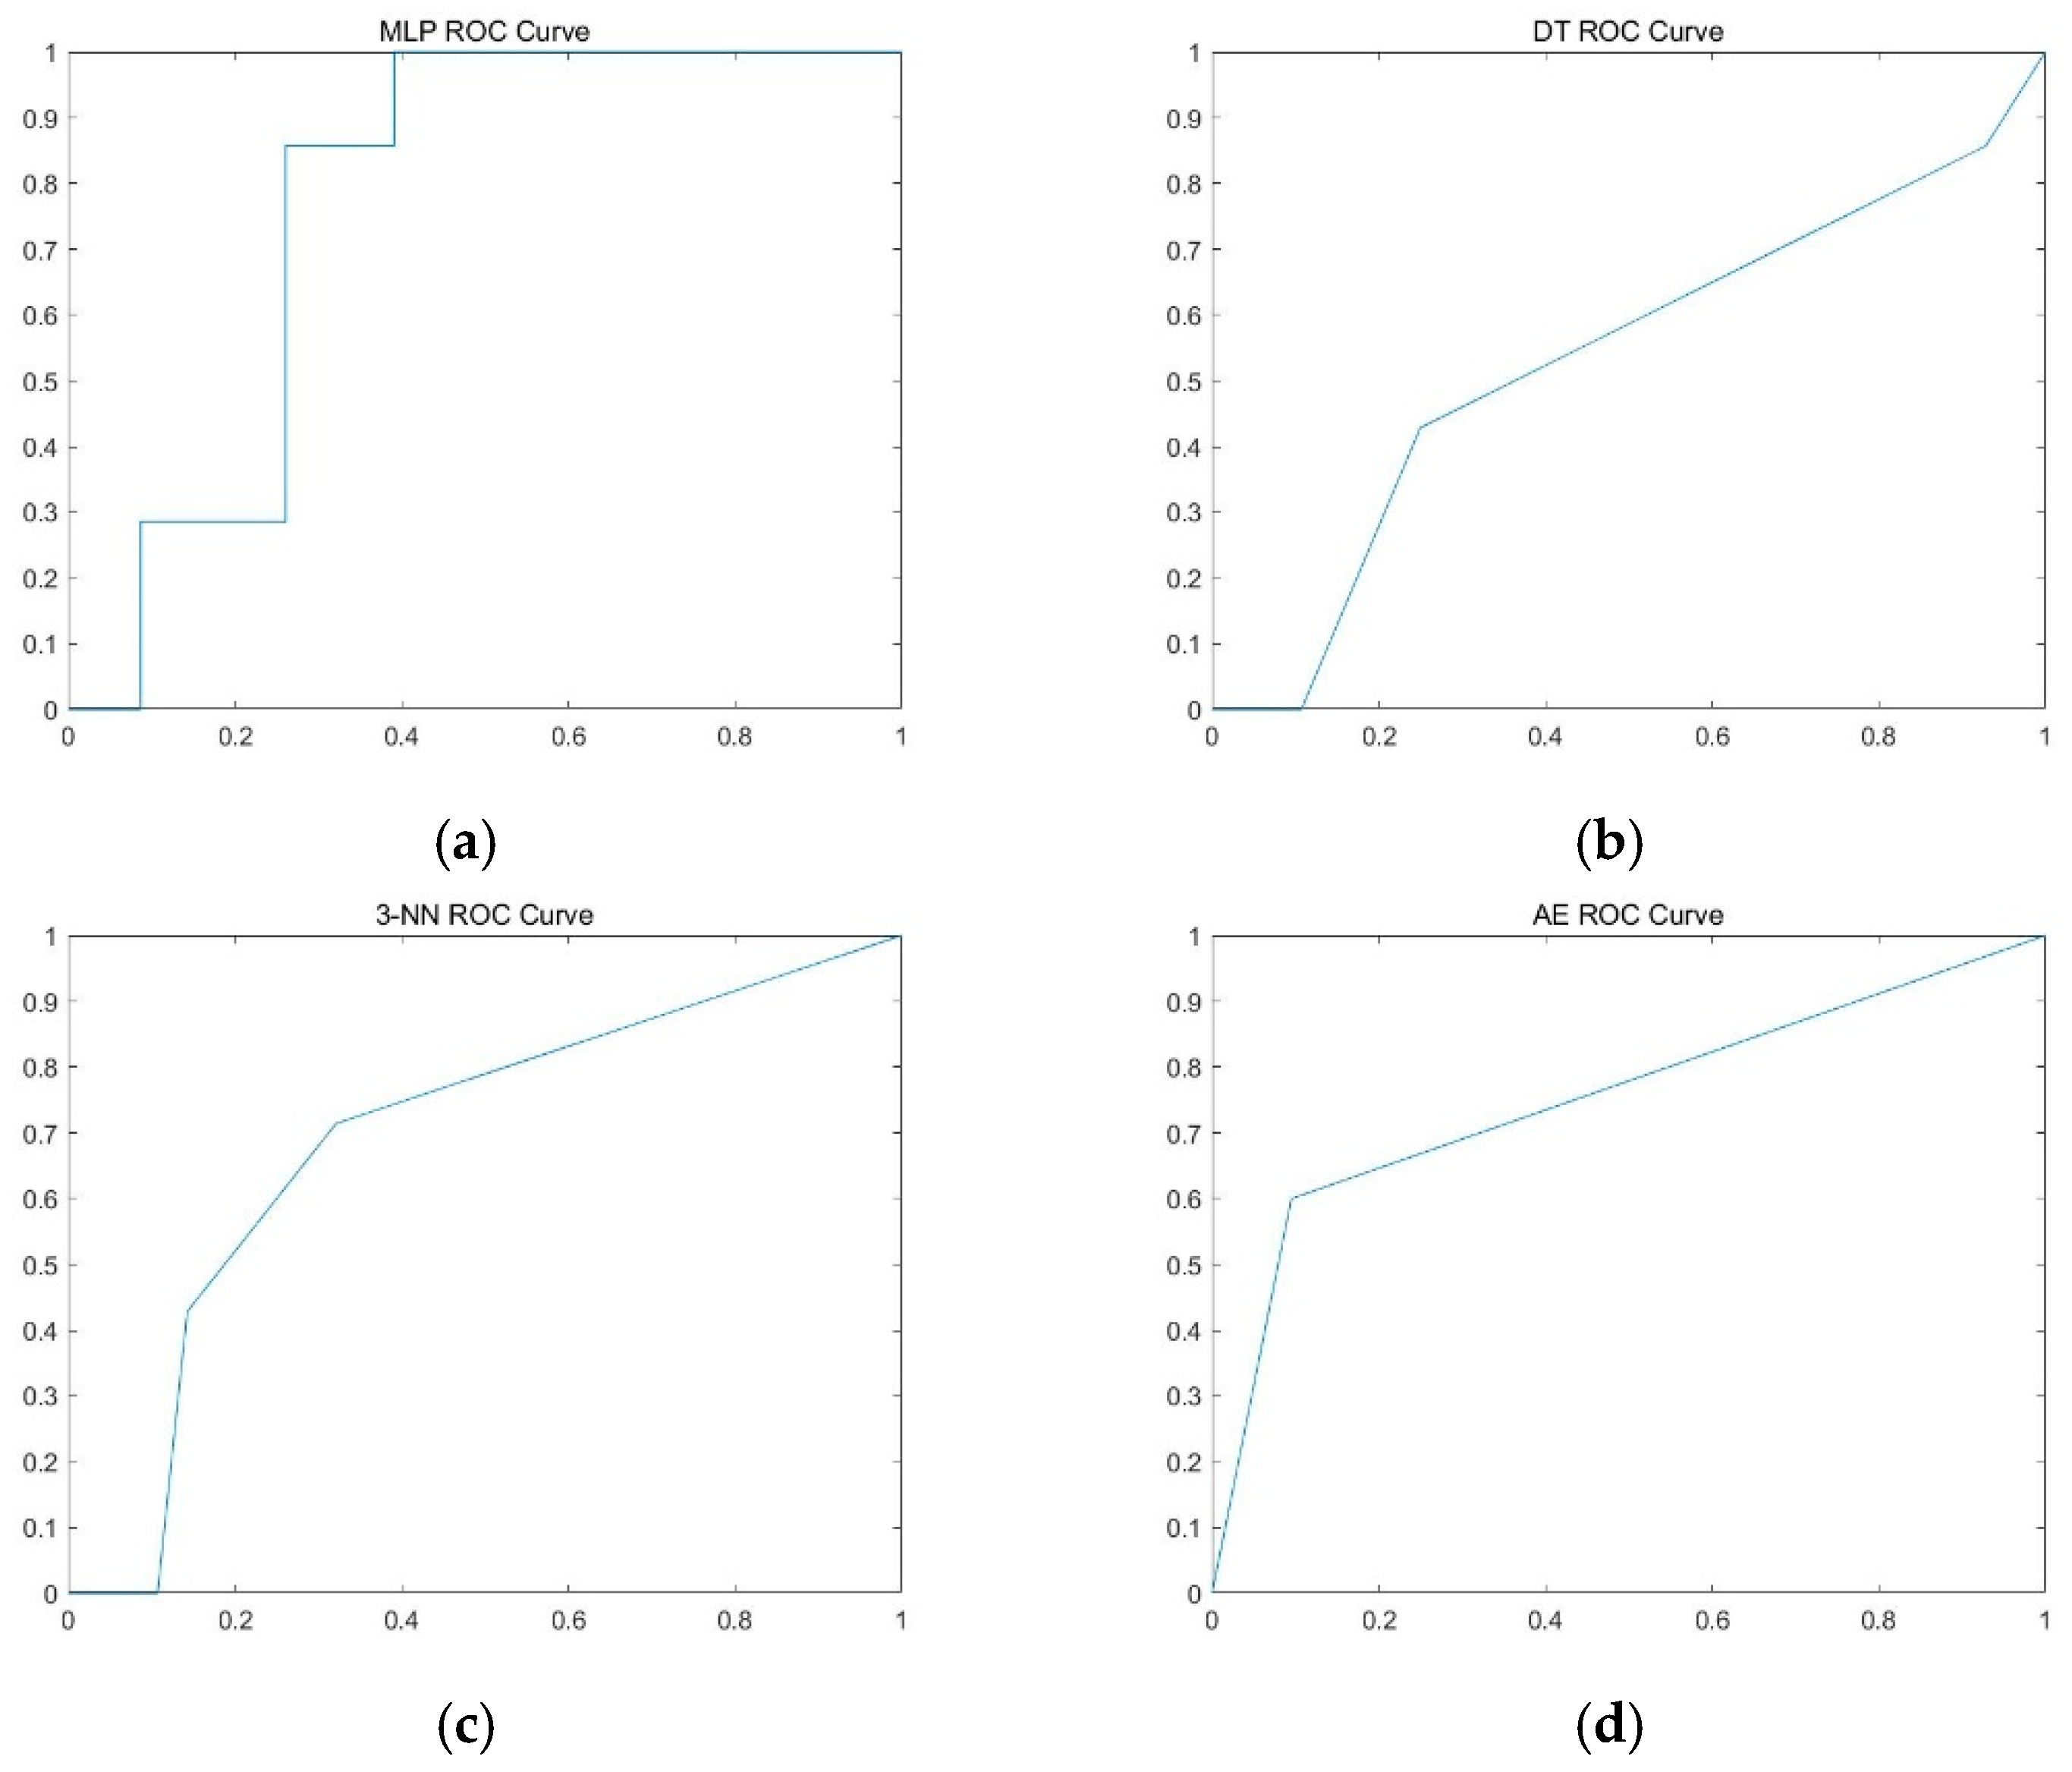
| MLP | 78.8 ± 6.1% | 16.7 ± 23.8% | 93.2 ± 2.8% | 0.607 ± 0.102 |
| DT | 71.1 ± 6.5% | 23.6 ± 22.7% | 83.1 ± 8.0% | 0.534 ± 0.126 |
| 3-NN | 83.4 ± 4.9% | 22.1 ± 18.9% | 97.0 ± 3.0% | 0.596 ± 0.092 |
| Auto-encoder | 63.8 ± 5.6% | 61.0 ± 9.7% | 66.6 ± 9.7% | 0.638 ± 0.055 |
| postoperative parameters only | ||||
| MLP | 76.1 ± 5.8% | 12.6 ± 11.5% | 92.8 ± 7.3% | 0.598 ± 0.188 |
| DT | 70.2 ± 8.0% | 13.6 ± 16.1% | 85.4 ± 8.1% | 0.495 ± 0.093 |
| 3-NN | 72.3 ± 6.6% | 30.4 ± 17.4% | 83.8 ± 9.1% | 0.571 ± 0.075 |
| Auto-encoder | 65.8 ± 6.5% | 61.5 ± 10.3% | 69.7 ± 10.3% | 0.656 ± 0.065 |
© 2020 by the authors. Licensee MDPI, Basel, Switzerland. This article is an open access article distributed under the terms and conditions of the Creative Commons Attribution (CC BY) license (http://creativecommons.org/licenses/by/4.0/).
Share and Cite
Park, S.; Byun, J.; Woo, J.y. A Machine Learning Approach to Predict an Early Biochemical Recurrence after a Radical Prostatectomy. Appl. Sci. 2020, 10, 3854. https://doi.org/10.3390/app10113854
Park S, Byun J, Woo Jy. A Machine Learning Approach to Predict an Early Biochemical Recurrence after a Radical Prostatectomy. Applied Sciences. 2020; 10(11):3854. https://doi.org/10.3390/app10113854
Chicago/Turabian StylePark, Seongkeun, Jieun Byun, and Ji young Woo. 2020. "A Machine Learning Approach to Predict an Early Biochemical Recurrence after a Radical Prostatectomy" Applied Sciences 10, no. 11: 3854. https://doi.org/10.3390/app10113854
APA StylePark, S., Byun, J., & Woo, J. y. (2020). A Machine Learning Approach to Predict an Early Biochemical Recurrence after a Radical Prostatectomy. Applied Sciences, 10(11), 3854. https://doi.org/10.3390/app10113854