Optimisation of Shear and Lateral–Torsional Buckling of Steel Plate Girders Using Meta-Heuristic Algorithms


1
Department of Civil Engineering, Turkish-German University, Sahinkaya Cad 86, Istanbul 34820, Turkey
2
Department of Civil Engineering, Istanbul University – Cerrahpaşa, 34310 Istanbul, Turkey
3
Department of Civil and Environmental Engineering, Temple University, Philadelphia, PA 19122, USA
4
College of IT Convergence, Gachon University, Seongnam 13120, Korea
*
Authors to whom correspondence should be addressed.
Appl. Sci. 2020, 10(10), 3639; https://doi.org/10.3390/app10103639
Submission received: 24 April 2020
/
Revised: 20 May 2020
/
Accepted: 20 May 2020
/
Published: 25 May 2020
(This article belongs to the Special Issue Harmony Search Algorithm - Theoretical Background and Practical Applications)
Abstract
:The shear buckling of web plates and lateral–torsional buckling are among the major failure modes of plate girders. The importance of the lateral–torsional buckling capacity of plate girders was further evidenced when several plate girders of a bridge in Edmonton, Alberta, Canada failed in 2015, because insufficient bracing led to the lateral buckling of the plate girders. In this study, we focus on the optimisation of the cross-sections of plate girders using a well-known and extremely efficient meta-heuristic optimisation algorithm called the harmony search algorithm. The objective of this optimisation is to design the cross-sections of the plate girders with the minimum area that satisfies requirements, such as the lateral–torsional buckling load and ultimate shear stress. The base geometry, material properties, applied load and boundary conditions were taken from an experimental study and optimised. It was revealed that the same amount of load-carrying capacity demonstrated by this model can be achieved with a cross-sectional area 16% smaller than that of the original specimen. Furthermore, the slenderness of the web plate was found to have a decisive effect on the cost-efficiency of the plate girder design.
1. Introduction
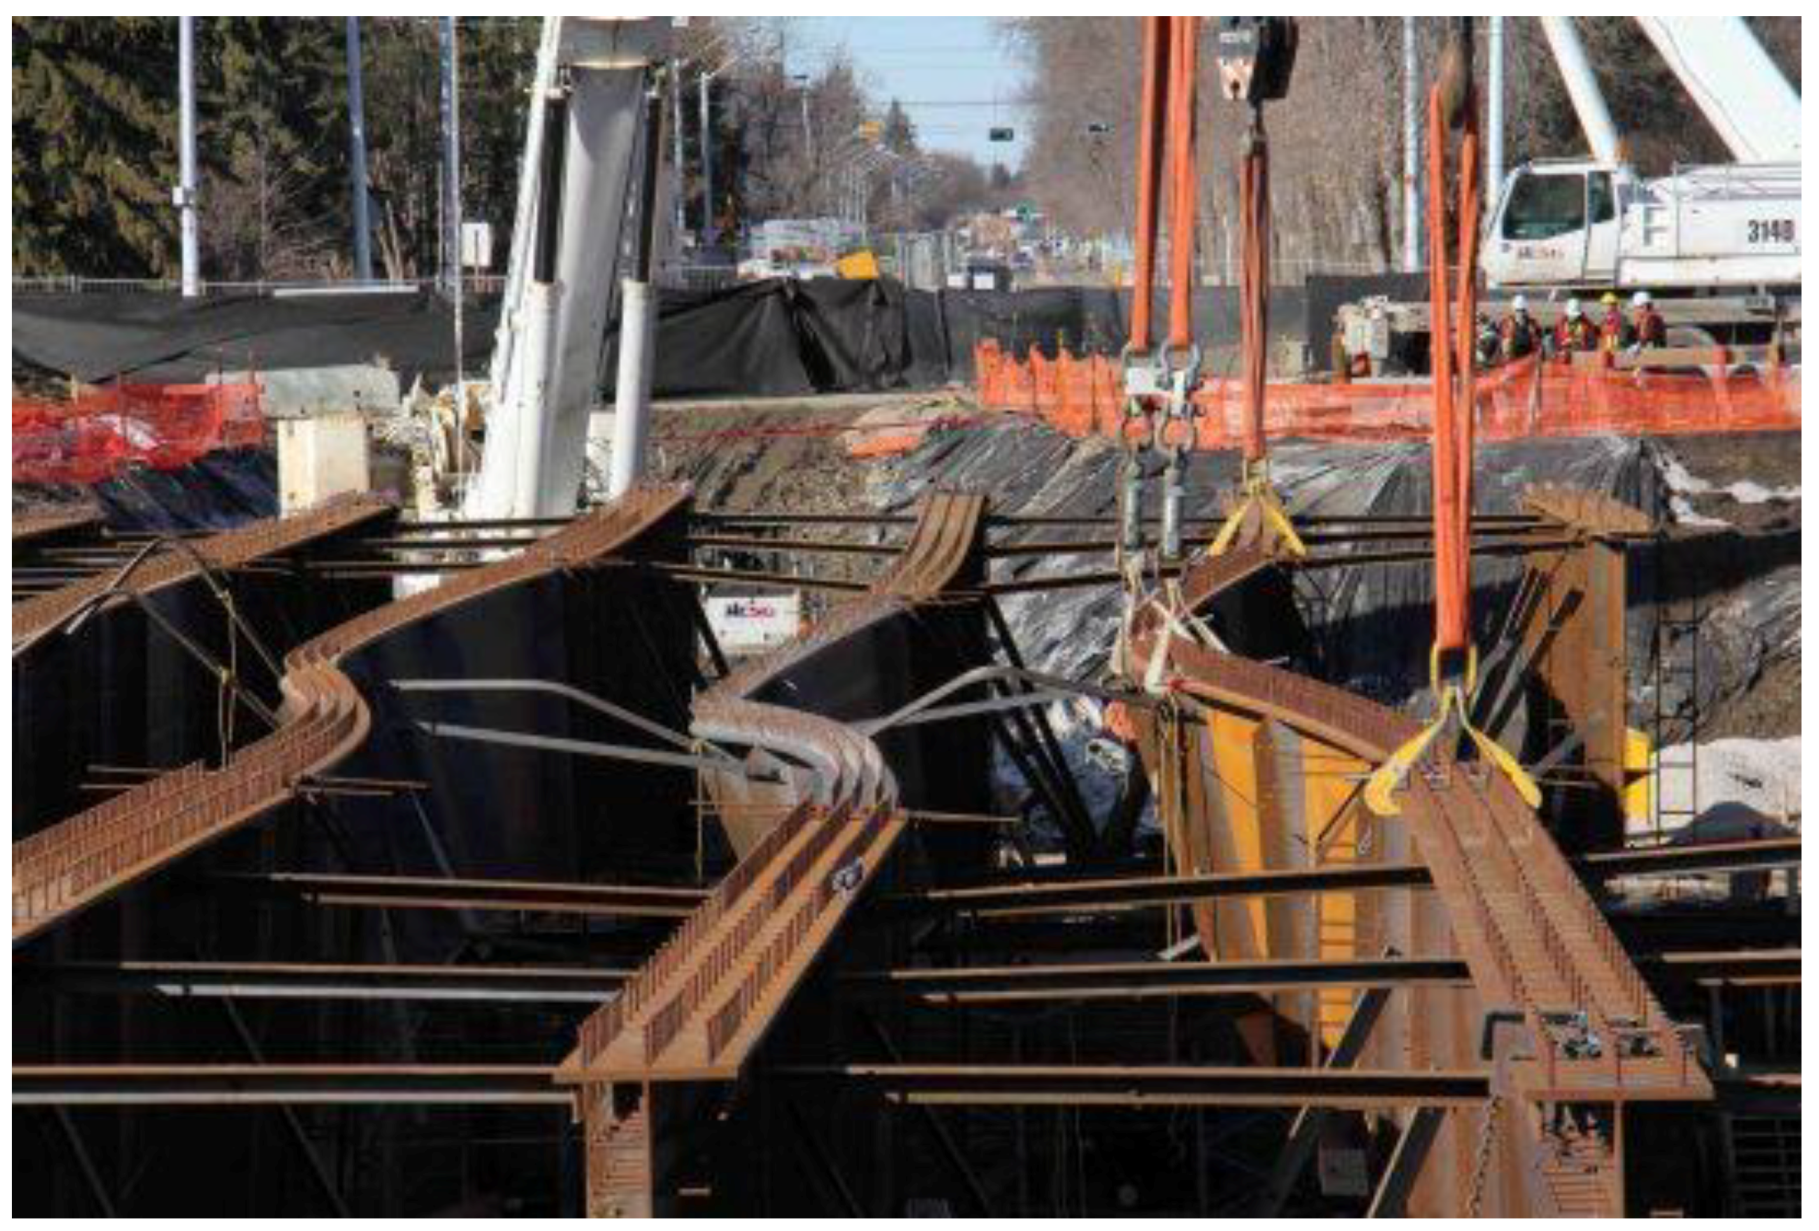
Plate girders are prone to buckling under various load combinations because they are made of thin plate elements. The web part of these members carries the shear loads; therefore, shear buckling is a critical phenomenon affecting the web plates of I-shaped plate girders. The out-of-plane shear buckling resistance of plate girders is often increased by applying transverse stiffeners or corrugated webs. While the web of the plate girders is the primary element resisting the shear buckling, the flanges are the primary elements carrying the bending and torsional loads. Therefore, in addition to the shear buckling analysis, the design of plate girders also involves the lateral–torsional buckling of structural members. Figure 1 illustrates an example of lateral plate girder buckling during the process of installation on a bridge.
The design of plate girders with the highest possible load-carrying capacity within cost and material restraints consists of finding the optimal combination of plate thicknesses, web plate slenderness, and stiffener spacing [1,2,3]. Furthermore, to obtain an adequate dimension of steel I-girders, both lateral–torsional and shear buckling should be considered in all construction stages.
Figure 1.
Lateral buckling of bridge plate girders in Edmonton, Alberta, Canada [4].
Figure 1.
Lateral buckling of bridge plate girders in Edmonton, Alberta, Canada [4].
In this study, the flange and web dimensions of a doubly symmetric I-shaped plate girder are optimised. For the optimisation, a novel meta-heuristic optimisation algorithm called the harmony search algorithm is applied. Optimised cross-sectional dimensions were obtained with a satisfactory amount of computational overhead leading to a significant reduction in the cross-sectional area.
1.1. Shear Capacity
Steel plates under shear loads are known to exhibit a significant amount of load-carrying capacity in the post-buckling regime [5]. This structural behaviour was thoroughly investigated by the researchers and attributed to the existence of tensile stresses acting in the diagonal direction of the plates after the onset of shear buckling [2,6,7]. These areas along the diagonal axis of the web plate where tensile stresses acts can also be seen in Figure 2. Their research led to the development of various models for the prediction of the post-buckling shear capacity of web plates based on the concept of a tension field along the plate diagonal. Tension field theory is often used as an umbrella term for these models. This theory is based on the observation that the stiffeners of a plate girder take up the compressive stresses resulting from the shear forces, and the web plate resists buckling owing to shear forces produced by tensile stresses forming along the diagonal axis of the plate [8,9]. Among the models of tension field theory, the theory developed by Basler [6] gained the most widespread acceptance in the research community; this model was also described in [10]. On the other hand, the model developed by Porter [11] and the rotated stress field method developed by Höglund [12] are included in the European design codes [13].
Figure 3 shows a schematic of the tension field on a girder panel surrounded by flanges and transverse stiffeners, where denotes the width of the tension field of a web plate under the ultimate postbuckling shear stress . The plate in Figure 3 represents the unstiffened part of a plate girder web and is assumed to be simply supported (SS) at all edges. Basler [6] developed an equation that predicts . This equation was later modified by Fujii [15], Gaylord [16], and Selberg [17] as follows:
Once is known, the ultimate postbuckling shear force can be obtained as where is the depth of the plate (see Figure 3), and is the thickness of the web plate.
In Equation (1), is the angle of the web panel diagonal, is the yield strength of the plate material, from which the shear yield strength can be obtained as The elastic shear buckling strength in Equation (1) is calculated as follows [18]:
where is the modulus of elasticity, is the Poisson’s ratio, is the slenderness ratio, and is the shear buckling coefficient, which can be calculated as a function of (span-to-depth ratio) and the assumed boundary conditions of the web plate. The equation for for simply supported boundary conditions is as follows [19]:
where is the clear distance between transverse stiffeners.
1.2. Lateral–Torsional Buckling
Another critical failure mode that must be considered in the design of large I-girders is the lateral–torsional buckling. Most methods developed for the prediction of the lateral–torsional buckling capacity are only applicable in the case of a uniform bending moment distribution and require a moment gradient factor for the adjustment of the predicted capacities to the case of non-uniform moment distributions [20].
The moment gradient factor incorporates the variation of the bending moment along unbraced sections of the I-girder into the buckling load capacity prediction. According to Wong and Driver [21], can be calculated for any non-uniform moment distribution along an unbraced span as follows:
where is the absolute value of the maximum bending moment, and and are the absolute values of the bending moments at lengths of , , and along the unbraced span of the I-girder, respectively, where denotes the total length of the unbraced span. In this study, the moment distribution between two stiffeners is assumed to be linear, corresponding to the unbraced span of the girder beam shown in Figure 2. Once is known, the critical bending moment for the lateral–torsional buckling can be calculated as follows:
where is the critical bending moment of an unbraced span under uniform bending moment, which can be expressed as [22]:
where is the shear modulus, is the modulus of elasticity, is the St. Venant torsion constant, is the moment of inertia with respect to the minor axis of the I-section, and is the warping constant. The equations for the calculation of and are given in the Appendix A.
2. Method
The optimisation of the I-girder involves the minimisation of the cross-sectional area, while maintaining the critical lateral–torsional buckling load and the ultimate post-buckling shear stress above certain predetermined values. While, in practice, plate girders are often designed by trial and error, the application of optimisation techniques can lead to better structural performance and more economical designs. The parameters that can be varied in the process of optimisation are the flange thickness , flange width , web plate thickness , depth of the web plate , and unbraced length between transverse stiffeners . To start this process, certain constraints need to be placed on the design parameters and the load-carrying capacity of the structure. These constraints ensure that the critical lateral–torsional buckling load and the ultimate post-buckling stress obtained from the optimisation process are greater than certain threshold values. In this study, these threshold values are chosen to be the values of the bending moment capacity and the ultimate shear stress of the girder beam tested by Mamazizi et al. [14]. The main finding of the tests carried out by Mamazizi et al. [14] was that the ultimate shear stress equations of Eurocode 3 are not conservative for certain ranges of web plate slenderness. In the next step, the design parameters for which constraints are necessary are identified. One of these design parameters is the slenderness of the web plate, which has a major impact on the ultimate post-buckling shear strength of the girder plate. The effect of this parameter on the ultimate post-buckling shear resistance of plate girders has been studied extensively both experimentally and numerically [23,24,25]. According to their slenderness ratio, plate girders are classified as compact, noncompact, or slender; note that the slenderness of both the web and flange needs to be considered [26]. Compact sections are defined as sections that allow the full development of the plastic moment prior to the local buckling of the flange or the web, whereas the local buckling of a non-compact section can occur before the full development of the plastic moment. Slender sections are sections that would fail due to local buckling before reaching the yield stress. Figure 4 shows the classification of the beam sections according to their slenderness, together with the variation of the corresponding nominal moment.
In this study, the girder beam section is optimised under different slenderness constraints. In the first optimisation attempt, the slenderness of the section is chosen according to the girder tested by Mamazizi et al. [14]. To apply this constraint, the limits of the slenderness as per AISC [19] are used. The slenderness limits for the flange and web are, respectively,
A section is classified as slender if any one of these limits is violated. According to these slenderness limits, the girder used as a reference in this study has a slender web, but its flange is not slender. In the second optimisation attempt, both the flange and the web are constrained to be noncompact.
Furthermore, the stiffener spacing is constrained to be not less than 750 mm, which is equal to the stiffener spacing considered in the experimental study of Mamazizi et al. [14]. Further constraints are imposed on the lateral–torsional buckling load and the ultimate shear stress capacity of the section. Based on the experimental studies of the girder plates conducted by Mamazizi et al. [14], the and values of the section are not allowed to be less than Nmm and 64 MPa, respectively. Under these conditions, the best and most optimised combination of the flange and web dimensions is obtained through the harmony search algorithm. Table 1 lists the experimental and optimised values of the cross-sectional dimensions and the stiffener spacing.
Harmony Search Method
The use of meta-heuristic techniques for optimisation problems in various fields of science and engineering has increased in recent years, especially in structural engineering. For example, the harmony search and flower pollination algorithms have been employed for the optimum design of truss systems [27,28], steel frames [29], cylindrical reinforced concrete walls [30], plane stress systems [31], PID controlled active tuned mass damper [32], retaining walls [33], and for the stacking sequence optimisation of laminated composite plates [34]. In addition to harmony search and flower pollination, techniques such as random forest [35,36], gene expression programming [37], supervised machine learning [38], neuro-swarm optimisation [39] and the imperialist competitive algorithm [40] have also been applied to various engineering problems.
The harmony search algorithm was developed by Geem et al. [41] and has been widely adopted for the optimisation of a water network design [42], a slope stability analysis [43], heat and power systems [44], job shop scheduling [45], team orienteering [46], and vehicle routing [47]. The method was initially designed with discrete valued data for musical composition and was then further developed for application to the optimisation of continuous valued solution vectors, e.g., those encountered in the dimensioning of structural components. A parameter-setting-free version of the harmony search algorithm was developed by Geem and Sim [48]; this algorithm is more accessible and efficient because the proper selection of algorithm-specific parameters is a difficult task.
The harmony search optimisation algorithm requires a predetermined number of design variables and an objective quantity to be maximised or minimised. The design variables of a doubly symmetric plate girder are the width of the flange (), thickness of the flange (), depth of the web plate (), thickness of the web plate (), and stiffener spacing (), and the objective quantity to be minimised is the cross-sectional area of the girder beam. The harmony search optimisation process starts with the generation of a certain number of design variable combinations, each of which is called a candidate solution vector. This initial population of candidate solutions is randomly generated within predefined design constraints. From any given population of solutions, the solution vectors that deliver the best and worst results are identified. In the next step, based on certain rules, a new candidate solution is generated and compared to the members of the previously generated population. If the new candidate solution performs better than the worst performing solution vector in the population, the newly generated solution vector is incorporated into the population and the previous worst-performing solution vector is removed from the population. This procedure is repeated for a predetermined number of iterations, and the convergence of the result is observed.
The process of generating the new candidate solution vector relies on the harmony memory consideration rate () and the pitch adjustment rate (). In this analysis, these parameters were treated as variable values and calculated using and , respectively, where denotes the index of the current harmony search iteration, and denotes the stopping criterion for this index. Once and are known, the new solution vector is calculated as follows:
where and are random numbers in the intervals and , respectively; is the total number of candidate solution vectors in the population; is the i-th design variable in the member in the population of candidate solution vectors; is the integer value nearest to the product ; and are the minimum and maximum values that of the variable in the population, respectively.
In the initial step of randomly populating the design vectors as well as in the subsequent iteration steps, certain constraints need to be imposed on the design variables. Besides the slenderness constraints given in Equations (7) and (8), the minimum sizes are defined for the flange and the web. These geometric constraints are in the form of lower bounds for the flange, and web dimensions and are chosen to be of the same order of magnitude as the specimen dimensions in the experiment conducted by Mamazizi et al. [14]. These lower bounds are listed in Table 2.
3. Results
The candidate solutions that delivered the optimum cross-sectional dimensions resulting in a minimum area obtained with the harmony search algorithm converged. In the first attempt to optimise the cross-sectional dimensions, the web was constrained to be slender, and the flange was constrained to be noncompact in order to replicate the conditions of the experimental study [14]. In this case, approximately 500 iterations were sufficient to reach convergence to an optimum solution with a minimum area of the cross-section. Figure 5 shows the convergence of the minimum area among the population of candidate solutions in the first 800 harmony search iterations. As can be seen from the figure, the solution stabilises at a cross-sectional area of 5741 and stays at that level for the remaining iterations. Although this optimised value of the cross-sectional area with a slender web is approximately 63% of the area of the girder beam tested by Mamazizi et al. [14], it yields a slightly greater bending moment capacity and an ultimate shear stress 11% greater than the experimental specimen. A comparison of the experimental dimensions of the cross-section with the optimised dimensions can be found in Table 3. An observation of the values listed in Table 3 shows that the unbraced span length stayed unchanged after the optimisation, which was expected, owing to the adverse effect of increasing this quantity on the lateral–torsional buckling capacity of the girder beam. Furthermore, the optimised cross-section has greater web slenderness () and flange slenderness () values. From this observation, it can be inferred that the increased slenderness of the web plate and the flanges can contribute to a more economical dimensioning of the cross-section under some circumstances. The optimised cross section is also analyzed using the software package CUFSM (Constrained and Unconstrained Finite Strip Method). The first buckling mode of the optimised cross section together with the normal stress distribution can be seen in Figure 6.
Although the optimised cross-section with a slender web delivers good results from an economical point of view, the 1-mm-thick web of this optimal configuration is not practical. To obtain a better solution, a second attempt at optimising the cross-sectional dimensions was made by confining the slenderness value of both the web plate and the flange within the noncompact range. The harmony search process for this second case can be seen in Figure 7. The outcome of this second attempt was satisfactory. The optimised cross-sectional area was approximately 84% of that of the original configuration with the same load-carrying capacity. Table 4 lists all the cross-sectional dimensions of the original optimised specimens. It can be observed that the flange slenderness of the optimised cross-section is approximately 2.5 times that of the original specimen. Nevertheless, this flange slenderness remains in the noncompact range according to Equation (7). On the other hand, the web slenderness of the optimised cross-section is 43% of that of the original specimen. This web slenderness is also in the noncompact range according to Equation (8). The first buckling mode of the optimised cross section with noncompact web together with the normal stress distribution can be seen in Figure 8.
Figure 9 shows a finite element model with the Huber–von Mises–Hencky stress distribution of the optimised girder with the noncompact web. It can be observed that, under the concentrated load at the mid-span, the local buckling of the web plate occurs near the top flange. It has been recommended that plate girders should be designed with a span-to-depth ratio in the range of 10–12 [26]. This range for the ratio corresponds to a recommended range for the angle of the panel diagonal () between 4.76° and 5.71°. Considering this requirement, the optimised plate girder is suitable for span lengths of up to 4.7 m.
In order to extend the analysis to more cases, and to better understand the effect of moment distribution on the structural performance, the harmony search process is repeated under the assumption of constant distributed loading for a cross-section with a slender web and noncompact flange. The moment gradient factor is adjusted according to the new load case using Equation (4). In order to incorporate the change in the value of , the minimum bending moment capacity constraint was also lowered accordingly. The outcome of the harmony search optimisation can be seen in Figure 10. A minimum cross-sectional area of 7250 could be reached after 347 harmony search iterations. The geometric properties of the optimised cross-section are listed in Table 5. It can be observed that the optimised web plate has a decrease in depth, an increase in thickness and is less slender than the original geometry, which is contrary to what was observed in the load case with concentrated load.
As can be seen from the presented results, the effect of slenderness on the structural performance is not clearly discernable. Figure 11 shows the results of a parametric study that was carried out in order to visualise the effect of changing the web plate slenderness on the structural behaviour. Using the equations in Section 1.1, the ultimate shear stress was calculated for different values of web plate slenderness . Each curve in Figure 11 represents a different web plate thickness, while the flange slenderness and flange thicknesses are kept constant. It can be observed that, at small web thicknesses, increasing the web slenderness has a favourable effect on the ultimate shear stress, whereas, at higher web thickness values, slenderness has the opposite effect.
In addition to slenderness and the moment gradient factor, the effect of changing the angle of the panel diagonal on the ultimate shear stress is also analyzed. The values in a wide range that also contains the angles corresponding to the recommended range for the ratio are used in the calculations for . The results of this analysis are visualised in Figure 12. This visualisation clearly shows the nonlinear relationship between and . Figure 12 shows that lowering has a favourable effect on at small angles up to about 20°. On the other hand, increasing beyond this threshold value only slightly increases .
4. Conclusions
The lateral–torsional buckling and shear capacity of plate girders are significant factors in the design of plate girders. The buckling of plate girders used during the construction stage of the replacement project of the 102 Avenue over Groat Road Bridge in Edmonton, Alberta, Canada (Figure 1) is a recent example of the impact of these structural failure modes on infrastructures. In addition to satisfy the serviceability requirements, structures should also be designed in an economical way. In this study, it was demonstrated that by adequately dimensioning the cross-section of a girder beam, its cost can be significantly reduced without compromising the structural performance. The harmony search algorithm was utilised to optimise the cross-sectional dimensions under two different sets of slenderness constraints. In the first set, the flange slenderness was kept in the noncompact range, while the web was allowed to be slender. In the second set, the web slenderness was constrained in the noncompact range. In addition to satisfying certain slenderness requirements, the cross-sections were constrained to have buckling moments and ultimate shear stresses at least as high as the moment and ultimate shear stress capacity of the specimen tested by Mamazizi et al. [14].
The optimisation under the first set of slenderness constraints resulted in a cross-sectional area corresponding to 63% of the cross-sectional area of the experimental specimen. Despite this favourable outcome, the 1-mm-thick web of this configuration was not practical. The following optimisation attempt with the second set of slenderness constraints resulted in a cross-sectional area approximately 84% of the cross-sectional area of the experimental specimen. These two outcomes show that a suitably optimised cross-section can lead to great savings in material and costs. However, without a rigorous optimisation procedure, it is difficult to design a cross-section with suitable dimensions; it was observed that either increasing or decreasing the slenderness of the web can lead to a better design. Further research should be conducted to better understand the effects of the flange and web slenderness on the structural performance. Furthermore, additional constraints should be placed on the design variables to satisfy the requirements for the span-to-depth ratio.
Author Contributions
Methodology, G.B.; formal analysis (coding), C.C.; writing—original draft preparation, C.C. and G.B.; writing—review & editing, S.K. and Z.W.G.; visualisation, C.C.; supervision, G.B., S.K. and Z.W.G.; funding acquisition, Z.W.G. All authors have read and approved the final manuscript.
Funding
This work was supported by the National Research Foundation of Korea (NRF) through a grant funded by the Korea government (MSIT) (2020R1A2C1A01011131) and by the Energy Cloud R&D Program through the National Research Foundation of Korea (NRF) funded by the Ministry of Science, ICT (2019M3F2A1073164).
Conflicts of Interest
The authors declare no conflict of interest.
Appendix A
Torsional section properties of a doubly symmetric I-section [49]. St. Venant’s torsion constant:
Warping constant:
References
- Ziemian, R.D. Guide to Stability Design Criteria for Metal Structures; John Wiley & Sons: Hoboken, NJ, USA, 2010. [Google Scholar]
- Lee, S.C.; Yoo, C.H. Strength of plate girder web panels under pure shear. J. Struct. Eng. 1998, 124, 184–194. [Google Scholar] [CrossRef]
- Gupta, V.K.; Okui, Y.; Nagai, M. Development of web slenderness limits for composite I-girders accounting for initial bending moment. Doboku Gakkai Ronbunshuu A 2006, 62, 854–864. [Google Scholar] [CrossRef] [Green Version]
- Available online: https://edmonton.talks.news/groat-road-bridge/ (accessed on 24 February 2020).
- Glassman, J.D.; Moreyra Garlock, M.E. A compression model for ultimate postbuckling shear strength. Thin-Walled Struct. 2016, 102, 258–272. [Google Scholar] [CrossRef] [Green Version]
- Basler, K. Strength of plate girders in shear. J. Struct. Div. 1961, 87, 151–180. [Google Scholar]
- White, D.W.; Barker, M.G. Shear resistance of transversely stiffened steel I-girders. J. Struct. Eng. 2008, 134, 1425–1436. [Google Scholar] [CrossRef]
- Wagner, H. Flat Sheet Metal Girders with Very Thin Metal Web. Part II: Sheet Metal Girders with Spars Resistant to Bending-Oblique Uprights-Stiffness; NASA Technical Report; NASA: Washington, DC, USA, 1931.
- Wilson, J.M. On specifications for strength of iron bridges. Trans. Am. Soc. Civ. Eng. 1886, 15, 389–414. [Google Scholar]
- American Association of State Highway and Transportation Officials. AASHTO LRFD Bridge Design Specifications, Customary US Units: 2006 Interim Revisions; American Association of State Highway and Transportation Officials: Washington, DC, USA, 2006.
- Porter, D.M.; Rockey, K.C.; Evans, H.R. The collapse behavior of plate girders loaded in shear. Struct. Eng. 1975, 53, 313–325. [Google Scholar]
- Höglund, T. Shear buckling resistance of steel and aluminum plate girders. Thin-Walled Struct. 1997, 29, 13–30. [Google Scholar] [CrossRef]
- Dubina, D.; Landolfo, R.; Ungureanu, V. Design of Cold-Formed Steel Structures: Eurocode 3: Design of Steel Structures. Part 1-3, Design of Cold-Formed Steel Structures; European Convention for Constructional Steelwork (ECCS): Bruxelles, Belgium, 2012. [Google Scholar]
- Mamazizi, S.; Crocetti, R.; Mehri, H. Numerical and experimental investigation on the post-buckling behavior of steel plate girders subjected to shear. In Proceedings of the Annual Stability Conference Structural Stability Research Council, St. Louis, MI, USA, 16–20 April 2013. [Google Scholar]
- Fujii, T. On an improved theory for Dr. Basler’s theory. In Final Report of 8th Congress of International Association for Bridge and Structural Engineering(IABSE), New York; IABSE: Zürich, Switzerland, 1968; pp. 479–487. [Google Scholar]
- Gaylord, E.H. Discussion of K. Basler Strength of Plate Girders in Shear. Trans. ASCE 1963, 128, 712. [Google Scholar]
- Selberg, A. On the shear capacity of girder webs, International Association for Bridge and Structural Engineering. Publications 1974, 34, 145–155. [Google Scholar]
- Timoshenko, S.P.; Gere, J.M. Theory of Elastic Stability; Courier Corporation: North Chelmsford, MA, USA, 2009. [Google Scholar]
- American Institute of Steel Construction (AISC). Steel Construction Manual, 14th ed.; American Institute of Steel Construction (AISC): Chicago, IL, USA, 2011. [Google Scholar]
- Helwig, T.A.; Frank, K.H.; Yura, J.A. Lateral-torsional buckling of singly symmetric I-beams. J. Struct. Eng. 1997, 123, 1172–1179. [Google Scholar] [CrossRef]
- Wong, E.; Driver, R.G. Critical evaluation of equivalent moment factor procedures for laterally unsupported beams. Eng. J. 2010, 47, 1. [Google Scholar]
- Galambos, T.V.; Surovek, A.E. Structural Stability of Steel: Concepts and Applications for Structural Engineers; Wiley Online Library: Hoboken, NJ, USA, 2008. [Google Scholar]
- Subramanian, L.; White, D.W. Improved Noncompact Web-Slenderness Limit for Steel I-Girders. J. Struct. Eng. 2017, 143, 4016216. [Google Scholar] [CrossRef]
- Estrada, I.; Real, E.; Mirambell, E. General behaviour and effect of rigid and non-rigid end post in stainless steel plate girders loaded in shear. Part I: Experimental study. J. Construct. Steel Res. 2007, 63, 970–984. [Google Scholar] [CrossRef]
- Maquoi, R.; Skaloud, M. Stability of plates and plated structures: General report. J. Construct. Steel Res. 2000, 55, 45–68. [Google Scholar] [CrossRef]
- Williams, A. Steel Structures Design ASD/LRFD; McGraw-Hill: New York, NY, USA, 2011. [Google Scholar]
- Bekdaş, G.; Nigdeli, S.M.; Yang, X.-S. Sizing optimization of truss structures using flower pollination algorithm. Appl. Soft Comput. 2015, 37, 322–331. [Google Scholar] [CrossRef]
- Cheng, M.Y.; Prayogo, D.; Wu, Y.W.; Lukito, M.M. A Hybrid Harmony Search algorithm for discreet sizing optimization of truss structure. Automat. Construct. 2016, 69, 21–33. [Google Scholar] [CrossRef]
- Degertekin, S.O. Optimum design of steel frames using harmony search algorithm. Struct. Multidiscip. Optim. 2008, 36, 393–401. [Google Scholar] [CrossRef]
- Bekdaş, G. Harmony search algorithm approach for optimum design of post-tensioned axially symmetric cylindrical reinforced concrete walls. J. Optim. Theory Appl. 2015, 164, 342–358. [Google Scholar] [CrossRef]
- Kayabekir, A.E.; Toklu, Y.C.; Bekdaş, G.; Nigdeli, S.M.; Yücel, M.; Geem, Z.W. A Novel Hybrid Harmony Search Approach for the Analysis of Plane Stress Systems via Total Potential Optimization. Appl. Sci. 2020, 10, 2301. [Google Scholar] [CrossRef] [Green Version]
- Kayabekir, A.E.; Bekdaş, G.; Nigdeli, S.M.; Geem, Z.W. Optimum Design of PID Controlled Active Tuned Mass Damper via Modified Harmony Search. Appl. Sci. 2020, 10, 2976. [Google Scholar] [CrossRef]
- Bekdaş, G.; Arama, Z.A.; Kayabekir, A.E.; Geem, Z.W. Optimal Design of Cantilever Soldier Pile Retaining Walls Embedded in Frictional Soils with Harmony Search Algorithm. Appl. Sci. 2020, 10, 3232. [Google Scholar] [CrossRef]
- De Almeida, F.S. Stacking sequence optimization for maximum buckling load of composite plates using harmony search algorithm. Compos. Struct. 2016, 143, 287–299. [Google Scholar] [CrossRef]
- Yu, Z.; Shi, X.; Zhou, J.; Chen, X.; Qiu, X. Effective Assessment of Blast-Induced Ground Vibration Using an Optimized Random Forest Model Based on a Harris Hawks Optimization Algorithm. Appl. Sci. 2020, 10, 1403. [Google Scholar] [CrossRef] [Green Version]
- Zhang, H.; Zhou, J.; Jahed Armaghani, D.; Tahir, M.M.; Pham, B.T.; Huynh, V.V. A Combination of Feature Selection and Random Forest Techniques to Solve a Problem Related to Blast-Induced Ground Vibration. Appl. Sci. 2020, 10, 869. [Google Scholar] [CrossRef] [Green Version]
- Hajihassani, M.; Abdullah, S.S.; Asteris, P.G.; Armaghani, D.J. A Gene Expression Programming Model for Predicting Tunnel Convergence. Appl. Sci. 2019, 9, 4650. [Google Scholar] [CrossRef] [Green Version]
- Geem, Z.W.; Kim, J.H.; Loganathan, G.V. A new heuristic optimization algorithm: Harmony search. Simulation 2001, 76, 60–68. [Google Scholar] [CrossRef]
- Xu, H.; Zhou, J.; Asteris, P.; Jahed Armaghani, D.; Tahir, M.M. Supervised Machine Learning Techniques to the Prediction of Tunnel Boring Machine Penetration Rate. Appl. Sci. 2019, 9, 3715. [Google Scholar] [CrossRef] [Green Version]
- Armaghani, D.J.; Asteris, P.G.; Fatemi, S.A.; Hasanipanah, M.; Tarinejad, R.; Rashid, A.S.A.; Huynh, V.V. On the Use of Neuro-Swarm System to Forecast the Pile Settlement. Appl. Sci. 2020, 10, 1904. [Google Scholar] [CrossRef] [Green Version]
- Chen, H.; Asteris, P.G.; Jahed Armaghani, D.; Gordan, B.; Pham, B.T. Assessing Dynamic Conditions of the Retaining Wall: Developing Two Hybrid Intelligent Models. Appl. Sci. 2019, 9, 1042. [Google Scholar] [CrossRef] [Green Version]
- Geem, Z.W. Particle-swarm harmony search for water network design. Eng. Optim. 2009, 41, 297–311. [Google Scholar] [CrossRef]
- Cheng, Y.M.; Li, L.; Lansivaara, T.; Chi, S.C.; Sun, Y.J. An improved harmony search minimization algorithm using different slip surface generation methods for slope stability analysis. Eng. Optim. 2008, 40, 95–115. [Google Scholar] [CrossRef]
- Vasebi, A.; Fesanghary, M.; Bathaee, S.M.T. Combined heat and power economic dispatch by harmony serach algorithm. Int. J. Electr. Power Energy Syst. 2007, 29, 713–719. [Google Scholar] [CrossRef]
- Gao, K.Z.; Suganthan, P.N.; Pan, Q.K.; Chua, T.J.; Cai, T.X.; Chong, C.S. Discreet harmony search algorithm for flexible job shop scheduling problem with multiple objectives. J. Intell. Manuf. 2016, 27, 363–374. [Google Scholar] [CrossRef]
- Tsakirakis, E.; Marinaki, M.; Marinakis, Y.; Matsatsinis, N. A similarity hybrid harmony search algorithm for the Team Orienteering problem. Appl. Soft Comput. 2019, 80, 776–796. [Google Scholar] [CrossRef]
- Geem, Z.W.; Lee, K.S.; Park, Y. Application of harmony search to vehicle routing. Am. J. Appl. Sci. 2005, 2, 1552–1557. [Google Scholar]
- Geem, Z.W.; Sim, K.-B. Parameter-setting-free harmony search algorithm. Appl. Math. Comput. 2010, 217, 3881–3889. [Google Scholar] [CrossRef]
- Kulak, G.L.; Grondin, G.Y. Limit States Design in Structural Steel; Canadian Institute of Steel Construction: Alliston, ON, Canada, 2002; p. 63. [Google Scholar]
Figure 2.
Post-buckling deformation of stiffened plate girder under transverse loading [14].
Figure 2.
Post-buckling deformation of stiffened plate girder under transverse loading [14].
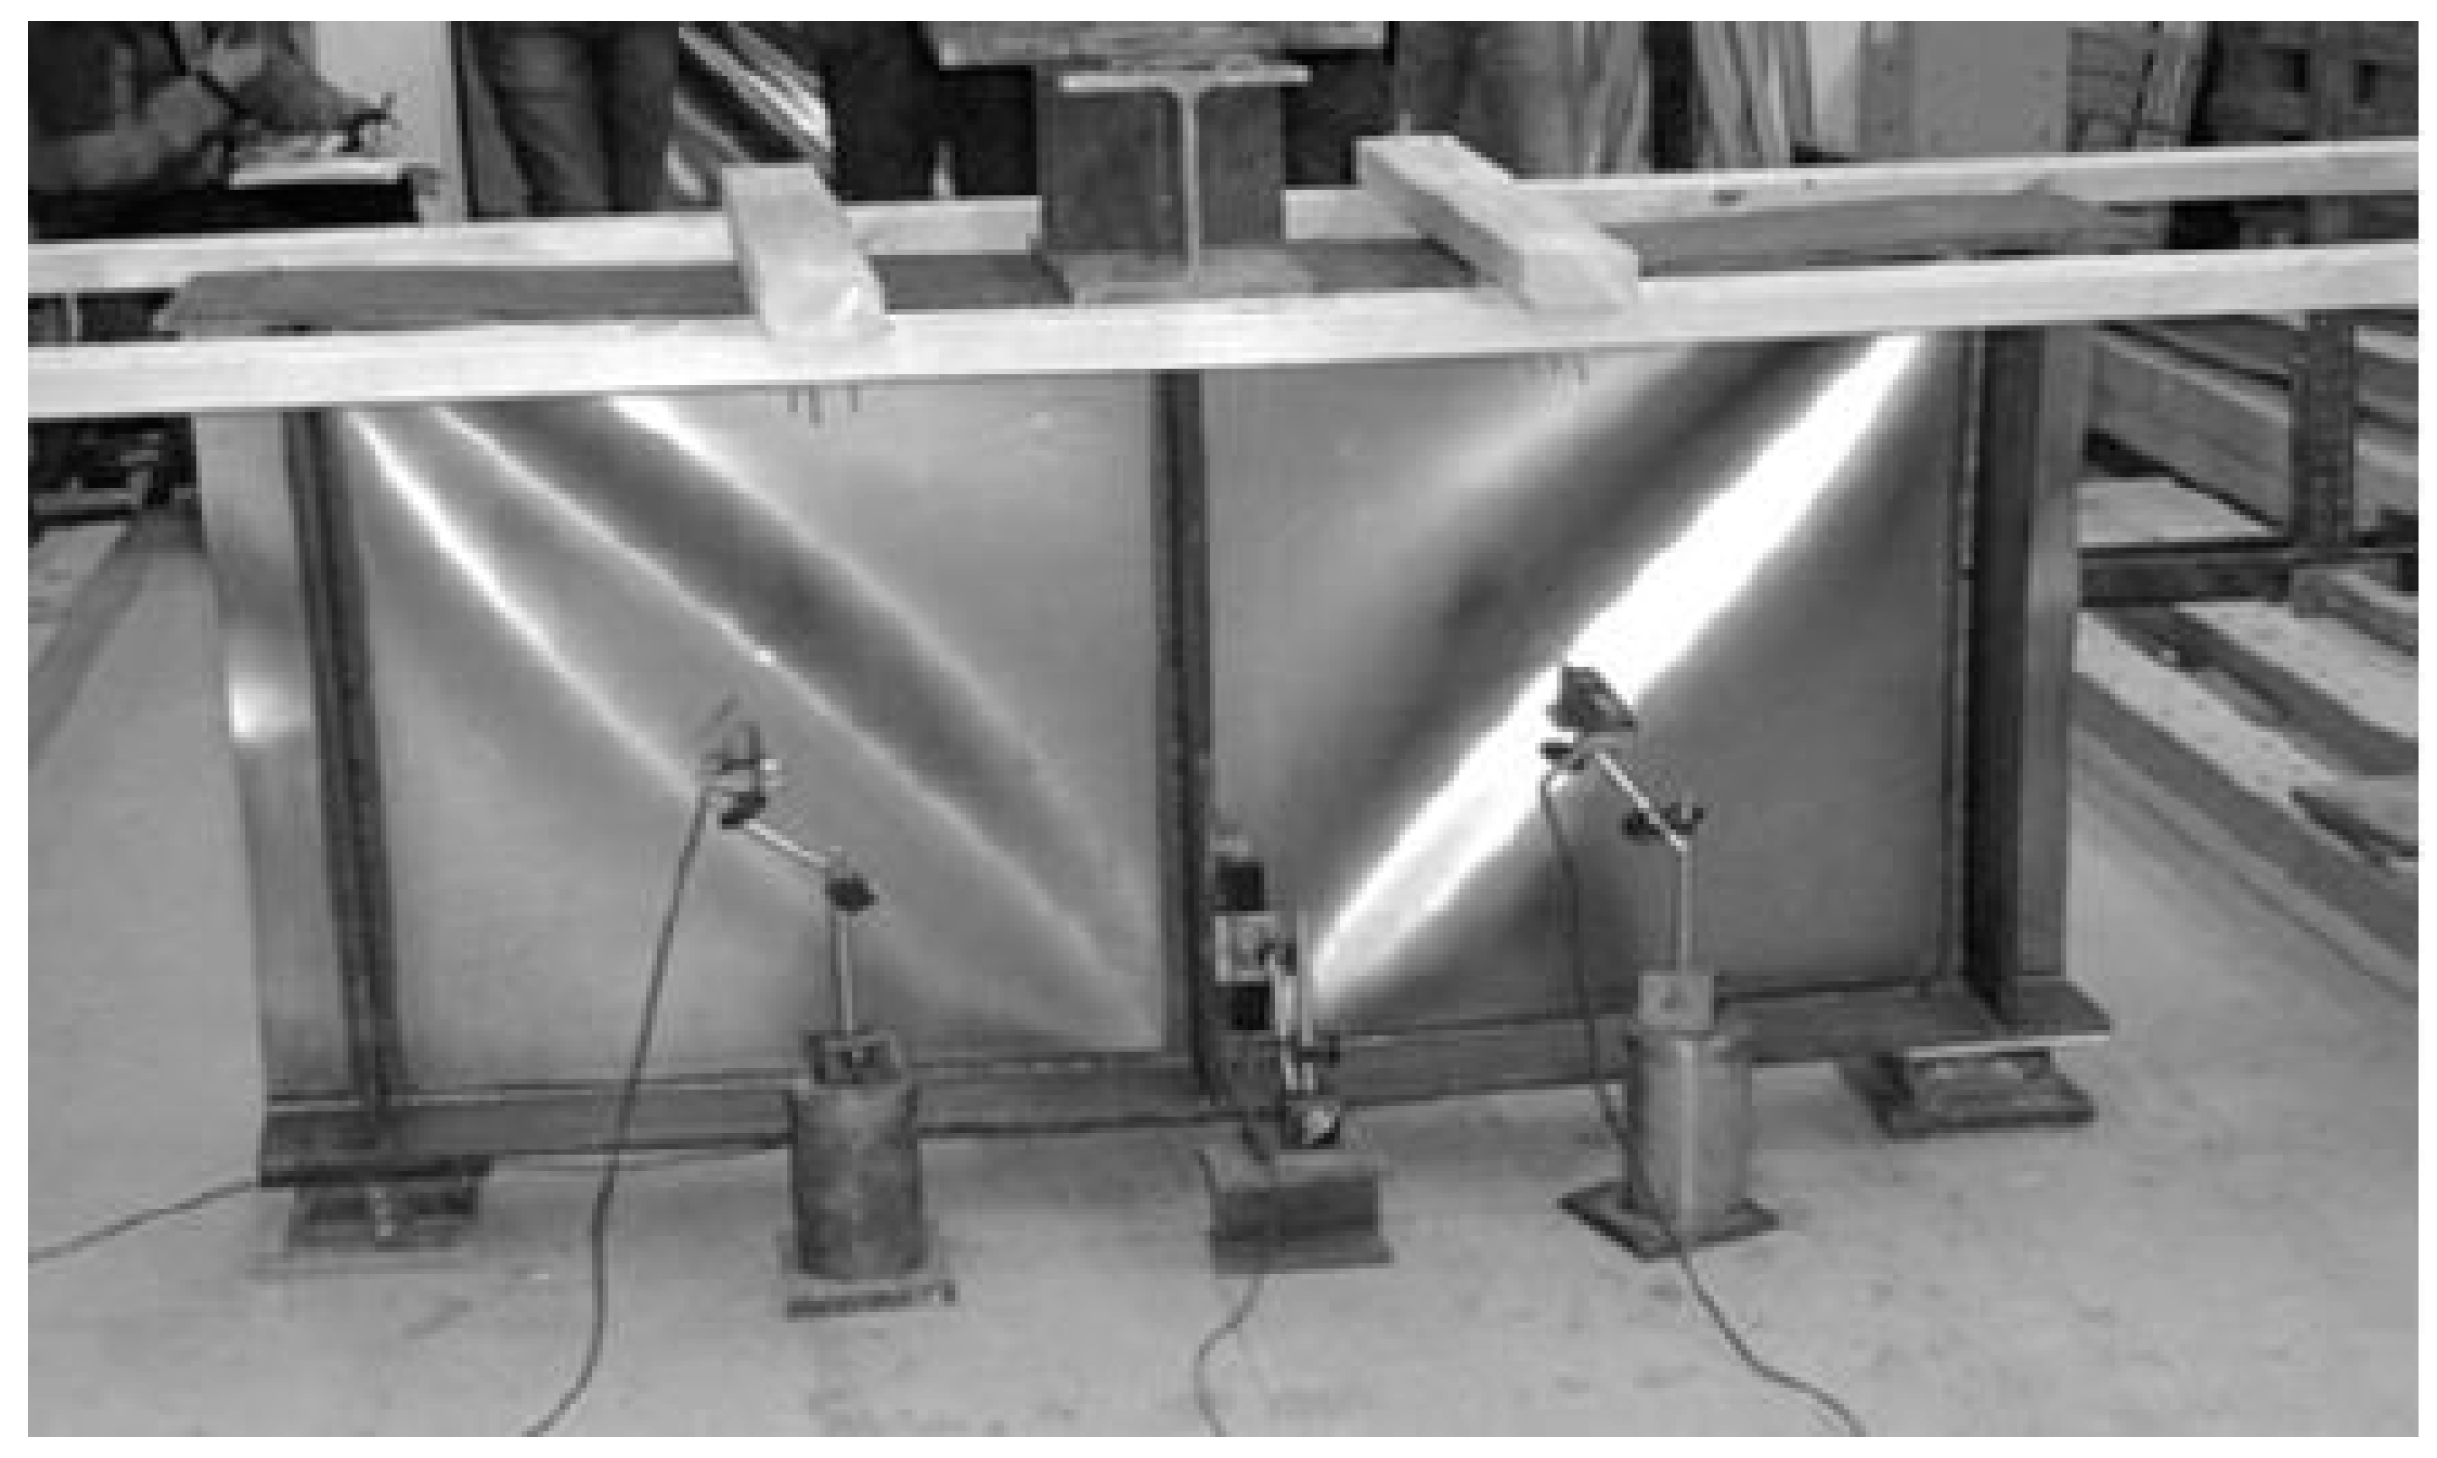
Figure 3.
Schematic of Basler’s tension field theory model [5].
Figure 3.
Schematic of Basler’s tension field theory model [5].
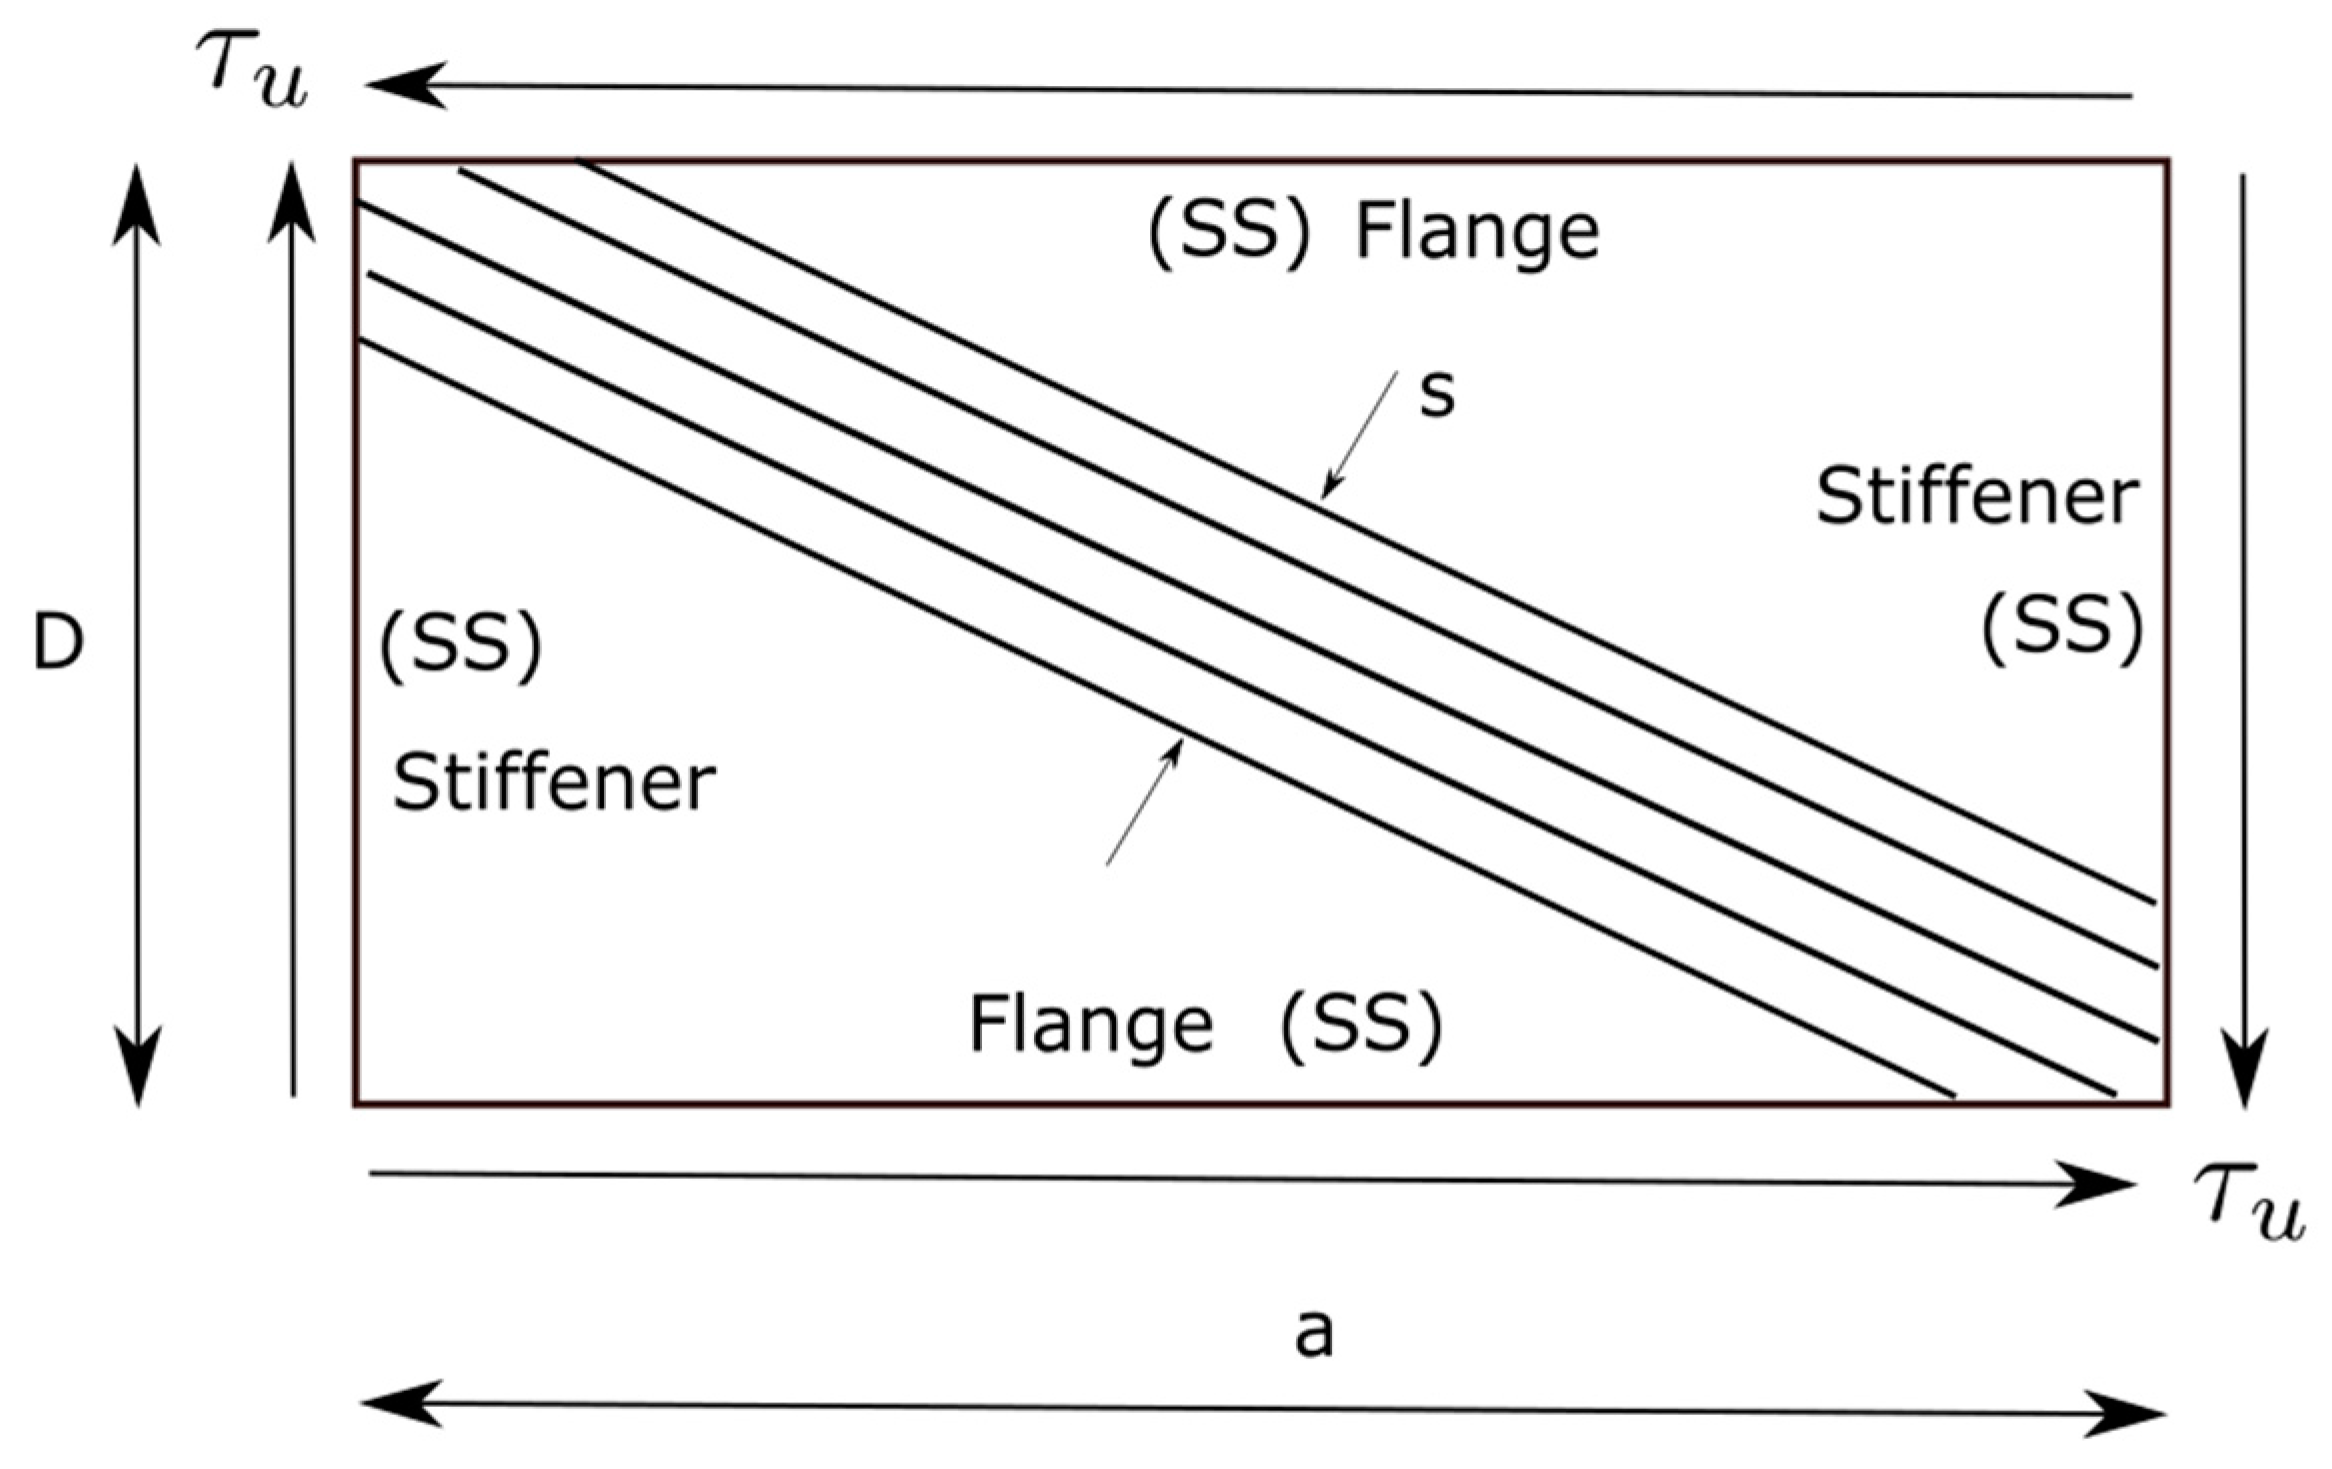
Figure 4.
Classification of beam sections according to their slenderness [1].
Figure 4.
Classification of beam sections according to their slenderness [1].
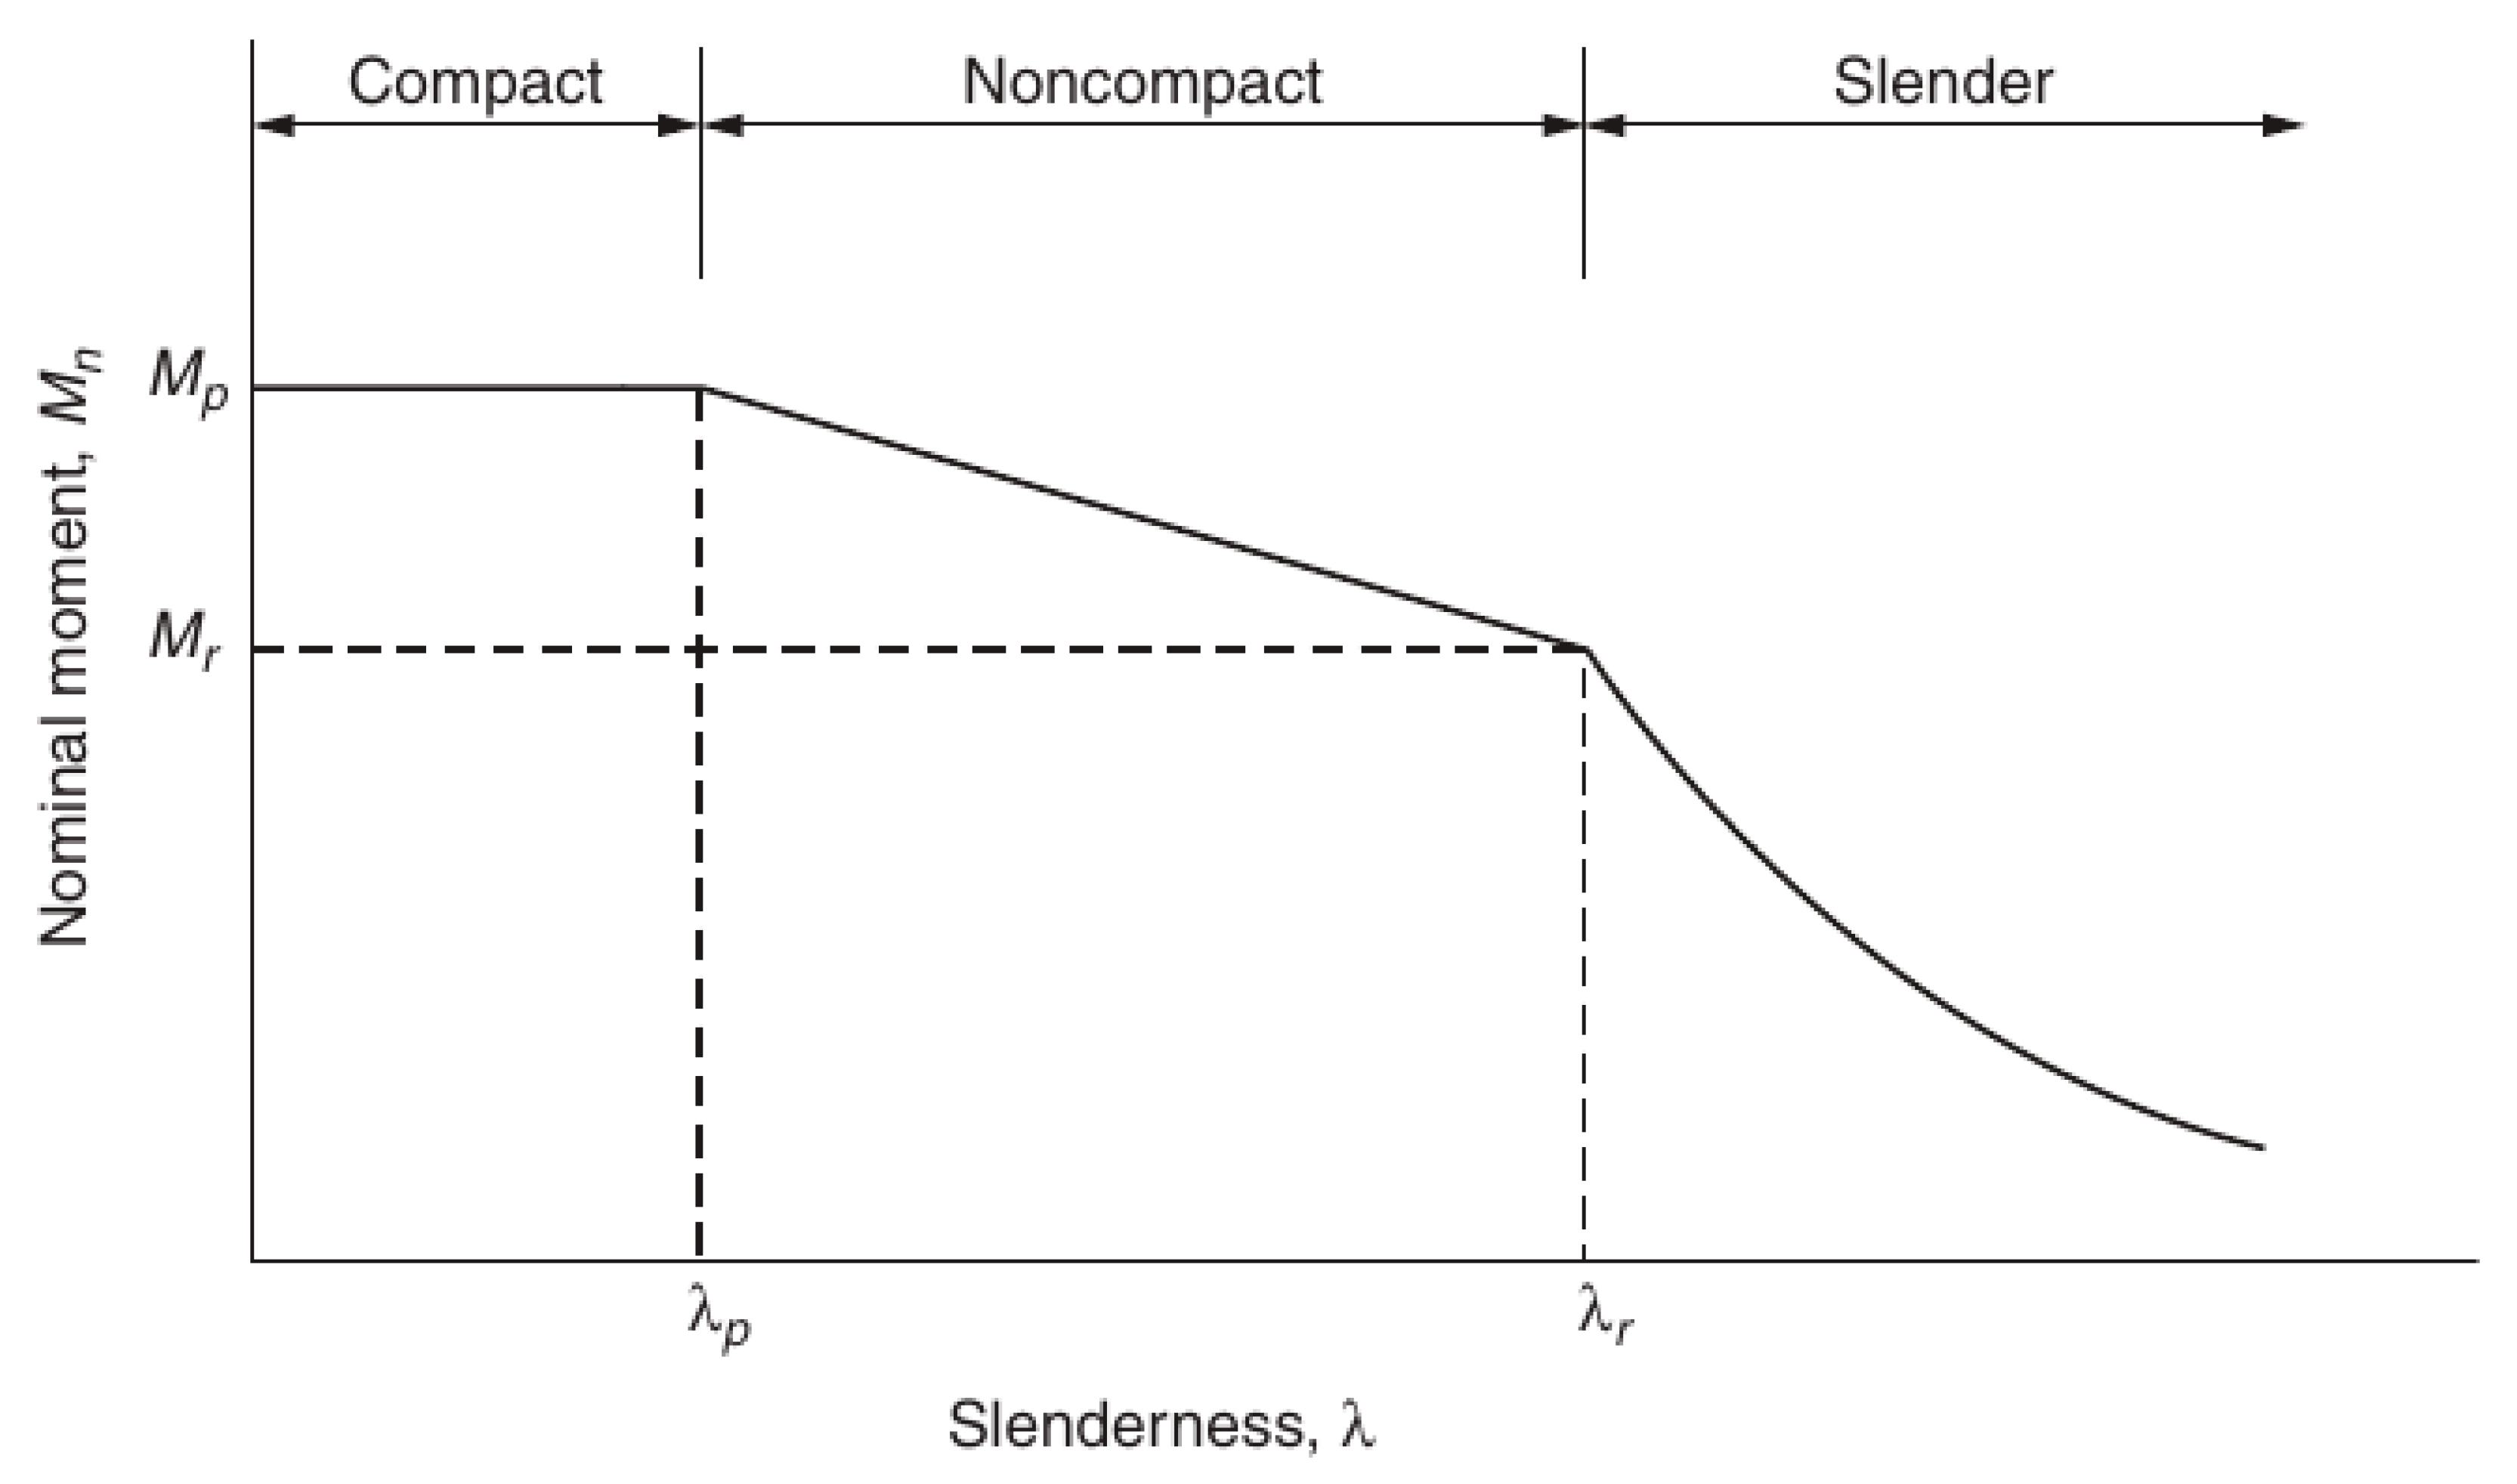
Figure 5.
Variation in the minimum cross-sectional area of the slender web in the first 800 harmony search iterations.
Figure 5.
Variation in the minimum cross-sectional area of the slender web in the first 800 harmony search iterations.
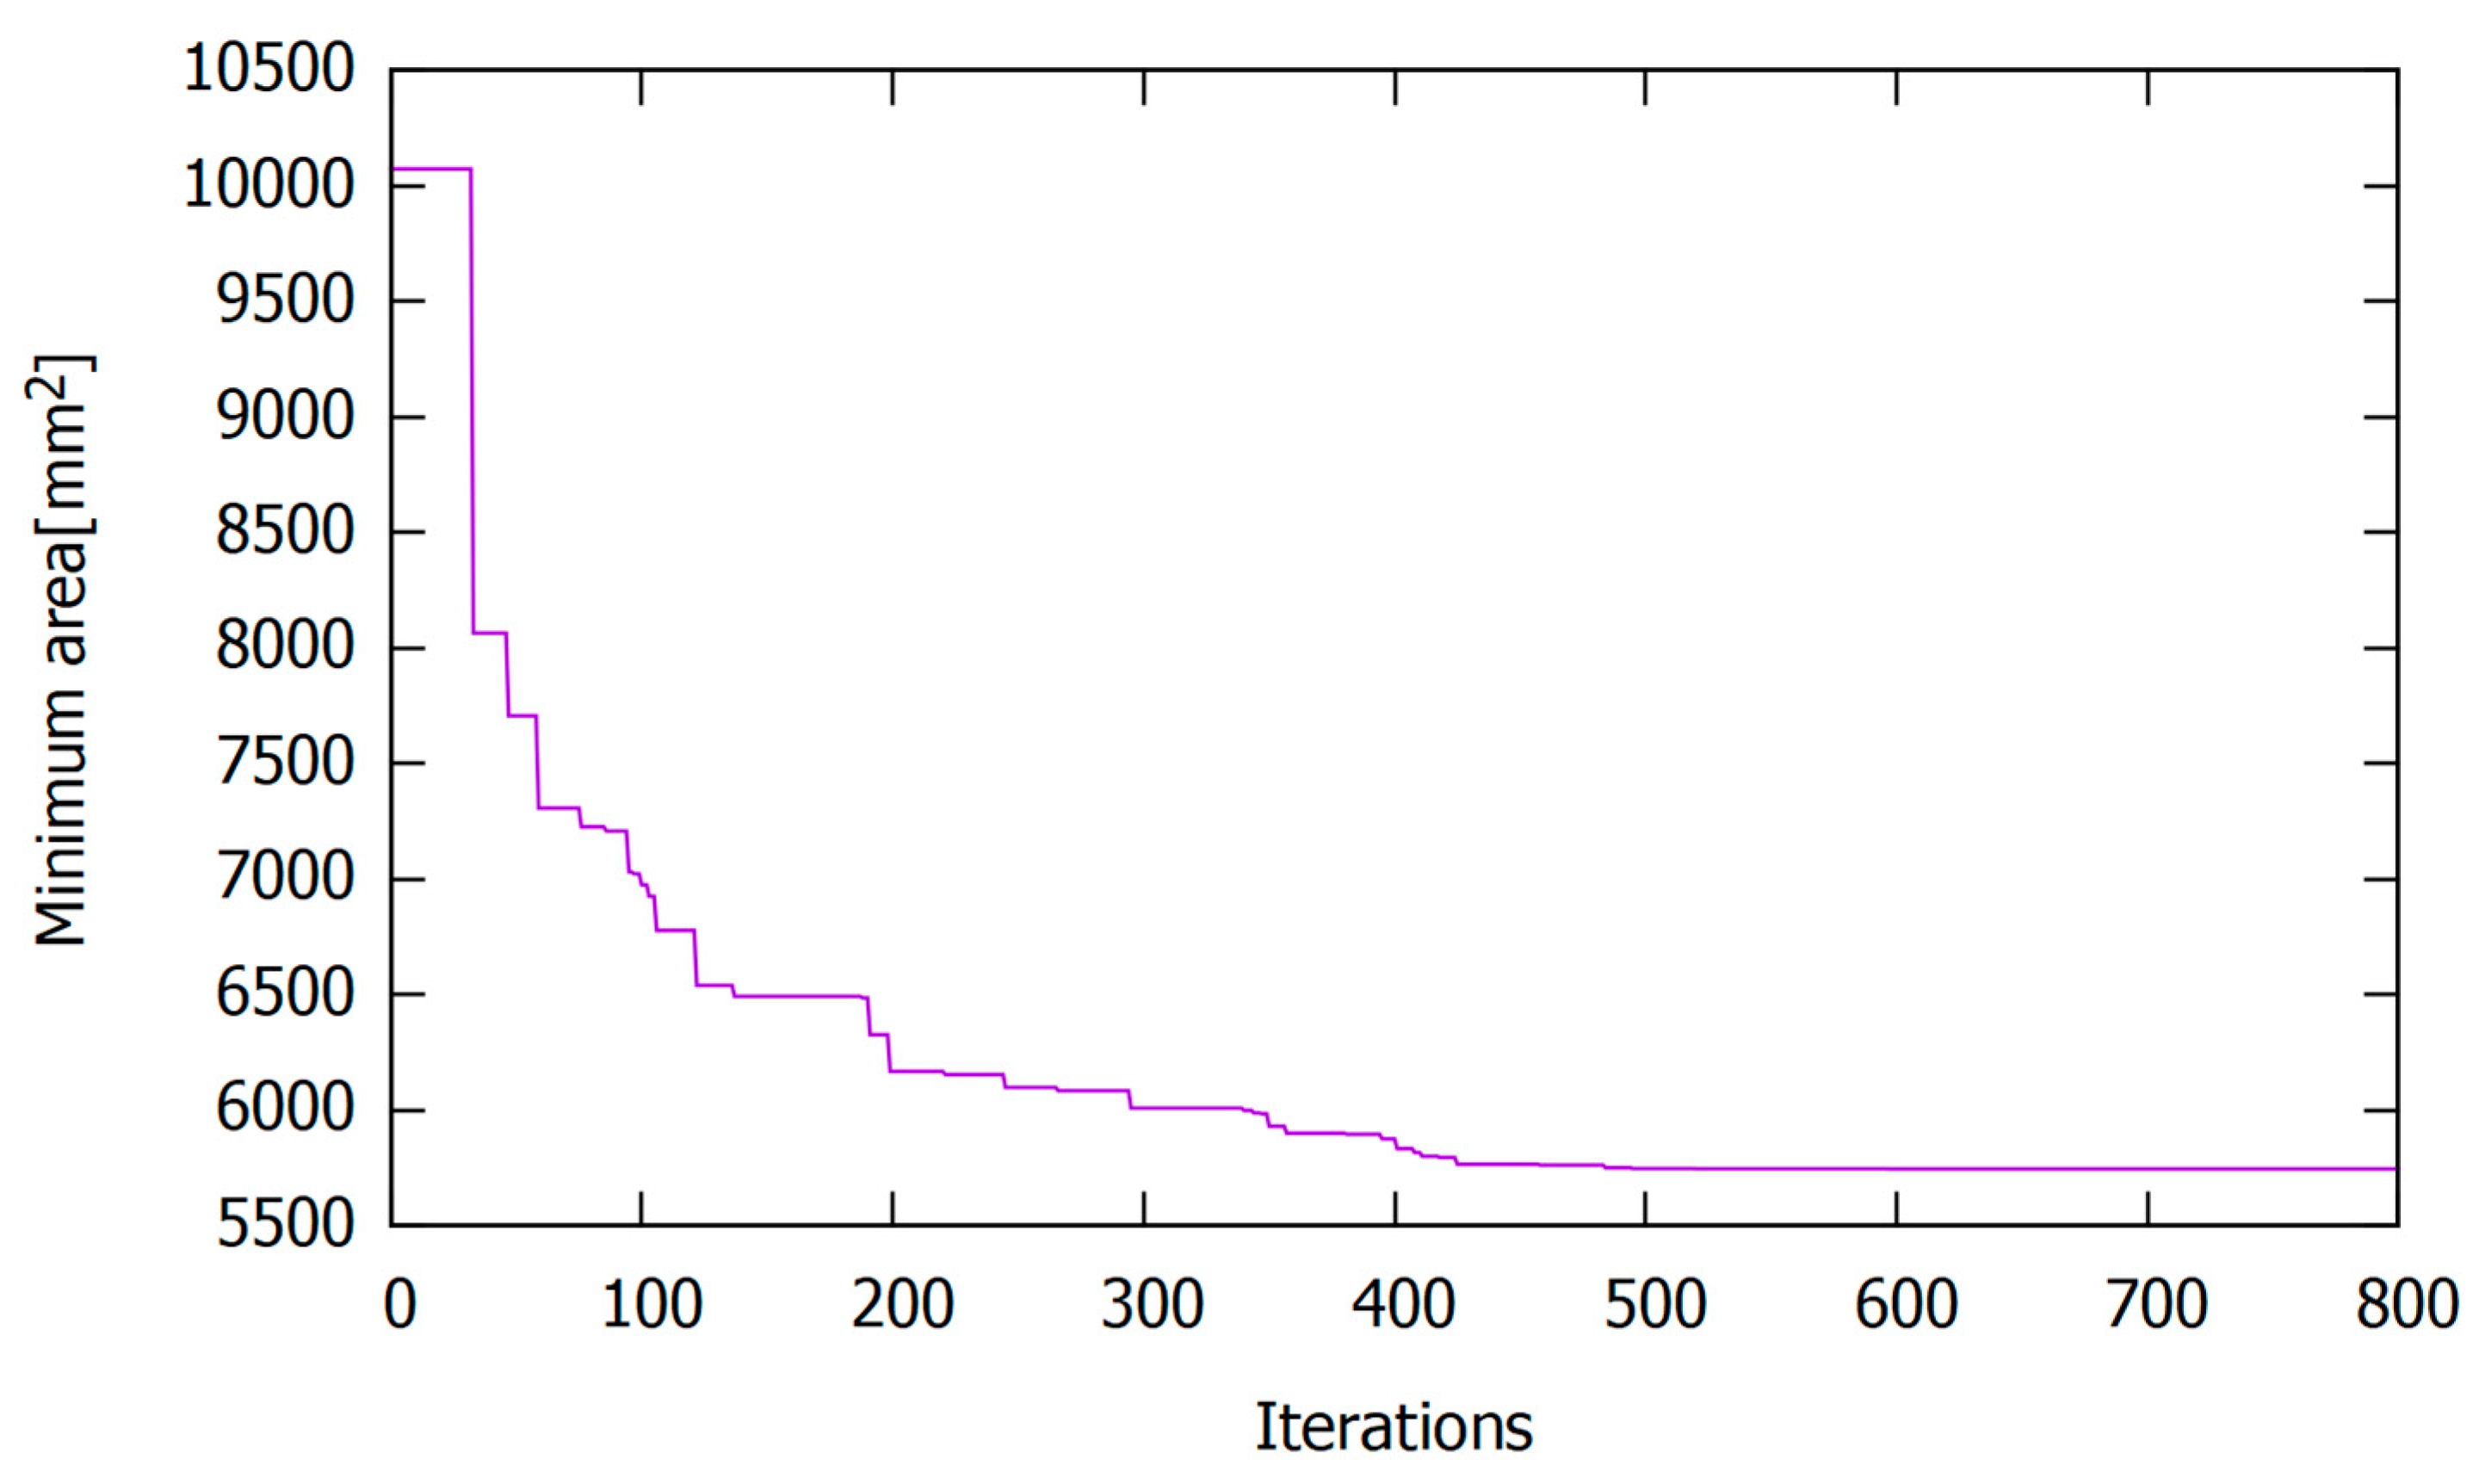
Figure 6.
Results of the analysis with finite strip method using the software package CUFSM for the slender web.
Figure 6.
Results of the analysis with finite strip method using the software package CUFSM for the slender web.
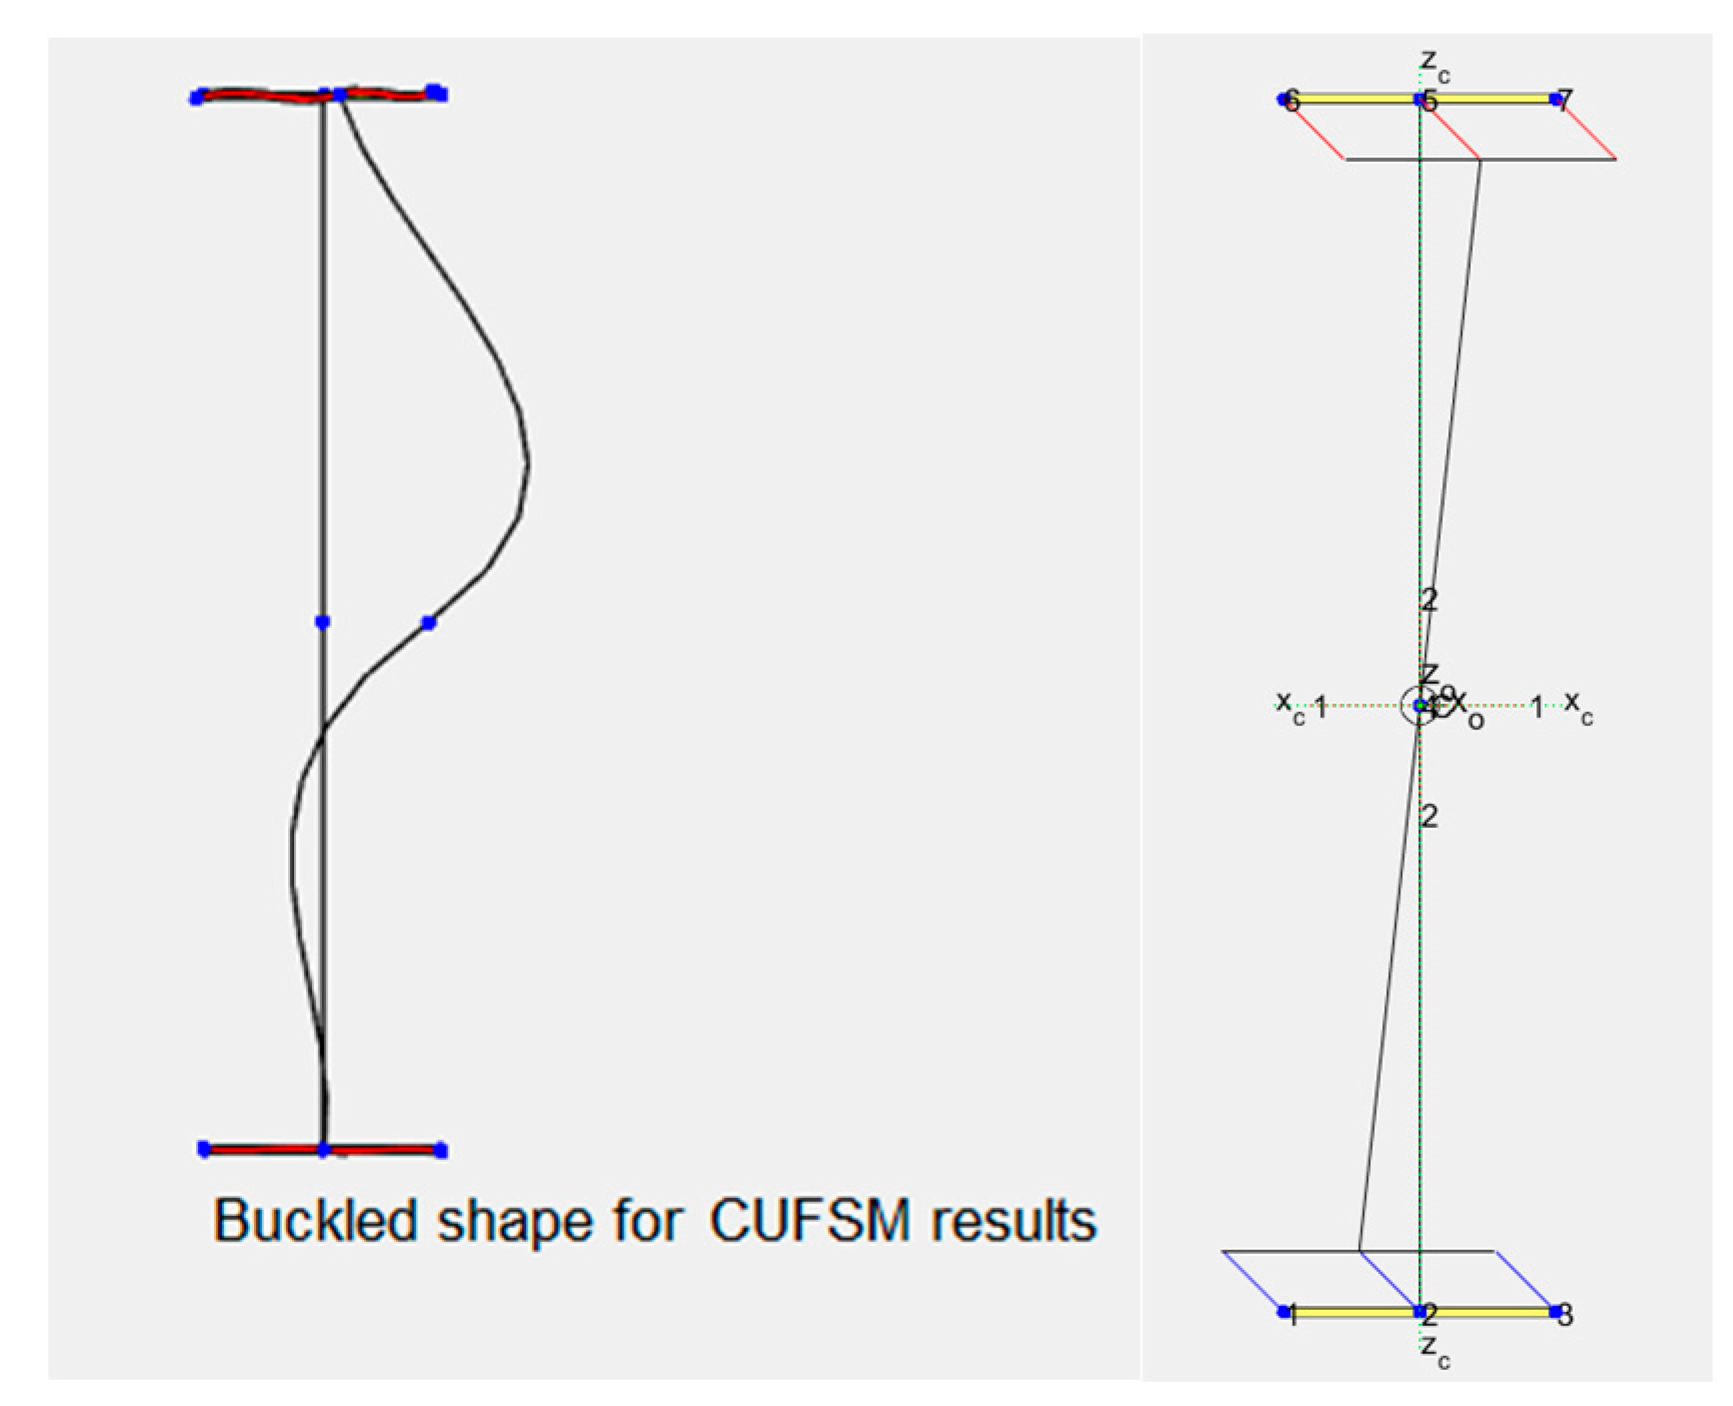
Figure 7.
Variation in the minimum cross-sectional area with noncompact web in the first 2000 harmony search iterations.
Figure 7.
Variation in the minimum cross-sectional area with noncompact web in the first 2000 harmony search iterations.

Figure 8.
Results of the analysis with finite strip method using the software package CUFSM for the noncompact web.
Figure 8.
Results of the analysis with finite strip method using the software package CUFSM for the noncompact web.
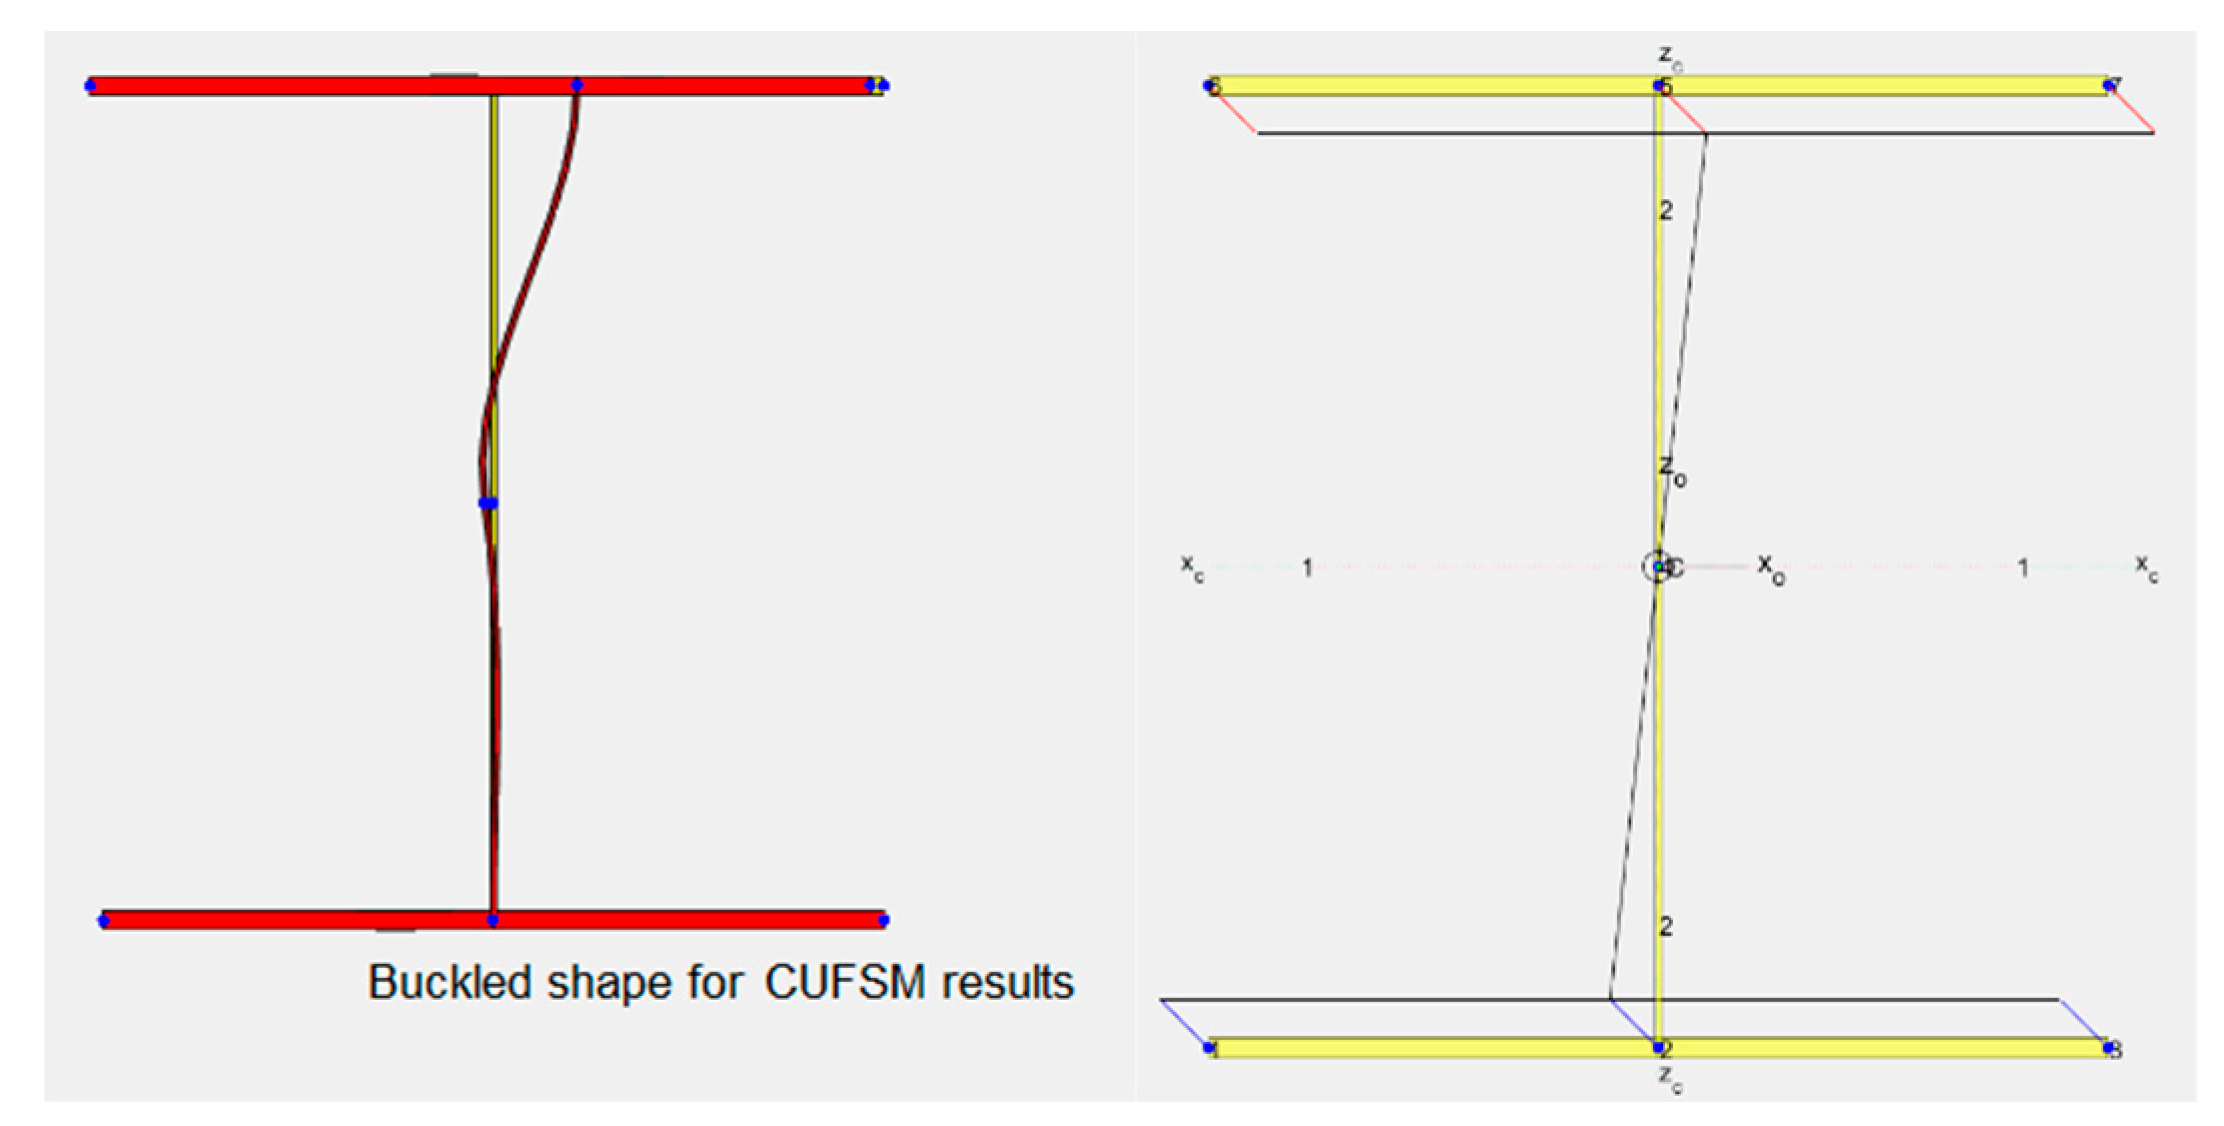
Figure 9.
Finite element model of the optimised plate girder with noncompact web.

Figure 10.
Variation in the minimum cross-sectional area with slender web under distributed loading in the first 600 harmony search iterations.
Figure 10.
Variation in the minimum cross-sectional area with slender web under distributed loading in the first 600 harmony search iterations.
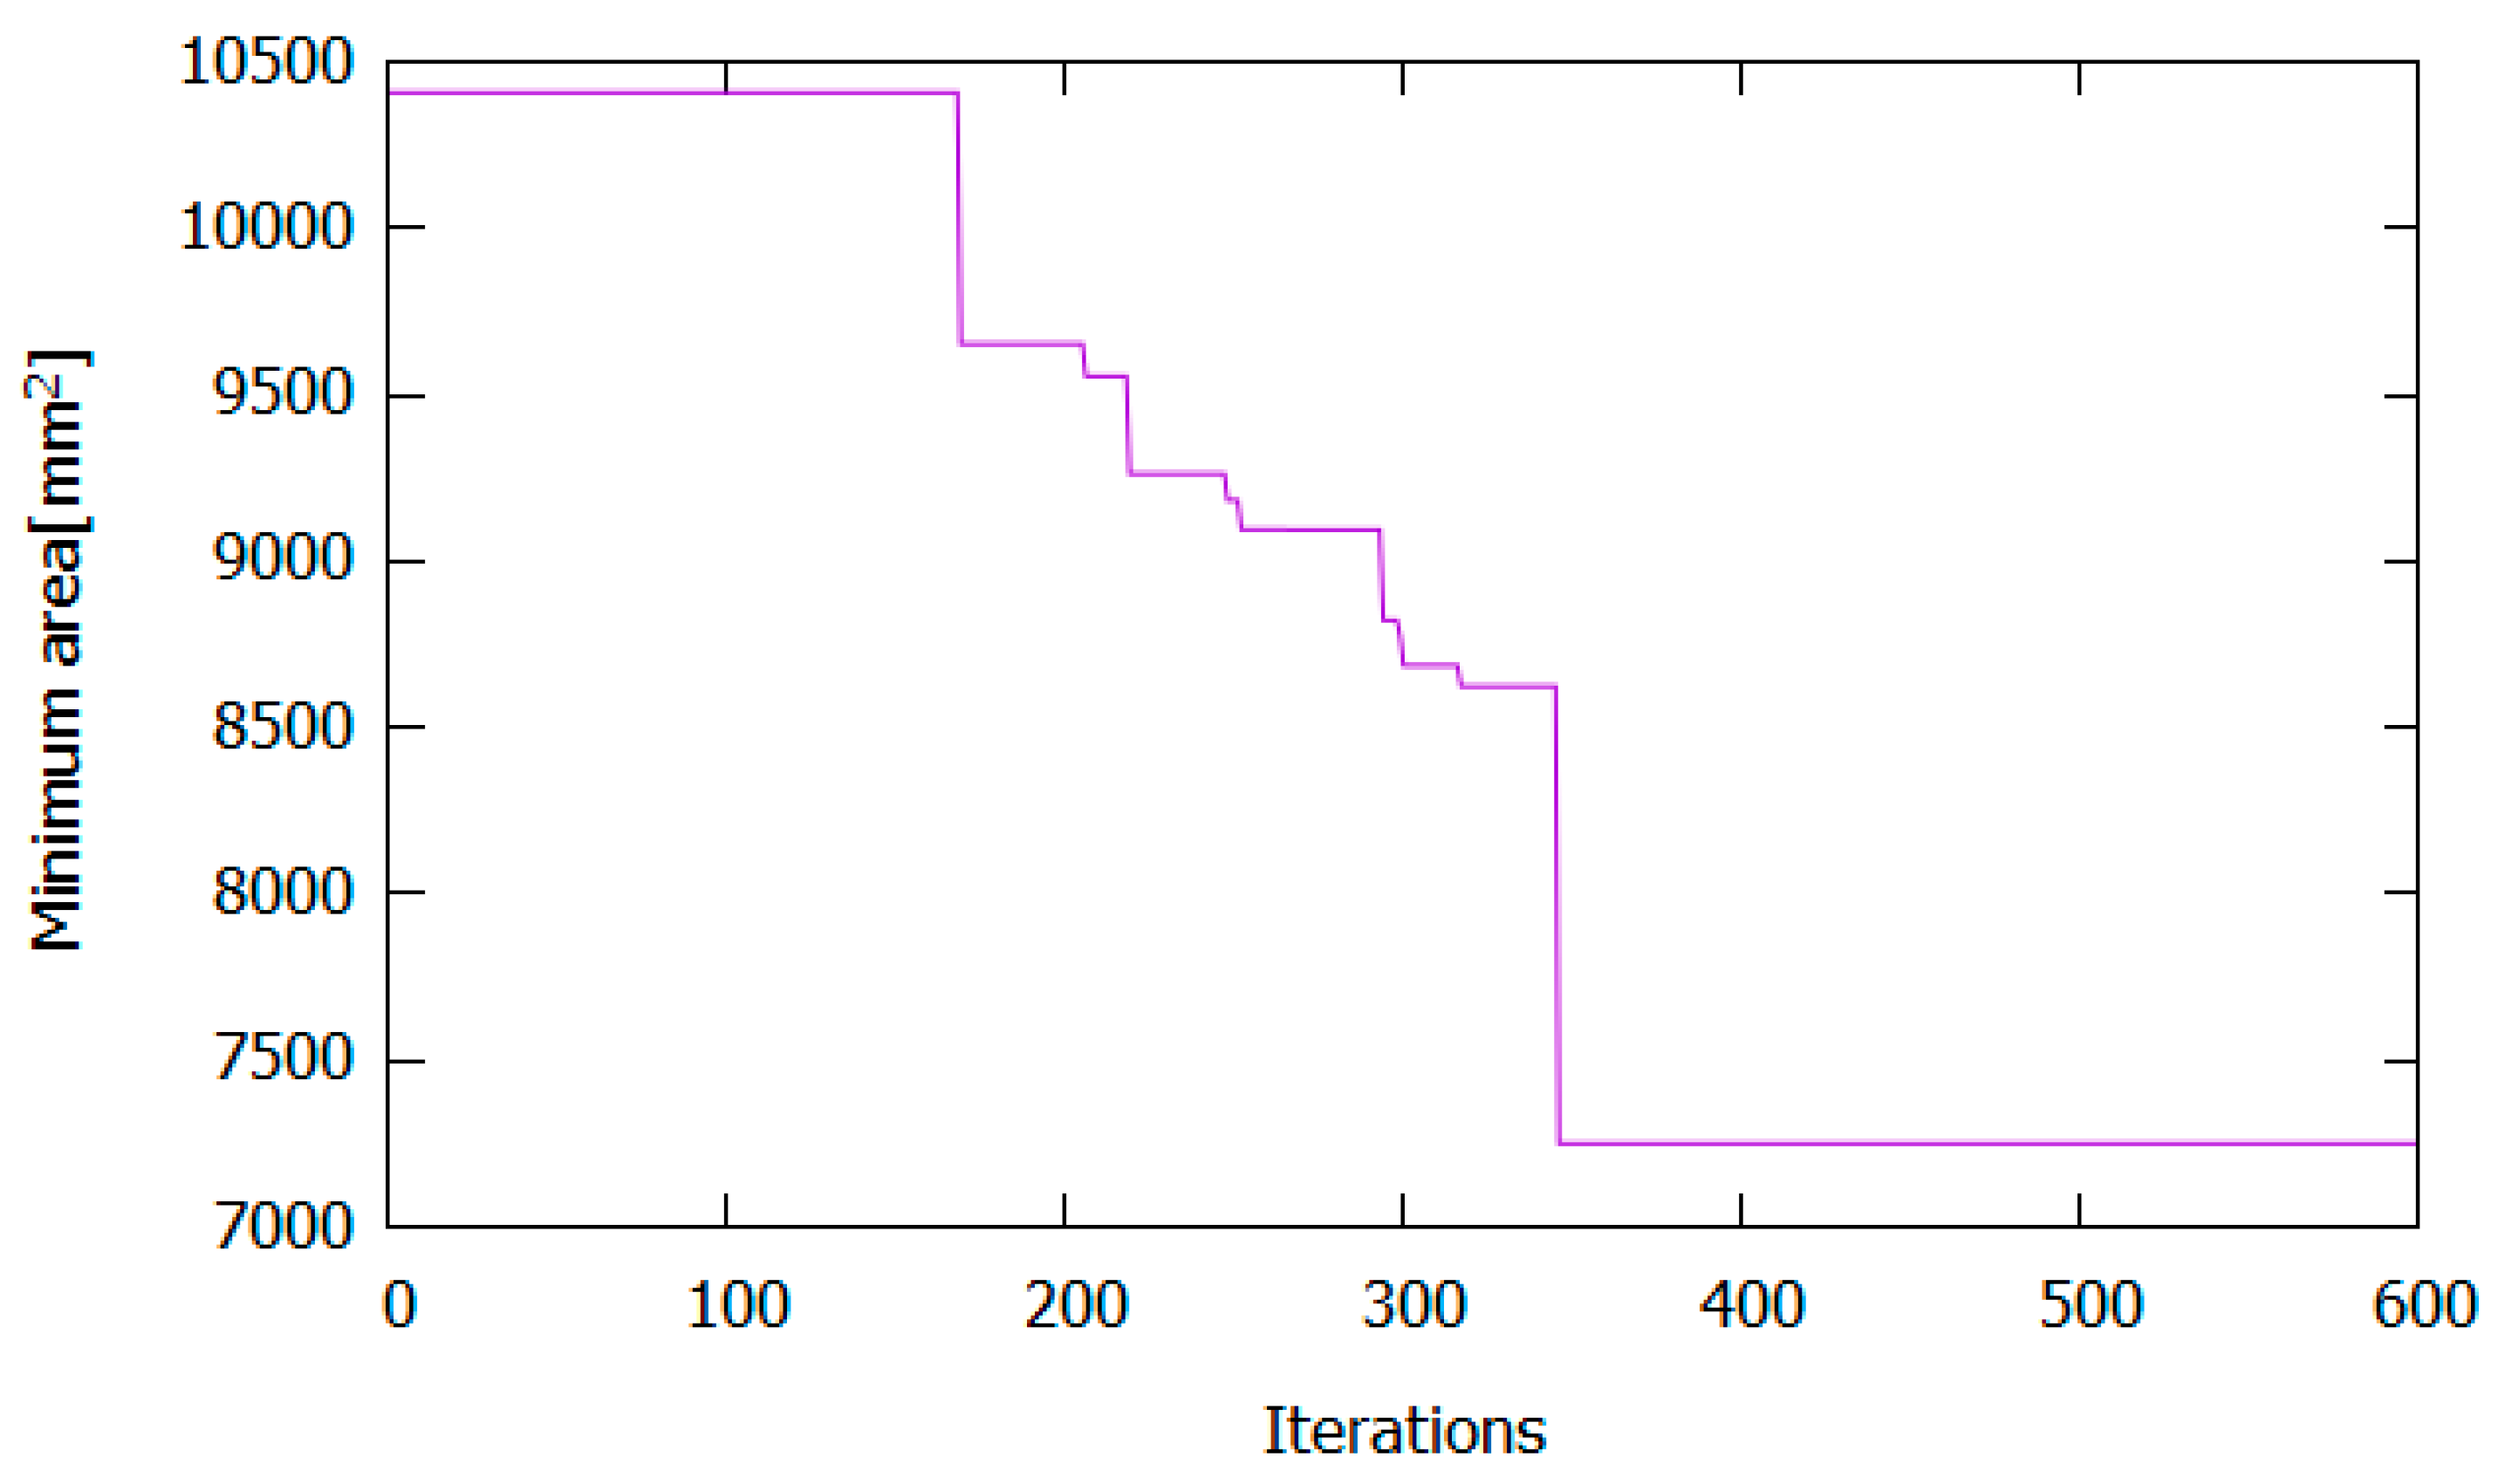
Figure 11.
The ultimate shear stress variation for different values of web slenderness.
Figure 12.
The variation of the ultimate shear stress with respect to the angle of the panel diagonal.
Figure 12.
The variation of the ultimate shear stress with respect to the angle of the panel diagonal.

Table 1.
Geometric and material properties used in the experimental study by Mamazizi et al. [14].
Table 1.
Geometric and material properties used in the experimental study by Mamazizi et al. [14].
| 15 | 250 | 2 | 800 | 750 | 235 | 210 |
Table 2.
Lower bounds for the flange and web dimensions in the harmony search optimisation.
| 5 | 100 | 1 | 200 |
Table 3.
Geometric and mechanical properties of the optimised cross-section with slender web.
| Experimental value | 250 | 15 | 800 | 2 | 750 | 64.017 | 9100 | |
| Optimised value | 265.4 | 8.59 | 1182 | 1 | 750 | 70.98 | 5741 | |
| Difference [%] | 6.16 | −43 | 48 | −50 | 0 | 0.008 | 11 | −37 |
Table 4.
Geometric and mechanical properties of the optimised cross-section with noncompact web.
| Experimental value | 250 | 15 | 800 | 2 | 750 | 64.017 | 9100 | |
| Optimised value | 374 | 8.97 | 399 | 2.31 | 750 | 64.029 | 7629 | |
| Difference [%] | 66 | −54 | −52 | 14 | 0 | 0.19 | 0.02 | −16 |
Table 5.
Geometric properties of the optimised cross-section with slender web under distributed loading.
Table 5.
Geometric properties of the optimised cross-section with slender web under distributed loading.
| Experimental value | 250 | 15 | 800 | 2 | 750 | 9100 |
| Optimised value | 263.83 | 11.26 | 492.21 | 2.66 | 750 | 7250 |
| Difference [%] | 5.53 | −25 | −38 | 33 | 0 | −20 |
© 2020 by the authors. Licensee MDPI, Basel, Switzerland. This article is an open access article distributed under the terms and conditions of the Creative Commons Attribution (CC BY) license (http://creativecommons.org/licenses/by/4.0/).
Share and Cite
MDPI and ACS Style
Cakiroglu, C.; Bekdaş, G.; Kim, S.; Geem, Z.W. Optimisation of Shear and Lateral–Torsional Buckling of Steel Plate Girders Using Meta-Heuristic Algorithms. Appl. Sci. 2020, 10, 3639. https://doi.org/10.3390/app10103639
AMA Style
Cakiroglu C, Bekdaş G, Kim S, Geem ZW. Optimisation of Shear and Lateral–Torsional Buckling of Steel Plate Girders Using Meta-Heuristic Algorithms. Applied Sciences. 2020; 10(10):3639. https://doi.org/10.3390/app10103639
Chicago/Turabian StyleCakiroglu, Celal, Gebrail Bekdaş, Sanghun Kim, and Zong Woo Geem. 2020. "Optimisation of Shear and Lateral–Torsional Buckling of Steel Plate Girders Using Meta-Heuristic Algorithms" Applied Sciences 10, no. 10: 3639. https://doi.org/10.3390/app10103639
Note that from the first issue of 2016, this journal uses article numbers instead of page numbers. See further details here.