Hybrid Fault Diagnosis of Bearings: Adaptive Fuzzy Orthonormal-ARX Robust Feedback Observer


1
Department of Electrical, Electronics and Computer Engineering, University of Ulsan, Ulsan 680-479, Korea
2
School of IT Convergence, University of Ulsan, Ulsan 680-479, Korea
*
Author to whom correspondence should be addressed.
Appl. Sci. 2020, 10(10), 3587; https://doi.org/10.3390/app10103587
Submission received: 20 April 2020
/
Accepted: 19 May 2020
/
Published: 22 May 2020
(This article belongs to the Special Issue Bearing Fault Detection and Diagnosis)
Abstract
:Rolling-element bearings (REBs) make up a class of non-linear rotating machines that can be applied in several activities. Conceding a bearing has complicated and uncertain behavior that exhibits substantial challenges to fault diagnosis. Thus, the offered anomaly-diagnosis algorithm, based on a fuzzy orthonormal-ARX adaptive fuzzy logic-structure feedback observer, is developed. A fuzzy orthonormal-ARX algorithm is presented for non-stationary signal modeling. Next, a robust, stable, reliable, and accurate observer is developed for signal estimation. Therefore, firstly, a classical feedback observer is implemented. To address the robustness drawback found in feedback observers, a multi-structure technique is developed. Furthermore, to generate signal estimation performance and reliability, the fuzzy logic technique is applied to the structure feedback observer. Also, to improve the stability, reliability, and robustness of the fuzzy orthonormal-ARX fuzzy logic-structure feedback observer, an adaptive algorithm is developed. After generating the residual signals, a support vector machine (SVM) is developed for the detection and classification of the bearing fault conditions. The effectiveness of the proposed procedure is validated using two different datasets for single-type fault diagnosis based on the Case Western Reverse University (CWRU) vibration dataset and multi-type fault diagnosis of bearing using the Smart Health Safety Environment (SHSE) Lab acoustic emission dataset. The proposed algorithm increases the classification accuracy from 86% in the SVM-based fuzzy orthonormal-ARX feedback observer to 97.5% in single-type fault and from 80% to 98.3% in the multi-type faults.
1. Introduction
Energy is essential for the survival and strength of modern industrial civilization. Generally, the sources of energy are fossil fuels such as oil and coal. Use of these fuels has significant impacts on the environment, one of the main challenges being greenhouse gas (GHG) emissions, with carbon dioxide (CO2) as their major component [1]. Regularly, 29 Gigatons (Gt) of CO2 are emitted every year, of which, about 7 Gt can be absorbed naturally [2]. The remainder enters the atmosphere, causing issues such as global warming and pollution. In recent years, the rate of industrialization has sharply increased, causing an increase in the rate of GHG emissions. About 50% of the energy produced by various techniques is consumed by heavy industries. The most widely used electro-mechanical equipment, consuming about 80% of the industrial electricity total, is various types of motors. Based on the energy efficiency trends seen in the energy audits of the various industries, optimization of power consumption, condition monitoring and fault diagnosis, and power quality improvements are important factors in energy efficiency. There is also serious attention on the disturbing effects of systems anomalies on energy efficiency and thus the environment since conservation of the environment’s quality and energy efficiency are major challenges in most countries around the world [2,3]. Most research and industry initiatives over the last decade have resulted in a significant decrease in the share of energy losses due to faulty industrial systems. However, in some fields, such as induction motors, reliable techniques must still be designed.
Induction motors have been used in several applications. This electro-mechanical system has non-linear dynamic behaviors and non-linearities, which can lead to various challenges in fault detection and diagnosis. Mechanical and electrical malfunctions are the two main categories of induction motor faults. Various types of induction motor anomalies have been defined and are categorized as: (a) mechanical faults (79%) and (b) electrical faults (21%). The mechanical anomalies can be categorized into two main groups: (a) bearing faults (69%) and rotor failures (10%) [4]. The associated task complexity and non-linear parameters in REBs have led to numerous anomalies detection and classification difficulties. Four types of faults found in REBs such as inner faults, outer faults, ball faults, and cage faults [5].
Several methods have been advised for anomaly detection and identification in REBs. These techniques can be divided into four principal divisions: model-based techniques, signal-based approaches, data-driven algorithms, and hybrid-based procedures [6,7]. The model-based fault diagnosis techniques are reliable and robust algorithms and have been used in various applications. Observation-based algorithms are the main model-based techniques used for bearing fault diagnosis [8]. Despite the advantages of observation-based approaches, these techniques have some limitations in the presence of uncertain and unknown conditions [8,9]. Non-linear-based observation techniques (e.g., sliding mode observer, feedback linearization observer) and linear-based observation algorithms (e.g., proportional-integral (PI) observer) are the main procedures used to develop observation to estimate the signals [10]. The PI observer is a linear and easy to implement technique for system estimation but have limited robustness and accuracy [10,11,12]. The sliding mode observer is a non-linear and high-gain observer that can improve a system’s dynamic and reduce the estimator error infinite time. This technique is robust and reliable but is prone to chattering phenomenon and limited estimation accuracy. To minimize the chattering phenomenon, the higher-order super-twisting sliding mode observer has been recommended in the literature. This technique suffers from a somewhat reduced estimation accuracy [8]. To minimize the effect of the chattering phenomenon, a feedback linearization observer was developed. The feedback linearization observer is a powerful technique for signal estimation. The main idea of this approach is to algebraically transform the non-linear system dynamic parameters into a linearized system so that the feedback observation algorithm can be applied. This observer is based on the dynamics of the system’s behavior. Thus, it works perfectly if all parameters are known. Apart from the stability and reliability of this observation technique, it suffers from a lack of robustness. To address this issue, the variable structure technique and sliding mode procedure are used to improve the fault estimation performance in certain and uncertain conditions. Despite the advantages of this technique, it suffers from system modeling complexities and poor estimation accuracy in uncertain conditions [9]. Hybrid-based fault diagnosis techniques are considered to be a reliable, stable, and robust techniques. These techniques use various algorithms in parallel to develop the achievement of the fault detection and fault classification algorithm [6,7]. In this work, a hybrid-based observer that uses a combination of the fuzzy orthonormal-ARX technique, a fuzzy multi-structure feedback observer, and a machine learning-based classification called support vector machine (SVM) is introduced for the diagnosis of bearing faults of various severities.
System modeling is the main argument in designing model-based techniques for fault diagnosis [12,13,14]. However, numerous procedures have been used to model REBs and can be classified into two main groups: mathematical-based system modeling such as five-degrees-of-freedom mathematical modeling of vibration signals [13], and system identification techniques such as ARX-Laguerre vibration and bearing acoustic emission signal modeling [10,12]. Mathematical-based bearing modeling is reliable and stable but is limited in uncertain and unknown conditions [11,15]. To decrease these limitations, an identification technique is advised in the literature [12,16]. The ARX-Laguerre technique is robust and stable, but has some limitations when applied to non-linear and non-stationary signal modeling [10,12,17]. To address these problems, a fuzzy orthonormal-ARX technique for vibration and acoustic emission bearing signals is prescribed in this work.
Once the rotary machinery bearing is modeled based on a system identification technique (the fuzzy orthonormal-ARX method), and the rotary machinery bearing signals are estimated based on the fuzzy extended-state observer (the fuzzy orthonormal-ARX fuzzy multi-structure feedback observer), a decision regarding the bearing conditions can be made. In this work, a machine learning-based classification technique called a support vector machine (SVM) is employed to implement the decision-making procedure for bearing fault diagnosis to complete the proposed technique for diagnosis the fault [18,19,20].
In this work, a hybrid-based approach is developed for fault diagnosis in REBs. First, fuzzy orthonormal-ARX is used to model the vibration and acoustic emission (AE) for bearing signals. Next, to estimate the signals, a feedback observer (FO) is developed for two kinds of signals. Then, to solve the challenge of robustness in feedback observer, the multi-structure technique is represented to develop a multi-structure feedback observer (SFO). Also, the fuzzy technique is used to improve the accuracy of the multi-structure feedback observer. Finally, an adaptive technique is used to optimize the multi-structure parameter, which is important to improving robustness and accuracy. The fuzzy orthonormal-ARX adaptive fuzzy logic-structure feedback observer (proposed method) is used for accurate signal estimation. After generating the energy residual signal, the SVM is used for fault classification. The effectiveness of the proposed method for fault detection and identification is compared with that of SFO and FO and evaluated using two different datasets: (a) the Case Western Reverse University (CWRU) vibration bearing dataset to test single-type faults [5,21], and (b) the Smart HSE Lab AE bearing data set to test multi-type faults [5,10,21]. Figure 1 illustrates a block diagram of the fuzzy orthonormal-ARX adaptive fuzzy logic-structure feedback observer. The main contributions of this research are:
- Develop an accurate and robust system modeling using a fuzzy orthonormal-ARX bearing modeling for vibration and AE signals.
- Develop an accurate, robust, and reliable technique for signal estimation based on the fuzzy orthonormal-ARX adaptive fuzzy logic-structure feedback observer.
- Improve the performance of fault detection and classification based on generating the differentiable residual signals, extract the energy features from residual signals, and applied to machine learning (SVM) technique in parallel with the fuzzy orthonormal-ARX adaptive fuzzy logic-structure feedback observer.
This paper is organized as follows. The second section outlines the bearing modeling for the vibration and AE signals based on the fuzzy orthonormal-ARX technique. The third section has two main sub-parts: firstly, the fuzzy orthonormal-ARX adaptive fuzzy logic-structure feedback observer is used to signal estimation and (b) the machine-learning technique based on the SVM is developed for fault detection and identification. In the fourth section, the datasets are introduced and the proposed method for fault diagnosis of REBs is analyzed. Conclusions are provided in the last section.
2. Rolling-Element Bearing Modeling Using Fuzzy Orthonormal-ARX Technique
System modeling is the main argument in complicated systems, especially in uncertain and unknown conditions. Mathematical-based bearing modeling is reliable and stable but is limited in uncertain and unknown conditions. Therefore, to decrease these limitations, the fuzzy orthonormal-ARX technique is prescribed in this work. As shown in Figure 1, the REBs modeling technique based on the fuzzy orthonormal-ARX technique is classified into three main steps: (a) ARX technique for REBs modeling, (b) ARX technique robustness improvement using the orthonormal-ARX procedure, and (c) non-linear system modeling accuracy improvement using the fuzzy orthonormal-ARX algorithm. The ARX technique for vibration and AE signals can be developed using Equation (1) [11,12].
where , and are the REB model based on the ARX technique, the reference signal for the REB model, REB model parameters, and the order of the REB model, respectively. The REB model parameters can be represented as follows:
Here, and are the Fourier decomposition coefficients, orthonormal basis, and orthonormal function, respectively. The REB signals are non-linear, non-stationary, and complex, but the ARX technique is a linear algorithm. This technique cannot accurately estimate the REB signals. Therefore, to improve robustness, an orthonormal-ARX procedure is developed for REB modeling.
Here, , and are the REB model based on the orthonormal-ARX technique, the REB orthonormal function for measurement output, and the REB orthonormal function for measurement input, respectively. To address the issues of non-linearity in the REB model and to increase modeling accuracy, a fuzzy technique is developed. To modeling the non-linearity in the REB, a two-input fuzzy technique is developed based on the following equation.
Here, , and are the first fuzzy input, the first fuzzy linguistic variable, the second fuzzy input, the second fuzzy linguistic variable, the output of the fuzzy, and the linguistic variable for the output of the fuzzy, respectively. Thus, the state-space fuzzy orthonormal-ARX equation for modeling the REB is generated as follows:
Here, , and are the fuzzy orthonormal-ARX technique to modeling the state of the REB, the fuzzy orthonormal-ARX method to modeling the output of the REB, the fuzzy algorithm to modeling the non-linear signal, and the fine-tuning coefficients, respectively. Figure 2 demonstrates the error signals of the REB model based on the ARX technique, the orthonormal-ARX method, and the fuzzy orthonormal-ARX procedure. This figure shows that the accuracy of the fuzzy orthonormal-ARX technique for bearing modeling is better than the orthonormal-ARX procedure and the ARX method.
3. Anomaly Diagnosis Based on Proposed Hybrid Algorithm
Figure 1 shows that the vibration and AE signals of a normal bearing can be modelled based on the fuzzy orthonormal-ARX technique. In this section, the fuzzy orthonormal-ARX fuzzy logic-structure feedback observer (proposed model) is developed to increase the signal estimation accuracy for bearing vibration and AE signals that is the main key to fault detection and classification. As shown in Figure 1, the signal estimation is developed using four steps: (1) develop the fuzzy orthonormal-ARX feedback observer (FO) technique to estimate the signals using the model-based observation technique, (2) to improve robustness in crack-variant and speed-variant conditions, the fuzzy orthonormal-ARX structure feedback observer (SFO) is developed, (3) to improve the estimation of non-linearity in the vibration/AE signals and to improve accuracy, the fuzzy orthonormal-ARX fuzzy structure feedback observer (FSFO) is presented, and (4) improve reliability and stability using the adaptive algorithm for online tuning of the parameters of the proposed algorithm.
3.1. Fuzzy Orthonormal-ARX Adaptive Fuzzy Logic-Structure Feedback Observer for Fault Estimation
The fuzzy orthonormal-ARX feedback observer is represented by the following definition,
To improve the accuracy uncertainty (e.g., motor speed variation) estimation of the fuzzy orthonormal-ARX feedback observer, the following definition can be defined.
Here, , and are the fuzzy orthonormal-ARX feedback observer for estimation state of the REB model, the fuzzy orthonormal-ARX feedback observer for estimation of the REB signal, the fuzzy technique for the non-linear part of the signal estimation, the fuzzy orthonormal-ARX feedback observer for estimation the uncertainty (motor speed variation) to minimize the error in normal conditions, the REB original signals, and the coefficient of the fuzzy orthonormal-ARX feedback observer, respectively.
As seen in Figure 1, the fuzzy orthonormal-ARX feedback observer suffers from poor robustness, especially in unknown (crack-variant or speed-variant) situations. Therefore, the fuzzy orthonormal-ARX structure feedback observer is developed to overcome this obstacle. The following technique is used to improve the robustness based on multi-structure algorithm.
To improve robustness, the uncertainty can be estimated by the fuzzy orthonormal-ARX structure feedback observer based on the following definition,
Here, , and are the fuzzy orthonormal-ARX structure feedback observer for estimation state of the REB model, the fuzzy orthonormal-ARX structure feedback observer for estimation of the REB signal, the fuzzy orthonormal-ARX structure feedback observer for estimation the uncertainty (motor speed variation) to minimize the error in normal conditions, and the coefficient of the fuzzy orthonormal-ARX structure feedback observer, respectively.
Hence, the fuzzy orthonormal-ARX fuzzy logic-structure feedback observer can be represented by the following equation,
In addition, the uncertainty signal estimation based on the fuzzy orthonormal-ARX fuzzy logic-structure feedback observer can be developed as follows:
Here, , and are the error estimations for the REB, the threshold value for tuning the estimation accuracy in TSK fuzzy algorithm, the uncertainty estimation based on fuzzy technique, coefficients, the fuzzy orthonormal-ARX fuzzy logic-structure feedback observer for estimation state of the REB model, the fuzzy orthonormal-ARX fuzzy logic-structure feedback observer for estimation of the REB signal, and the fuzzy orthonormal-ARX structure feedback observer for estimation the uncertainty (motor speed variation) to minimize the error in normal conditions, respectively.
Next, the adaptive technique is one of the best for increasing stability and reliability, especially in industrial applications. The structure surface coefficient and error surface coefficient are the main coefficients. Thus, the adaptive technique is developed to improve the stability and reliability of the fuzzy orthonormal-ARX fuzzy logic-structure feedback observer using the fuzzy orthonormal-ARX adaptive fuzzy logic-structure feedback observer (proposed method). In this work, a fuzzy algorithm is recommended for designing the adaptive algorithm. This technique is defined as follows:
The signal can then be estimated based on the proposed method and represented as follows:
Here, , and are the proposed method to obtain the error estimation for the REB, the proposed method to obtain the estimation state of the REB model, the proposed technique to obtain the estimation of the REB signal, and the proposed algorithm to estimate the uncertainty to minimize error and increase robustness in normal conditions.
3.2. Fault Detection and Fault Classification
Figure 1 shows that the proposed method minimizes the error in REB signal estimation in normal conditions. In this case, the residual signal is minimized in normal conditions and is defined as follows:
Thus, a fault can be identified based on the differences between residual signals in different conditions. Figure 3 illustrates the residual signals in normal and anomalous conditions based on the proposed method.
Due to the Figure 3, the fuzzy orthonormal-ARX adaptive fuzzy logic-structure feedback observer is a suitable technique for detection and classification the signals. Moreover, to improve the fault detection and classification performance, the energy feature is extracted from the residual signal and is introduced using the following equation,
Here, is the sample of the residual signal obtained by the fuzzy orthonormal-ARX adaptive fuzzy logic-structure feedback observer and is the sample number. Figure 4 shows the energy of the bearing signals in normal and anomalous conditions, such as a ball fault, an inner fault, and outer degradation. The figure shows that the proposed method, residual signal generation, and energy feature extraction are outstanding techniques for fault detection and identification.
Besides, the decision-making unit is developed to detect and classify the faults based on the difference between the amplitude of the residual signal’s energy. Therefore, to develop a decision-making unit, a support vector machine (SVM) that is a powerful mathematical technique is presented in this work. The soft margin SVM can be defined by the following equation [20,23,24].
| Algorithm 1. The proposed hybrid approach for fault diagnosis in a bearing. | |
| 1: | Model the systems using the fuzzy orthonormal-ARX procedure (5) |
| 2: | Develop a fuzzy orthonormal-ARX feedback observer for signal estimation (6,7) |
| 3: | Develop a fuzzy orthonormal-ARX structure feedback observer to improve the robustness (8,9) |
| 4: | Improve the fault estimation accuracy using the fuzzy orthonormal-ARX fuzzy logic-structure feedback observer (11,12) |
| 5: | Develop the fuzzy orthonormal-ARX adaptive fuzzy logic-structure feedback observer to increase fault estimation accuracy, reliability, and robustness (14,15) |
| 6: | Generate the residual signal (16) |
| 7: | Run residual signal characterization by energy (17) |
| 8: | Apply the classification technique using SVM for fault diagnosis (18) |
4. Datasets and Results
In this work, two different datasets are used to evaluate the proposed algorithm.
4.1. Datasets
The Case Western Reserve University (CWRU) benchmark bearing dataset and the Smart HSE (SHSE) Lab bearing dataset are used validate the single- and multi-type fault diagnosis based on the SVM-based fuzzy orthonormal-ARX adaptive fuzzy logic-structure feedback observer (proposed method), the SVM-based fuzzy orthonormal-ARX structure feedback observer (SFO), and the SVM-based fuzzy orthonormal-ARX feedback observer (FO).
4.1.1. Case Western Reverse University (CWRU) Bearing Dataset
The CWRU dataset is used to test the effectiveness of the proposed algorithm using a vibration single crack fault. The vibration sensor is used to collect vibration signals in various conditions such as normal faults, ball faults, inner (IR) faults, and outer (OR) faults. The sampling rate of the record data is 12 kHz under four different motor torque loads (0 to 3 horsepower (hp)) under different rotation velocities from 1730 rpm to 1790 rpm. Table 1 shows the data classification of the CWRU bearing dataset. Furthermore, the CWRU vibration signals have three different crack sizes: 0.007, 0.014, and 0.021 inches in diameter [5,21].
4.1.2. Smart Health, Safety, Environment (SHSE) Lab Acoustic Emission (AE) Bearing Dataset
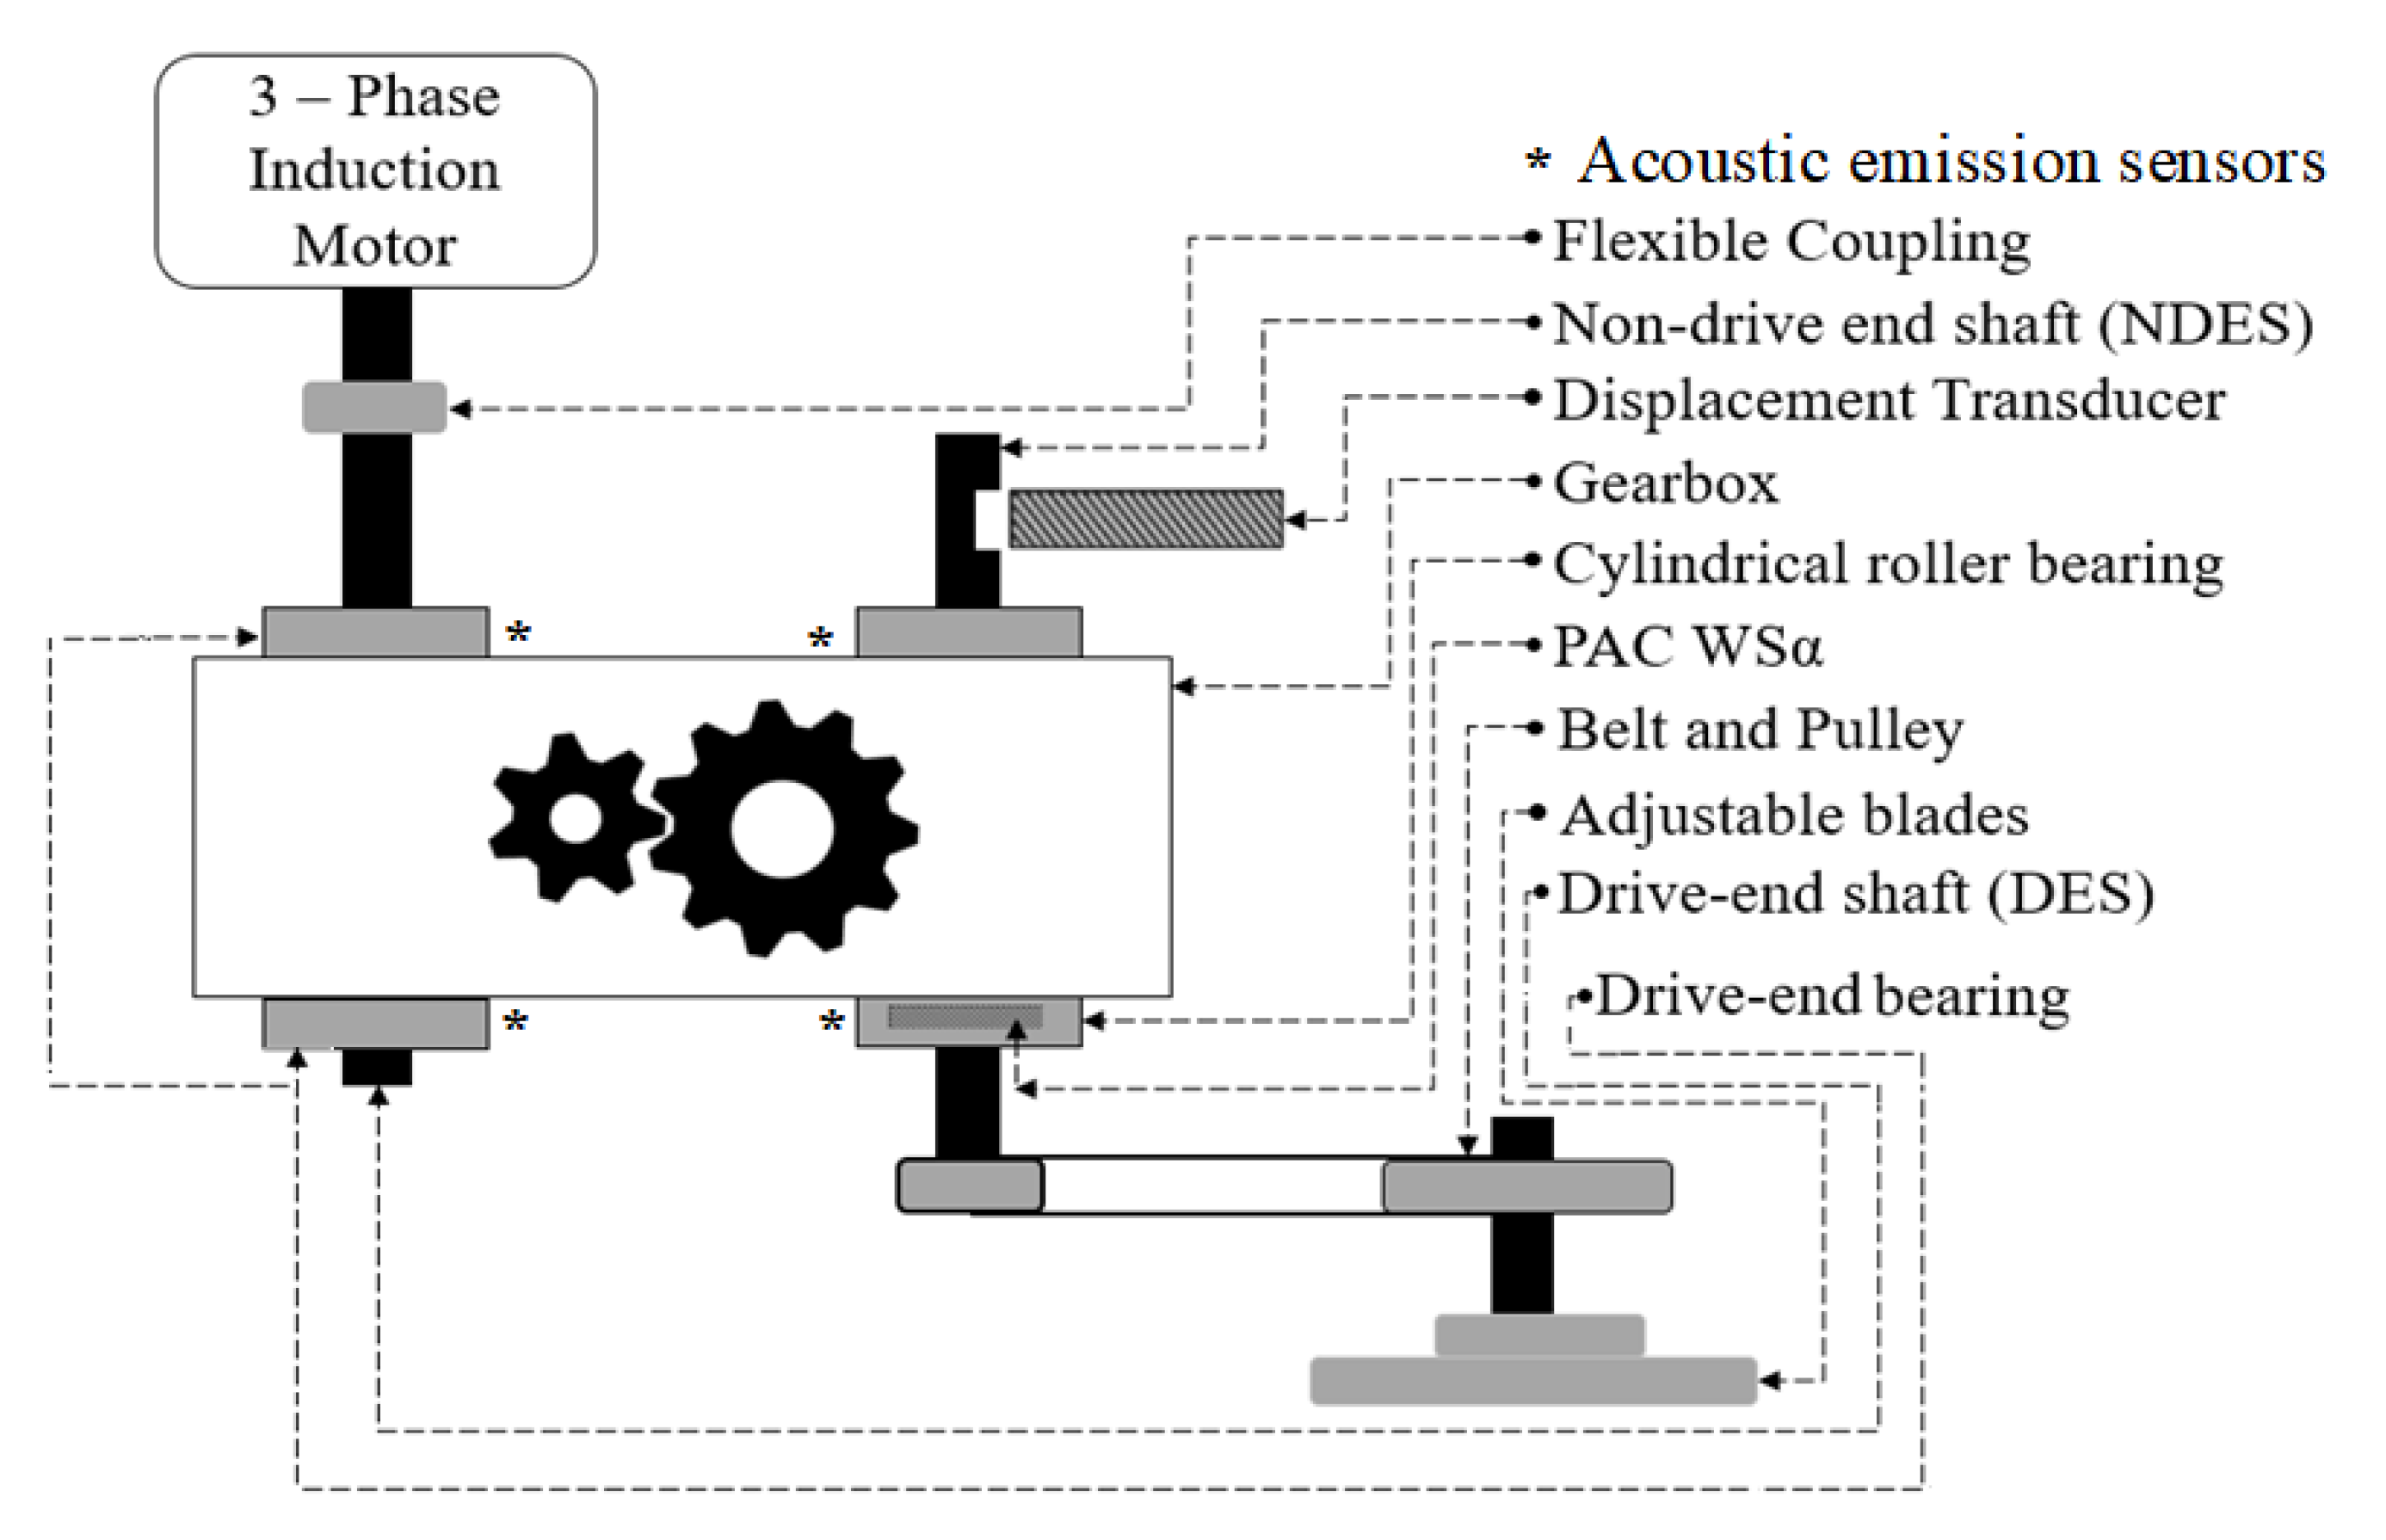
The SHSE acoustic emission dataset is used to test the effectiveness of the proposed algorithm using AE multi-crack faults. An AE sensor is used to collect data in various conditions including normal conditions, ball faults, inner (IR) faults, outer (OR) faults, inner-ball (IR-Ball) faults, inner-outer (IR-OR) faults, and inner-outer-ball (IR-OR-Ball) faults. The sampling rate of the record data is 250 kHz under four different rotational velocities (300 rpm, 400 rpm, 450 rpm, and 500 rpm) for two crack sizes: 3 and 6 millimeters in diameter. Figure 5 illustrates the bearing data collection testbench. Table 2 shows the SHSE Lab acoustic emission bearing dataset [10].
4.2. Results
The effectiveness of fault diagnosis using the SVM-based fuzzy orthonormal-ARX adaptive fuzzy logic-structure feedback observer (proposed method) is validated against two state-of-the-art approaches, namely, the SVM-based fuzzy orthonormal-ARX structure feedback observer (SFO) and the SVM-based fuzzy orthonormal-ARX feedback observer (FO), to test single-type and multi-type fault diagnosis using vibration and AE datasets (the CWRU dataset and the SHSE Lab dataset). To test the robustness of these techniques, two different conditions are analyzed in each case study—crack-variant and load-variant.
4.2.1. Single-Type Fault Diagnosis Provided by the CWRU Dataset
For analyzing the fault diagnosis capabilities of the proposed methodology, SFO and FO techniques, the energy of residual signals that extracted from CWRU consisting of 1600 samples (400 data instances per class) was randomly split into training and testing subsets. Specifically, 1200 samples (300 instances per class) were used for training SVM classification algorithms, whereas the remaining previously unobserved 400 samples (100 instances per class) were utilized for the testing process. In the first step, we investigate the fault diagnosis capabilities of the proposed method, SFO, and FO on four different crack-variant CWRU datasets, when the torque load remains fixed. The fault diagnosis results and the average of accuracy (ACA) are tabularized in Table 3, Table 4, Table 5 and Table 6.
Regarding these tables, the proposed algorithm for bearing fault diagnosis clearly outperforms the state-of-the-art techniques used for comparison in this work for all fault types. In addition, the average of fault diagnosis accuracy for the proposed method is about 98.13%, while for the SFO it is about 93.5%, and for the FO is 90.3%. Moreover, the proposed method outperforms the SFO, yielding average performance accuracy increases of about 4.7%, 4%, and 5.1% for 0.007-inch, 0.014-inch, and 0.021-inch crack sizes, respectively. In addition, the proposed method outperforms the FO, yielding average performance accuracy increases of about 7.9%, 6.9%, and 8.8% for 0.007-inch, 0.014-inch, and 0.021-inch crack sizes, respectively. To test the robustness, the CWRU dataset with load variation is used. The fault diagnosis results are tabularized in Table 7.
Regarding this table, the average fault diagnosis accuracy in the presence of load variation for the proposed method is about 97.5%, for the SFO it is about 90.3%, and for the FO it is 86%. Moreover, the proposed method for fault diagnosis outperforms the SFO, yielding average performance accuracy increases of about 7.8%, 5.7%, and 4.8% for 0.007-inch, 0.014-inch, and 0.021-inch crack sizes, respectively. Furthermore, the proposed method outperforms the FO, yielding average performance accuracy increases of about 11%, 11.2%, and 11% for 0.007-inch, 0.014-inch, and 0.021-inch crack sizes, respectively. Therefore, the proposed method is more robust than the other two methods for single-type fault diagnosis in bearings.
4.2.2. Multi-Type Fault Diagnosis Provided by the SHSE Lab Dataset
In this section, we discuss the fault diagnosis capabilities of the proposed method, SFO, and FO on crack-variant datasets when the torque speeds remain fixed. For analyzing the fault diagnosis capabilities of the proposed methodology, SFO and FO techniques, the energy of residual signals that extracted from SHSE Lab dataset consisting of 3200 samples (400 data instances per class) was randomly split into training and testing subsets. Specifically, 2400 samples (300 instances per class) were used for training SVM classification algorithms, whereas the remaining previously unobserved 800 samples (100 instances per class) were utilized for the testing process. The fault diagnosis results and the average of accuracy (ACA) for the acoustic emission REB datasets provided by the SHSE Lab with various crack diameters (3 mm and 6 mm) and fixed torque speed conditions are tabularized in Table 8, Table 9, Table 10 and Table 11. These tables show that the proposed method outperforms the SFO, yielding average performance accuracy increases of about 3.2% and 2.93% for 3 mm and 6 mm crack sizes, respectively. In addition, the proposed method outperforms the FO, yielding average performance accuracy increases of about 18.75% and 17.78% for 3 mm and 6 mm crack sizes, respectively.
The SHSE acoustic emission dataset is used to test the robustness of the proposed method against motor speed variation for fault detection and diagnosis. The fault diagnosis results for the acoustic emission REB datasets provided by the SHSE Lab with motor speed variation and fixed crack sizes are tabularized in Table 12.
Table 12 shows that the average of fault diagnosis accuracy in the presence of load variation for the proposed method is about 97.95%, for the SFO is about 94.9%, and for the FO is 80.35%. Moreover, the proposed method of fault diagnosis outperforms the SFO, yielding average performance accuracy increases of about 3.4% and 2.7% for 3 mm and 6 mm crack sizes, respectively. Furthermore, the proposed fault diagnosis method outperforms the FO, yielding average performance accuracy increases of about 18% and 17.2% for 3 mm and 6 mm crack sizes, respectively. Thus, the proposed fault diagnosis method is more robust than the other two methods for multi-type fault diagnosis in bearings.
5. Conclusions
In this paper, a hybrid approach using the SVM-based fuzzy orthonormal-ARX adaptive fuzzy logic-structure feedback observer was developed for detection and classification of REB faults. To modeling the vibration and AE bearing signals, the fuzzy orthonormal-ARX technique is proposed. Next, signal estimation is developed in four main steps. Firstly, the feedback observer is implemented for vibration and AE signals. Secondly, the multi-structure technique is recommended to decrease the problems usually encountered with varying motor speeds. Thirdly, a TSK fuzzy procedure is suggested to decrease the estimation error. In the final step, the adaptive approach improves the reliability, robustness, and stability of the proposed signal estimation algorithm. Moreover, an SVM is used to detect and classify single-type and multi-type REB faults. Two different datasets are defined to validate the effectiveness of the proposed observer: (a) the CWRU vibration dataset, and (b) the AE signals provided by the SHSE Lab. The proposed algorithm increases the classification accuracy from 86% in the SVM-based fuzzy orthonormal-ARX feedback observer (FO) to 97.5% in single-type fault and from 80% to 98.3% in the multi-type faults. Furthermore, the average of single-type fault diagnosis accuracy in the presence of load variation for the proposed method is about 97.5%, for the SFO is about 90.3%, and for the FO is 86%. Additionally, for multi-type faults, the average of diagnostic accuracy in the presence of motor speed variation for the proposed method, SFO, and FO are 97.95%, 94.9%, and 80.35%, respectively. In future work, the prognostics challenge will be solved using hybrid observation approaches.
Author Contributions
All of the authors contributed equally to the conception of the idea, the design of experiments, the analysis and interpretation of results, as well as the writing of the manuscript. Writing—original draft preparation, F.P. and J.-M.K.; writing—review and editing, F.P. and J.-M.K. All authors have read and agreed to the published version of the manuscript.
Funding
This research was financially supported by the Ministry of Trade, Industry & Energy(MOTIE) of the Republic of Korea and Korea Institute for Advancement of Technology(KIAT) through the Encouragement Program for The Industries of Economic Cooperation Region. (P0006123).
Conflicts of Interest
The authors have no conflicts of interest to declare.
References
- Höök, M.; Tang, X. Depletion of fossil fuels and anthropogenic climate change—A review. Energy Policy 2013, 52, 797–809. [Google Scholar] [CrossRef] [Green Version]
- Abas, N.; Kalair, A.; Khan, N. Review of fossil fuels and future energy technologies. Futures 2015, 69, 31–49. [Google Scholar] [CrossRef]
- Asif, M.; Muneer, T. Energy supply, its demand and security issues for developed and emerging economies. Renew. Sustain. Energy Rev. 2007, 11, 1388–1413. [Google Scholar] [CrossRef]
- Duan, F. Induction Motor Parameters Estimation and Faults Diagnosis Using Optimisation Algorithms. Ph.D. Thesis, University of Adelaide, Adelaide, Australia, 2015. [Google Scholar]
- Adams, M.L. Analysis of Rolling Element Bearing Faults in Rotating Machinery: Experiments, Modeling, Fault Detection and Diagnosis; Case Western Reserve University: Cleveland, OH, USA, 2001. [Google Scholar]
- Gao, Z.; Cecati, C.; Ding, S.X. A survey of fault diagnosis and fault-tolerant techniques—Part I: Fault diagnosis with model-based and signal-based approaches. IEEE Trans. Ind. Electron. 2015, 62, 3757–3767. [Google Scholar] [CrossRef] [Green Version]
- Cecati, C. A survey of fault diagnosis and fault-tolerant techniques—Part II: Fault diagnosis with knowledge-based and hybrid/active approaches. IEEE Trans. Ind. Electron. 2015. [Google Scholar] [CrossRef]
- Piltan, F.; Kim, J.-M. Bearing fault diagnosis by a robust higher-order super-twisting sliding mode observer. Sensors 2018, 18, 1128. [Google Scholar] [CrossRef] [Green Version]
- Piltan, F.; Kim, J.-M. Bearing fault diagnosis using an extended variable structure feedback linearization observer. Sensors 2018, 18, 4359. [Google Scholar] [CrossRef] [PubMed] [Green Version]
- Piltan, F.; Kim, J.-M. Nonlinear Extended-state ARX-Laguerre PI Observer Fault Diagnosis of Bearings. Appl. Sci. 2019, 9, 888. [Google Scholar] [CrossRef] [Green Version]
- Bouzrara, K.; Garna, T.; Ragot, J.; Messaoud, H. Decomposition of an ARX model on Laguerre orthonormal bases. ISA Trans. 2012, 51, 848–860. [Google Scholar] [CrossRef]
- Najeh, T.; Njima, C.B.; Garna, T.; Ragot, J. Input fault detection and estimation using PI observer based on the ARX-Laguerre model. Int. J. Adv. Manuf. Technol. 2017, 90, 1317–1336. [Google Scholar] [CrossRef] [Green Version]
- Mishra, C.; Samantaray, A.; Chakraborty, G. Ball bearing defect models: A study of simulated and experimental fault signatures. J. Sound Vib. 2017, 400, 86–112. [Google Scholar] [CrossRef]
- Moreno, J.A.; Osorio, M. A Lyapunov Approach to Second-order Sliding Mode Controllers and Observers. In Proceedings of the 2008 47th IEEE Conference on Decision and Control, Cancun, Mexico, 9–11 December 2008; pp. 2856–2861. [Google Scholar]
- Boudiaf, A.; Moussaoui, A.; Dahane, A.; Atoui, I. A comparative study of various methods of bearing faults diagnosis using the case Western Reserve University data. J. Fail. Anal. Prev. 2016, 16, 271–284. [Google Scholar] [CrossRef]
- Forrai, A. System identification and fault diagnosis of an electromagnetic actuator. IEEE Trans. Control. Syst. Technol. 2016, 25, 1028–1035. [Google Scholar] [CrossRef]
- Piltan, F.; Prosvirin, A.E.; Jeong, I.; Im, K.; Kim, J.-M. Rolling-Element Bearing Fault Diagnosis Using Advanced Machine Learning-Based Observer. Appl. Sci. 2019, 9, 5404. [Google Scholar] [CrossRef] [Green Version]
- Cai, B.; Zhao, Y.; Liu, H.; Xie, M. A data-driven fault diagnosis methodology in three-phase inverters for PMSM drive systems. IEEE Trans. Power Electron. 2016, 32, 5590–5600. [Google Scholar] [CrossRef]
- Manevitz, L.M.; Yousef, M. One-class SVMs for document classification. J. Mach. Learn. Res. 2001, 2, 139–154. [Google Scholar]
- Piltan, F.; Prosvirin, A.E.; Sohaib, M.; Saldivar, B.; Kim, J.-M. An SVM-Based Neural Adaptive Variable Structure Observer for Fault Diagnosis and Fault-Tolerant Control of a Robot Manipulator. Appl. Sci. 2020, 10, 1344. [Google Scholar] [CrossRef] [Green Version]
- Center, B.D. Case Western Reserve University Seeded Fault Test Data; Case Western Reserve University: Cleveland, OH, USA, 2015. [Google Scholar]
- Li, L.; Ding, S.X.; Qiu, J.; Yang, Y.; Xu, D. Fuzzy observer-based fault detection design approach for nonlinear processes. IEEE Trans. Syst. Man Cyber. Syst. 2016, 47, 1941–1952. [Google Scholar] [CrossRef]
- Prosvirin, A.; Kim, J.; Kim, J.-M. Efficient Rub-impact Fault Diagnosis Scheme based on Hybrid Feature Extraction and SVM. In Advances in Computer Communication and Computational Sciences; Springer: Berlin, Germany, 2019; pp. 405–415. [Google Scholar]
- Elangovan, K.; Krishnasamy Tamilselvam, Y.; Mohan, R.E.; Iwase, M.; Takuma, N.; Wood, K.L. Fault Diagnosis of a Reconfigurable Crawling–Rolling Robot Based on Support Vector Machines. Appl. Sci. 2017, 7, 1025. [Google Scholar] [CrossRef] [Green Version]
Figure 1.
Proposed hybrid bearing fault diagnosis approach.
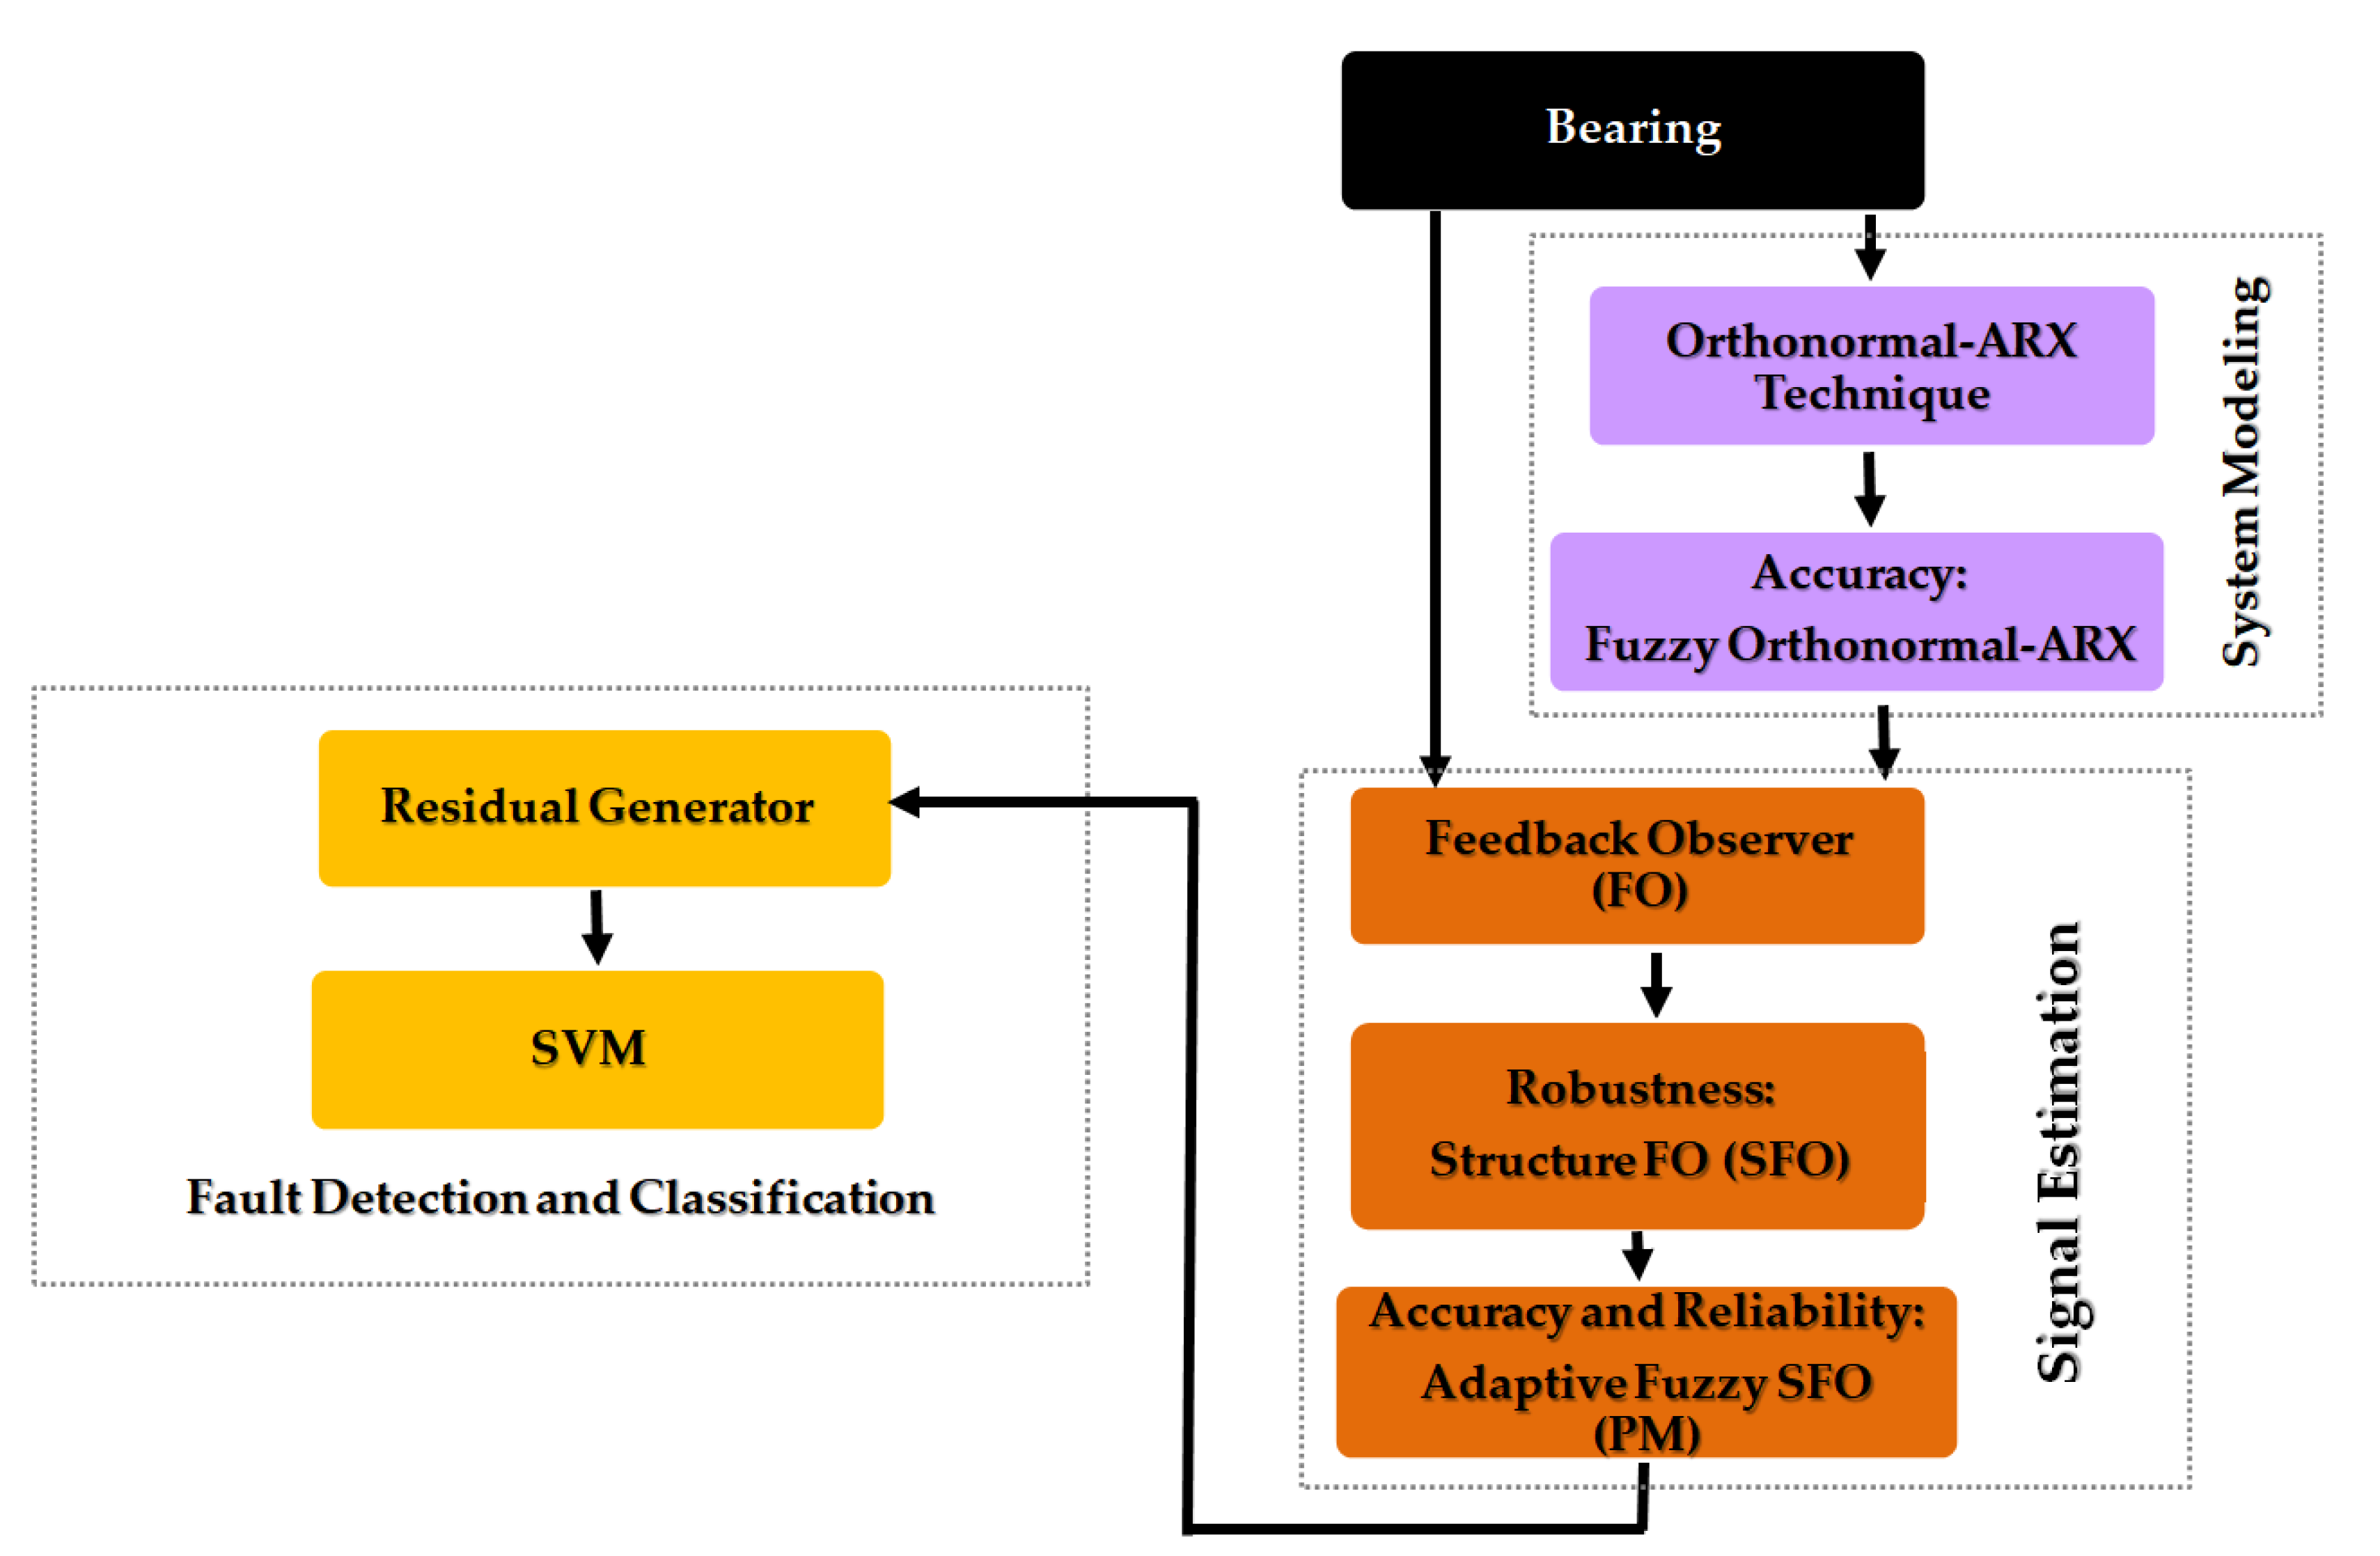
Figure 2.
The estimation signal error for rolling-element bearing (REB) signals using three techniques.
Figure 2.
The estimation signal error for rolling-element bearing (REB) signals using three techniques.
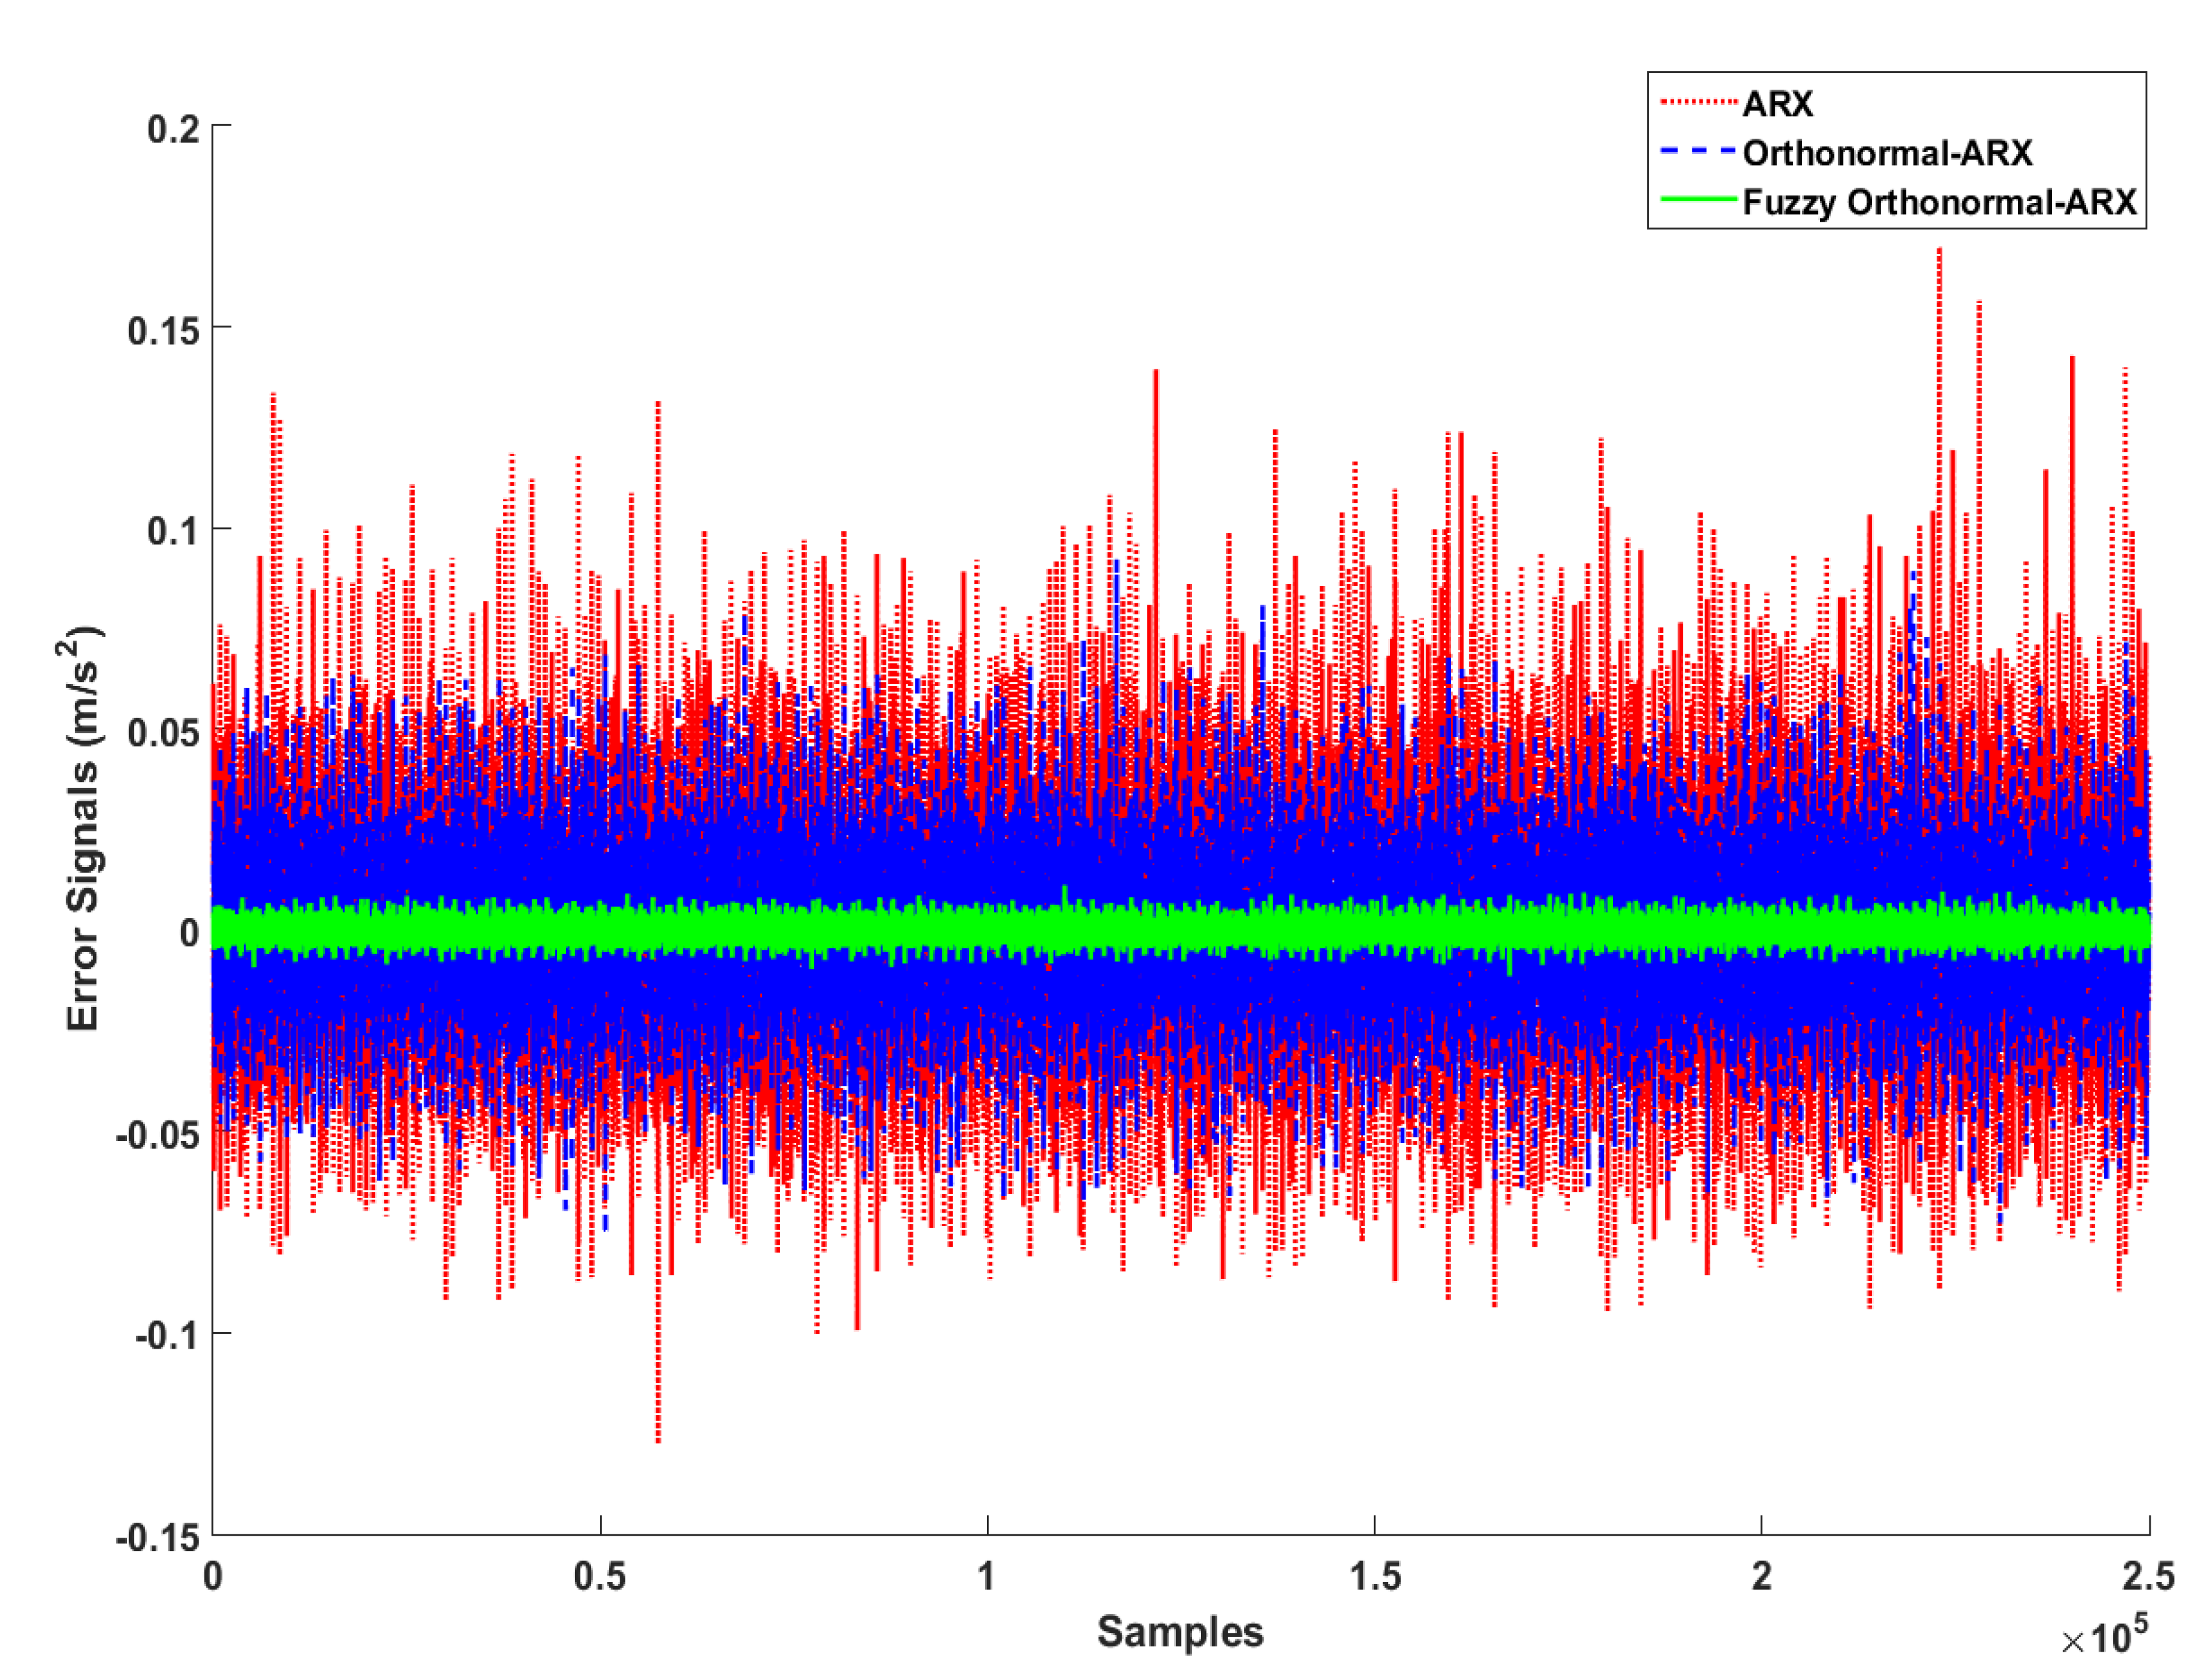
Figure 3.
Residual signals in normal and abnormal conditions using fuzzy orthonormal-ARX adaptive fuzzy logic-structure feedback (PM) observer.
Figure 3.
Residual signals in normal and abnormal conditions using fuzzy orthonormal-ARX adaptive fuzzy logic-structure feedback (PM) observer.

Figure 4.
Energy features in normal and anomalous conditions based on the fuzzy orthonormal-ARX adaptive fuzzy logic-structure feedback (PM) observer.
Figure 4.
Energy features in normal and anomalous conditions based on the fuzzy orthonormal-ARX adaptive fuzzy logic-structure feedback (PM) observer.
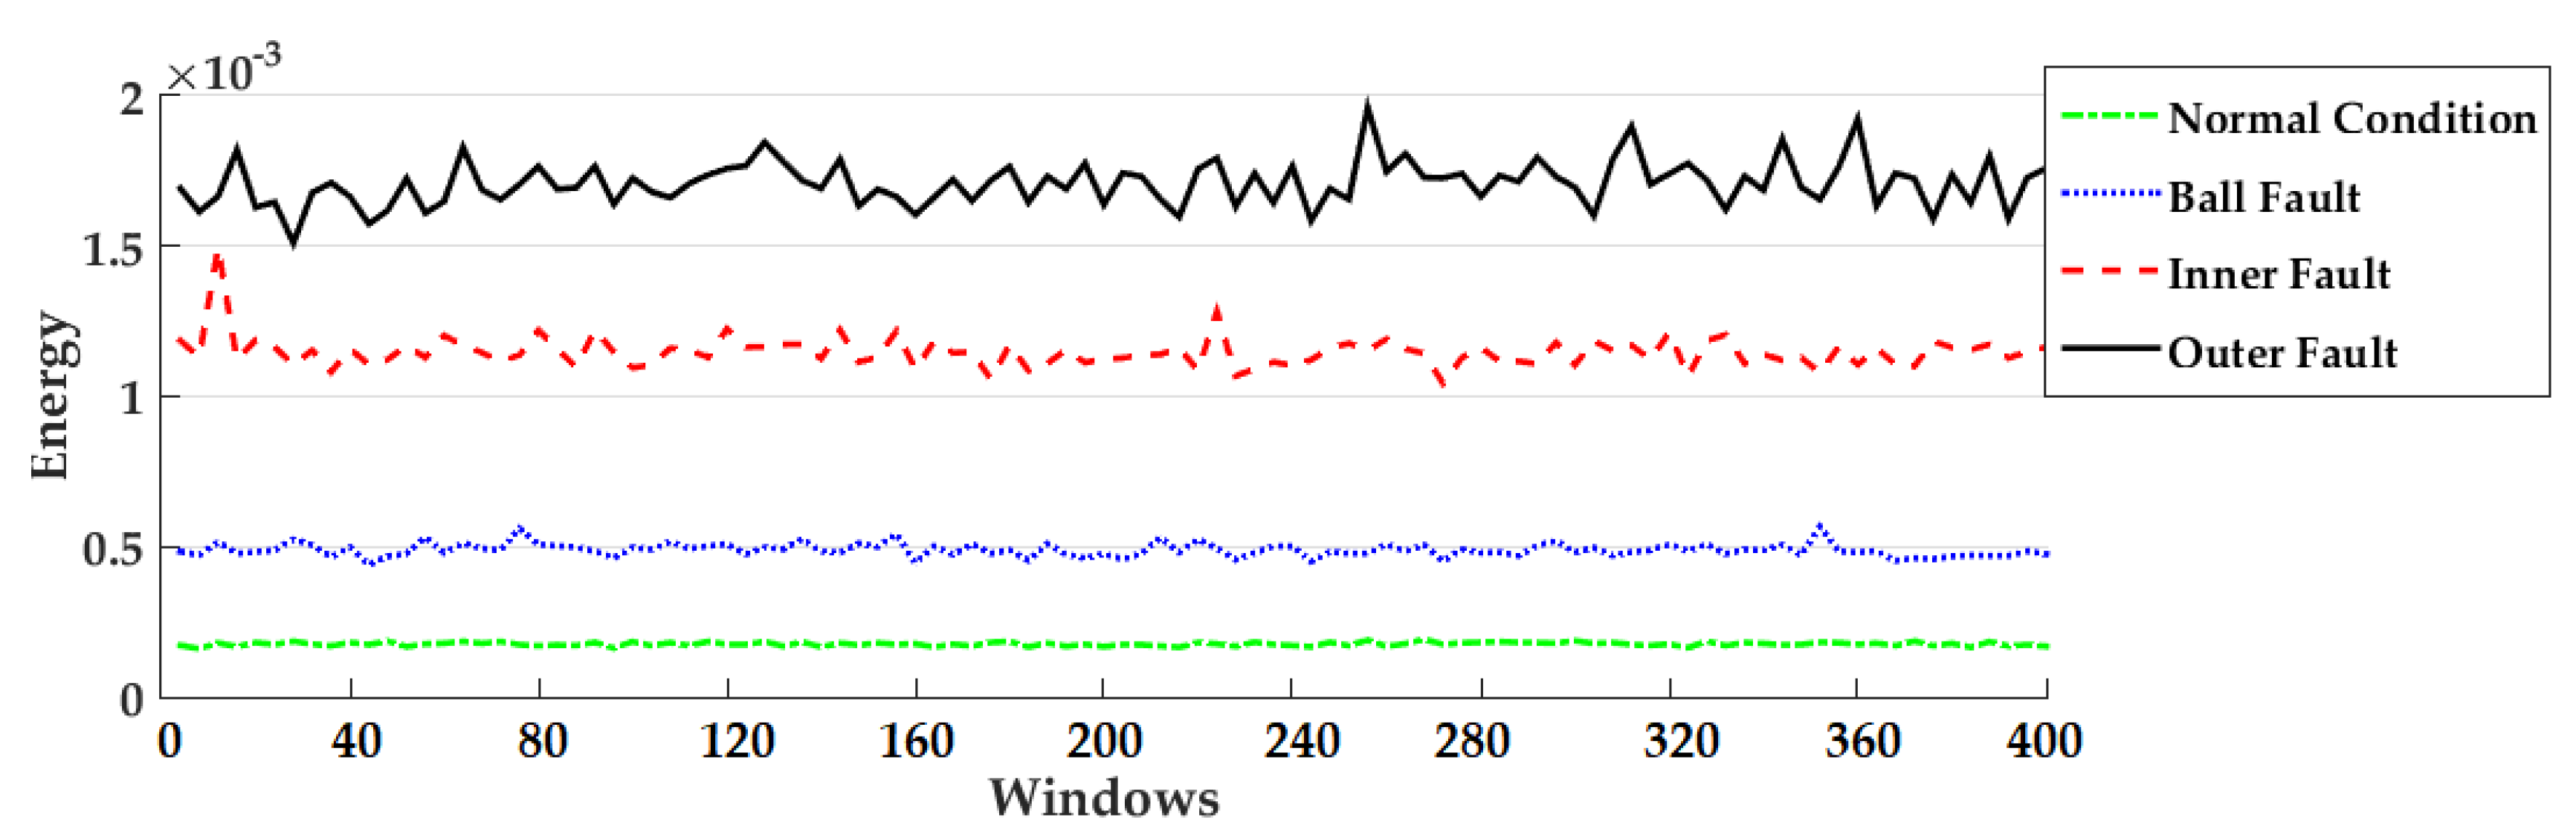
Figure 5.
Block diagram of the bearing data collection testbench.

Table 1.
The Case Western Reserve University (CWRU) datasets to test the activity of the proposed algorithm in normal and abnormal bearing conditions.
Table 1.
The Case Western Reserve University (CWRU) datasets to test the activity of the proposed algorithm in normal and abnormal bearing conditions.
| Dataset | Conditions | Load (hp) | Crack Sizes (in) |
|---|---|---|---|
| Dataset I | Normal | 0 | 0.007, 0.014, and 0.021 |
| Ball | 0 | ||
| IR | 0 | ||
| OR | 0 | ||
| Dataset II | Normal | 1 | 0.007, 0.014, and 0.021 |
| Ball | 1 | ||
| IR | 1 | ||
| OR | 1 | ||
| Dataset III | Normal | 2 | 0.007, 0.014, and 0.021 |
| Ball | 2 | ||
| IR | 2 | ||
| OR | 2 | ||
| Dataset IV | Normal | 3 | 0.007, 0.014, and 0.021 |
| Ball | 3 | ||
| IR | 3 | ||
| OR | 3 |
Table 2.
The Smart Health Safety Environment (SHSE) acoustic emission datasets to test the activity of the proposed algorithm in normal and abnormal bearing conditions.
Table 2.
The Smart Health Safety Environment (SHSE) acoustic emission datasets to test the activity of the proposed algorithm in normal and abnormal bearing conditions.
| Dataset | Fault Types | Rotational Speed (RPM) | Crack Sizes (mm) |
|---|---|---|---|
| Dataset I | Normal | 300 | 3 and 6 |
| IR | 300 | ||
| OR | 300 | ||
| Ball | 300 | ||
| IR-OR | 300 | ||
| IR-Ball | 300 | ||
| OR-Ball | 300 | ||
| IR-OR-Ball | 300 | ||
| Dataset II | Normal | 400 | 3 and 6 |
| IR | 400 | ||
| OR | 400 | ||
| Ball | 400 | ||
| IR-OR | 400 | ||
| IR-Ball | 400 | ||
| OR-Ball | 400 | ||
| IR-OR-Ball | 400 | ||
| Dataset III | Normal | 450 | 3 and 6 |
| IR | 450 | ||
| OR | 450 | ||
| Ball | 450 | ||
| IR-OR | 450 | ||
| IR-Ball | 450 | ||
| OR-Ball | 450 | ||
| IR-OR-Ball | 450 | ||
| Dataset IV | Normal | 500 | 3 and 6 |
| IR | 500 | ||
| OR | 500 | ||
| Ball | 500 | ||
| IR-OR | 500 | ||
| IR-Ball | 500 | ||
| OR-Ball | 500 | ||
| IR-OR-Ball | 500 |
Table 3.
The single fault diagnosis accuracy for 0 hp torque load.
| Algorithms | PM (Proposed Method) | SFO | FO | ||||||
|---|---|---|---|---|---|---|---|---|---|
| Crack Diameters (in) | 0.007 | 0.014 | 0.021 | 0.007 | 0.014 | 0.021 | 0.007 | 0.014 | 0.021 |
| Normal | 100% | 100% | 100% | 100% | 100% | 100% | 100% | 100% | 100% |
| Ball Fault | 97% | 97% | 100% | 90% | 92% | 94% | 89% | 91% | 92% |
| OR Fault | 88% | 95% | 97% | 81% | 91% | 91% | 80% | 82% | 84% |
| IR fault | 96% | 97% | 99% | 90% | 91% | 94% | 83% | 86% | 88% |
| ACA | 95.3% | 97.3% | 99% | 90.3% | 93.5% | 94.8% | 88% | 89.8% | 90.8% |
Table 4.
The single fault diagnosis accuracy for 1 hp torque load.
| Algorithms | PM (Proposed Method) | SFO | FO | ||||||
|---|---|---|---|---|---|---|---|---|---|
| Crack Diameters (in) | 0.007 | 0.014 | 0.021 | 0.007 | 0.014 | 0.021 | 0.007 | 0.014 | 0.021 |
| Normal | 100% | 100% | 100% | 100% | 100% | 100% | 100% | 100% | 100% |
| Ball Fault | 97% | 99% | 100% | 94% | 95% | 98% | 88% | 89% | 90% |
| OR Fault | 98% | 98% | 99% | 94% | 94% | 96% | 89% | 90% | 90% |
| IR Fault | 98% | 90% | 98% | 93% | 95% | 97% | 90% | 90% | 88% |
| ACA | 98.3% | 96.3% | 99.3% | 95.3% | 96% | 97.8% | 91.8% | 92.3% | 92% |
Table 5.
The single fault diagnosis accuracy for 2 hp torque load.
| Algorithms | PM (Proposed Method) | SFO | FO | ||||||
|---|---|---|---|---|---|---|---|---|---|
| Crack Diameters (in) | 0.007 | 0.014 | 0.021 | 0.007 | 0.014 | 0.021 | 0.007 | 0.014 | 0.021 |
| Normal | 100% | 100% | 100% | 100% | 100% | 100% | 100% | 100% | 100% |
| Ball Fault | 98% | 95% | 99% | 90% | 90% | 87% | 86% | 88% | 88% |
| OR Fault | 98% | 98% | 99% | 88% | 88% | 88% | 86% | 87% | 82% |
| IR fault | 98% | 99% | 100% | 90% | 91% | 91% | 88% | 90% | 89% |
| ACA | 98.5% | 98% | 99.5% | 92% | 92.3% | 91.5% | 90% | 91.3% | 89.8% |
Table 6.
The single fault diagnosis accuracy for 3 hp torque load.
| Algorithms | PM (Proposed Method) | SFO | FO | ||||||
|---|---|---|---|---|---|---|---|---|---|
| Crack Diameters (in) | 0.007 | 0.014 | 0.021 | 0.007 | 0.014 | 0.021 | 0.007 | 0.014 | 0.021 |
| Normal | 100% | 100% | 100% | 100% | 100% | 100% | 100% | 100% | 100% |
| Ball Fault | 97% | 98% | 100% | 91% | 90% | 90% | 85% | 86% | 86% |
| OR Fault | 97% | 97% | 100% | 88% | 86% | 89% | 83% | 84% | 86% |
| IR fault | 96% | 98% | 100% | 93% | 95% | 95% | 85% | 86% | 88% |
| ACA | 97.5% | 98.3% | 100% | 93% | 92.3% | 93.5% | 88.3% | 89% | 90% |
Table 7.
The single fault diagnosis accuracy in the presence of load variation.
| Algorithms | PM (Proposed Method) | SFO | FO | ||||||
|---|---|---|---|---|---|---|---|---|---|
| Crack Diameters (in) | 0.007 | 0.014 | 0.021 | 0.007 | 0.014 | 0.021 | 0.007 | 0.014 | 0.021 |
| Normal | 100% | 100% | 100% | 100% | 100% | 100% | 96% | 96% | 96% |
| Ball Fault | 97% | 97% | 98% | 82% | 86% | 88% | 80% | 82% | 82% |
| OR Fault | 88% | 95% | 95% | 80% | 85% | 88% | 78% | 81% | 82% |
| IR fault | 94% | 98% | 98% | 90% | 96% | 96% | 85% | 86% | 87% |
| ACA | 95.8% | 97.5% | 97.8% | 88% | 91.8% | 93% | 84.8% | 86.3% | 86.8% |
Table 8.
The multi-fault diagnosis accuracy for 300 RPM torque speed.
| Algorithms | PM (Proposed Method) | SFO | FO | |||
|---|---|---|---|---|---|---|
| Crack Diameters (mm) | 3 | 6 | 3 | 6 | 3 | 6 |
| Normal | 100% | 100% | 100% | 100% | 88% | 90% |
| IR Fault | 96% | 98% | 91% | 92% | 82% | 81% |
| OR Fault | 98% | 98% | 94% | 95% | 70% | 73% |
| Ball Fault | 98% | 99% | 94% | 94% | 72% | 74% |
| IR-Ball Fault | 98% | 99% | 94% | 96% | 79% | 80% |
| OR-Ball Fault | 98% | 97% | 96% | 93% | 80% | 82% |
| IR-OR Fault | 97% | 97% | 94% | 94% | 81% | 82% |
| IR-OR-Ball Fault | 98% | 98% | 95% | 96% | 81% | 82% |
| ACA% | 97.9 | 98.3 | 94.8 | 95 | 79.1 | 80.5 |
Table 9.
The multi-fault diagnosis accuracy for 400 RPM torque speed.
| Algorithms | PM (Proposed Method) | SFO | FO | |||
|---|---|---|---|---|---|---|
| Crack Diameters (mm) | 3 | 6 | 3 | 6 | 3 | 6 |
| Normal | 100% | 100% | 100% | 100% | 88% | 88% |
| IR Fault | 98% | 99% | 93% | 94% | 80% | 80% |
| OR Fault | 98% | 98% | 93% | 93% | 75% | 75% |
| Ball Fault | 98% | 99% | 95% | 93% | 74% | 78% |
| IR-Ball Fault | 97% | 98% | 94% | 95% | 76% | 79% |
| OR-Ball Fault | 98% | 98% | 95% | 96% | 80% | 82% |
| IR-OR Fault | 98% | 98% | 94% | 94% | 80% | 81% |
| IR-OR-Ball Fault | 98% | 98% | 96% | 96% | 81% | 82% |
| ACA% | 98.1 | 98.5 | 95 | 95.1 | 79.3 | 80.6 |
Table 10.
The multi-fault diagnosis accuracy for 450 RPM torque speed.
| Algorithms | PM (Proposed Method) | SFO | FO | |||
|---|---|---|---|---|---|---|
| Crack Diameters (mm) | 3 | 6 | 3 | 6 | 3 | 6 |
| Normal | 100% | 100% | 100% | 100% | 90% | 90% |
| IR Fault | 98% | 99% | 94% | 95% | 80% | 80% |
| OR Fault | 99% | 98% | 95% | 96% | 74% | 75% |
| Ball Fault | 98% | 98% | 94% | 94% | 75% | 76% |
| IR-Ball Fault | 97% | 97% | 94% | 95% | 78% | 80% |
| OR-Ball Fault | 97% | 98% | 95% | 95% | 80% | 81% |
| IR-OR Fault | 99% | 99% | 94% | 94% | 80% | 82% |
| IR-OR-Ball Fault | 98% | 98% | 95% | 96% | 80% | 81% |
| ACA% | 98.3 | 98.4 | 95.1 | 95.6 | 79.6 | 80.6 |
Table 11.
The multi-fault diagnosis accuracy for 500 RPM torque speed.
| Algorithms | PM (Proposed Method) | SFO | FO | |||
|---|---|---|---|---|---|---|
| Crack Diameters (mm) | 3 | 6 | 3 | 6 | 3 | 6 |
| Normal | 100% | 100% | 100% | 100% | 89% | 89% |
| IR Fault | 98% | 99% | 93% | 94% | 80% | 80% |
| OR Fault | 99% | 98% | 93% | 95% | 75% | 75% |
| Ball Fault | 98% | 98% | 93% | 94% | 75% | 79% |
| IR-Ball Fault | 98% | 99% | 94% | 95% | 76% | 80% |
| OR-Ball Fault | 97% | 98% | 96% | 95% | 80% | 81% |
| IR-OR Fault | 98% | 98% | 94% | 95% | 80% | 81% |
| IR-OR-Ball Fault | 98% | 98% | 96% | 96% | 82% | 82% |
| ACA% | 98.3 | 98.5 | 94.9 | 95.5 | 79.6 | 80.9 |
Table 12.
The multi-fault diagnosis accuracy for motor speed-variant dataset.
| Algorithms | PM (Proposed Method) | SFO | FO | |||
|---|---|---|---|---|---|---|
| Crack Diameters (mm) | 3 | 6 | 3 | 6 | 3 | 6 |
| Normal | 100% | 100% | 100% | 100% | 89% | 89% |
| IR Fault | 98% | 98% | 92% | 94% | 80% | 80% |
| OR Fault | 99% | 98% | 92% | 94% | 76% | 78% |
| Ball Fault | 97% | 98% | 94% | 94% | 76% | 79% |
| IR-Ball Fault | 97% | 97% | 94% | 94% | 76% | 77% |
| OR-Ball Fault | 97% | 97% | 95% | 95% | 80% | 80% |
| IR-OR Fault | 97% | 98% | 94% | 95% | 81% | 81% |
| IR-OR-Ball Fault | 98% | 98% | 95% | 96% | 81% | 82% |
| ACA% | 97.9 | 98 | 94.5 | 95.3 | 79.9 | 80.8 |
© 2020 by the authors. Licensee MDPI, Basel, Switzerland. This article is an open access article distributed under the terms and conditions of the Creative Commons Attribution (CC BY) license (http://creativecommons.org/licenses/by/4.0/).
Share and Cite
MDPI and ACS Style
Piltan, F.; Kim, J.-M. Hybrid Fault Diagnosis of Bearings: Adaptive Fuzzy Orthonormal-ARX Robust Feedback Observer. Appl. Sci. 2020, 10, 3587. https://doi.org/10.3390/app10103587
AMA Style
Piltan F, Kim J-M. Hybrid Fault Diagnosis of Bearings: Adaptive Fuzzy Orthonormal-ARX Robust Feedback Observer. Applied Sciences. 2020; 10(10):3587. https://doi.org/10.3390/app10103587
Chicago/Turabian StylePiltan, Farzin, and Jong-Myon Kim. 2020. "Hybrid Fault Diagnosis of Bearings: Adaptive Fuzzy Orthonormal-ARX Robust Feedback Observer" Applied Sciences 10, no. 10: 3587. https://doi.org/10.3390/app10103587
Note that from the first issue of 2016, this journal uses article numbers instead of page numbers. See further details here.