Article

Prototype Observation of Flow Characteristics in an Inclined-Tube Settling Tank for Fine Sandy Water Treatment

College of Water Resources and Civil Engineering, China Agricultural University, Beijing 100083, China
*
Author to whom correspondence should be addressed.
Appl. Sci. 2020, 10(10), 3586; https://doi.org/10.3390/app10103586
Submission received: 2 April 2020 / Revised: 29 April 2020 / Accepted: 20 May 2020 / Published: 22 May 2020
(This article belongs to the Section Environmental Sciences)

Abstract

:

Featured Application

The research results in this paper can help to improve the efficiency of fine sediment water treatment and to optimize the structure of similar settling tanks. Further, the observation method used in this paper may inspire other scholars who study the flow movement.

Abstract

Clarifying the flow characteristics in the settling tank is the foundation for the design optimization and efficiency improvement of sediment removal. However, few research works have been undertaken on the precise observation of the flow movement in the tank. For this purpose, research into an inclined-tube settling tank for the water-sediment separation of the Yellow River was carried out. An acoustic Doppler velocimeter (ADV) was utilized to measure the velocity distribution in the tank. The dimensionless turbulence intensity and dimensionless Reynolds shear stress distribution were obtained subsequently. It was found that the velocity distribution in the stable settlement area (SSA) and the settlement area with inclined tubes (ISA) was uniform. The turbulence intensity and Reynolds shear stress in the tank were beneficial to the formation of the flocs and the subsequent acceleration of the sediment settling. The flow pattern could be significantly improved by the flow adjustment board and the inclined tubes. However, the inlet, the baffle and the overflow weir in the tank had negative effects on the flow pattern. The results enhanced our understanding of the flow characteristics in the inclined-tube settling tank and indicated a direction for optimizing the tank structure and improving the settling efficiency.

1. Introduction

The settling tank, which separates particles from the sandy water of the tank by the force of gravity, is the most conventional and common environment-friendly project and plays an important role in the sustainable utilization of sandy water. At present, the design of the settling tank with a conventional structure for removing coarse sediment has become mature. Zhang et al. [1] proposed a circular-ring desilting and sediment ejection basin, whose sediment removal rate may be up to 100% for sediment with particle size of over 1 mm; Sun [2] designed a gravity desilting filter tank suitable for Xinjiang region, China, with a range of permissible granule diameter of 0.1–0.15 mm when the sediment is out of the tank with the overflow; Cheng et al. [3] enhanced sedimentation by slowing down velocity of the flow from the inlet using parallel retrofit baffles; Bajcar et al. [4] presented a circular settling tank with peripheral inflow and central effluent. However, the settling velocity of the fine sediment in the water is low, and the settling process is easily affected by the flow turbulence. Therefore, to efficiently remove the fine sediment, the conventional tank tends to cover a large area and can be costly. First proposed by Boycott [5], inclined tubes could produce an ideal flow pattern, reduce the settling distance and expand the settling area [6]. The results of Galvin et al. [7], Doroodchi et al. [8] and Laskovski et al. [9] showed that inclined tubes could significantly accelerate the solid–liquid separation efficiency. Compared with the conventional structure, the inclined-tube settling tank has great advantages in fine sandy water treatment. The Yellow River is the main source of irrigation water in the Yellow River Irrigation Region. The particle size of most sediment in the Yellow River is 50–100 μm, so Yellow River water is typical fine sandy water, which can easily cause the blockage of drip irrigation emitters [10,11]. In order to avoid the above problem and promote the sustainable utilization of Yellow River water, a kind of inclined-tube settling tank has been used in the Yellow River Irrigation Region and works very well in practice. However, there are a few research works about the inclined-tube settling tank. Bandrowski et al. [12] tested the removal efficiency of different kinds of suspended solids in the tank. Xie et al. [13] and Ignjatovic [14] proposed the calculation formula of sediment removal efficiency in the tank by theoretical analysis. However, there is still a lack of sufficient research on the inclined-tube settling tank, and there are few research works on the flow characteristics in the tank, which limits the improvement of the structure and the settling efficiency of the tank.
The settling efficiency of the settling tank mainly depends on the movement characteristics of the suspended solids and flow in the tank [15]. When the sediment concentration is low and the particle size is extremely fine, the suspended solids have no effect on the flow movement, and the sediment movement track is closely related to the flow pattern [16]. The flow in the tank is turbulent, directly affecting the sediment concentration and deposition [17,18], so it is very important to understand the flow characteristics to improve the efficiency of the sediment settling. Researchers have always attached great importance to the observation of the flow characteristics in the tank. Water–sediment movement in the tank can be directly observed by the numerical simulation, and the mathematical model for the simulation has greatly developed in the past 50 years [19,20,21,22,23]. However, due to the lack of experimental data, these mathematical models have not yet been completely validated, so the numerical model has not been widely applied to the design of the actual tank. Rather than numerical simulation, many authors were therefore still in favor of describing the flow field with experimental results by measurement instruments. Since the 1970s, authors have predicted the flow characteristics in the tank by means of residence time distribution (RTD) or tracer tests, which are based on the temporal evolution of a measurement that is a consequence of the flow pattern (concentration of a tracer), but none of them have provided a quantitative description of the flow pattern [4,24,25,26,27,28]. These research works are useful for assessing the performance of the tank, but they cannot provide useful information for the tank’s structural optimization (types of tank, geometrical configuration, structure size, etc.). It is important to directly measure the velocity distribution in the tank. To our knowledge, Larsen (1977) may be the first to directly measure the velocity distribution in the tank. He used an ultrasonic current meter to measure the one-dimensional velocity (the longitudinal velocity) in the tank, with a measurement error up to 10 cm [20]. Imam et al. [29] measured the velocity distribution along the centerline using a one-dimensional laser Doppler anemometer (1D LDA). Liu et al. [30] used a two-dimensional laser Doppler velocimeter (2D LDV) to conduct flow field measurement in the rectangular settling tanks. The above research works were limited by the instrument function, meaning that there were a few measurement locations, and the three-dimensional flow characteristics could not be obtained to provide sufficient information for the tank’s structural optimization. In recent years, the acoustic Doppler velocimeter (ADV) has made it convenient to obtain complex flow information. Razmi et al. [31] carried out the experiment tests using ADV to validate the numerical model which was used to simulate the flow field in a primary settling tank, and the optimum position of the baffle in the tank was obtained by numerical simulation.
In this paper, an inclined-tube settling tank used in the Yellow River Irrigation Region was introduced, and the research was conducted as follows:
(1)
ADV was used to measure the flow field in the inclined-tube settling tank, and the distribution of the dimensionless turbulence intensity and dimensionless Reynolds shear stress in the tank was further analyzed. On this basis, the influence of the tank structure on the flow movement was analyzed, and the reason for the high settling efficiency of the tank was clarified.
(2)
Through detailed investigation of the flow field in the tank, the structures which were bad for the sediment settling in the tank were determined, and some suggestions for the tank’s structural optimization were proposed.

2. Experimental Setup and Procedure

2.1. Configuration of the Inclined-Tube Settling Tank

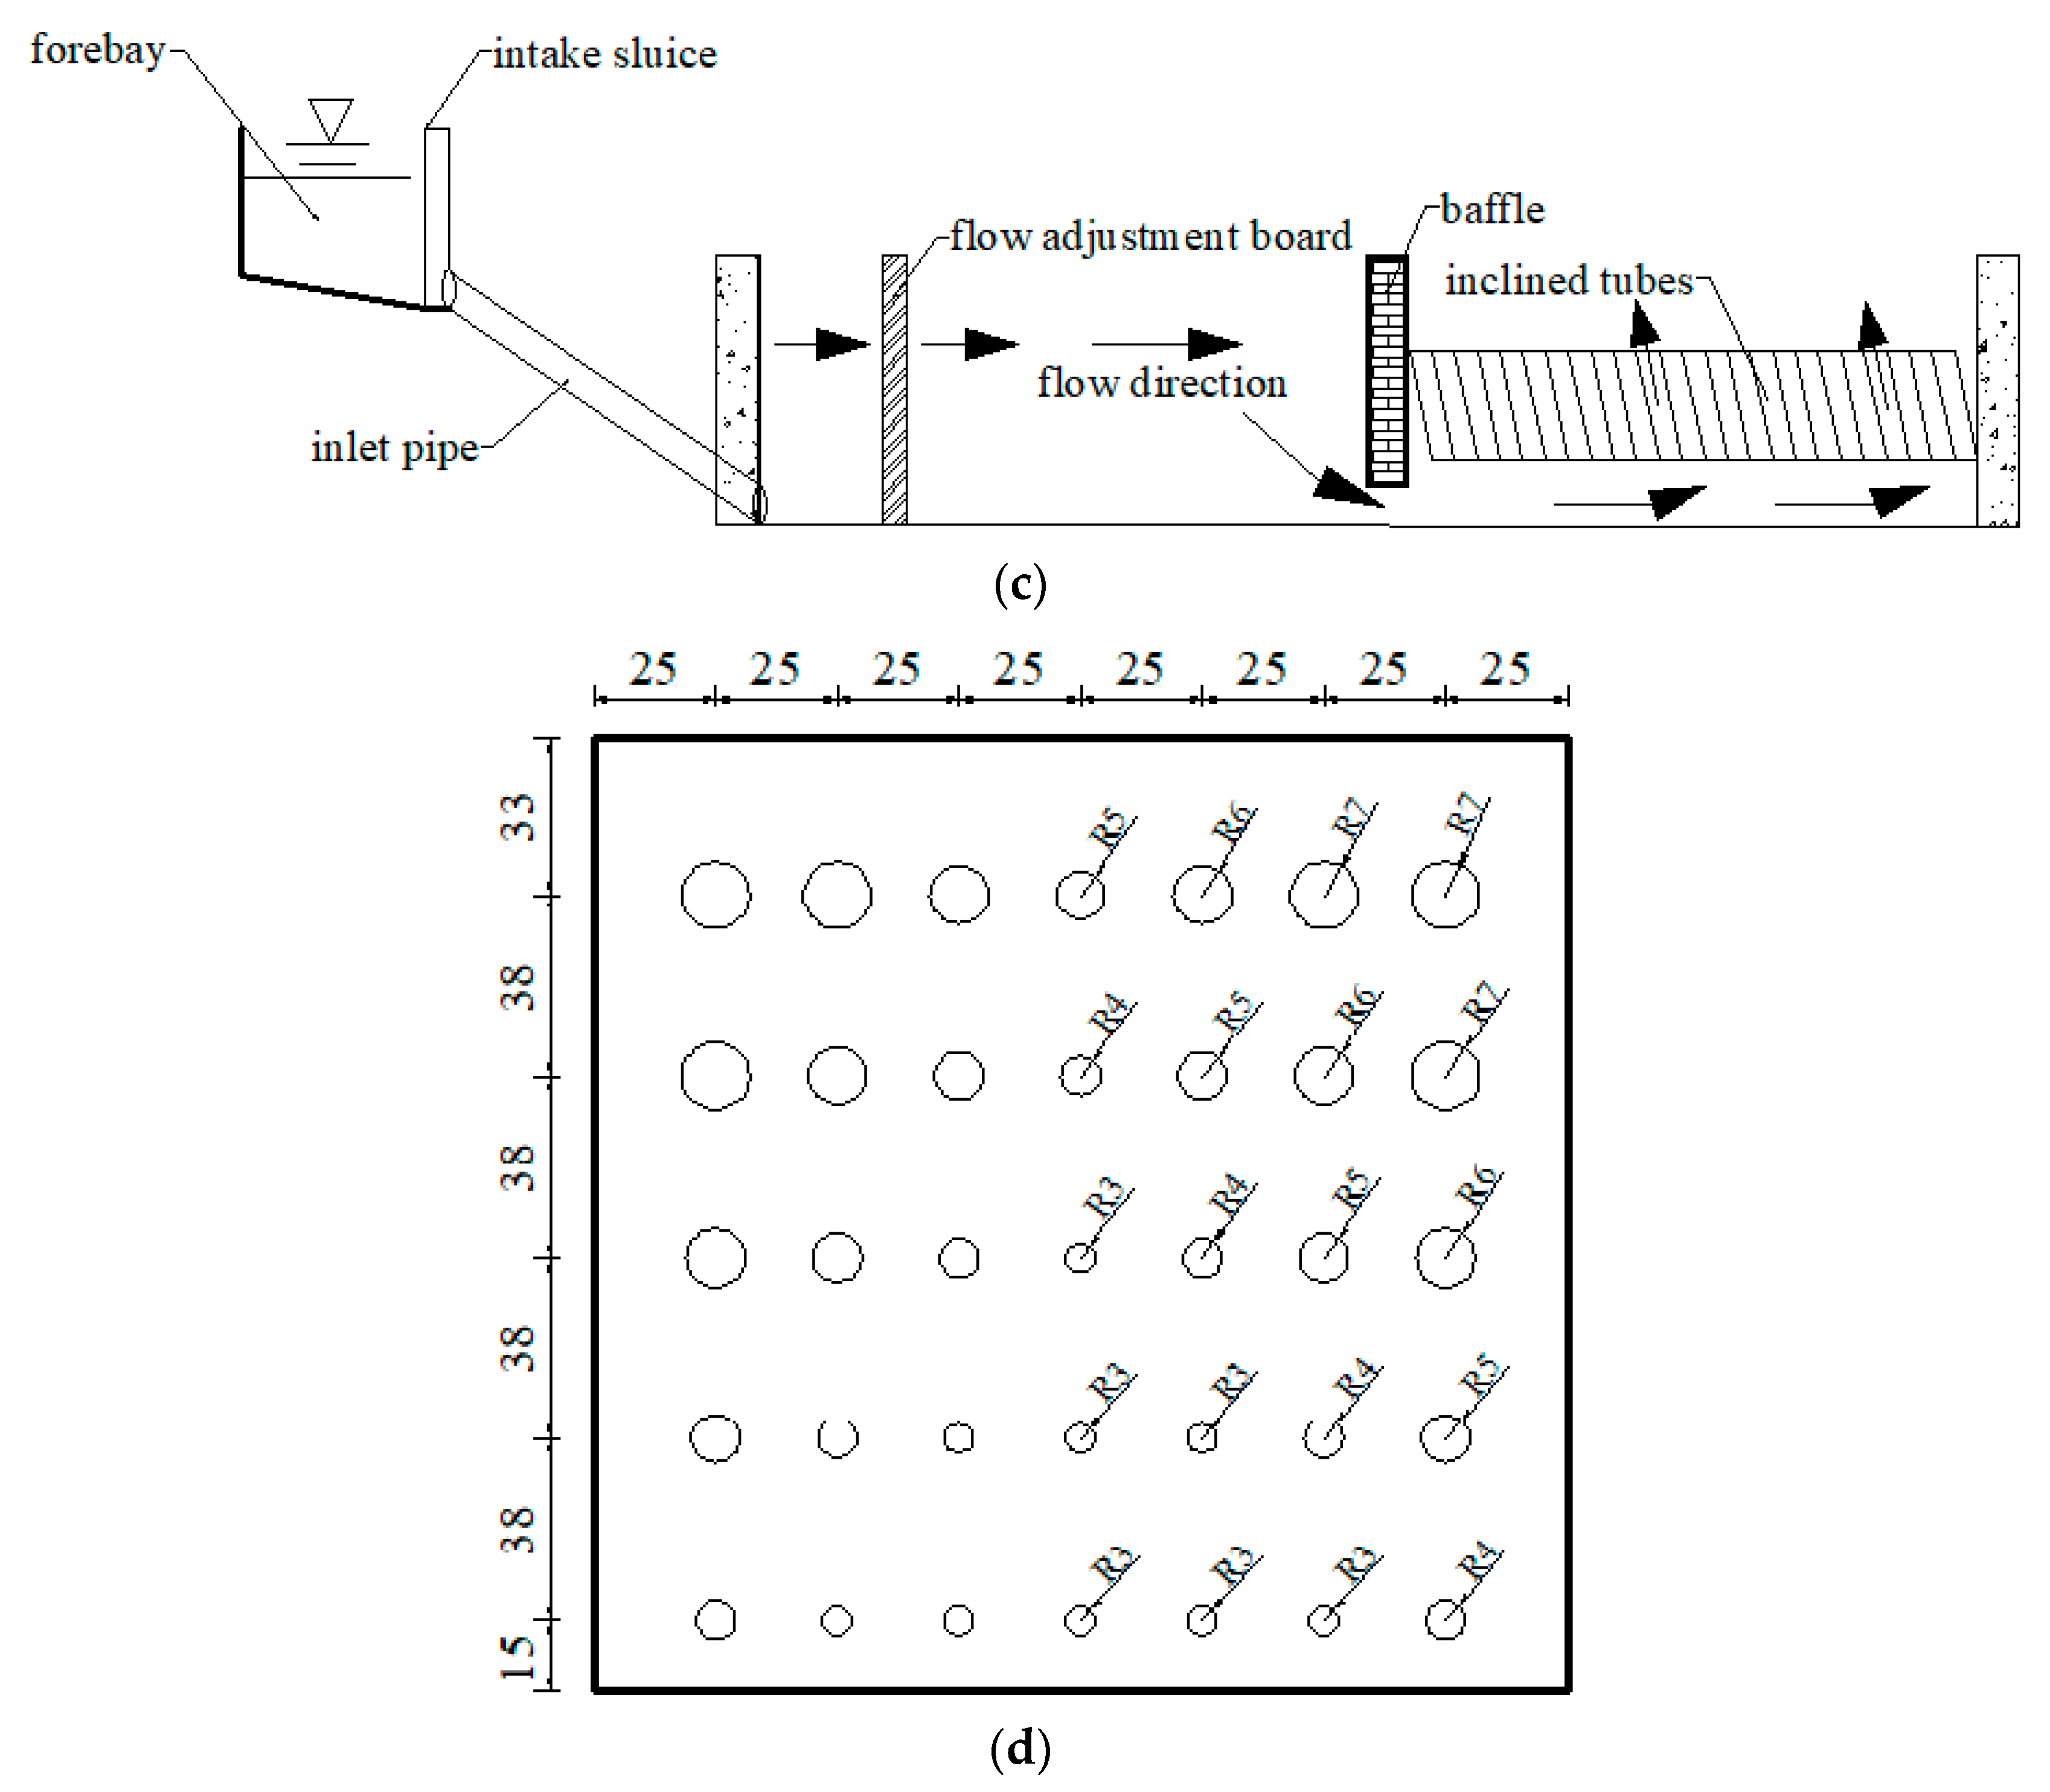
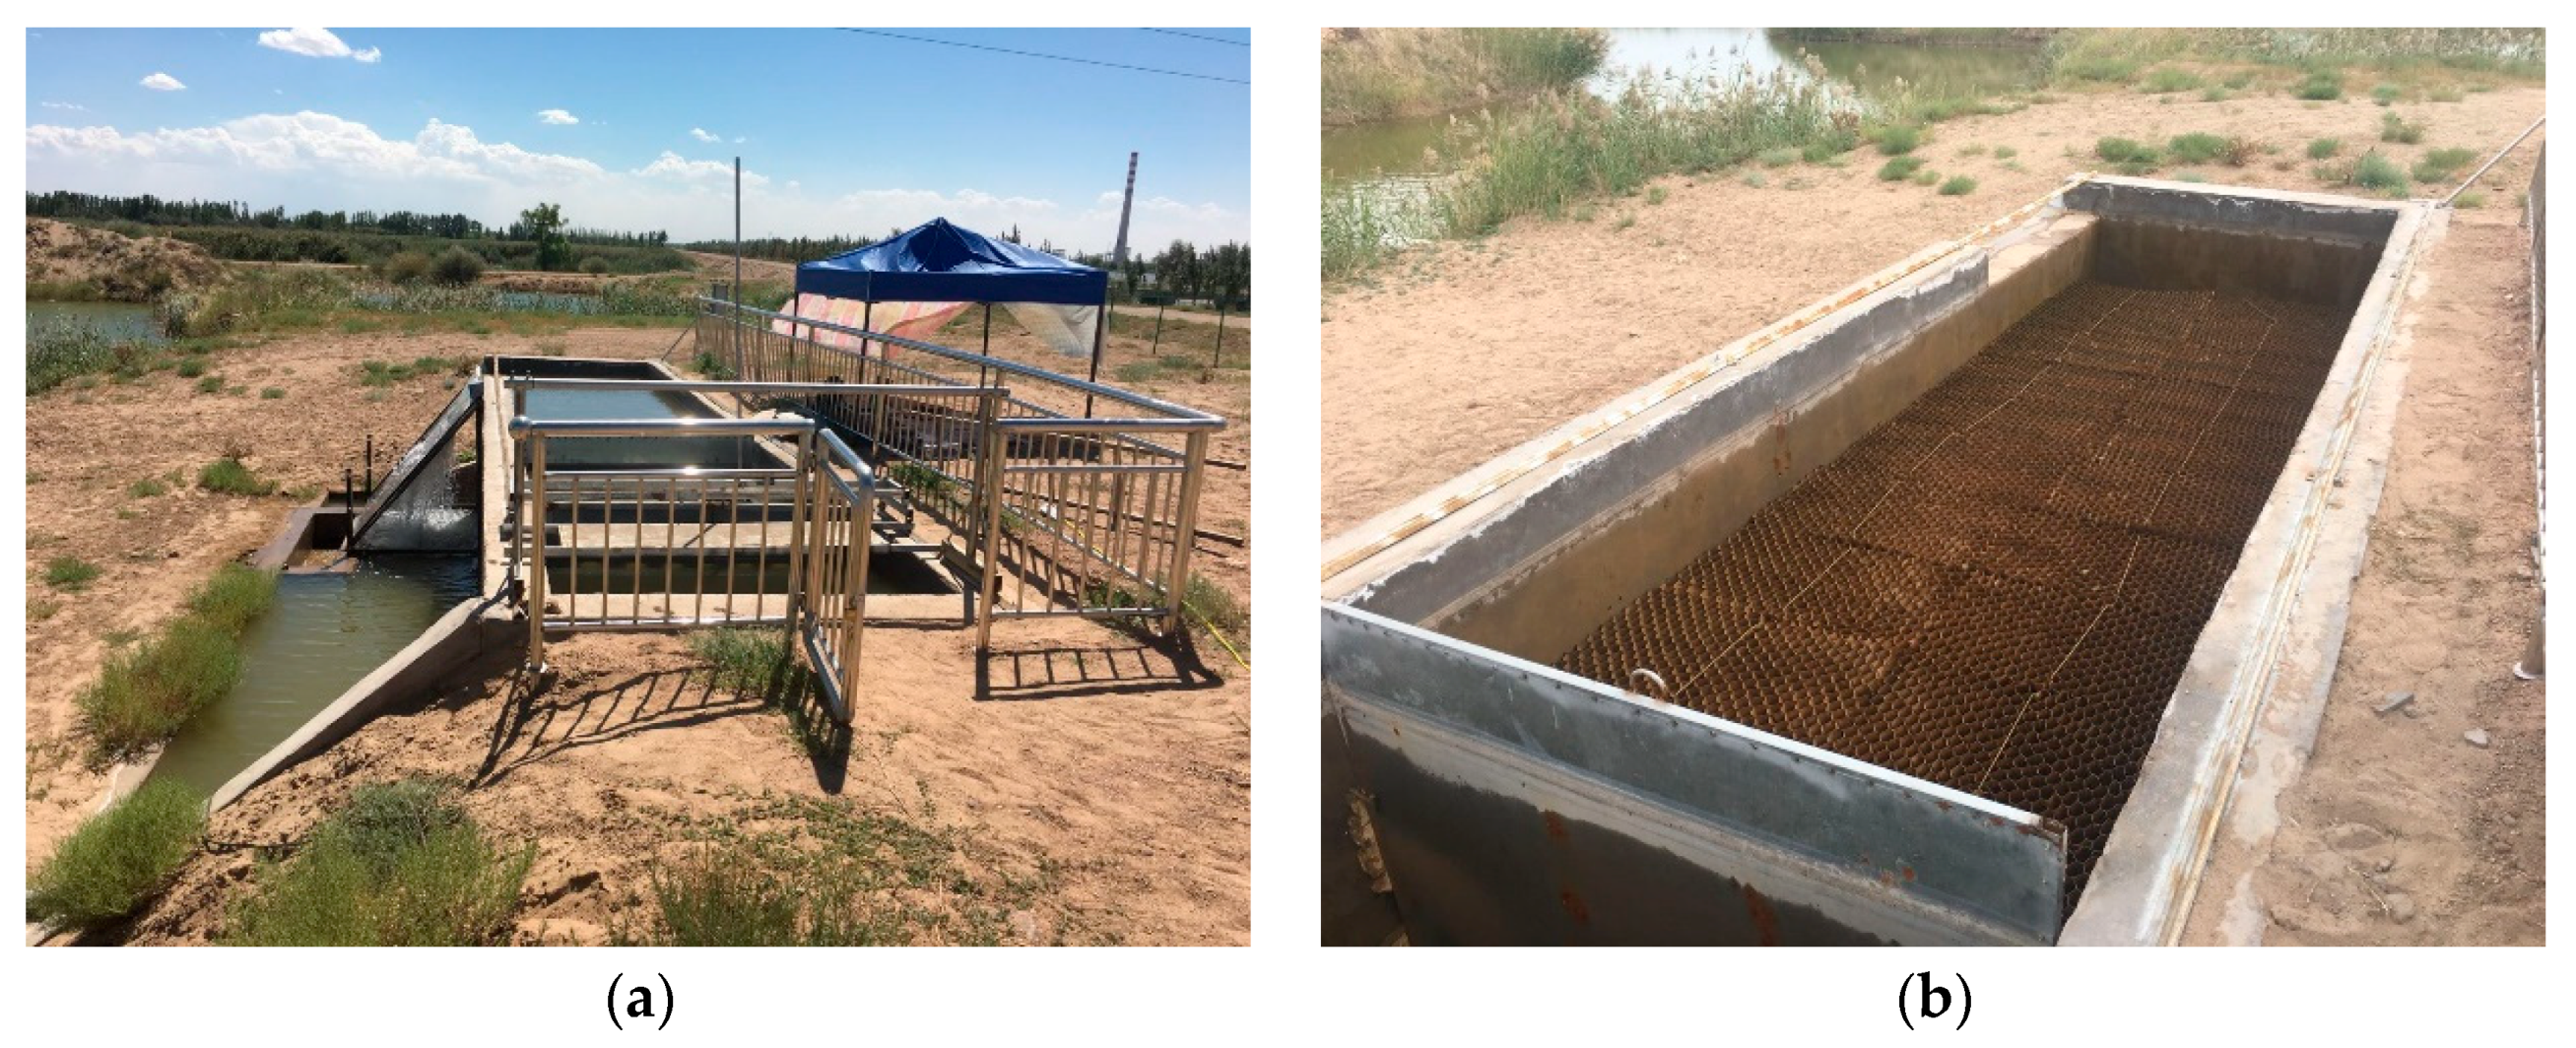
The forebay, intake sluice, settling tank, filter screen, clean water tank, and drainage hole are the main structures of an inclined-tube settling tank (the structural design of the inclined-tube settling tank was proposed by Yunkai Li). More specifically, the settling tank consists of a water inlet, tank, flow adjustment board, baffle, inclined tubes, and overflow weir (see Figure 1a,b). The working process of this tank is as follows (see Figure 1c): first, by opening the intake sluice, the water flows into the tank from the forebay. Then the water flows through the flow adjustment board (the hole of the board is designed to be gradually larger from the bottom to the top and from the middle to the sides, and the holes on two sides are symmetrical (see Figure 1d)) from the flow adjustment area (FAA, located between the water inlet and the flow adjustment board) to the stable settlement area (SSA, located between the flow adjustment board and the baffle), and large particles settle at the bottom of this area first. Next, through the gap between the baffle and the tank bottom, the water flows down into the settlement area with inclined tubes (ISA, located between the baffle and the back wall of the tank). Fine particles can settle down the tube wall and slide down to the tank bottom. Finally, clean water overflows from the overflow weir and flows into the clean water tank through the filter screen. The sediment on the tank bottom can be washed away by opening the drainage hole. In contrast to the inclined-tube settling tank in previous research [12,13,14], the inclined tubes are laid out in a rectangular settling tank in this experiment (see Figure 2a,b). In addition, the flow adjustment board is also laid out in the tank, making the water flow into the tank in a more uniform way.

2.2. Experiment Establishment

The experiment was conducted at the experiment station of China Agricultural University in the Hetao irrigation district, Inner Mongolia. A counterpart settling tank was established in the station with a design flow of 60 m3/h. The dimensions of the tank were 10 m long, 2 m wide and 2 m deep. The flow adjustment board was installed 1.2 m away from the front wall of the tank. The inclined tubes were installed at the latter part of the tank. The diameter of the hexagonal-prism inclined tubes was 50 mm and the vertical height of the tube was 1 m. There was a 60° angle between the tube and the horizontal plane. The laying area of the tubes was 10 m2. The height between the bottom of the tubes and that of the tank was 0.8 m. A baffle was designed in front of the tubes to ensure that the water flowed into the bottom of the tubes through the gap (with a height of 0.4 m) between the baffle and the bottom of the tank. The overflow weir was at the rear of the tank and had a length of 2 m (see Figure 1a,b). In this study, the wall at the right side along the flow was called the right wall and the opposite one was called the left wall.
The experimental water came from the Yellow River trunk canal next to the experimental station. Due to the fluctuation of sediment concentration in the trunk canal during the experiment, an appropriate amount of riverbed sediment was added to the forebay to ensure a constant sediment concentration of 3–3.5 kg/m3 during the experiment. The sediment concentration in the test water source was measured by an optical back-scattering turbidimeter once a day during the experiment.
A 3D coordinate axis was used to clearly express the positional information in the tank, where the X, Y, and Z axes denoted the flow direction (longitudinal), direction from the right wall to the left wall (transverse), and that from the bottom to the top of the tank (vertical). The origin of the coordinates was denoted O (see Figure 1a).

2.3. Measurement

2.3.1. Measurement Locations

Flow velocity measurement was carried out at 19 transverse sections (named sections 1–19) from upstream to downstream over the range X = 20–980 cm. The longitudinal spacing between adjacent sections was 60 cm. An additional section was set up at a distance of 20 cm in front of the flow adjustment board and the baffle, separately (see Figure 3a). The details of the measurement locations are illustrated in Figure 3b, where 121 velocity samples were collected at each transverse section. The measurement points are represented by the symbol “+”. The height in the range of Z = 80–180 cm was occupied by inclined tubes in the ISA, so there were only two top layers of flow velocity below the free surface measured in the ISA.

2.3.2. Measurement Method

The new generation ADV instrument “Vectrino+” (Vectrino+, Nortek AS, Hedmark, Norway) was adopted to measure the three-dimensional time varying velocities (longitudinal velocity u, transverse velocity v, and vertical velocity w along the X, Y, Z axis, respectively); subsequently, the three-dimensional mean velocities and turbulent flow fields were obtained. The ADV was fixed on a platform which could freely move along the tank longitudinally, transversely and vertically. The downward-looking probe of the ADV was used; i.e., the direction of the measurement probe was vertically downward and perpendicular to the flow. There were four measuring jaws on the probe with an audio frequency of as high as 10 MHz, one of which was tied with a red coil to identify the direction of the velocity component u. The three orthogonal dimensions of the velocity component complied with the right-hand screw rule. The measuring range of the ADV was 0–1.0 m/s, with a measuring accuracy of within ±0.5% ± 1 mm/s. The sample frequency of the velocity was 200 Hz and the duration was 30 s, which meant that, for every single-point, the hits in the measurement time series were as high as 5700–6000. The ADV signal quality, represented by the signal to noise ratio (SNR) and correlation coefficient (COR), was tested prior to each set of measurements. The majority of the samples had an SNR > 20 dB and COR > 90, which indicated that the measurement data were reliable. In order to further increase the accuracy of measurement data, the raw ADV data were de-spiked by the acceleration threshold method which was proposed by Goring and Nikora [32], which was capable in identifying and substituting spikes. The relative acceleration threshold was taken as 1.2, and the factor of velocity standard deviation was taken as 1.5 according to experience.

2.3.3. Calculation Method of Flow Characteristics

According to the Reynolds decomposition expression, the instantaneous velocity u of the flow can be decomposed into the time-averaged velocity u ¯ and fluctuating velocity u , i.e., u = u ¯ + u , where the time-averaged velocity of the measuring point u ¯ = 1 N 1 N u i , and N refers to the sampling number of the flow velocity in measuring time. The average velocity U of measuring section is defined as
U = 1 A 0 2 0 2 u ¯ d y d z
where A refers to the transverse measurement section area.
The dimensionless Reynolds shear stress of the XOY section was expressed as:
R X Y = | 1 N i = 1 N ( u i u i ¯ ) ( v i v i ¯ ) | U
The longitudinal dimensionless turbulence intensity was expressed as:
I X = | 1 N i = 1 N ( u i u i ¯ ) ( u i u i ¯ ) | U
In a similar way, the transverse and vertical time-averaged velocity ( v ¯ , w ¯ ), dimensionless turbulence intensity ( I Y , I Z ) and dimensionless Reynolds shear stress ( R Y Z , R X Z ) could also be computed.

3. Result and Analysis

3.1. Longitudinal Flow Characteristics

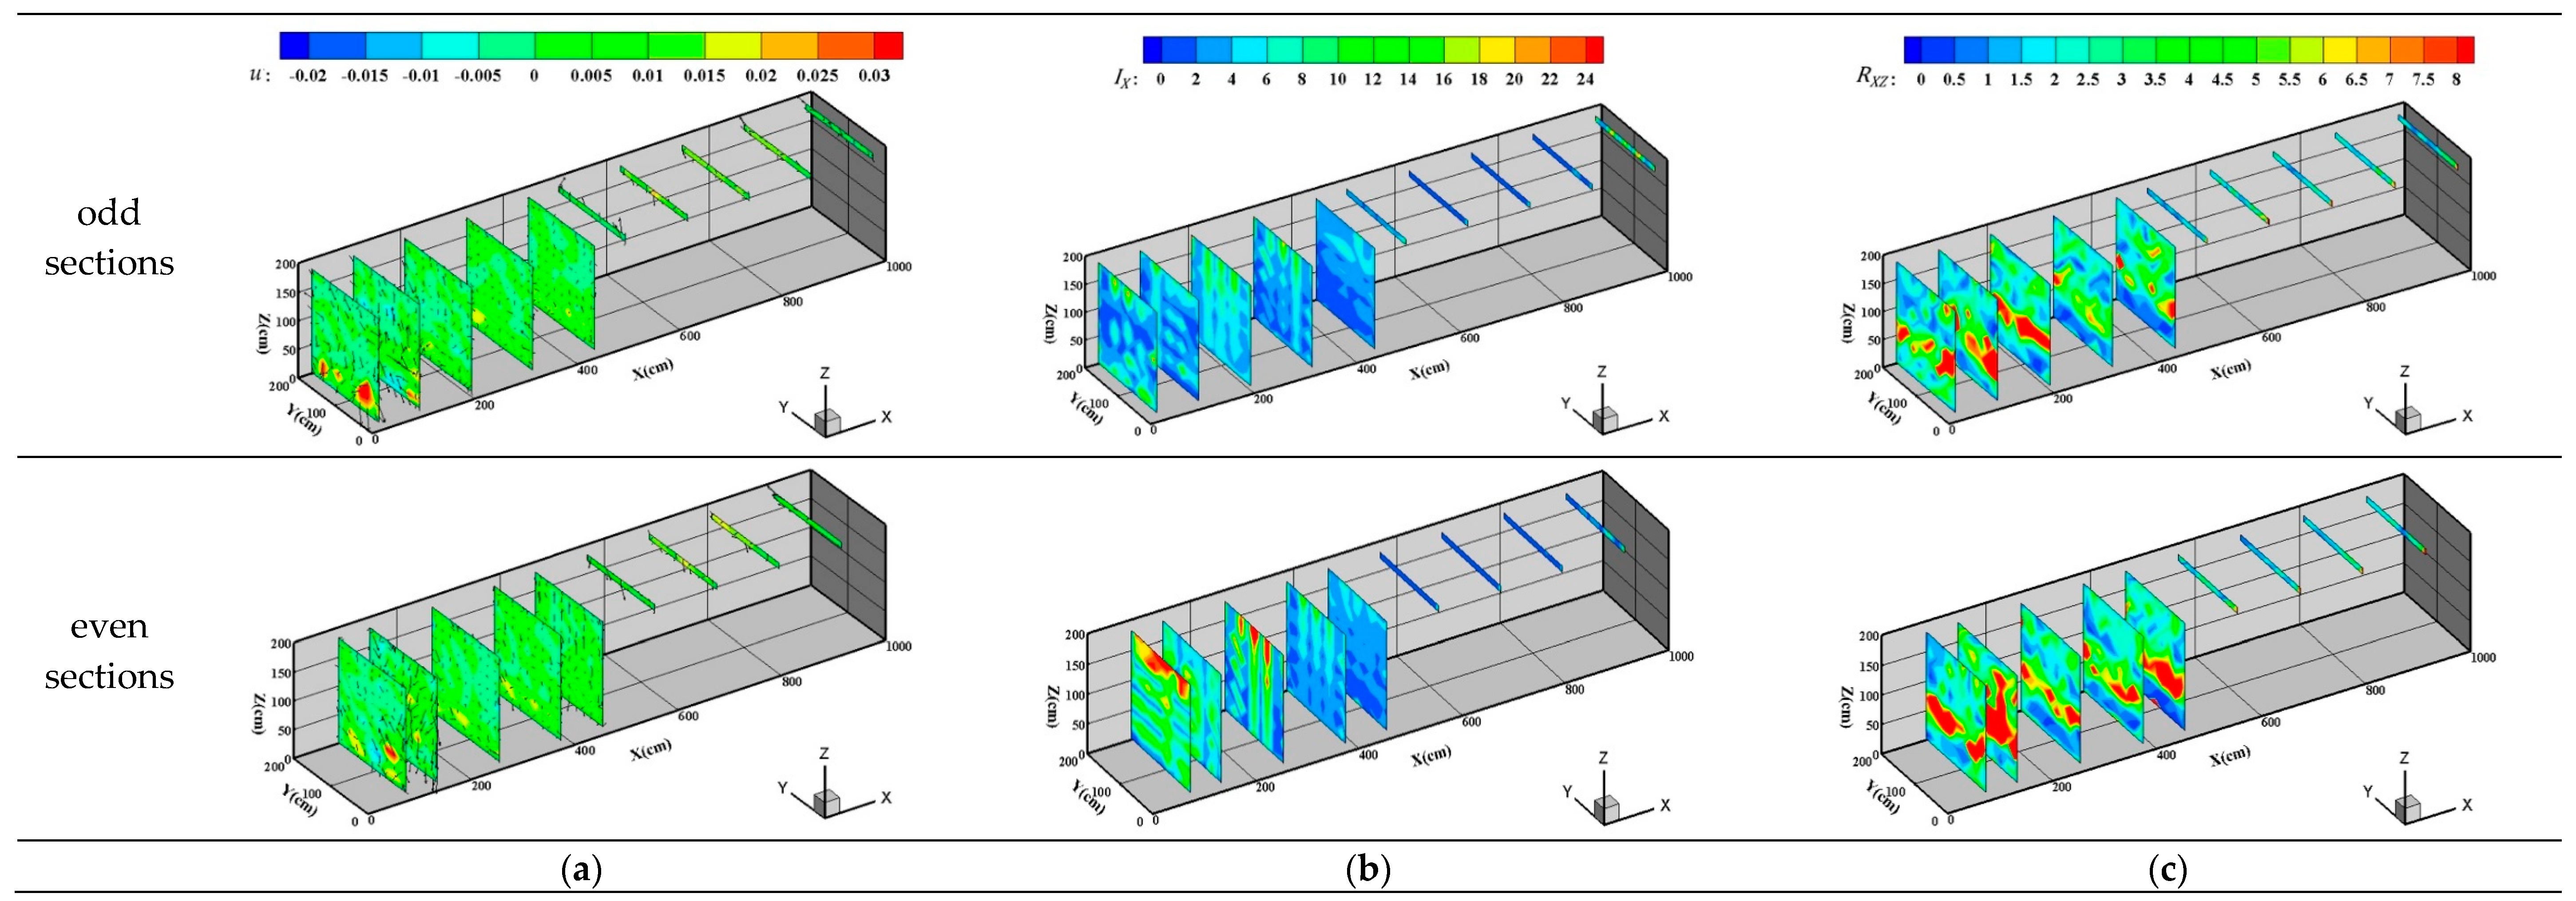
To avoid the shelter from the adjacent sections, the odd and even sections were respectively plotted in two figures (see Figure 4).
  • Velocity distribution: The high-velocity flow from the inlet opening striking on the flow adjustment board caused the extremely high velocity u in the lower part of the FAA. Additionally, the high-velocity flow also caused the velocity v-w in the FAA to be in disorder, i.e., there are many differences in the magnitude and direction of flow velocity at different measurement locations in the FAA, and swirling flows were formed, which would affect the structural safety of the tank. Sections 3 and 4 were at the two sides of the flow adjustment board. In Section 3, the direction of the velocity v-w was mainly upward. Section 4 showed a more uniform velocity u, and the velocity v-w was downward. The discharge capacity of the upper part of the flow adjustment board with bigger holes was higher than that of the bottom with smaller holes, so the water flowed into the SSA through the upper part of the board, which indicated that the flow adjustment board could redistribute flow with a high velocity from the inlet. The velocity u in the upper SSA was uniform with a range of −0.005–0.01 m/s (when the direction of the velocity vector component consistent with the positive direction of the corresponding coordinate axis, the velocity value was positive, and vice versa). The velocity v-w was lower than that in the FAA, and it only increased at the rear of the SSA due to the resistance of the baffle, and the uniform velocity was beneficial to the large particles settling in the SSA. The flow velocity in the upper part of the ISA increased compared with that in the SSA (see Figure 4a).
  • Longitudinal dimensionless turbulence intensity ( I X ) distribution: The I X was high in the FAA and SSA, while low in the ISA. The I X was uneven in the FAA, which was mainly caused by the backflow caused by the water from the inlet that struck the flow adjustment board. When the water flowed through the board, the velocity would be intensely redistributed in a short time, leading to a violent turbulence of the flow with the I X value within 16–24%. The turbulence helped to further dissipate the kinetic energy of the flow and decrease the velocity. In the latter half of the SSA, the I X value gradually decreased to 2–8%, contributing to the adhesion of the viscous sediment particles to form the flocculation of sediment and to the flocs settling in the ISA. The I X value in the upper part of the ISA was 0–4%. The flow in the inclined tubes was laminar, so the flow pattern was still stable after flowing out of the inclined tubes. The I X of the latter part of the ISA increased affected by the overflow suction (see Figure 4b).
  • Longitudinal dimensionless Reynold shear stress ( R X Z ) distribution: This represents the dimensionless Reynolds shear stress in the direction X and normal to Z. The distribution of the R x z was high in the FAA and the SSA, and low in the upper part of the ISA with a range of 0–8% (see Figure 4c). The R X Z in the FAA was in the range of 4–8%, and the maximum value appeared in the range of Z = 50–100 cm. The flocculation of sediment in the inclined-tube settling tank mainly appeared in the range of Z = 50–150 cm, so the moderately increased R X Z could further promote the flocculation of sediment and accelerate its settling.

3.2. Transverse Flow Characteristics

This paper only shows the transverse flow characteristics of the representative sections of Y = 20 cm, 80 cm, 140 cm, 190 cm (see Figure 5).
  • Velocity distribution: In the FAA, the velocity v near the side wall was high, which showed that there were vortexes along the Y direction at the bottom of this area. The vortexes could wash away the sediment that had been deposited at the bottom of the tank and made it suspend in the flow, reducing the settling efficiency. Because the baffle blocked the upper flow movement, the velocity in the SSA was very slow, with a range of −0.002–0.002 m/s. It was only within Z = 0–50 cm that the velocity was higher. In the ISA, the section of Y = 20 cm was far away from the overflow weir, so the suction effect was not obvious, and the velocity v was less than 0.002 m/s. However, with the decrease of the distance from the overflow weir, the velocity v increased. The direction of the velocity u-w was downward at the front part of the ISA, indicating a downward movement of the flow in the inclined tubes at the front part of the ISA, while it was upward at the latter part of the area, affected by the overflow suction. (see Figure 5a).
  • Transverse dimensionless turbulence intensity I Y distribution: The I Y gradually increased from the right wall of the tank to the left (the overflow side) (see Figure 5b). The block effect of the baffle on the middle and upper part of the flow led to the I Y in the middle and the upper part being higher than that in the lower part. At the same time, the I Y in the ISA was also significantly higher than that in other areas, indicating that the velocity v of the flow fluctuated greatly and directly related to the suction of the overflow weir.
  • Transverse dimensionless Reynold shear stress R X Y distribution: R X Y represents the Reynolds shear stress in the direction Y and normal to X. The R X Y distribution of each section was similar, ranging from 0 to 4%. The maximum value of R X Y mainly appeared in the FAA and the front part of the SSA (behind the flow adjustment board) (see Figure 5c). The distribution of R X Y in the whole flow field of the tank was low, and its influence on the sedimentation was not obvious.

3.3. Vertical Flow Characteristics

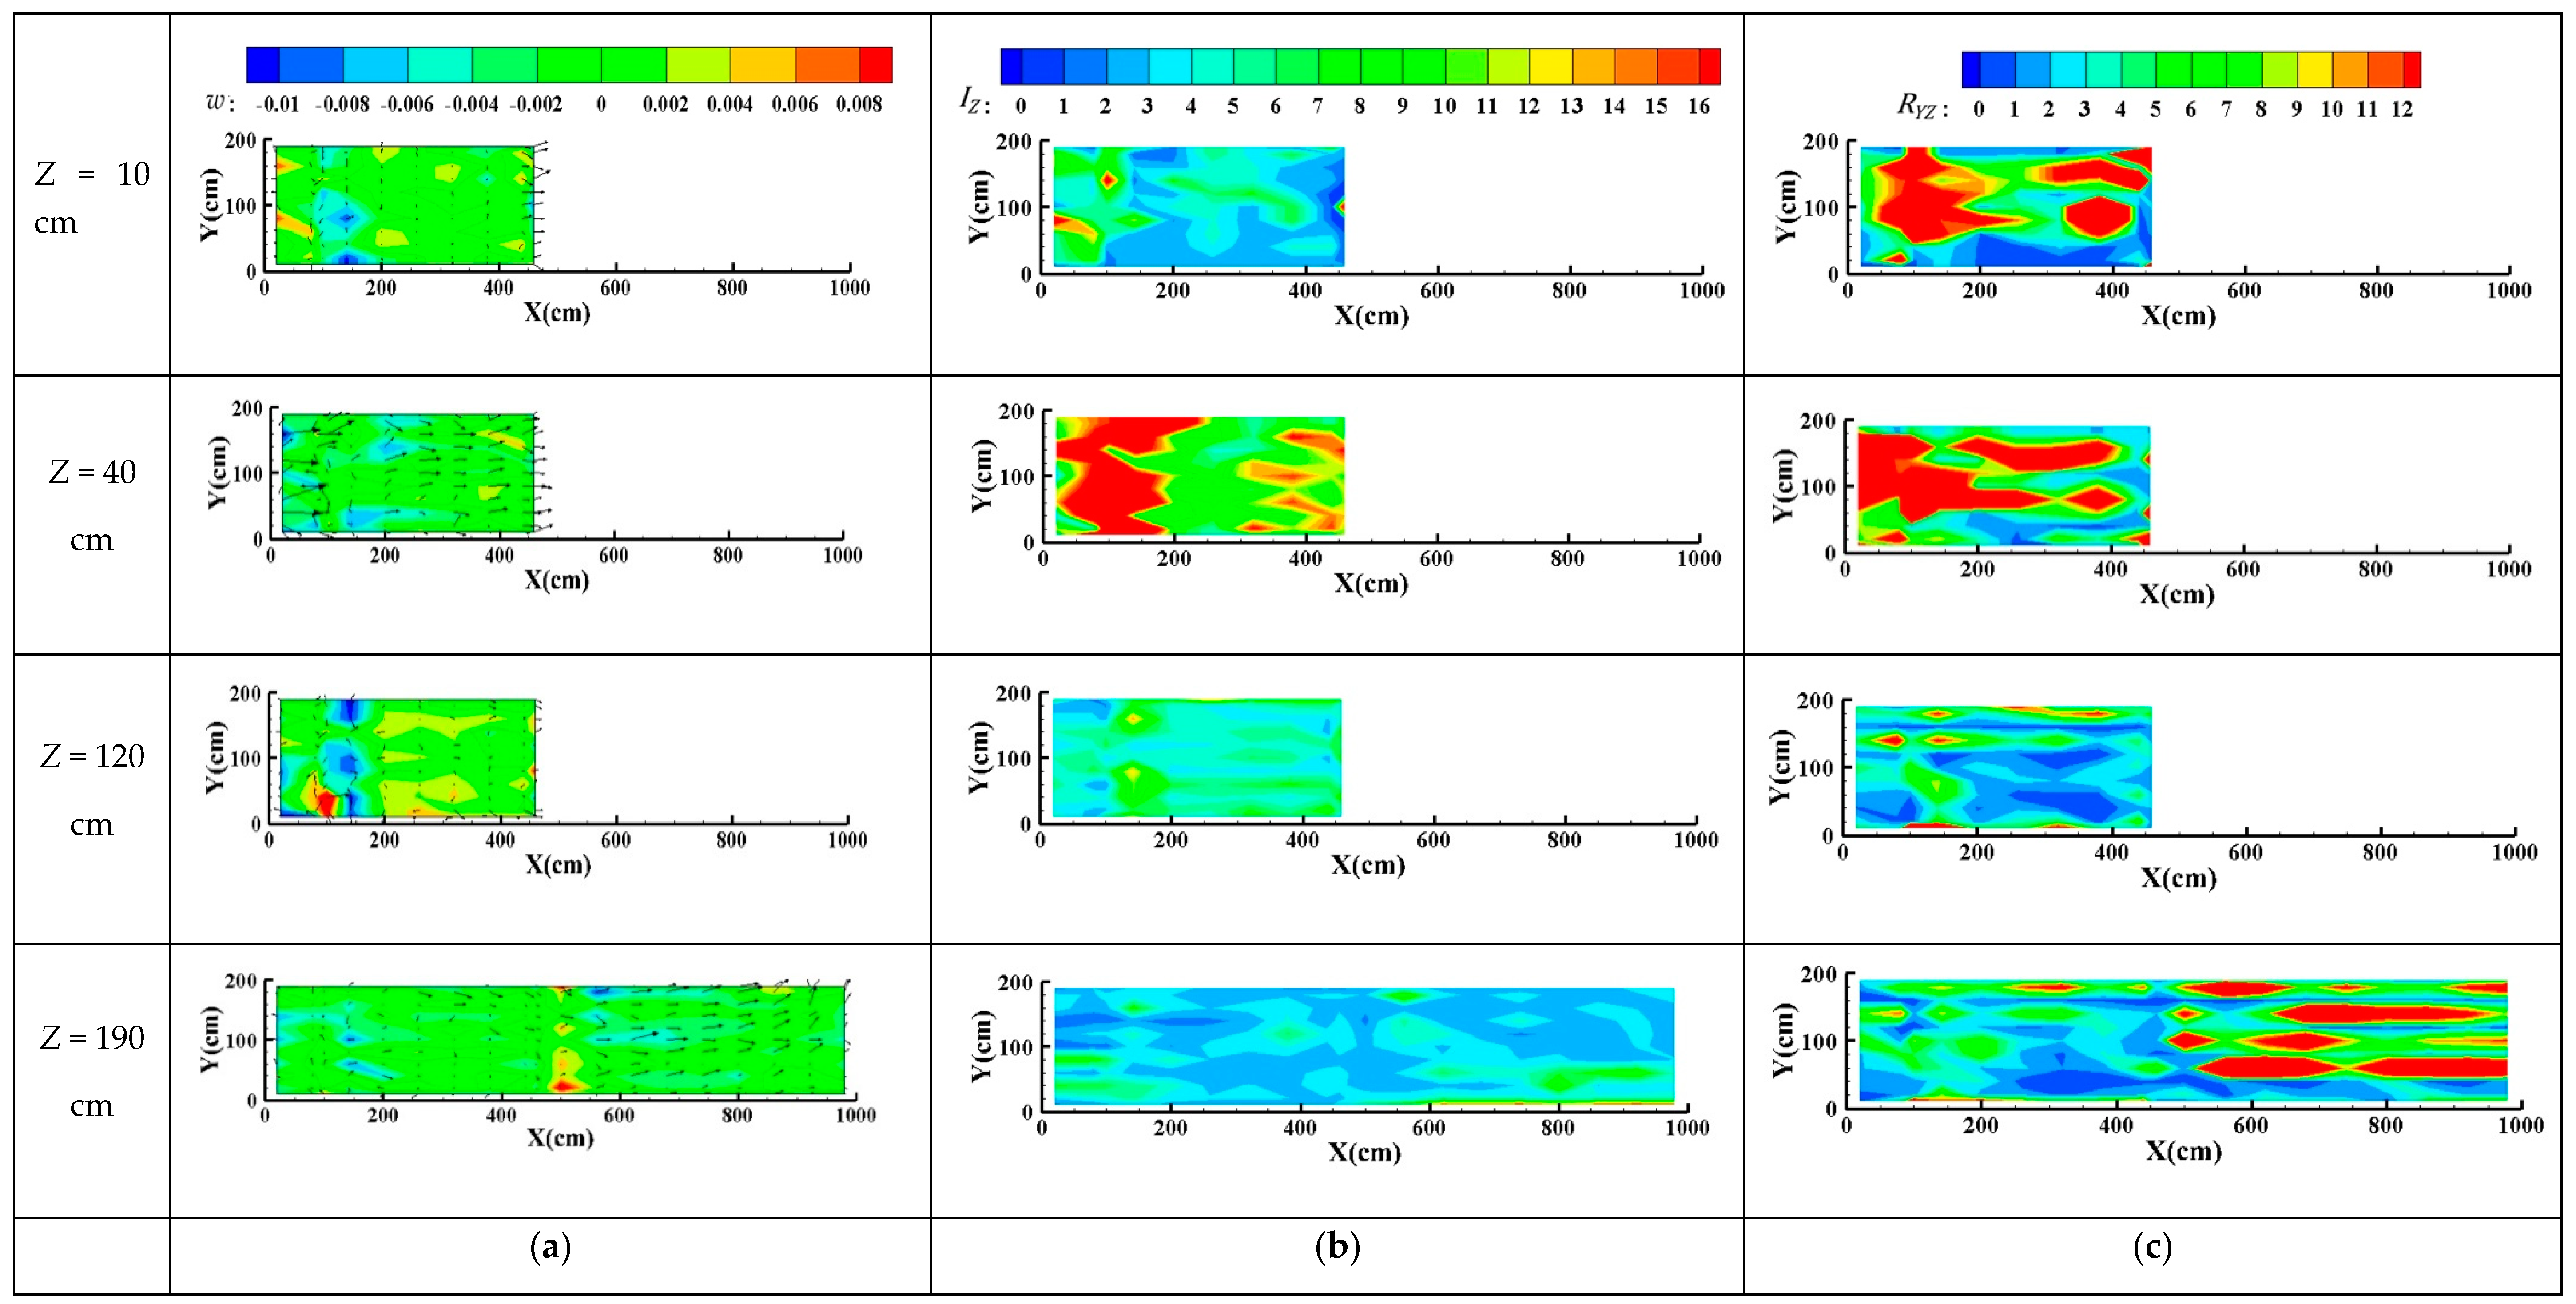
This paper only shows the vertical flow characteristics of the representative sections of Z = 10 cm, 40 cm, 120 cm, and 190 cm.
  • Velocity distribution: The distribution of the velocity w in the middle and lower part of the tank was similar. The flow velocity changed sharply in the FAA and the front and the back of the flow adjustment board, while it was uniform in the SSA. Affected by the friction of the tank bottom, the velocity u-v near the bottom was low and only significantly increased near the baffle. Influenced by the high-velocity flow from the inlet, when Z = 40 cm, the velocity u-v in the FAA was extremely high. After the water flowed through the flow adjustment board, the velocity u-v significantly reduced, but it was still higher than others at other heights which were not beneficial to the sediment settling, which was caused by the water flowing into the ISA through the gap between the baffle and the tank bottom. In the ISA, because the tubes blocked the longitudinal movement of the middle and lower part of the flow, the surface flow velocity u-v was high. In the latter half of the area, affected by the suction effect of the overflow weir, the direction of the velocity u-v was gradually biased toward the left side of the tank (i.e., the side of the overflow weir), indicating the great influence of the overflow weir on the flow pattern in the tank (see Figure 6a).
  • Vertical dimensionless turbulence intensity I Z distribution: The distribution of the I Z was low at the bottom and the upper part of the tank and high in the middle part (see Figure 6b). In the three dimensions, the I Z was the lowest. The lower turbulence intensity was favorable for the collision and adhesion of the viscous sediment particles and the formation of the floc. It also helped to speed up sediment settling at the tank bottom in a shorter time.
  • Vertical dimensionless Reynold shear stress ( R Y Z ) distribution: R Y Z represents the dimensionless Reynolds shear stress in the direction Z and normal to Y, within a range of 0–12% (see Figure 6c). The R Y Z distribution was high in the FAA and the lower part of the SSA, and the R Y Z decreased with the decrease of the water depth. This might because of the high flow velocity at the tank bottom while the low velocity in the upper part. The R Y Z ranged from 6% to 12% in the upper part of the ISA, which was the result of the high upward velocity of the water flowing out of the inclined tubes.

4. Discussion

At present, the inclined-tube settling tank has been widely used in the Yellow River irrigation region with a sediment removal rate of up to 75%, which is significantly higher than that of the settling tank with a conventional structure [33,34]. In this paper, the ADV was used to measure the flow field in the inclined-tube settling tank. It was found that the flow pattern in the tank was stable, and the flow direction was consistently directed to the downstream in the SSA and ISA. The large circulation zone was not found in the tank, so the short-circuiting phenomenon didn’t occur, which was conductive to enlarge the effective sedimentation volume in the tank [35,36,37,38,39]. The high removal efficiency of fine sediment was closely related to the inclined tubes in the tank with functions of shortening the settling distance and expanding the settling area, but also other structures in the tank, with a great effect on adjusting the flow pattern and improving the settling efficiency. The block effect of the flow adjustment board on the flow could effectively reduce the turbulence intensity and the kinetic energy [40,41], so when the high-velocity water from the inlet flowed through the flow adjustment board, the velocity became uniform, it maybe help to accelerate the sediment settling and improve the settling efficiency. After the water flowed out of the inclined tubes, it maintained a stable pattern (see Figure 5a), contributing to the sediment settling in this area. This might be the result of the laminar flow in the inclined tubes [13,42,43], making the flow pattern stable in the upper ISA.
The flow turbulence intensity of the inclined-tube settling tank under the conditions in this paper contributed to the sediment settling. The fine sediment absorbed the turbulent kinetic energy of the flow during the movement, promoting the random turbulence of the sediment particles, increasing the collision probability of sediment particles [44,45], many research works have found that appropriate turbulence intensity was conductive to the formation of flocs and accelerating the sediment settling [46,47,48]. The Reynolds shear stress had a dual effect on the sediment flocculation [49]. On the one hand, the increase of the flow shear strength would increase the collision probability among sediment particles and promote the occurrence and development of the flocculation; on the other hand, when the flow shear strength exceeded the internal cohesive force among the flocs, the increase of the shear strength would destroy the large flocs with loose structure, which was not beneficial to the formation of the flocs. By means of the vibration test of a single grille, Gratiot et al. found that when the Reynolds shear stress was in the range of 3–19 s−1, the Reynolds shear stress of water would promote sediment flocculation [50]. In the inclined-tube settling tank in this paper, the Reynolds shear stress in most areas was within the range, which was beneficial to the sediment flocculation and to settling at the tank bottom.
However, some structures in the inclined-tube settling tank had a negative effect on the flow pattern and were not conducive to the sediment settling. The inlet had a great influence on the flow characteristics in the settling area [51]. In this paper, the flow velocity from the water inlet was high, which not only washed away the sediment that had been deposited at the tank bottom, but also affected the structural stability of the tank, which was not conducive to the long-term safe operation of the tank. This disadvantage could be improved by reducing the flow velocity from the inlet and raising the inlet position. Moreover, the water needed to flow into the ISA from the gap between the baffle and the tank bottom. At this moment, the flow velocity would increase slightly. The previous research found that, in this condition [52], the sediment at the tank bottom would be washed away and re-suspended, which would decrease the settling efficiency of the tank. Many research works have found that there was a disturbance of the overflow weir on the flow velocity distribution [53,54,55], which was similar to the results of this paper. This was caused by the gradual decrease of water pressure near the overflow weir from the bottom to the water surface [56]. By improving the structure of the overflow weir, the disturbance to the flow field could be reduced [57,58], which requires more research in the future.

5. Conclusions

Our conclusions are as follows:
(1)
After flowing through the flow adjustment board, the flow velocity decreased from 0.03 m/s to −0.005–0.01 m/s, indicating that the flow pattern in the inclined-tube settling tank could be significantly improved by the flow adjustment board. The flow pattern in the upper ISA was steady, with a range of 0–0.008 m/s, indicating that the inclined tubes could improve the flow pattern. The water inlet, baffle and the overflow weir in the tank negatively affected the flow pattern of the tank.
(2)
The dimensionless turbulence intensity and dimensionless Reynolds shear stress of the flow in the inclined-tube settling tank changed sharply in the FAA, near the flow adjustment board, baffle and the overflow weir, while they were uniformly distributed in other areas. Under the conditions in this paper, the turbulence intensity and Reynolds shear stress of the flow in the tank were conductive to the collision of the sediment particles and floc formation, accelerating the settling velocity in the water.
The unique aspect of this paper was that this was the first experimental study to systematically investigate the three-dimensional characteristics of the whole inclined-tube settling tank, which enhanced our understanding of the flow characteristics in the tank. Furthermore, it pointed out a direction for the next structural optimization of the inclined-tube settling tank.

Author Contributions

Methodology, K.W. and P.Y.; investigation, K.W.; data curation, K.W. and S.R.; writing—original draft preparation, K.W.; writing—review and editing, K.W. and Y.L.; supervision, P.Y.; funding acquisition, P.Y. All authors have read and agreed to the published version of the manuscript.

Funding

This research was supported by the National Natural Science Foundation of China (51621061) and the Major Science and Technology Projects of Inner Mongolia (2014[117]).

Acknowledgments

We are deeply grateful to the editor and reviewers for their insightful and careful review.

Conflicts of Interest

The authors declare no conflict of interest.

References

  1. Zhang, J.; Shi, K.; Gao, Y.; Wang, J. Turbid water desilting characteristics of circular-ring desilting and sediment ejection basin. Trans. Chin. Soc. Agric. Eng. 2014, 30, 86–93. [Google Scholar]
  2. Juan, S. Design of gravity desilting filter tank for drip irrigation with river water and its extension. Water Sav. Irrig. 2014, 1, 60–64. [Google Scholar]
  3. He, C.; Scott, E.; Rochfort, Q. Enhancing sedimentation by improving flow conditions using parallel retrofit baffles. J. Environ. Manag. 2015, 160, 1–6. [Google Scholar] [CrossRef]
  4. Bajcar, T.; Gosar, L.; Širok, B.; Steinman, F.; Rak, G. Influence of flow field on sedimentation efficiency in a circular settling tank with peripheral inflow and central effluent. Chem. Eng. Process. Process Intensif. 2010, 49, 514–522. [Google Scholar] [CrossRef]
  5. Boycott, A.E. Sedimentation of blood corpuscles. Nature 1920, 104, 532. [Google Scholar] [CrossRef]
  6. Willis, R.M. Tubular settlers—A technical review. J. AWWA 1978, 70, 331–335. [Google Scholar] [CrossRef]
  7. Galvin, K.P.; Nguyentranlam, G. Influence of parallel inclined plates in a liquid fluidized bed system. Chem. Eng. Sci. 2002, 57, 1231–1234. [Google Scholar] [CrossRef]
  8. Doroodchi, E.; Zhou, J.; Fletcher, D.F.; Galvin, K.P. Particle size classification in a fluidized bed containing parallel inclined plates. Miner. Eng. 2006, 19, 162–171. [Google Scholar] [CrossRef]
  9. Laskovski, D.; Duncan, P.; Stevenson, P.; Zhou, J.; Galvin, K.P. Segregation of hydraulically suspended particles in inclined channels. Chem. Eng. Sci. 2006, 61, 7269–7278. [Google Scholar] [CrossRef]
  10. Han, S.; Li, Y.; Xu, F.; Sun, D.; Feng, J.; Liu, Z.; Wu, R.; Wang, Z. Effect of lateral flushing on emitter clogging under drip irrigation with Yellow River water and a suitable method. Irrig. Drain. 2018, 67, 199–209. [Google Scholar] [CrossRef]
  11. Li, Q.; Song, P.; Zhou, B.; Xiao, Y.; Muhammad, T.; Liu, Z.; Zhou, H.; Li, Y. Mechanism of intermittent fluctuated water pressure on emitter clogging substances formation in drip irrigation system utilizing high sediment water. Agric. Water Manag. 2019, 215, 16–24. [Google Scholar] [CrossRef]
  12. Bandrowski, J.; Hehlmann, J.; Merta, H.; Zioło, J. Studies of sedimentation in settlers with packing. Chem. Eng. Process. Process Intensif. 1997, 36, 219–229. [Google Scholar] [CrossRef]
  13. Xie, M.; Shi, Z.; Liu, X. The Motion and Removal Efficiency of Particles in Circular Tube Settlers. In Proceedings of the 2009 International Conference on Energy and Environment Technology, Guilin, China, 16–18 October 2009; Volume 1, pp. 437–440. [Google Scholar]
  14. Ignjatović, L. Efficient (tube) settling tanks. Water Sci. Technol. 1991, 24, 223–228. [Google Scholar] [CrossRef]
  15. Peker, S.M.; Helvaci, S.S. Solid-Liquid Two Phase Flow; Elsevier: Amsterdam, The Netherlands, 2011. [Google Scholar]
  16. Casey, T.J.; Casey, T. Unit Treatment Processes in Water and Wastewater Engineering; Wiley Chichester: Hoboken, NJ, USA, 1997; pp. 166–170. [Google Scholar]
  17. Shahrokhi, M.; Rostami, F.; Said, M.A.M.; Yazdi, S.R.S. The effect of number of baffles on the improvement efficiency of primary sedimentation tanks. Appl. Math. Model. 2012, 36, 3725–3735. [Google Scholar] [CrossRef]
  18. Stamou, A.; Adams, E.; Rodi, W. Numerical modeling of flow and settling in primary rectangular clarifiers. J. Hydraul. Res. 1989, 27, 665–682. [Google Scholar] [CrossRef]
  19. Krebs, P.; Vischer, D.; Gujer, W. Inlet-structure design for final clarifiers. J. Environ. Eng. 1995, 121, 558–564. [Google Scholar] [CrossRef]
  20. Larsen, P. On the Hydraulics of Rectangular Settling Basins: Experimental and Theoretical Studies; Department of Water Resources Engineering, Lund Institute of Technology, University of Lund: Lund, Sweden, 1977. [Google Scholar]
  21. Mccorquodale, J.A.; Zhou, S. Effects of hydraulic and solids loading on clarifier performance. J. Hydraul. Res. 1993, 31, 461–478. [Google Scholar] [CrossRef]
  22. Schamber, D.R.; Larock, B.E. Numerical analysis of flow in sedimentation basins. J. Hydraul. Div. 1981, 107, 575–591. [Google Scholar]
  23. Wang, X.; Yang, L.; Sun, Y.; Song, L.; Zhang, M.; Cao, Y. Three-dimensional simulation on the water flow field and suspended solids concentration in the rectangular sedimentation tank. J. Environ. Eng. 2008, 134, 902–911. [Google Scholar] [CrossRef]
  24. Ekama, G.; Marais, P. Assessing the applicability of the 1D flux theory to full-scale secondary settling tank design with a 2D hydrodynamic model. Water Res. 2004, 38, 495–506. [Google Scholar] [CrossRef]
  25. López, P.R.; Lavín, A.G.; López, M.M.M.; Heras, J.L.B.D.L. Flow models for rectangular sedimentation tanks. Chem. Eng. Process. Process Intensif. 2008, 47, 1705–1716. [Google Scholar] [CrossRef]
  26. Romphophak, P.; Wongwailikhit, K.; Chawaloesphonsiya, N.; Samornkraisorakit, P.; Painmanakul, P. Study of flow pattern in jet clarifier for removal of turbidity by residence time distribution approach. Eng. J. 2016, 20, 17–27. [Google Scholar] [CrossRef] [Green Version]
  27. Taebi-Harandy, A.; Schroeder, E.D. Analysis of structural features on performance of secondary clarifiers. J. Environ. Eng. 1995, 121, 911–918. [Google Scholar] [CrossRef]
  28. Younes, M.; Younes, Y.; El-Madah, M.; Ibrahim, I.; El-Dannanh, E. An experimental investigation of hydrodynamic damping due to vertical baffle arrangements in a rectangular tank. J. Eng. Marit. Environ. 2007, 221, 115–123. [Google Scholar] [CrossRef]
  29. Imam, E.; McCorquodale, J.A.; Bewtra, J. Numerical modeling of sedimentation tanks. J. Hydraul. Eng. 1983, 109, 1740–1754. [Google Scholar] [CrossRef]
  30. Liu, B.; Ma, J.; Luo, L.; Bai, Y.; Wang, S.; Zhang, J. Two-dimensional LDV measurement, modeling, and optimal design of rectangular primary settling tanks. J. Environ. Eng. 2010, 136, 501–507. [Google Scholar] [CrossRef]
  31. Razmi, A.; FirouzabadiI, B.; Ahmadi, G. Experimental and numerical approach to enlargement of performance of primary settling tanks. J. Appl. Fluid Mech. 2009, 2, 1–12. [Google Scholar]
  32. Nikora, V.; Goring, D.G. Flow turbulence over fixed and weakly mobile gravel beds. J. Hydraul. Eng. 2000, 126, 679–690. [Google Scholar] [CrossRef]
  33. Casonato, M.; Gallerano, F. A finite difference self-Adaptive mesh solution of flow in a sedimentation tank. Int. J. Numer. Methods Fluids 1990, 10, 697–711. [Google Scholar] [CrossRef]
  34. Maruejouls, T.; Vanrolleghem, P.A.; Pelletier, G.; Lessard, P. A phenomenological retention tank model using settling velocity distributions. Water Res. 2012, 46, 6857–6867. [Google Scholar] [CrossRef]
  35. Goula, A.M.; Kostoglou, M.; Karapantsios, T.D.; Zouboulis, A.I. A CFD methodology for the design of sedimentation tanks in potable water treatment: Case study: The influence of a feed flow control baffle. Chem. Eng. J. 2008, 140, 110–121. [Google Scholar] [CrossRef]
  36. Tarpagkou, R.; Pantokratoras, A. CFD methodology for sedimentation tanks: The effect of secondary phase on fluid phase using DPM coupled calculations. Appl. Math. Model. 2013, 37, 3478–3494. [Google Scholar] [CrossRef]
  37. Abdelgawad, S.M.; Mccorquodale, J.A. Hydrodynamic of circular primary clarifiers. Can. J. Civ. Eng. 1984, 11, 299–307. [Google Scholar] [CrossRef]
  38. Tarpagkou, R.; Pantokratoras, A. The influence of lamellar settler in sedimentation tanks for potable water treatment—A computational fluid dynamic study. Powder Technol. 2014, 268, 139–149. [Google Scholar] [CrossRef]
  39. Zhou, S.; Mccorquodale, J.A.; Godo, A.M. Short Circuiting and Density Interface in Primary Clarifiers. J. Hydraul. Eng. 1994, 120, 1060–1080. [Google Scholar] [CrossRef]
  40. Wu, J.; Zong, Q.; Liu, H.; Liu, C. Experiment study of flow’s adjusting with flow board in sediment basin. J. Water Resour. Water Eng. 2007, 5, 6–9. [Google Scholar]
  41. Hua, G.; Liu, H. Research on the effect of adjusting flow board on flow of the sand basin for micro-irrigation. China Rural. Water Hydropower 2012, 10, 13–16. [Google Scholar]
  42. Clay Mcmichael, F. Sedimentation in inclined tubes and its application for the design of high rate sedimentation devices. J. Hydraul. Res. 1972, 10, 59–75. [Google Scholar] [CrossRef]
  43. Yao, K. Theoretical study of high-rate sedimentation. J. Water Pollut. Control Fed. 1970, 42, 218–228. [Google Scholar]
  44. Bagnold, R.A.; Nevins, T.H.F. Correspondence. Some flume experiments on large grains but little denser than the transporting fluid, and their implications. Proc. Inst. Civ. Eng. 1955, 4, 1058–1060. [Google Scholar] [CrossRef]
  45. Bruhl, H.; Kazanskij, I. New results concerning the influence of fine particles on sand-water flows in pipes. Hydrotransport 1976, B2, 19–28. [Google Scholar]
  46. Dyer, K.R.; Manning, A.J. Observation of the size, settling velocity and effective density of flocs, and their fractal dimensions. J. Sea Res. 1999, 41, 87–95. [Google Scholar] [CrossRef]
  47. Macdonald, I.T.; Vincent, C.E.; Thorne, P.D.; Moate, B.D. Acoustic scattering from a suspension of flocculated sediments. J. Geophys. Res. 2013, 118, 2581–2594. [Google Scholar] [CrossRef] [Green Version]
  48. Uncles, R.J.; Bale, A.J.; Stephens, J.; Frickers, P.E.; Harris, C. Observations of Floc Sizes in a Muddy Estuary. Estuar. Coast. Shelf Sci. 2010, 87, 186–196. [Google Scholar] [CrossRef]
  49. Muller, A. Turbulence Measurements over a Movable Bed with Sediment Transport by Laser Anemometry. In Proceedings of the 15th Congress International Association for Hydraulic Research, Istanbul, Turkey, 7–13 September 1973; Volume 1, pp. A7-1–A7-7. [Google Scholar]
  50. Gratiot, N.; Manning, A. An experimental investigation of floc characteristics in a diffusive turbulent flow. J. Coast. Res. 2004, 41, 105–113. [Google Scholar]
  51. He, C.; Wood, J.; Marsalek, J.; Rochfort, Q. Using CFD modeling to improve the inlet hydraulics and performance of a storm-water clarifier. J. Environ. Eng. 2008, 134, 722–730. [Google Scholar] [CrossRef]
  52. Zhou, S.; McCorquodale, J.A. Modeling of rectangular settling tanks. J. Hydraul. Eng. 1992, 118, 1391–1405. [Google Scholar] [CrossRef]
  53. Chen, Y.; Fu, Z.; Chen, Q.; Cui, Z.J.W. Discharge coefficient of rectangular short-crested weir with varying slope coefficients. Water 2018, 10, 204. [Google Scholar] [CrossRef] [Green Version]
  54. Novak, G.; Steinman, F.; Müller, M.; Bajcar, T. Study of velocity field at model sideweir using visualization method. J. Hydraul. Res. 2012, 50, 129–133. [Google Scholar] [CrossRef]
  55. Shariq, A.; Hussain, A.; Ansari, M.A. Lateral flow through the sharp crested side rectangular weirs in open channels. Flow Meas. Instrum. 2018, 59, 8–17. [Google Scholar] [CrossRef]
  56. Lv, X.; Zou, Q.; Reeve, D. Numerical simulation of overflow at vertical weirs using a hybrid level set/VOF method. Adv. Water Resour. 2011, 34, 1320–1334. [Google Scholar] [CrossRef]
  57. Khode, B.; Tembhurkar, A.; Porey, P.; Ingle, R. Experimental studies on flow over labyrinth weir. J. Irrig. Drain. Eng. 2011, 138, 548–552. [Google Scholar] [CrossRef]
  58. Mohammadzadeh-Habili, J.; Heidarpour, M.; Afzalimehr, H. Hydraulic characteristics of a new weir entitled of quarter-circular crested weir. Flow Meas. Instrum. 2013, 33, 168–178. [Google Scholar] [CrossRef]
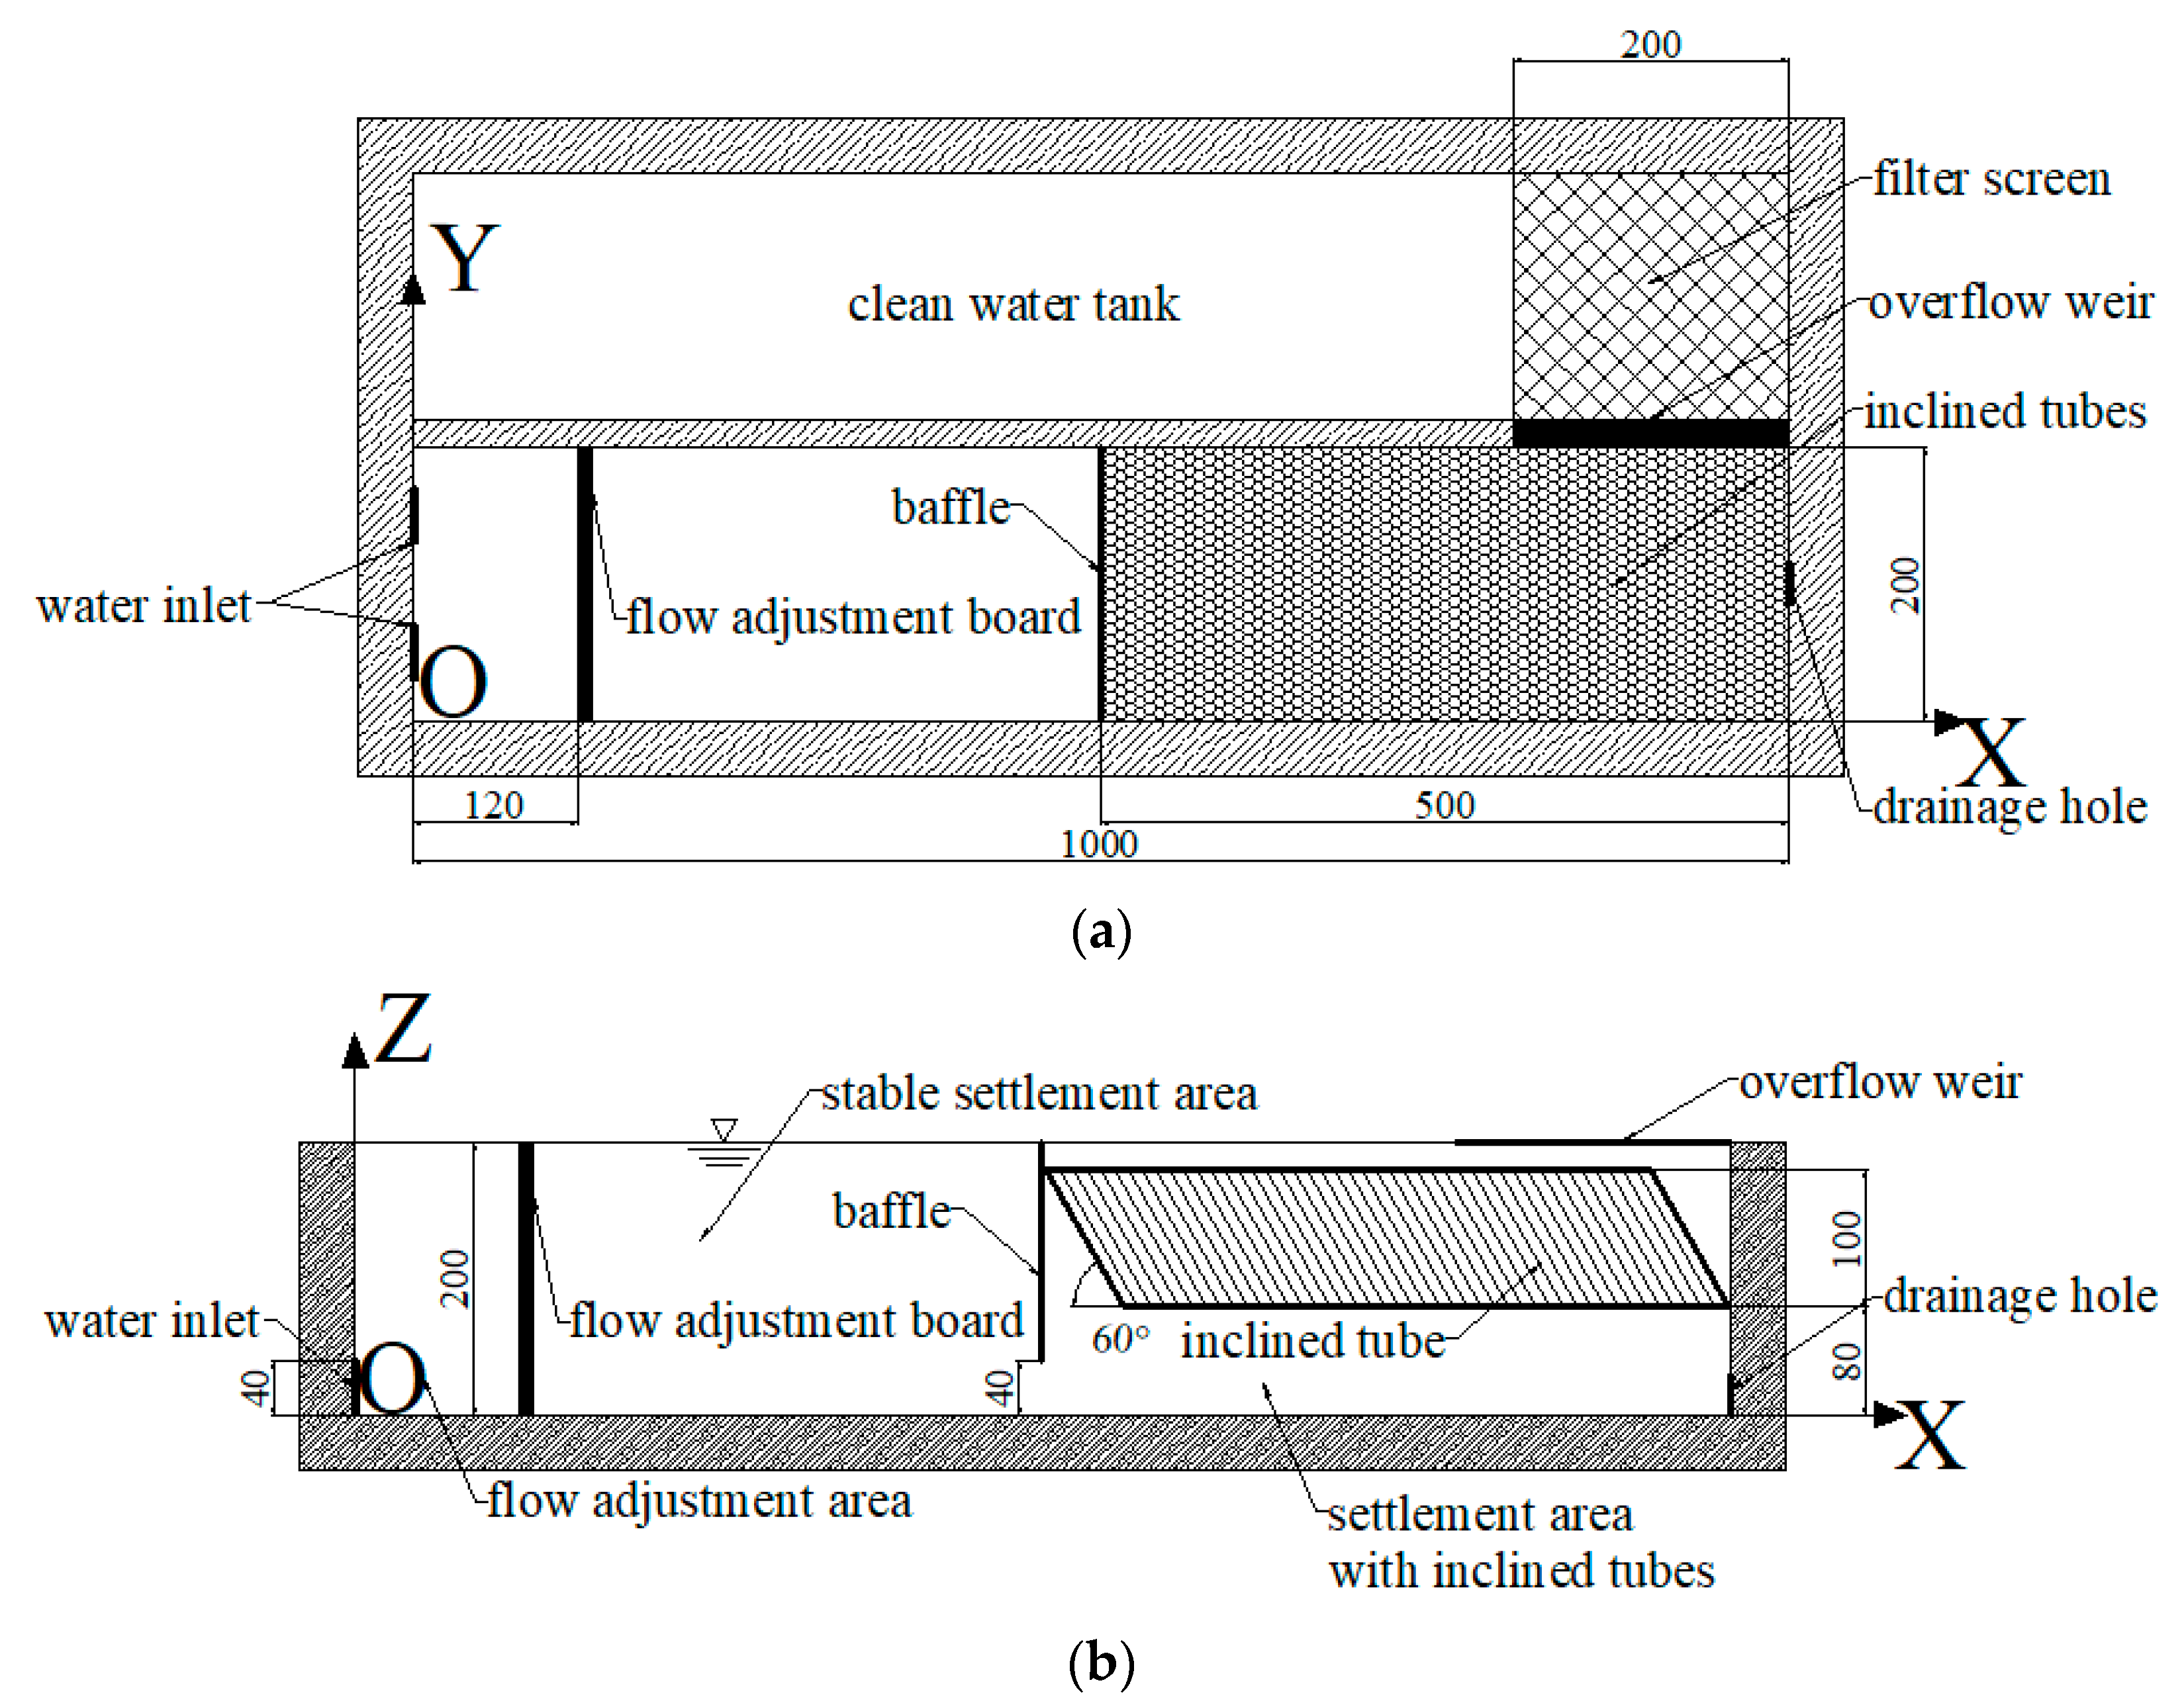
Figure 1. Schematic diagram of the inclined-tube settling tank: (a) vertical view of the inclined-tube settling tank; (b) cross-sectional view of the inclined-tube settling tank; (c) working process of the inclined-tube settling tank; and (d) schematic diagram of the flow adjustment board (all the dimensions are in centimeters).
Applsci 10 03586 g001aApplsci 10 03586 g001b
Figure 2. Photographs of the inclined-tube settling tank: (a) full view of the inclined-tube settling tank, (b) detailed view of inclined tubes.
Applsci 10 03586 g002
Figure 3. Measurement locations: (a) locations of measurement sections; (b) measurement locations arrangement in each section (all the dimensions are in centimeters).
Applsci 10 03586 g003aApplsci 10 03586 g003b
Figure 4. Distribution of longitudinal flow characteristics: (a) velocity (the contour plot represents the longitudinal velocity u, and the vector represents velocity v-w); (b) dimensionless turbulence intensity I X ; and (c) dimensionless Reynolds shear stress R X Z (The unit of velocity is m/s, and the dimensionless turbulence intensity and dimensionless Reynolds shear stress is dimensionless).
Applsci 10 03586 g004
Figure 5. Distribution of transverse flow characteristics: (a) velocity (the contour plot represents the transverse velocity v, and the vector represents velocity u-w); (b) dimensionless turbulence intensity I Y ; and (c) dimensionless Reynolds shear stress R X Y . (The unit of velocity is m/s, and the dimensionless turbulence intensity and dimensionless Reynolds shear stress is dimensionless).
Applsci 10 03586 g005
Figure 6. Distribution of vertical flow characteristics: (a) velocity (the contour plot represents the vertical velocity w, and the vector represents velocity u-v); (b) dimensionless turbulence intensity I Z ; and (c) dimensionless Reynolds shear stress R Y Z . (The unit of velocity is m/s, and the dimensionless turbulence intensity and dimensionless Reynolds shear stress is dimensionless).
Applsci 10 03586 g006