Injection Molding Process Control of Servo–Hydraulic System


Abstract
1. Introduction
2. Materials and Methods
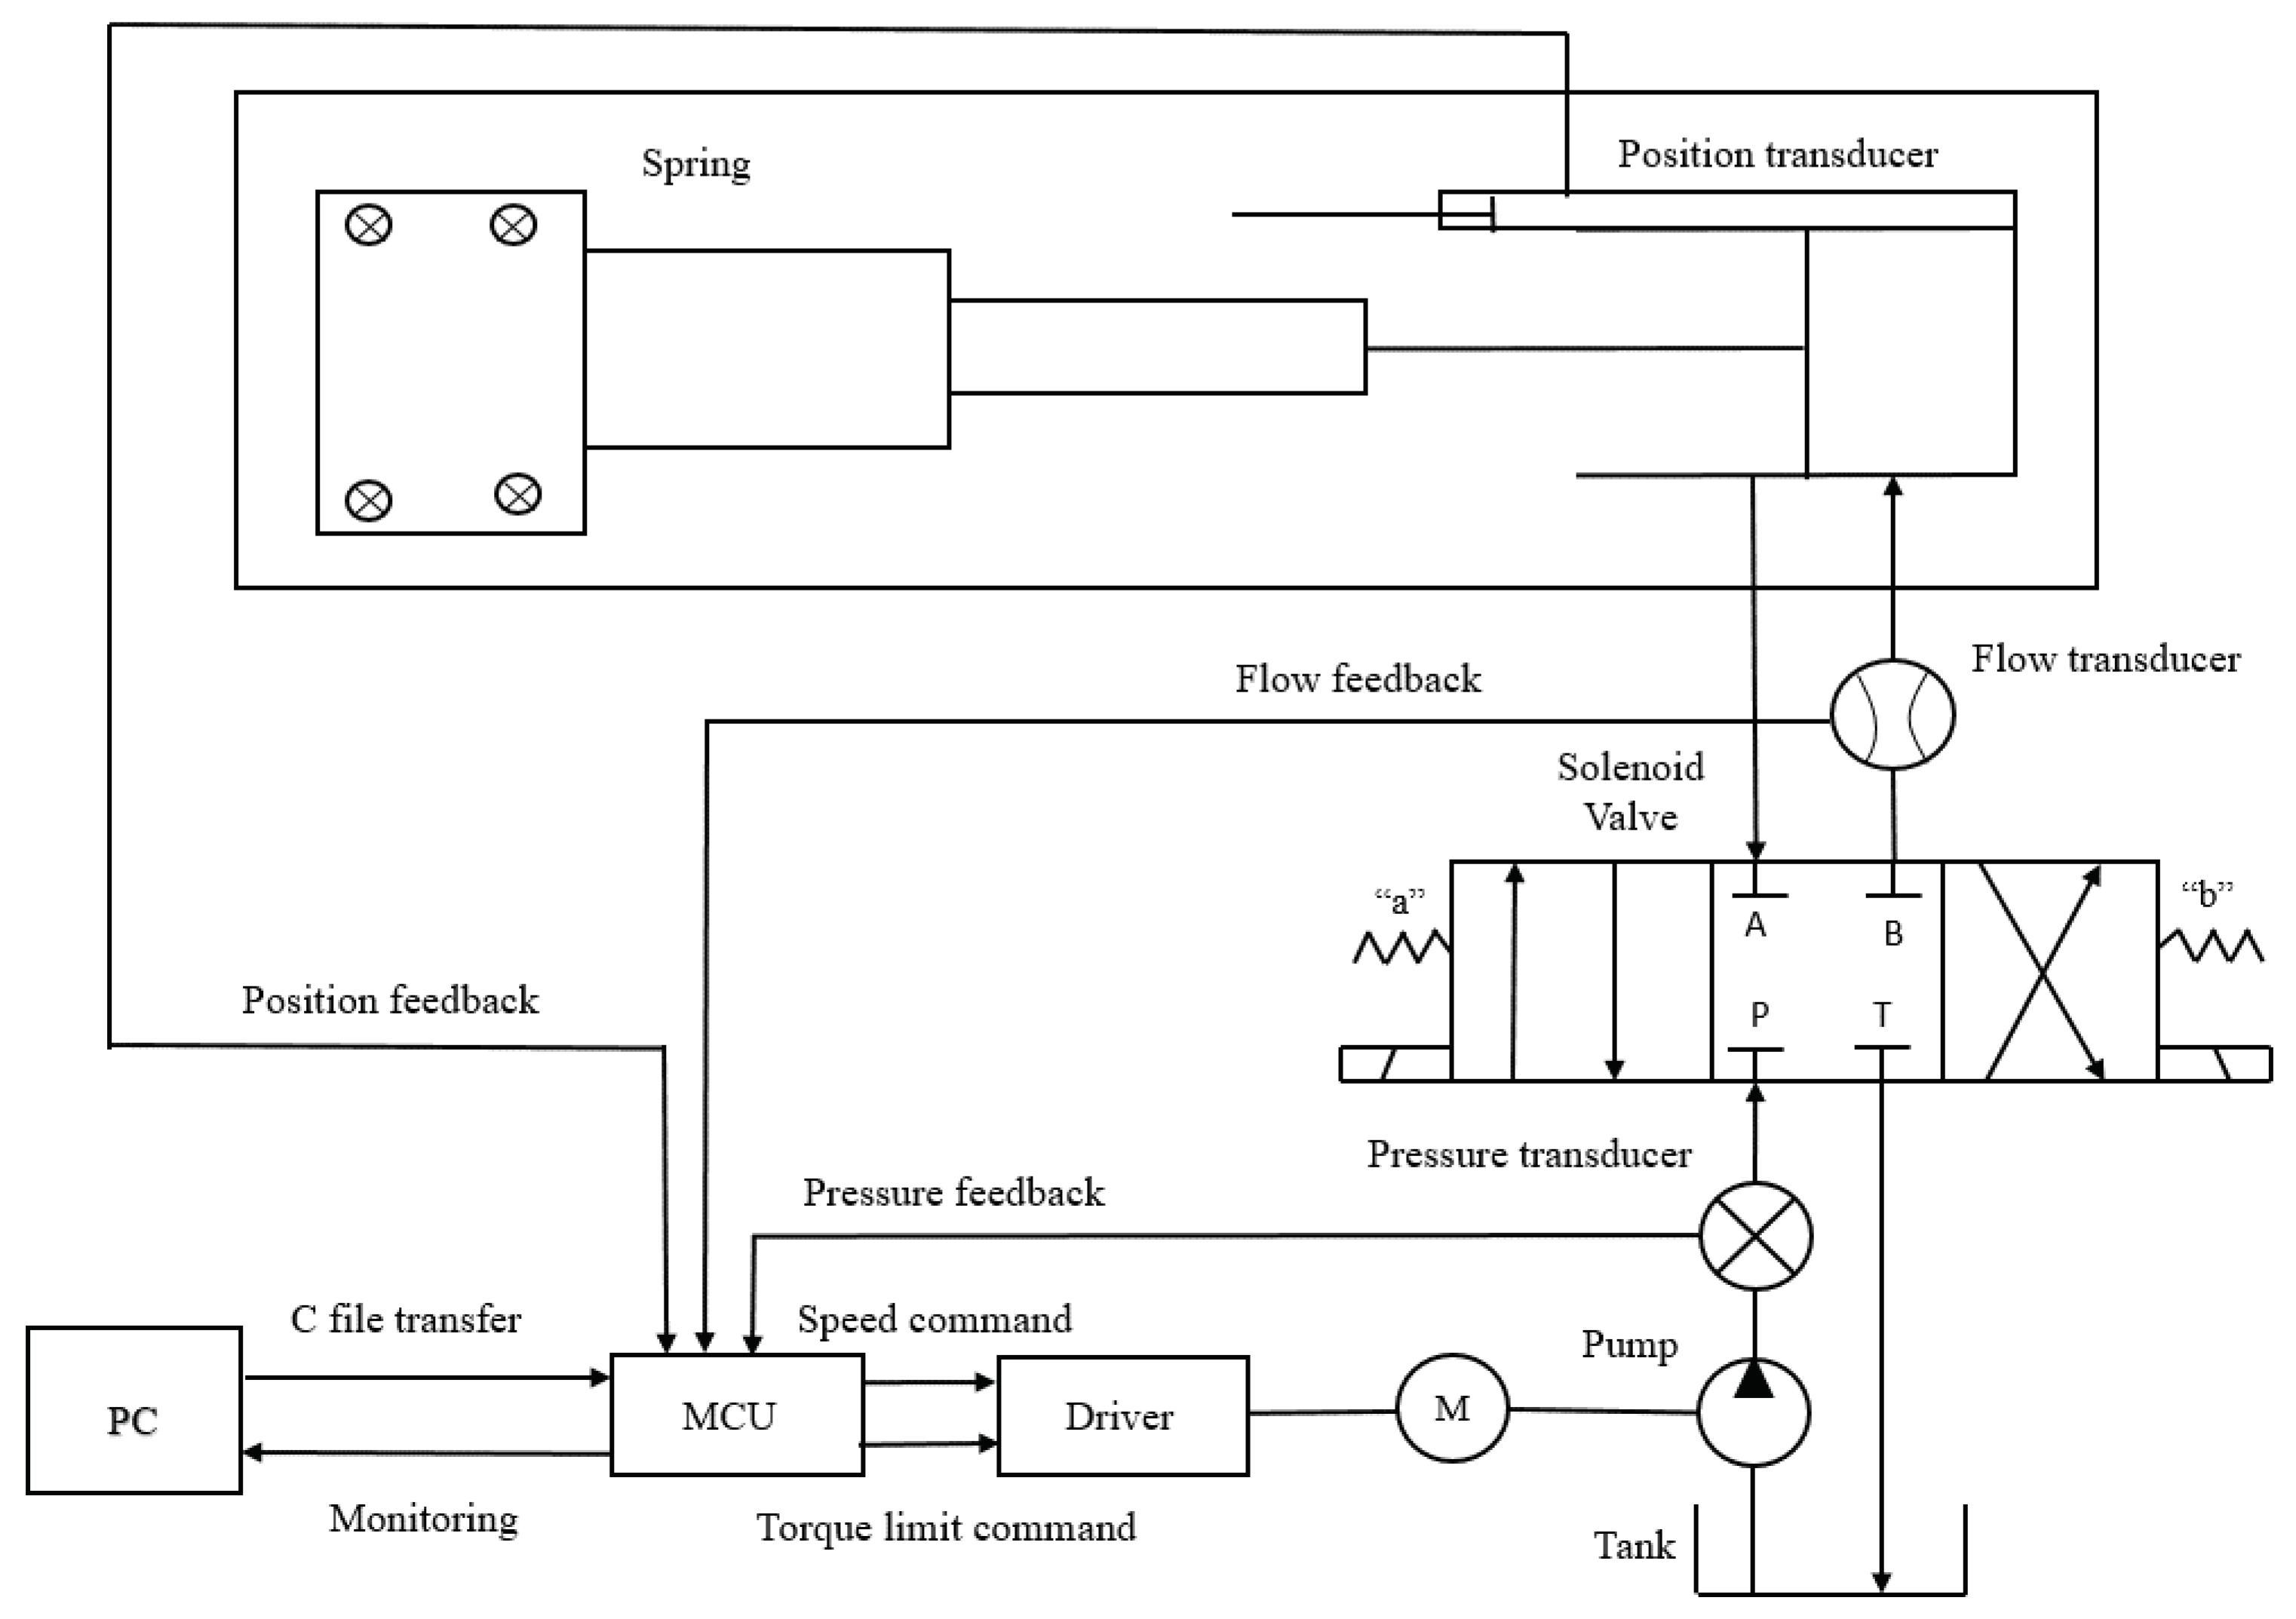
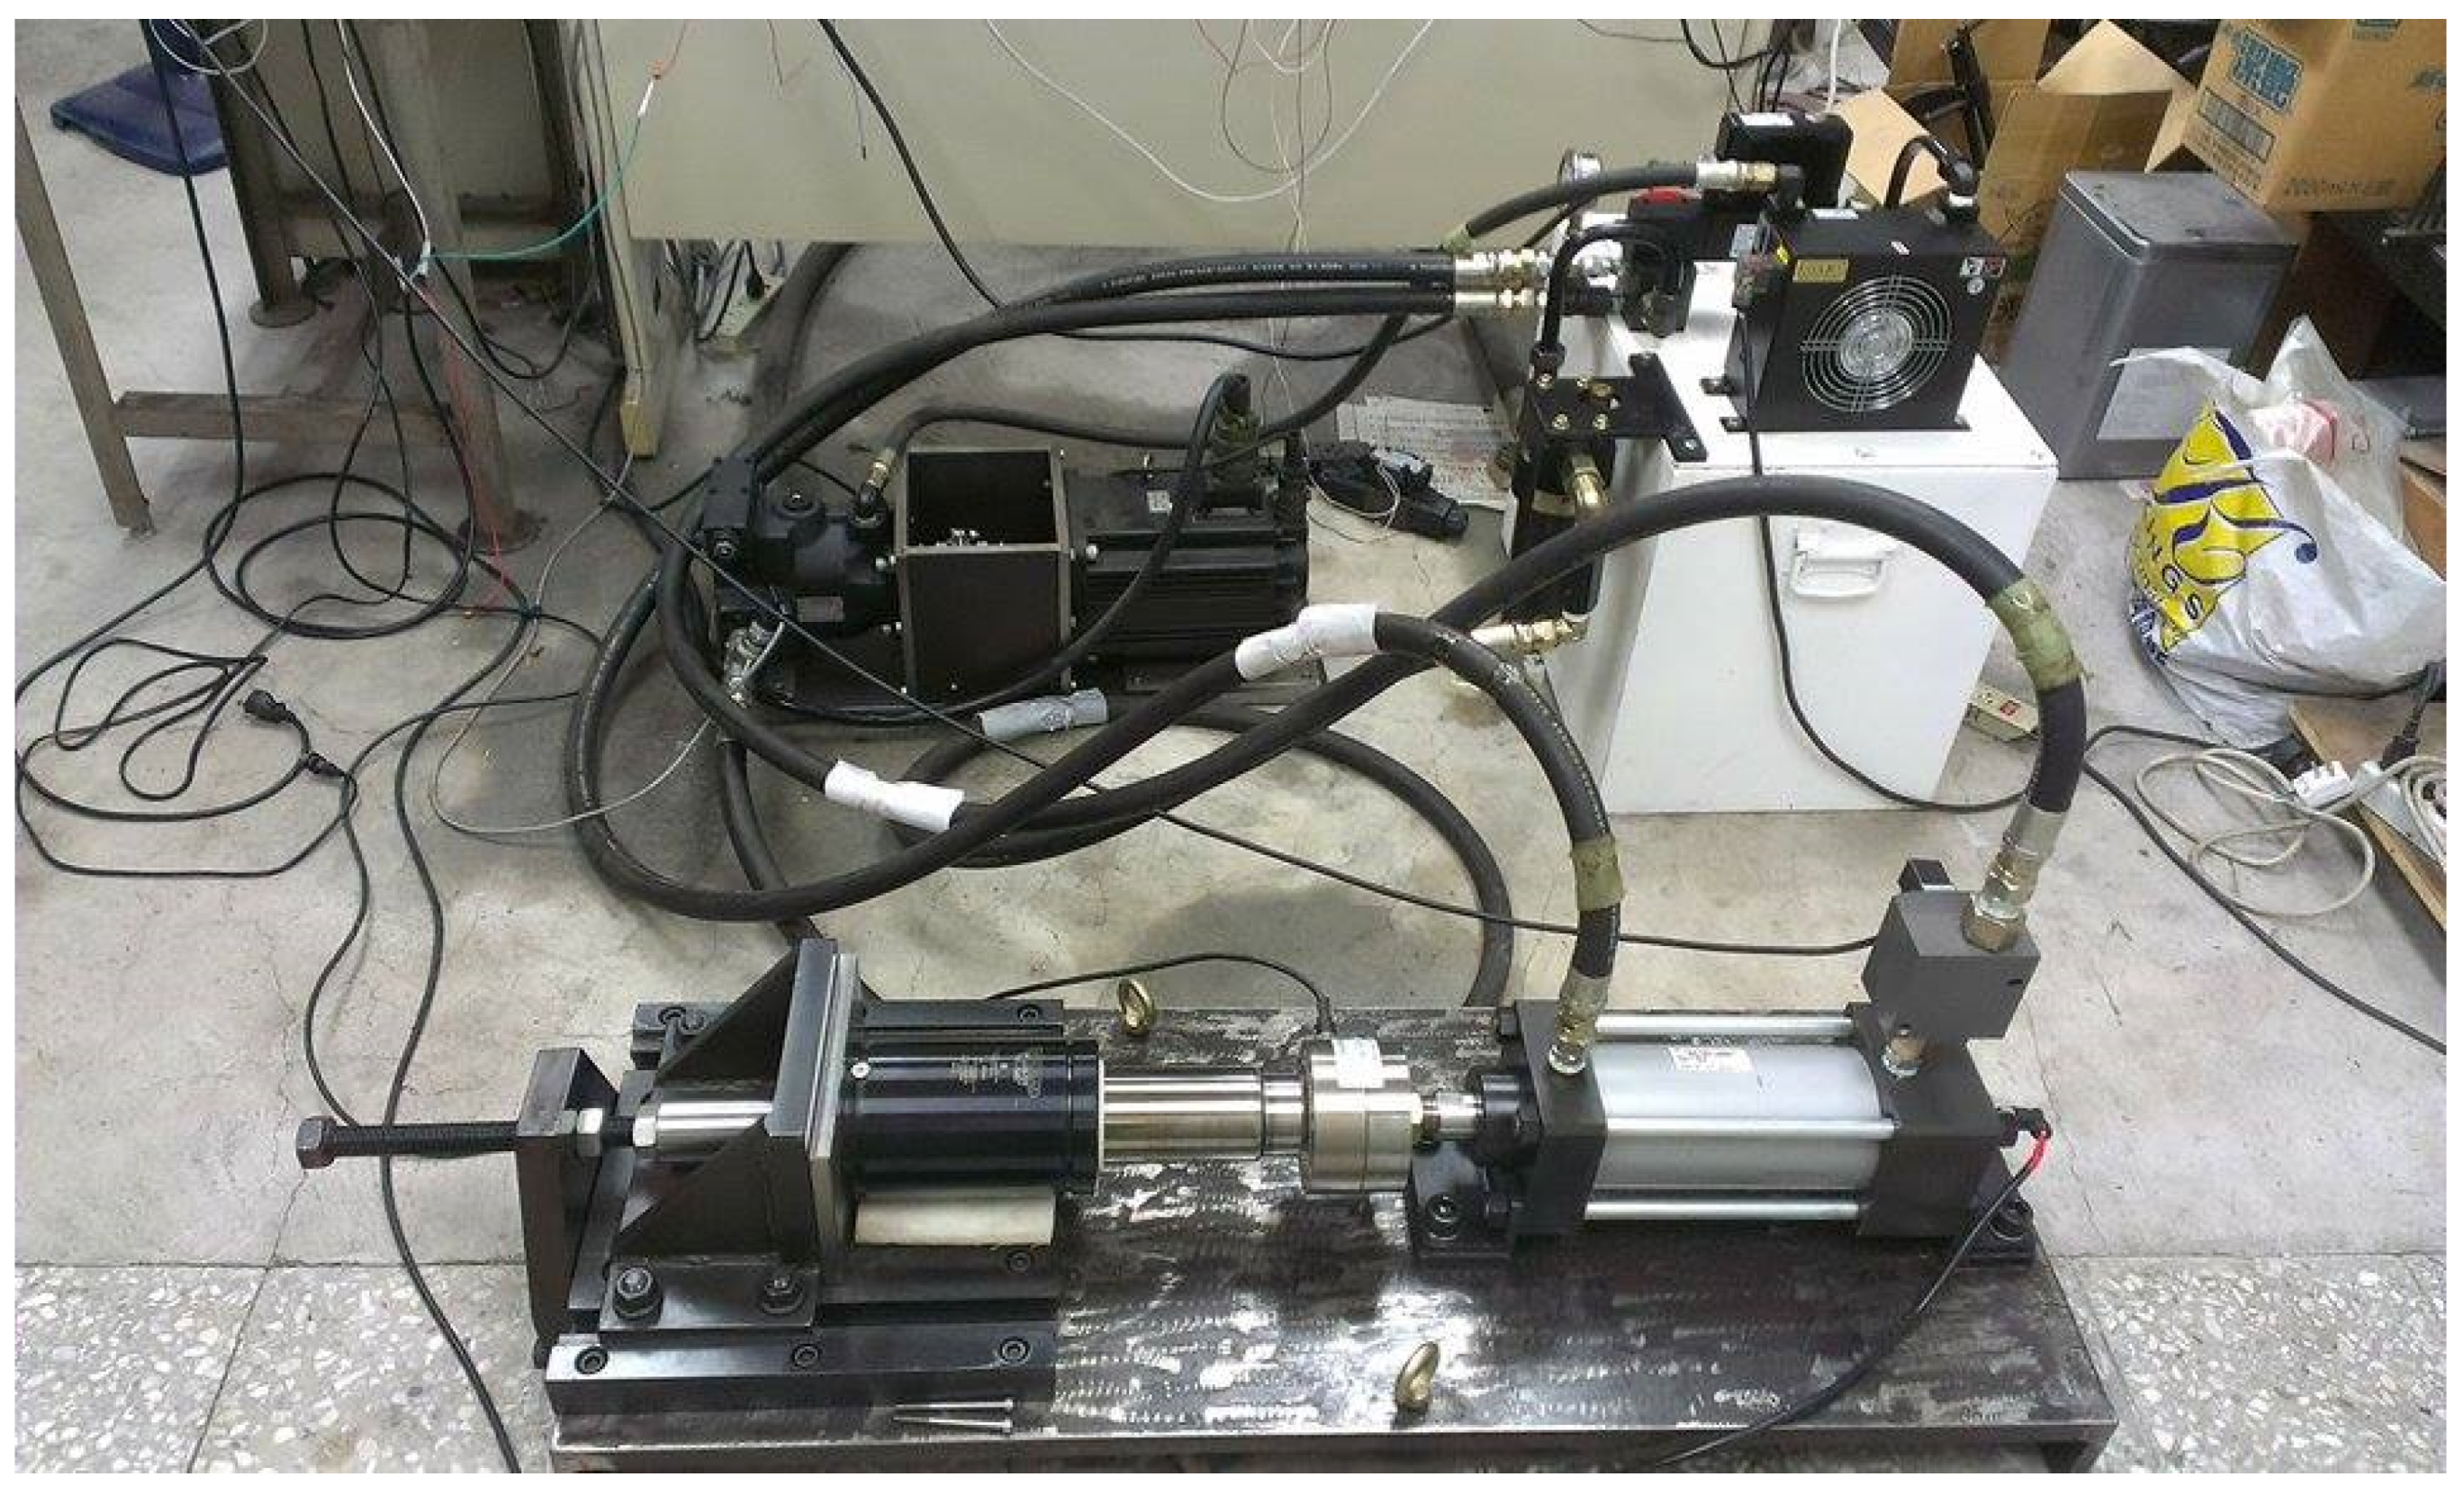
2.1. Experimental System
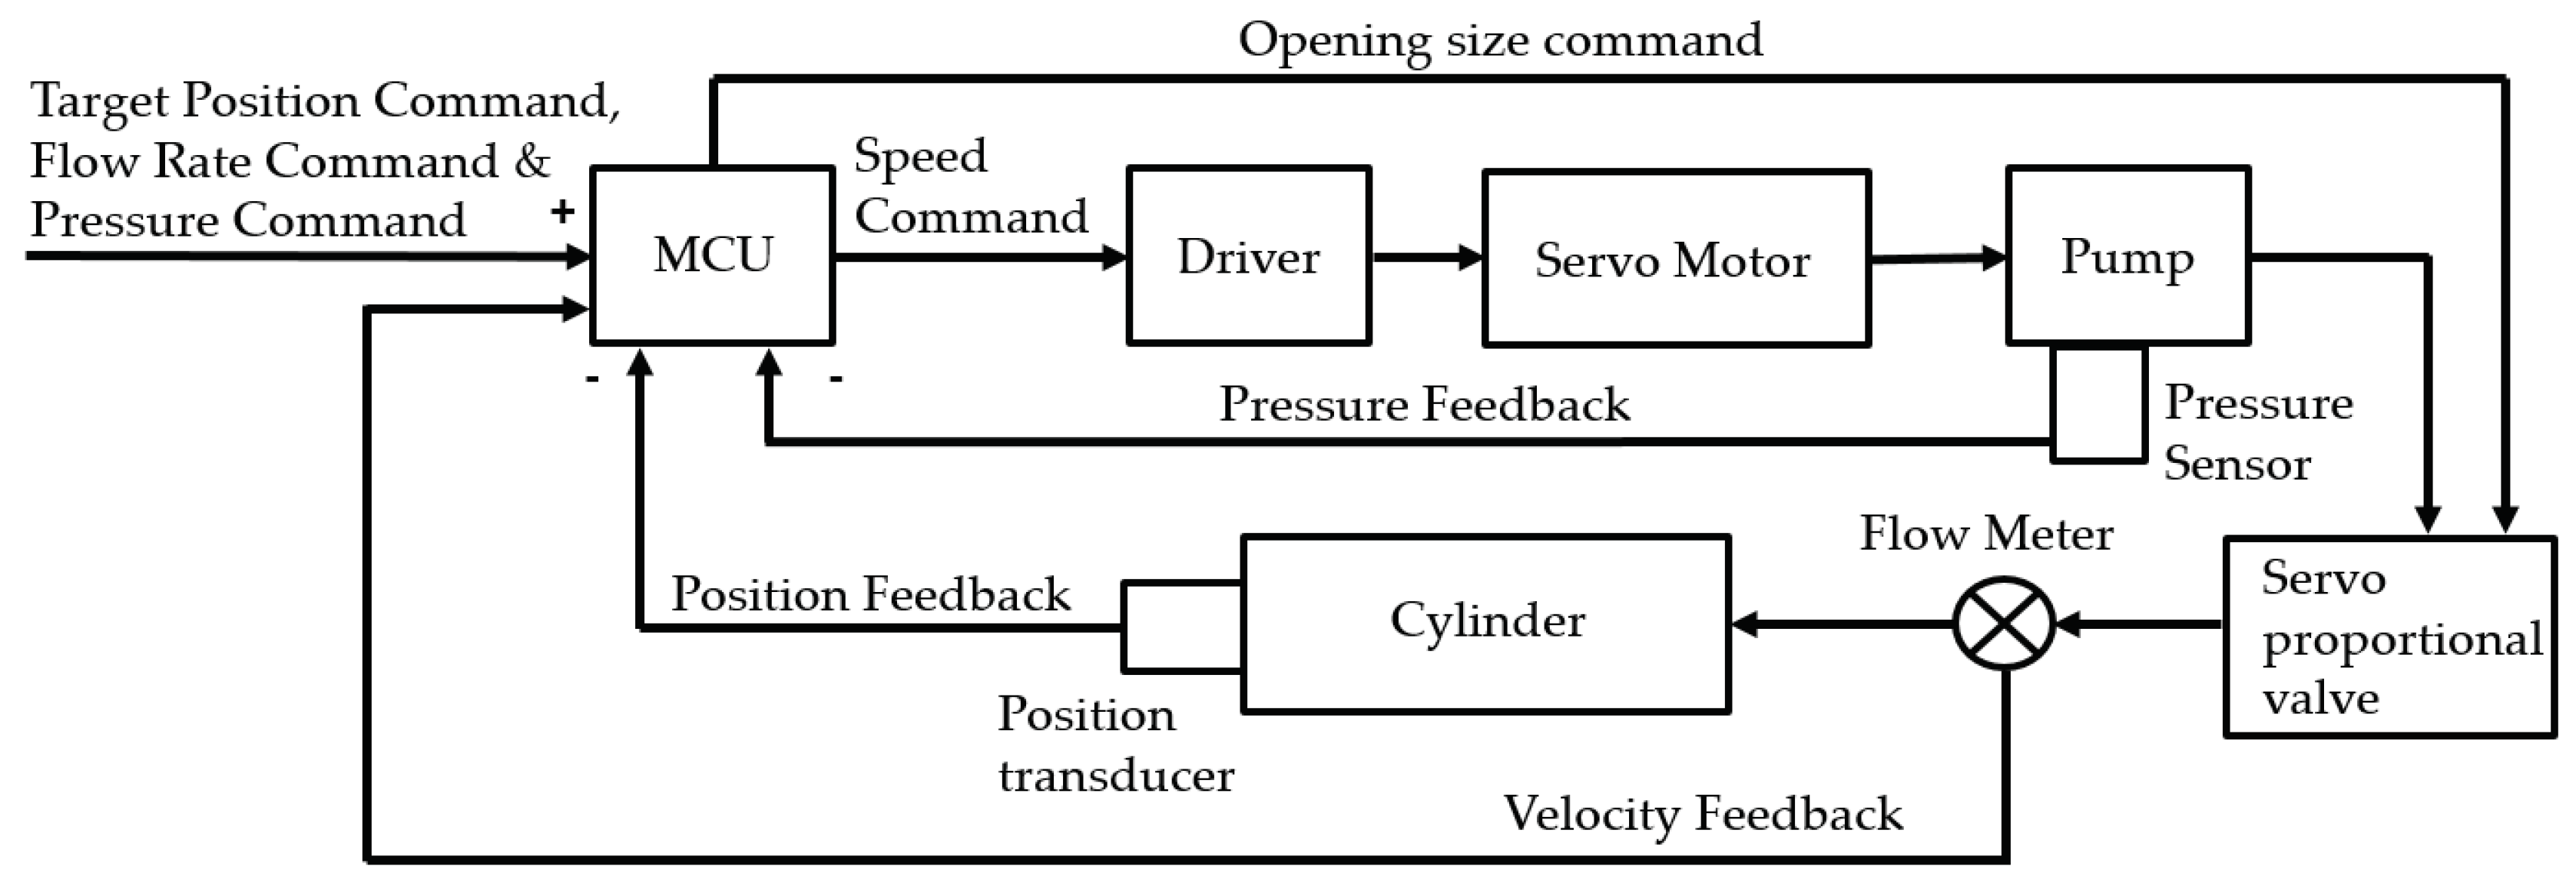
2.2. Control Strategy
2.3. Experimental Performance Indicators and Targets
2.4. Multi-Target Positions, Single Target Speed, and Single Target Pressure Control Experiments
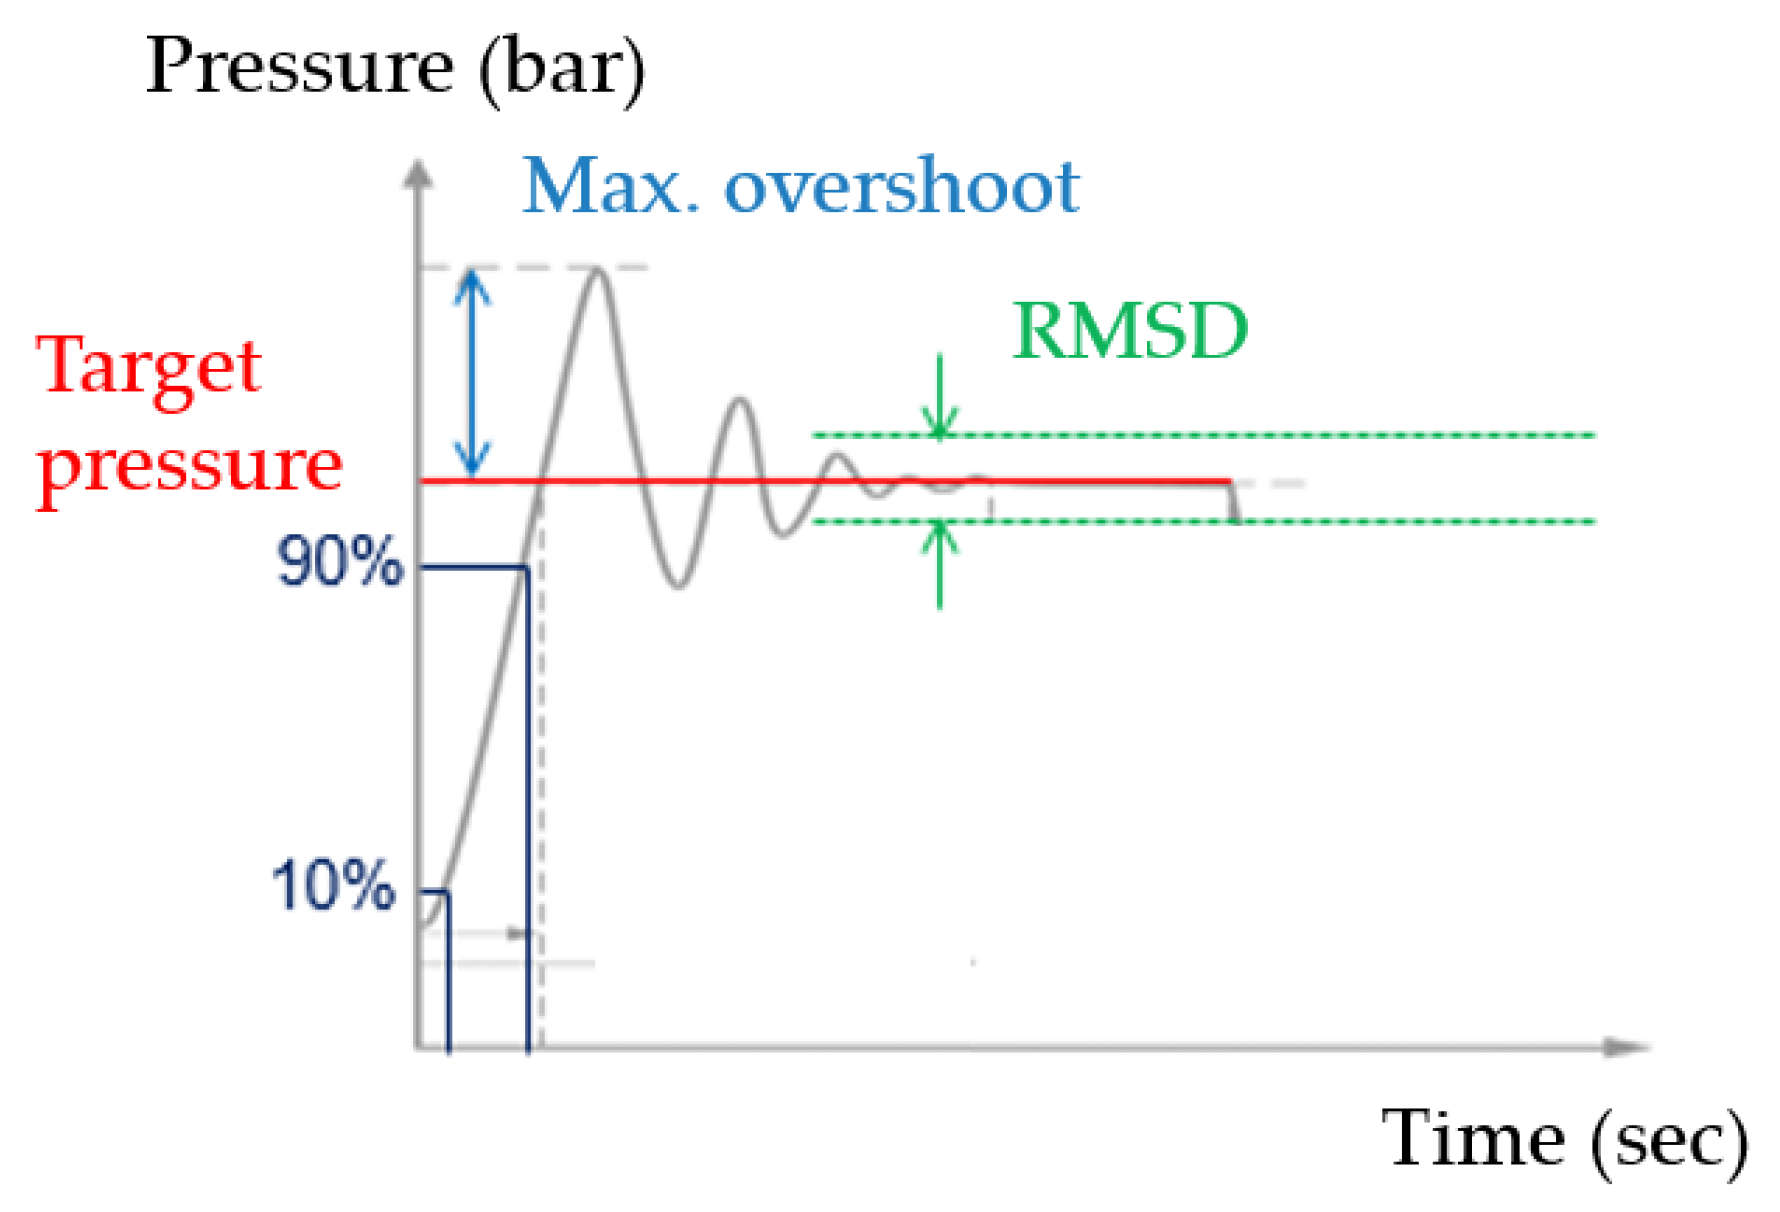
- Response time: as the definition in the previous section.
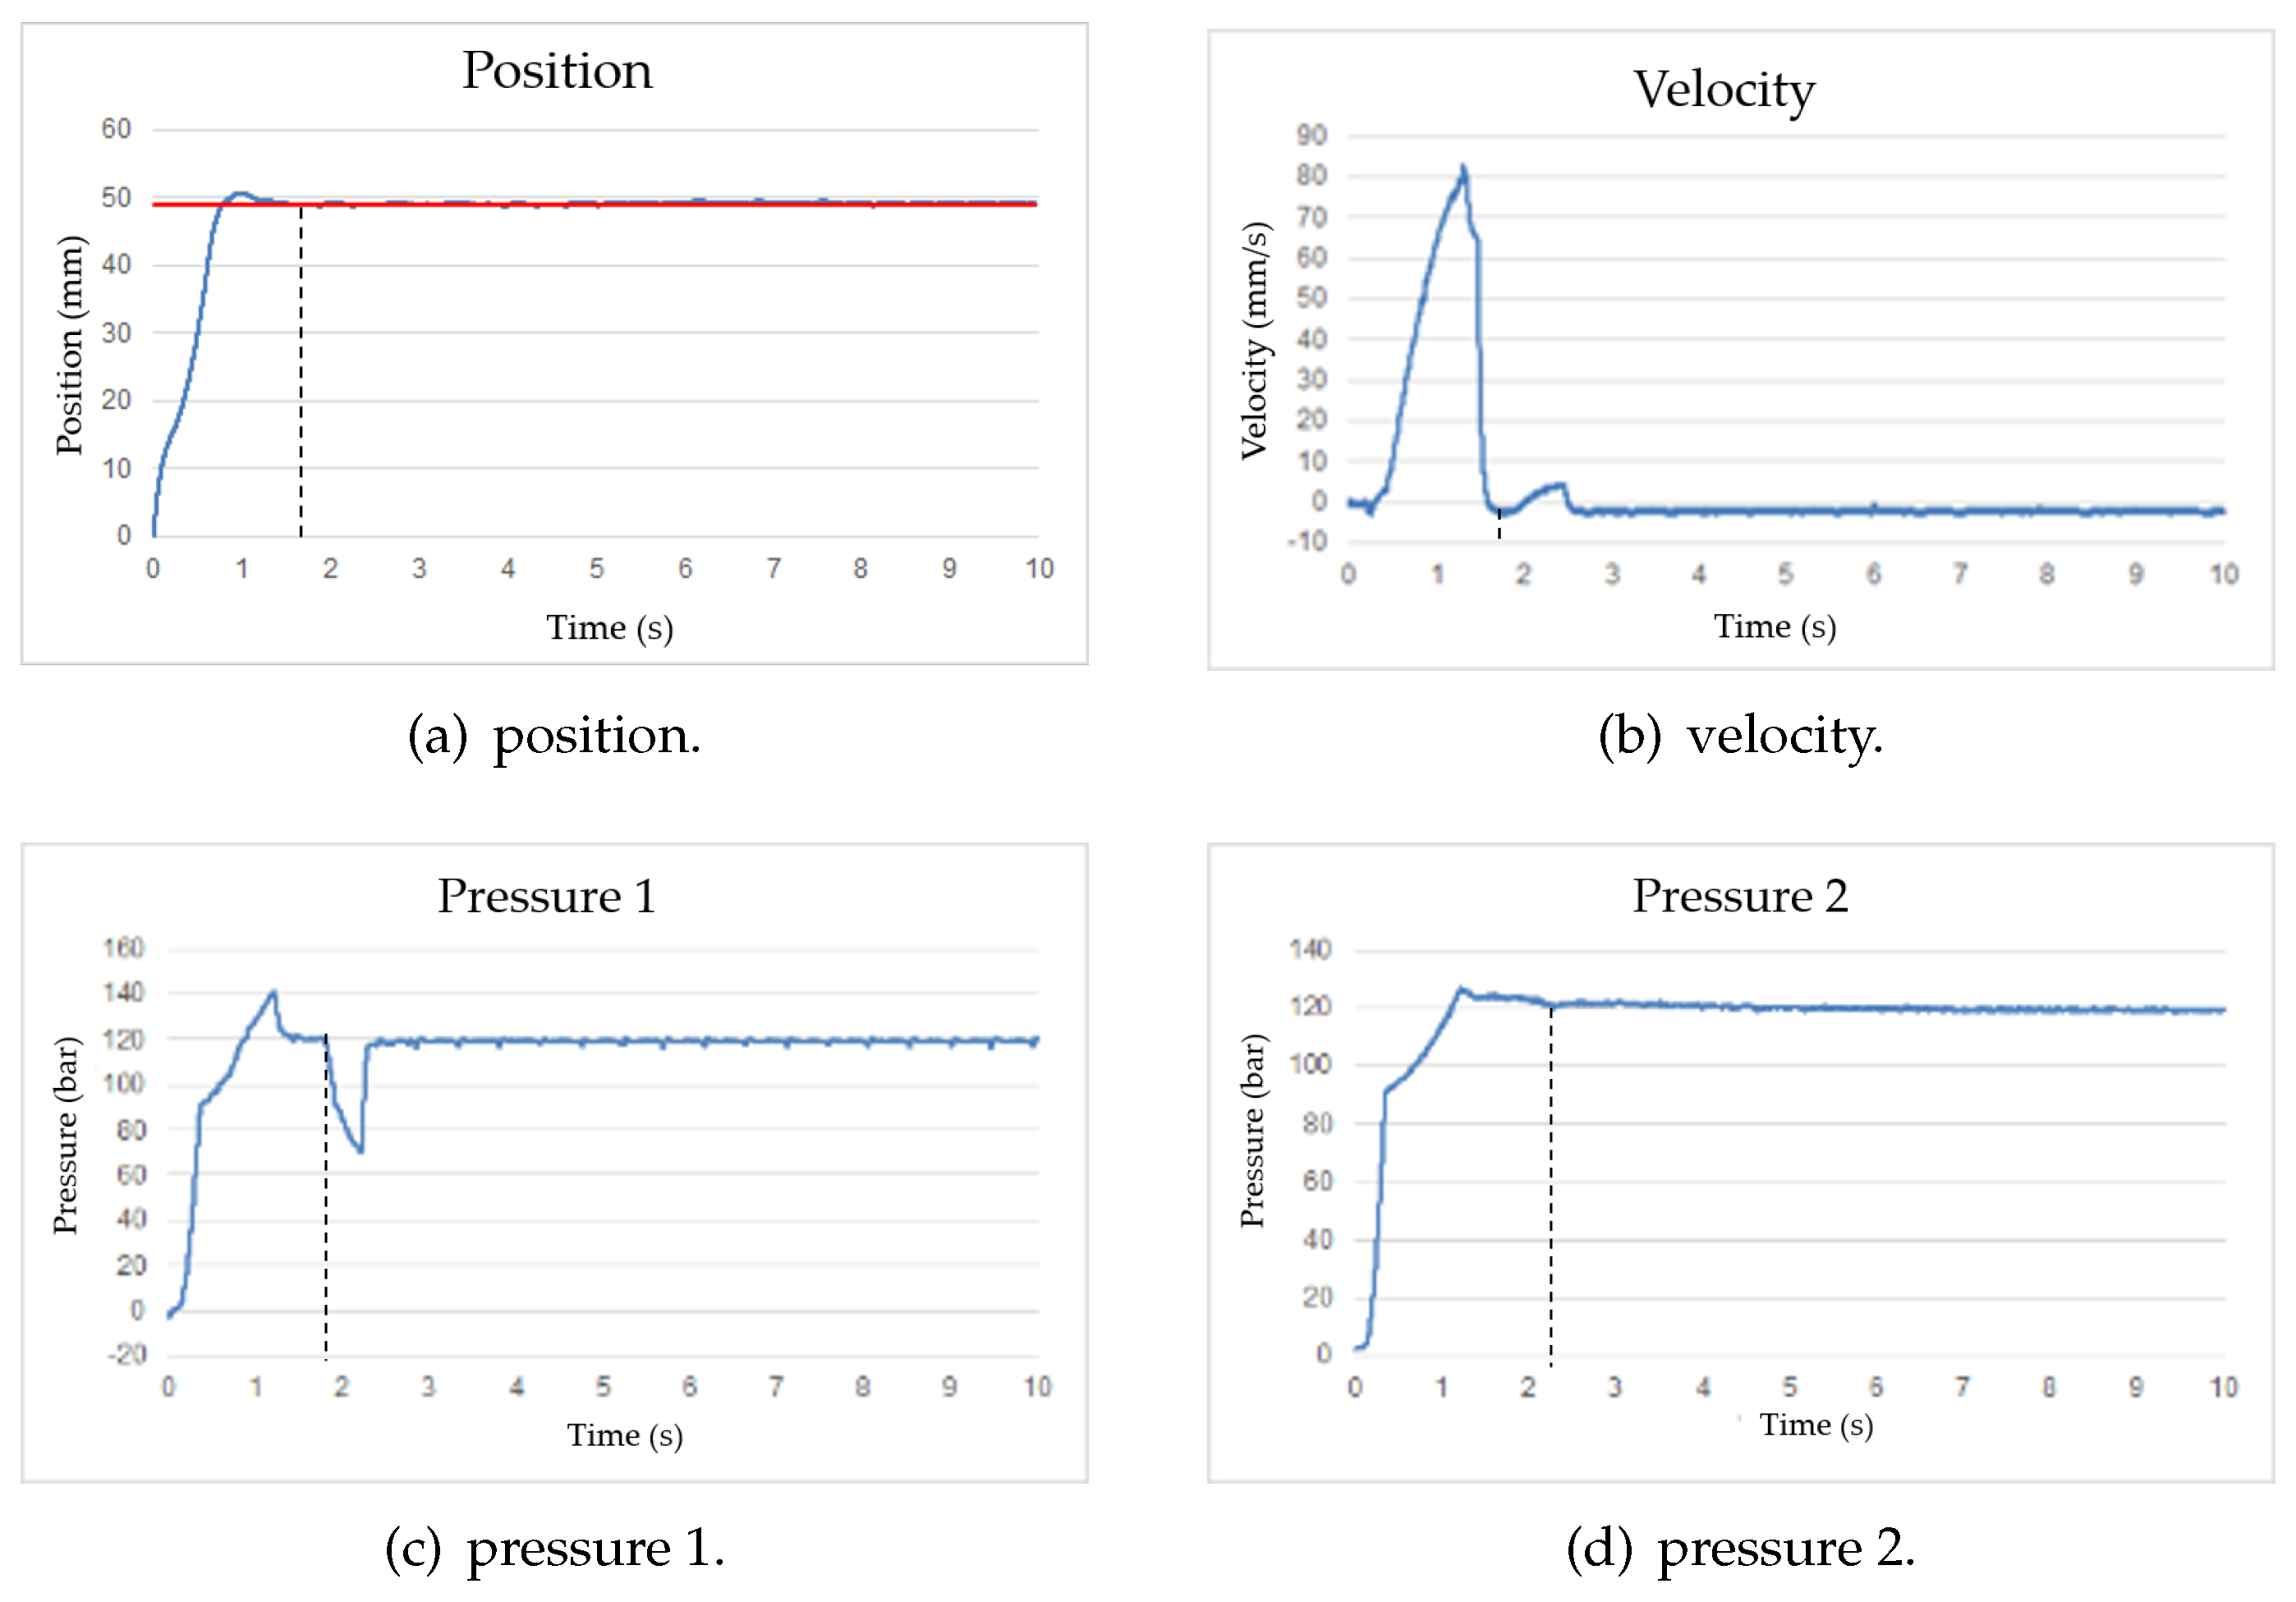
- Position: the position of the cylinder away from the B side.
- Pressure_1: the pressure value at the pump outlet.
- Pressure_2: the pressure value at the hydraulic cylinder.
- Sampling frequency: 500 HzWhen the hydraulic cylinder reached the target V–P switchover position in the velocity-control mode, it was pulled back through a distance of 2 mm, and the system then switched to the pressure-control mode to execute the packing stage. Note that the pull-back distance (2 mm) was set as the minimum value possible under a sampling frequency of 500 Hz. The corresponding experimental targets are shown in Table 3 for V–P switchover positions (35mm, 50 mm and 65 mm).
- Sampling frequency: 1000 HzThe experimental procedure was the same as that described above and shown in Table 4, with the exception that the pull-back distance was set as 1 mm (i.e., the minimum attainable distance under a sampling frequency of 1000 Hz).
3. Results
Results of Multi-Target Positions, Single Target Speed, and Single Target Pressure Control Experiments
4. Discussion
5. Conclusions
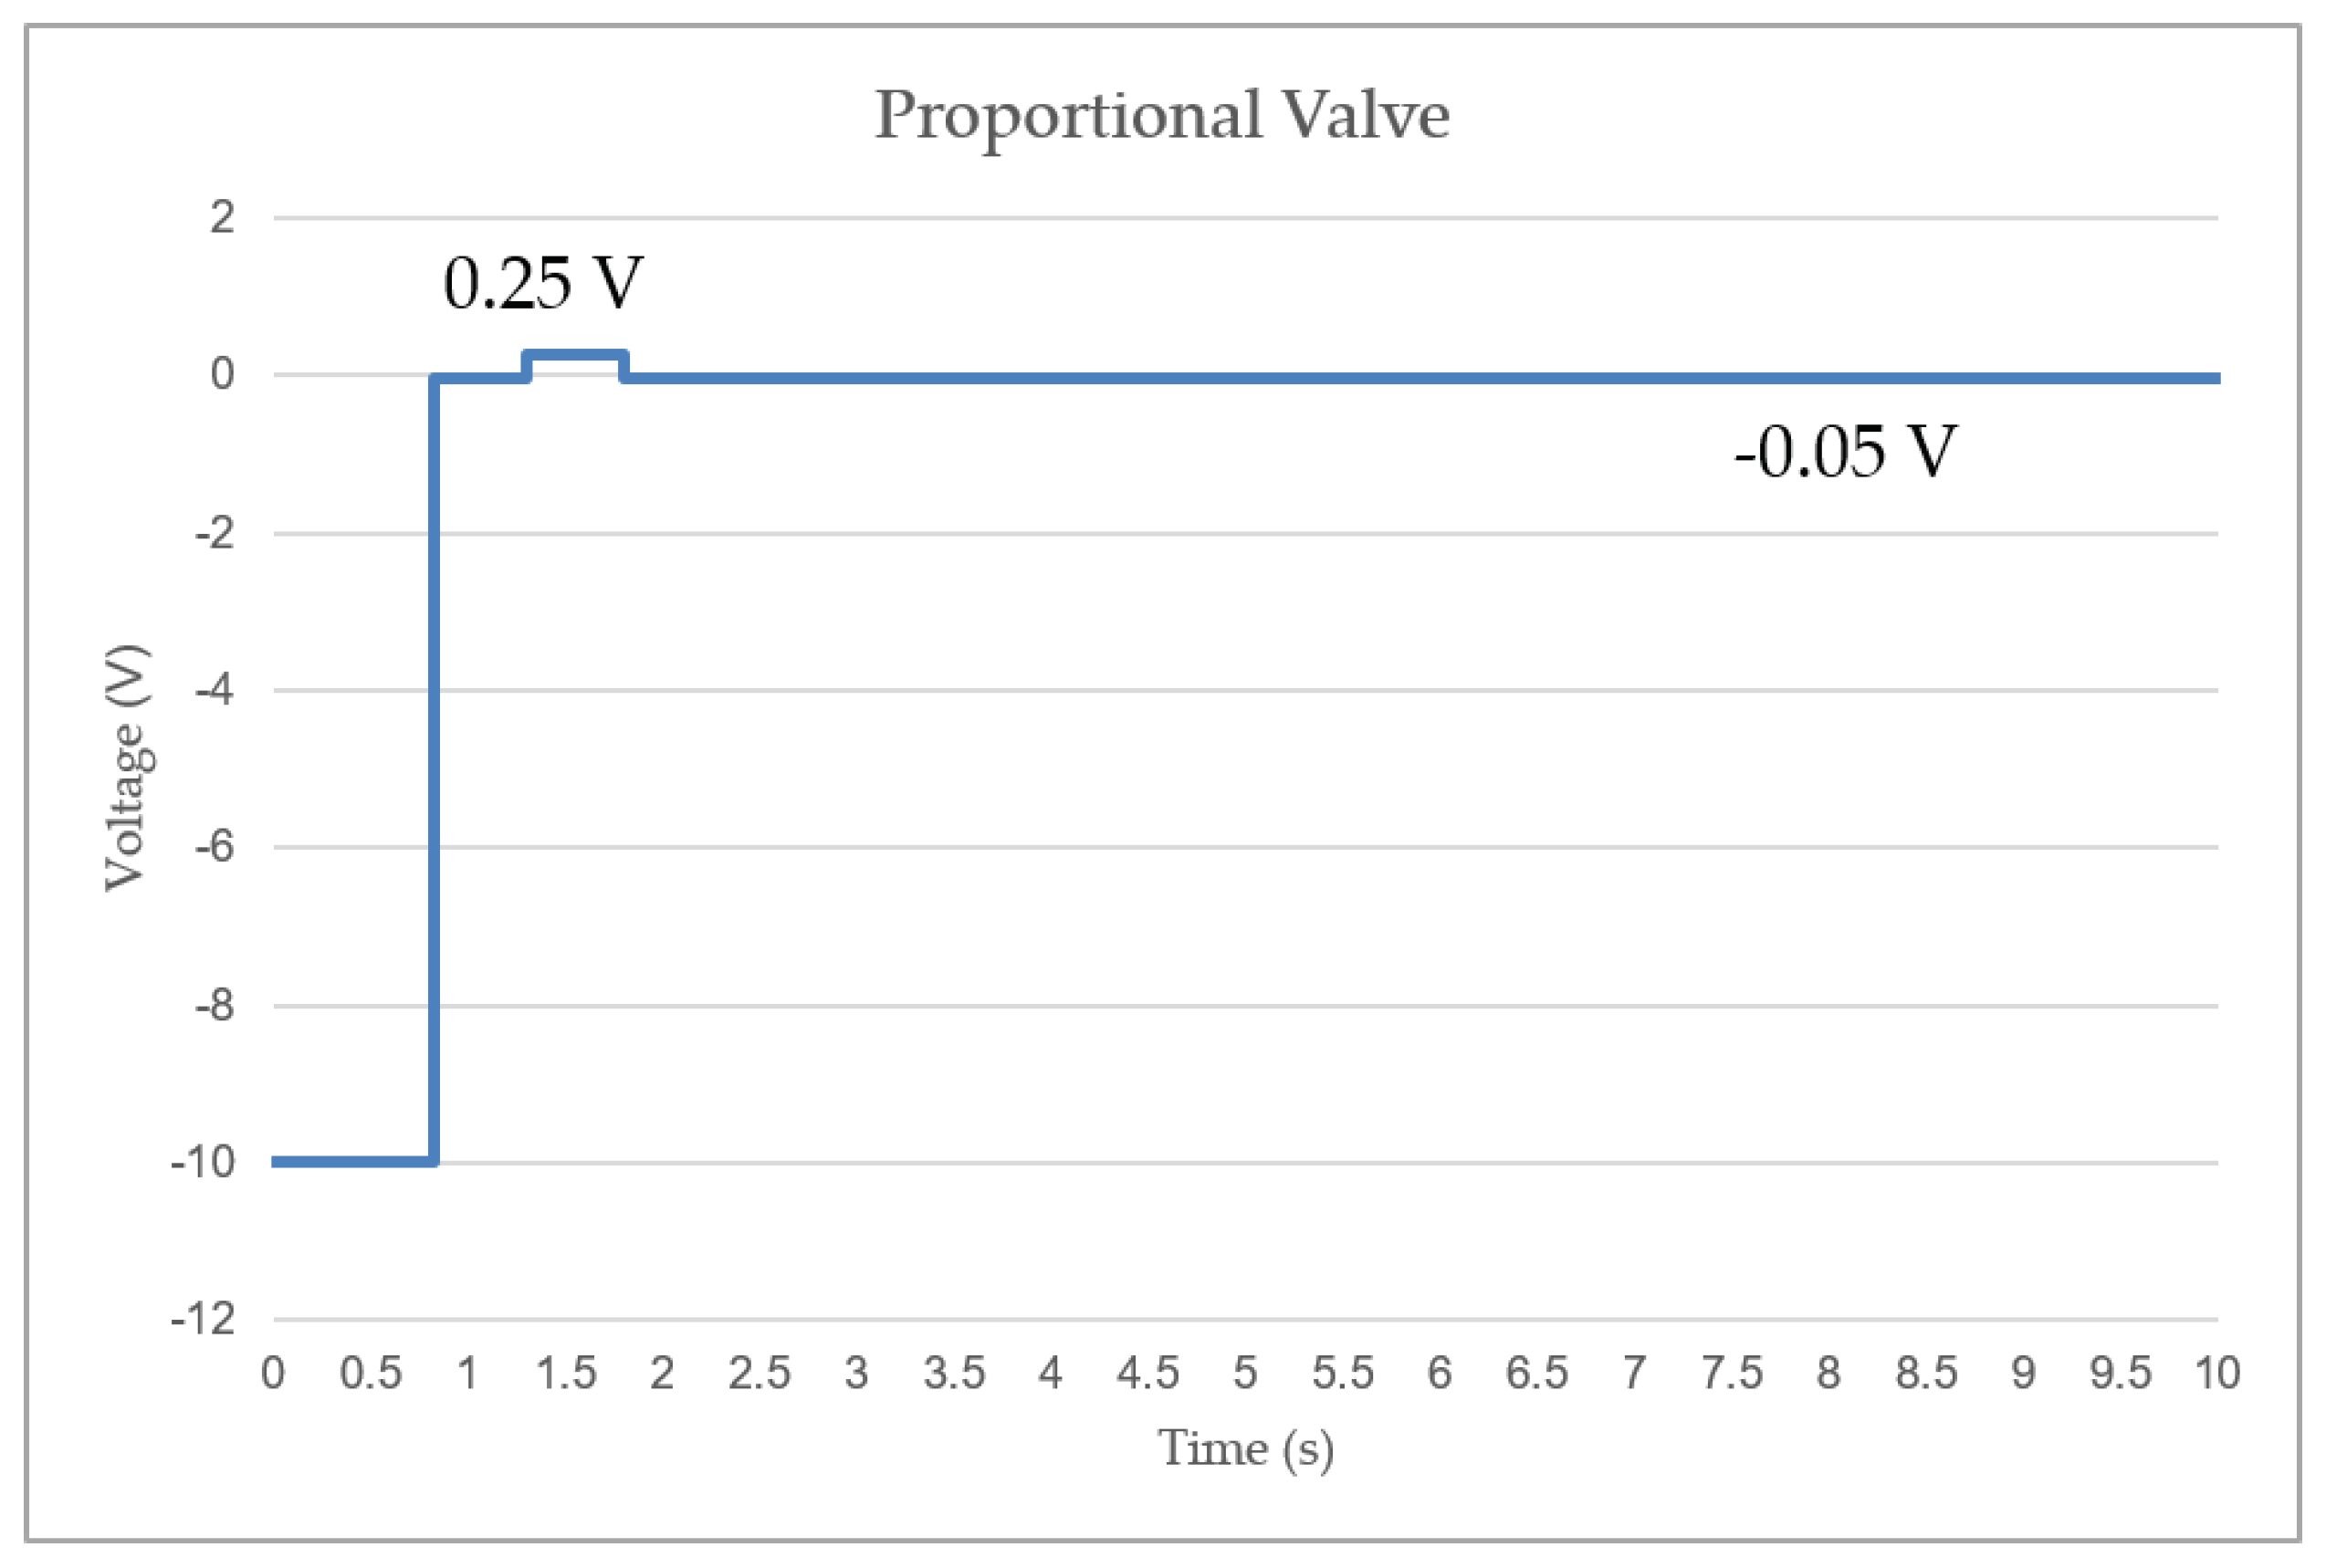
- The proposed PID controller successfully detects the designed V–P switchover point and switches from the constant-velocity mode to a constant-pressure mode accordingly with the servo proportional valve. The opening size of the valve should be carefully designed to accomplish the pull-back motion.
- The response time and the pressure overshoot at the cylinder rise as the target pressure increases. In the study of Chen et al. [14], performances of the PID controller and self-tuning fuzzy PID controller have been compared. By introducing the self-tuning fuzzy PID controller in the system can improve the response time, pressure RMSD and pressure overshoot.
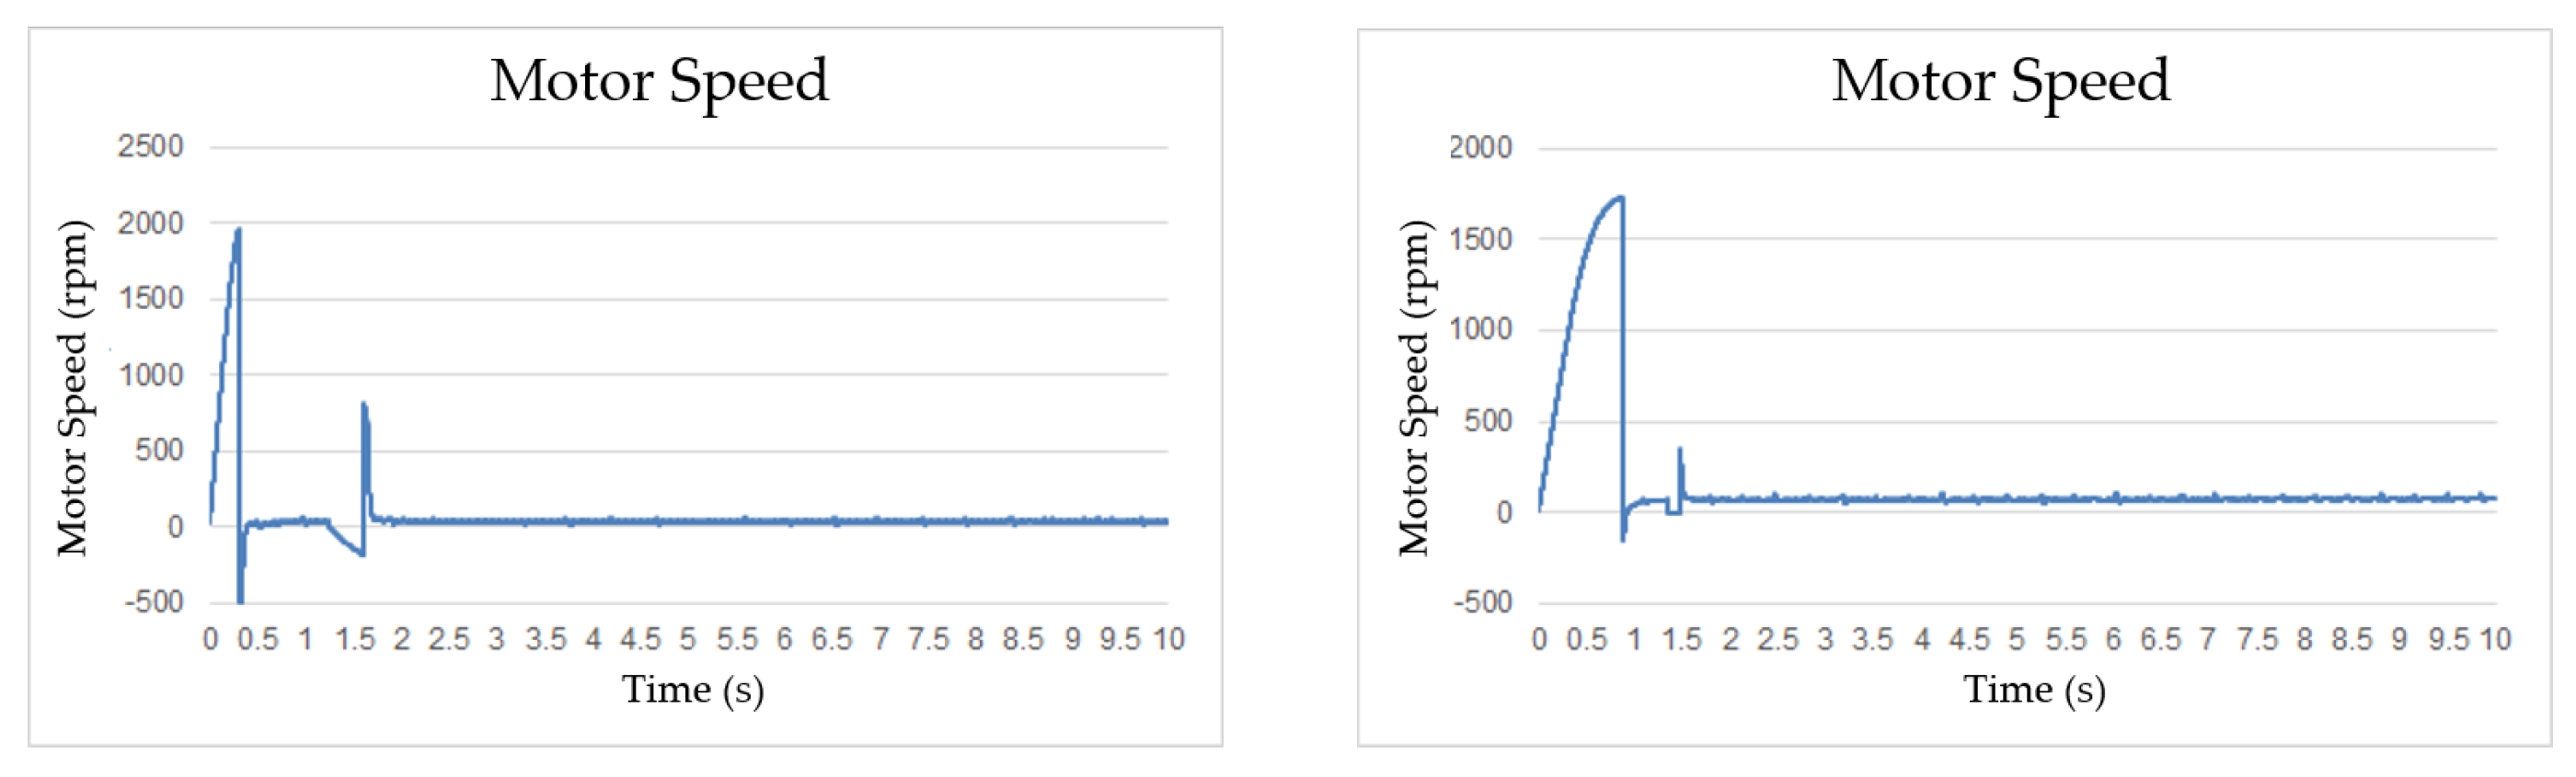
- When the sampling frequency is set as 1000 Hz, the system achieves all of the displacement, velocity, and pressure performance targets with the exception of the maximum overshoot of the pump outlet pressure in performing V–P switchover.
- In practical applications, the optimal pull-back distance of the cylinder prior to the packing stage depends not only on machine performance but also on polymer resin properties, and quality requirements of the product, etc. In general, the position control accuracy of servo–hydraulic systems depends on the sampling rate. For the system developed in the present study, a pull-back distance of 1 mm can be achieved using a sampling frequency of 1000 Hz.
Author Contributions
Funding
Acknowledgments
Conflicts of Interest
References
- Chen, P.C. Study on the Response Time for a Super High Speed Servo-Hydraulic System and Components. Master’s Thesis, Chung Yuan Christian University, Taoyuan City, Taiwan, 2003. [Google Scholar]
- Chiang, M.H.; Chen, C.C.; Kuo, C.F.J. The high response and high efficiency velocity control of a hydraulic injection molding machine using a variable rotational speed electro-hydraulic pump-controlled system. Int. J. Adv. Manuf. Technol. 2009, 43, 841–851. [Google Scholar] [CrossRef]
- Long, Q. Current State, Problems and the Innovative Solution of Electro-hydraulic Technology of Pump Controlled Cylinde. Chin. J. Mech. Eng. 2008, 44, 87–92. [Google Scholar]
- Tseng, C.J. Modulized Real-time Control Technology for Injection Molding Machines. Ph.D. Thesis, National Sun Yat-sen University, Kaohsiung, Taiwan, 2000. [Google Scholar]
- Lin, S.L. Injection Molding of Plastic; Publishing House of Mechanical Technology: Taipei, Taiwan, 1990. [Google Scholar]
- Tsai, C.C.; Kao, H.E.; Hsieh, S.M.; Lin, S.C. Modeling and Gain-scheduling PI Injection Velocity Control of an Ultra-high-speed Plastic Injection Molding Machine. J. Technol. 2006, 21, 317–328. [Google Scholar]
- Cheng, P.C. A Study of High Precision Servo Position Control of Hydraulic System under Low Speed. Master’s Thesis, National Cheng Kung University, Tainan, Taiwan, 2003. [Google Scholar]
- Lai, J.Y.; Chen, Y.R. Adaptive flow rate control of a hydraulic proportional valve. JSME Int. J. 1992, 35, 582–590. [Google Scholar] [CrossRef]
- Yang, Y.; Gao, F. Adaptive control of the filling velocity of thermoplastics injection molding. Control Eng. Pract. 2000, 8, 1285–1296. [Google Scholar] [CrossRef]
- Bader, C.; Greco, L. Process for Determining the Changeover Point When Producing Plastic Injection Mouldings and Die-Castings. U.S. Patent 5,665,283, 9 September 1997. [Google Scholar]
- Chen, Y.S.; Wu, K.T.; Tsai, M.H.; Hwang, S.J.; Lee, H.H.; Peng, H.S.; Chu, H.Y. Adaptive process control of the changeover point for injection molding process. J. Low Freq. Noise Vib. Active Control 2019. [Google Scholar] [CrossRef]
- Schiffers, I.R. Adaptive process control for stabilizing the production process in injection moulding machines. In Proceedings of the 10th International Fluid Power Conference (10. IFK), Dresden, Germany, 8–10 March 2016. [Google Scholar]
- Kamiguchi, M.; Umemoto, H. Suckback Method and Apparatus in an Injection Molding Machine. U.S. Patent 4,812,268, 14 March 1989. [Google Scholar]
- Chen, C.J.; Wu, K.T.; Hwang, S.J. Development of a servo-hydraulic system with a self-tuning fuzzy PID controller to simulate injection molding process. In Microsystem Technologies; Springer: Berlin/Heidelberg, Germany, 2018; pp. 1–22. [Google Scholar]


| Components | Specifications |
|---|---|
| Hydraulic cylinder | Diameter: 100 mm |
| Max. of stroke: 170 mm | |
| Max. working pressure: 140 bar | |
| Servo proportional valve | Max. flow rate: 90 L/min |
| Max. working pressure: 350 bar | |
| Step response: 3.5 ms | |
| Micro control unit | OS: Linux kernel 2.6.33 |
| Position transducer | Resolution (Analog): 12 bit |
| Performance Indicators | Targets |
|---|---|
| Pressure at the hydraulic cylinder | Max. overshoot less than 5 bar |
| RMSD less than 1 bar | |
| Cylinder position | Max. overshoot less than 1 mm |
| RMSD less than 0.5 mm | |
| Response time | less than 3 s |
| Average speed of the motor | less than 50 rpm |
| Target Position (mm) | Target Velocity (mm/s) | Target Pressure (bar) |
|---|---|---|
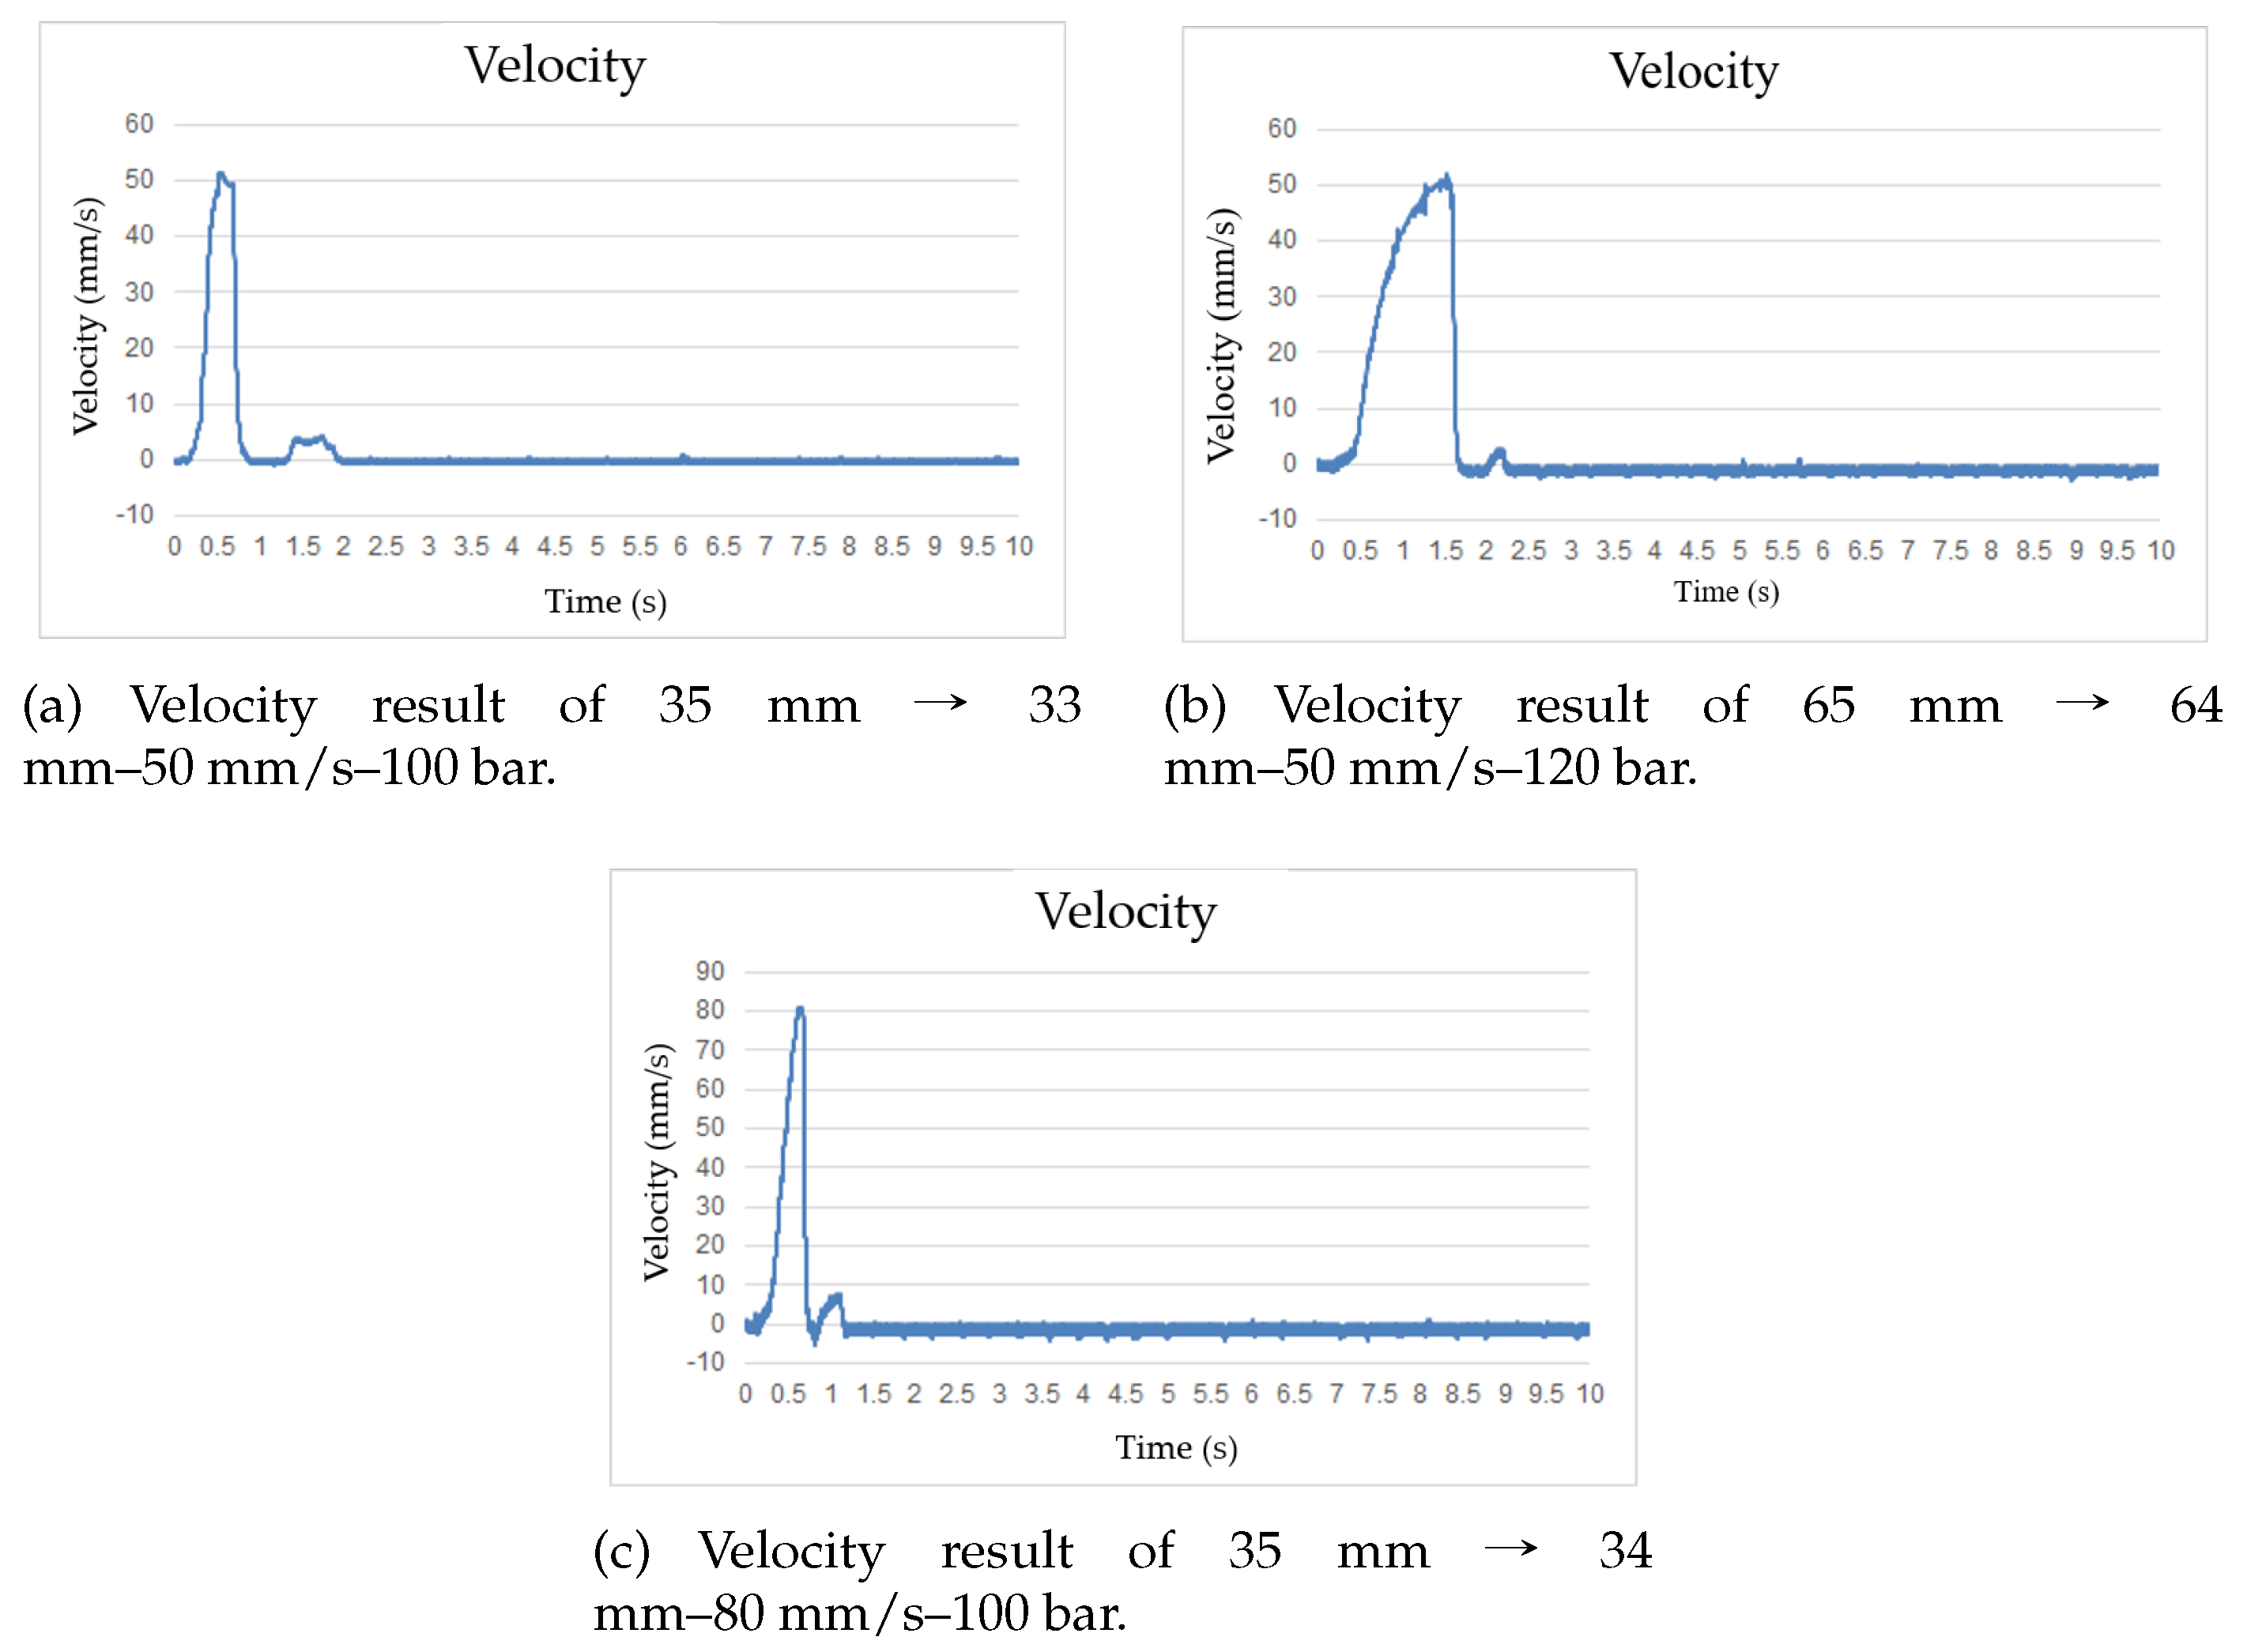
| 35 → 33 | 50–80 | 100 |
| 50 → 48 | 50–80 | 110 |
| 65 → 63 | 50–80 | 120 |
| Target Position (mm) | Target Velocity (mm/s) | Target Pressure (bar) |
|---|---|---|
| 35 → 34 | 50–80 | 100 |
| 50 → 49 | 50–80 | 110 |
| 65 → 64 | 50–80 | 120 |
| Velocity (mm/s) | Response Time (s) | Position (mm) | Pressure 1 (bar) | Pressure 2 (bar) | Motor Speed (rpm) | |||
|---|---|---|---|---|---|---|---|---|
| Overshoot | RMSD | Overshoot | RMSD | Overshoot | RMSD | |||
| 50 | 1.64 | 0.17 | 0.1 | 28.29 | 0.85 | 4.82 | 0.55 | 39.7 |
| 60 | 1.6 | 0.1 | 0.26 | 38.23 | 0.8 | 4.87 | 0.63 | 40.85 |
| 70 | 1.55 | 0.14 | 0.16 | 52.95 | 0.77 | 4.8 | 0.95 | 38.71 |
| 80 | 1.45 | 0.6 | 0.29 | 70.7 | 0.85 | 4.7 | 0.34 | 38.28 |
| Velocity (mm/s) | Response Time (s) | Position (mm) | Pressure 1 (bar) | Pressure 2 (bar) | Motor Speed (rpm) | |||
|---|---|---|---|---|---|---|---|---|
| Overshoot | RMSD | Overshoot | RMSD | Overshoot | RMSD | |||
| 50 | 1.39 | 0.15 | 0.27 | 5.22 | 0.69 | 4.6 | 0.48 | 45.7 |
| 60 | 1.21 | 0.23 | 0.13 | 7.19 | 0.7 | 4.9 | 0.36 | 43.85 |
| 70 | 1.18 | 0.43 | 0.14 | 10.04 | 0.95 | 3.79 | 0.81 | 48.71 |
| 80 | 1.08 | 0.59 | 0.16 | 14.76 | 0.84 | 3.7 | 0.56 | 45.28 |
| Velocity (mm/s) | Response Time (s) | Position (mm) | Pressure 1 (bar) | Pressure 2 (bar) | Motor Speed (rpm) | |||
|---|---|---|---|---|---|---|---|---|
| Overshoot | RMSD | Overshoot | RMSD | Overshoo | RMSD | |||
| 50 | 1.99 | 0.18 | 0.1 | 26.3 | 0.82 | 4.8 | 0.49 | 41.52 |
| 60 | 1.89 | 0.5 | 0.4 | 38.26 | 0.78 | 5.9 | 0.77 | 42.69 |
| 70 | 1.85 | 0.24 | 0.15 | 50.95 | 0.75 | 5.56 | 0.46 | 42.91 |
| 80 | 1.8 | 0.7 | 0.59 | 60.38 | 0.83 | 4.91 | 0.28 | 43.79 |
| Velocity (mm/s) | Response Time (s) | Position (mm) | Pressure 1 (bar) | Pressure 2 (bar) | Motor Speed (rpm) | |||
|---|---|---|---|---|---|---|---|---|
| Overshoot | RMSD | Overshoot | RMSD | Overshoot | RMSD | |||
| 50 | 1.6 | 0.31 | 0.11 | 9.79 | 0.65 | 4.8 | 0.3 | 43.52 |
| 60 | 1.45 | 0.63 | 0.28 | 12.28 | 0.64 | 4.2 | 0.5 | 42.69 |
| 70 | 1.24 | 0.53 | 0.28 | 19.13 | 0.69 | 4.95 | 0.41 | 45.91 |
| 80 | 1.19 | 0.5 | 0.26 | 26.4 | 0.61 | 4.8 | 0.6 | 46.79 |
| Velocity (mm/s) | Response Time (s) | Position (mm) | Pressure 1 (bar) | Pressure 2 (bar) | Motor Speed (rpm) | |||
|---|---|---|---|---|---|---|---|---|
| Overshoot | RMSD | Overshoot | RMSD | Overshoot | RMSD | |||
| 50 | 3.13 | 0.15 | 0.2 | 9.21 | 0.65 | 6.0 | 0.72 | 47.58 |
| 60 | 2.75 | 0.25 | 0.15 | 14.21 | 0.83 | 7.3 | 0.48 | 48.38 |
| 70 | 2.65 | 0.3 | 0.54 | 17.7 | 0.75 | 7.35 | 0.49 | 49.05 |
| 80 | 2.45 | 0.22 | 0.21 | 21.79 | 0.95 | 6.99 | 0.45 | 49.86 |
| Velocity (mm/s) | Response Time (s) | Position (mm) | Pressure 1 (bar) | Pressure 2 (bar) | Motor Speed (rpm) | |||
|---|---|---|---|---|---|---|---|---|
| Overshoot | RMSD | Overshoot | RMSD | Overshoot | RMSD | |||
| 50 | 2.15 | 0.26 | 0.14 | 7.87 | 0.83 | 4.2 | 0.85 | 46.58 |
| 60 | 1.78 | 0.3 | 0.33 | 11.36 | 0.92 | 4.2 | 0.78 | 46.38 |
| 70 | 1.63 | 0.09 | 0.31 | 15.94 | 0.88 | 4.8 | 0.79 | 47.05 |
| 80 | 1.56 | 0.33 | 0.21 | 20.01 | 0.85 | 4.93 | 0.65 | 47.86 |
© 2019 by the authors. Licensee MDPI, Basel, Switzerland. This article is an open access article distributed under the terms and conditions of the Creative Commons Attribution (CC BY) license (http://creativecommons.org/licenses/by/4.0/).
Share and Cite
Lin, C.-Y.; Shen, F.-C.; Wu, K.-T.; Lee, H.-H.; Hwang, S.-J. Injection Molding Process Control of Servo–Hydraulic System. Appl. Sci. 2020, 10, 71. https://doi.org/10.3390/app10010071
Lin C-Y, Shen F-C, Wu K-T, Lee H-H, Hwang S-J. Injection Molding Process Control of Servo–Hydraulic System. Applied Sciences. 2020; 10(1):71. https://doi.org/10.3390/app10010071
Chicago/Turabian StyleLin, Chun-Ying, Fang-Cheng Shen, Kuo-Tsai Wu, Huei-Huang Lee, and Sheng-Jye Hwang. 2020. "Injection Molding Process Control of Servo–Hydraulic System" Applied Sciences 10, no. 1: 71. https://doi.org/10.3390/app10010071
APA StyleLin, C.-Y., Shen, F.-C., Wu, K.-T., Lee, H.-H., & Hwang, S.-J. (2020). Injection Molding Process Control of Servo–Hydraulic System. Applied Sciences, 10(1), 71. https://doi.org/10.3390/app10010071