Article

Comparison of Tensile and Fatigue Properties of Copper Thin Film Depending on Process Method

1
School of Mechanical Engineering, Pusan National University, 2, Busandaehak-ro 63beon-gil, Geumjeong-gu, Busan 46241, Korea
2
Department of Mechanical and Automotive Engineering, Kyungsung University, 309, Suyeong-ro, Nam-gu, Busan 48434, Korea
*
Authors to whom correspondence should be addressed.
Appl. Sci. 2020, 10(1), 388; https://doi.org/10.3390/app10010388
Submission received: 2 December 2019 / Revised: 27 December 2019 / Accepted: 2 January 2020 / Published: 4 January 2020
(This article belongs to the Special Issue Selected Papers from the ICMR 2019)

Abstract

:
In this study, tensile and fatigue tests were performed and analyzed to evaluate an influence of fabrication method on mechanical characteristics of copper thin film which widely used in flexible printed circuit board (FPCB). In general, manufacturing methods are known to affect the mechanical properties of materials, especially for thin films. The copper thin film is manufactured by a rolling process or an electrodeposition process. Therefore, specimen for tensile and fatigue tests were fabricated using by etching process with the rolled and electrodeposited thin films. First, the tensile tests were performed to obtain the elastic modulus, 0.2% offset yield stress, and tensile strength of the rolled copper and the electrodeposited copper thin film. Second, the copper thin films in FPCB is most often subjected to mechanical or/and thermal cyclic loading. The fatigue tests were performed to compare the fatigue characteristics and to evaluate an influence of fabrication method. Tensile test results showed that the elastic modulus was similar for each process, but the 0.2% yield strength and ultimate tensile strength were greater in the rolling process. In addition, the fatigue test results show that the copper thin films by the rolling process are better than by the electrodeposition process in fatigue life in all region.

1. Introduction

Modern electronic devices are required to be thin, lightweight, and functionally sophisticated. Therefore, flexible printed circuit boards(FPCBs) can be used as alternatives to rigid printed circuit board (PCB) in certain applications because of its excellent flexibility, twistability, and light weight. FPCB facilitates a space-efficient system design, reduces size and weight, improves the internal appearance of a system, and offers low-cost installation. Over the years, FPCBs were widely used in numerous electronic devices such as smartphones and LCDs [1,2]. Therefore, FPCB has become one of the important parts for securing the reliability of electronic products.
FPCB is constructed from polyester or polyimide film and copper film. In particular, one of the roles of the FPCB is to make electricity flow well. FPCB breaks down due to heat generated by joule heating and mechanical fatigue loads at the joints. The reliability of electronic device using FPCB is strongly dependent on the fatigue characteristics of materials used such as copper.
It is well known that tensile and/or fatigue properties of such thin films are not the same as those of bulk materials and that they could strongly depend on the size [3,4,5,6,7]. In general, manufacturing methods are known to affect the mechanical properties of materials, especially for thin films [8,9]. Thus, it is essential to perform mechanical (tensile and fatigue) tests to obtain relevant mechanical properties [10,11]. Therefore, authors reported the tensile and fatigue characteristics of the film the copper film coated by Sn used in electronic devices such as LCD. The copper film was fabricated by electro-plating on polyimide tape and then pure Sn was coated by electroless plating to prevent oxidization of copper film. Finally, by a diffusion process, the film was treated by heating. Some smooth specimens for the tests were fabricated by an etching process and to make a free standing specimen, the polyimide tape was etched. The tensile tests for the film were performed at a displacement rate of 100 μm/min. The high cycle fatigue tests were performed with 20 Hz frequency, in ambient environment and two level mean stresses. The tester used in the test was closed-loop feedback controlled.
In this study, the tensile and high cycle fatigue tests for copper thin film, especially used in FPCB were performed using the test machine developed by authors. The copper films were produced by the rolling process and the electrodeposited process. The copper film was attached on UV film for handing. Smooth specimens for the tests were fabricated by an etching process and to make a free standing specimen, the UV film was peeled off with acetone. The tensile tests for the film were performed at a displacement rate of 50 μm/min. The high cycle fatigue tests were performed with 3 Hz frequency in ambient environment at R = 0.1. The tester used in the test was closed-loop feedback controlled. To analyze the influence of the fabrication, the test results were compared and, especially with the test results of copper thin films fabricated by completely different processes published by the authors [12].

2. Experimental Setup

2.1. The Shape of the Copper Thin Film Specimen

To compare the tensile and fatigue properties of the copper thin film, the specimens are fabricated according to the rolled and electrodeposited process methods. In addition, the shape of specimens is designed differently depending on the tensile and/or fatigue.
First, as shown in Figure 1a, the specimen used for the tensile test is designed in dog-bone type. The total length is 17,500 μm and the reduced section is designed to be 5000 μm in length and 700 μm in width. There are holes with a diameter of 850 μm in the specimen fixed part and the distance between the holes is 13,500 μm. The role of the hole is to fix the specimen by inserting a pin when fixing the specimen. Second, as shown in Figure 1b, the specimen used for fatigue testing is designed in hour-glass type. The total length is 17,500 μm, the reduced section has an arc of radius 22,470 μm, and the width of reduced section is 700 μm. The specimen of tensile and fatigue have all 12 μm thicknesses.
Because the material properties of thin film specimens are affected by the microstructural differences, we performed surface microstructure analysis and material component analysis by using SEM (Scanning Electron Microscope) as shown in Figure 2 and Figure 3, respectively.
Figure 2 shows the images of the front-side and back-side of the rolled and electrodeposited copper thin films included loading direction (LD), respectively. SEM images of the back-side of the specimen clearly show the difference between the rolled and electrodeposited copper. Rolled copper has an anisotropic characteristic due to the rolling process and forming a grain in a specific direction. The mechanical properties of the copper thin film in the rolling process depend on the rolling direction which is shown in SEM image as RD. In this study, the loading direction is transverse to the rolling direction. Generally, it is reported that the yield strength when the loading and rolling direction are in the transverse direction. However, the fracture strain is smaller than when the loading and rolling are in the same direction [13]. However, Zhang et al. reported that there is a little difference in elastic modulus between the rolling directions but the yield strength and ultimate tensile strength of the traverse direction are slightly smaller than the case of same direction from tests of copper thin film [2]. On the other hand, electrodeposited copper has an isotropic characteristic because it is and electro-plating method. For this reason, in particular, rolled copper require an analysis of the surface of the specimen before performing tensile and fatigue tests in order to obtain accurate material properties.

2.2. System Configuration

We organize a test machine for both the tensile and fatigue tests as shown in Figure 4. The test machine consists of a force-translator, a load measurement sensor such as a load cell, and a displacement measurement sensor. In addition, the test machine was equipped with a 12x zoom CCD for acquiring the surface image of specimen during the tensile or fatigue tests.
The voice-coil actuator is used as the force-translator. Since the voice-coil actuator can apply tension and compression, it is suitable for tensile test as well as fatigue test. The voice-coil actuator can be repeatedly loaded with an operational frequency of up to 10 Hz, with a peak force of 15.57 N and a continuous stall force of 5.07 N. Also, the stroke range is ± 3.18 mm when applying cyclic loading.
The load cell is used to measure the load. It can measure up to 10N and the resolution is 1 mN. A capacitive sensor, one of the non-contact displacement sensors, is used to measure the displacement of the specimen. The displacement sensor can measure up to 1250 μm with a resolution of 0.1 μm.
The specimen of thin film is difficult to handle when performing tensile and fatigue tests. The thin film may frequently be fractured before the experiment. In addition, it is difficult to align the specimen with loading direction. Therefore, in this study, the specimen is aligned and fixed as shown in Figure 5. For fixing and aligning the thin film, we designed the aluminum plates and the specimen is mounted with these plates to make the specimen easier to handle. In addition, to align the specimen, the holes in the same position on the aluminum plate and the tester are made and pins are fixed.
Figure 6 shows fracture image when the alignment is correct. The fracture occurs near the center of the reduced section at the specimen. Therefore, the results of testing are better when using a fixed jig of a thin film.

3. Tensile and Fatigue Test

3.1. Tensile Test and Mechanical Properties

The mechanical properties of the thin films, such as modulus of elasticity, yield strength and tensile strength, can be obtained from the stress-strain curve. To compare the mechanical properties of the copper thin film according to process method, we performed a repetitive test five times or more under the same conditions on each of the rolled copper and the electrodeposited copper specimens. In this test, the tensile rate was fixed at 50 μm/min (0.84 μm/s).
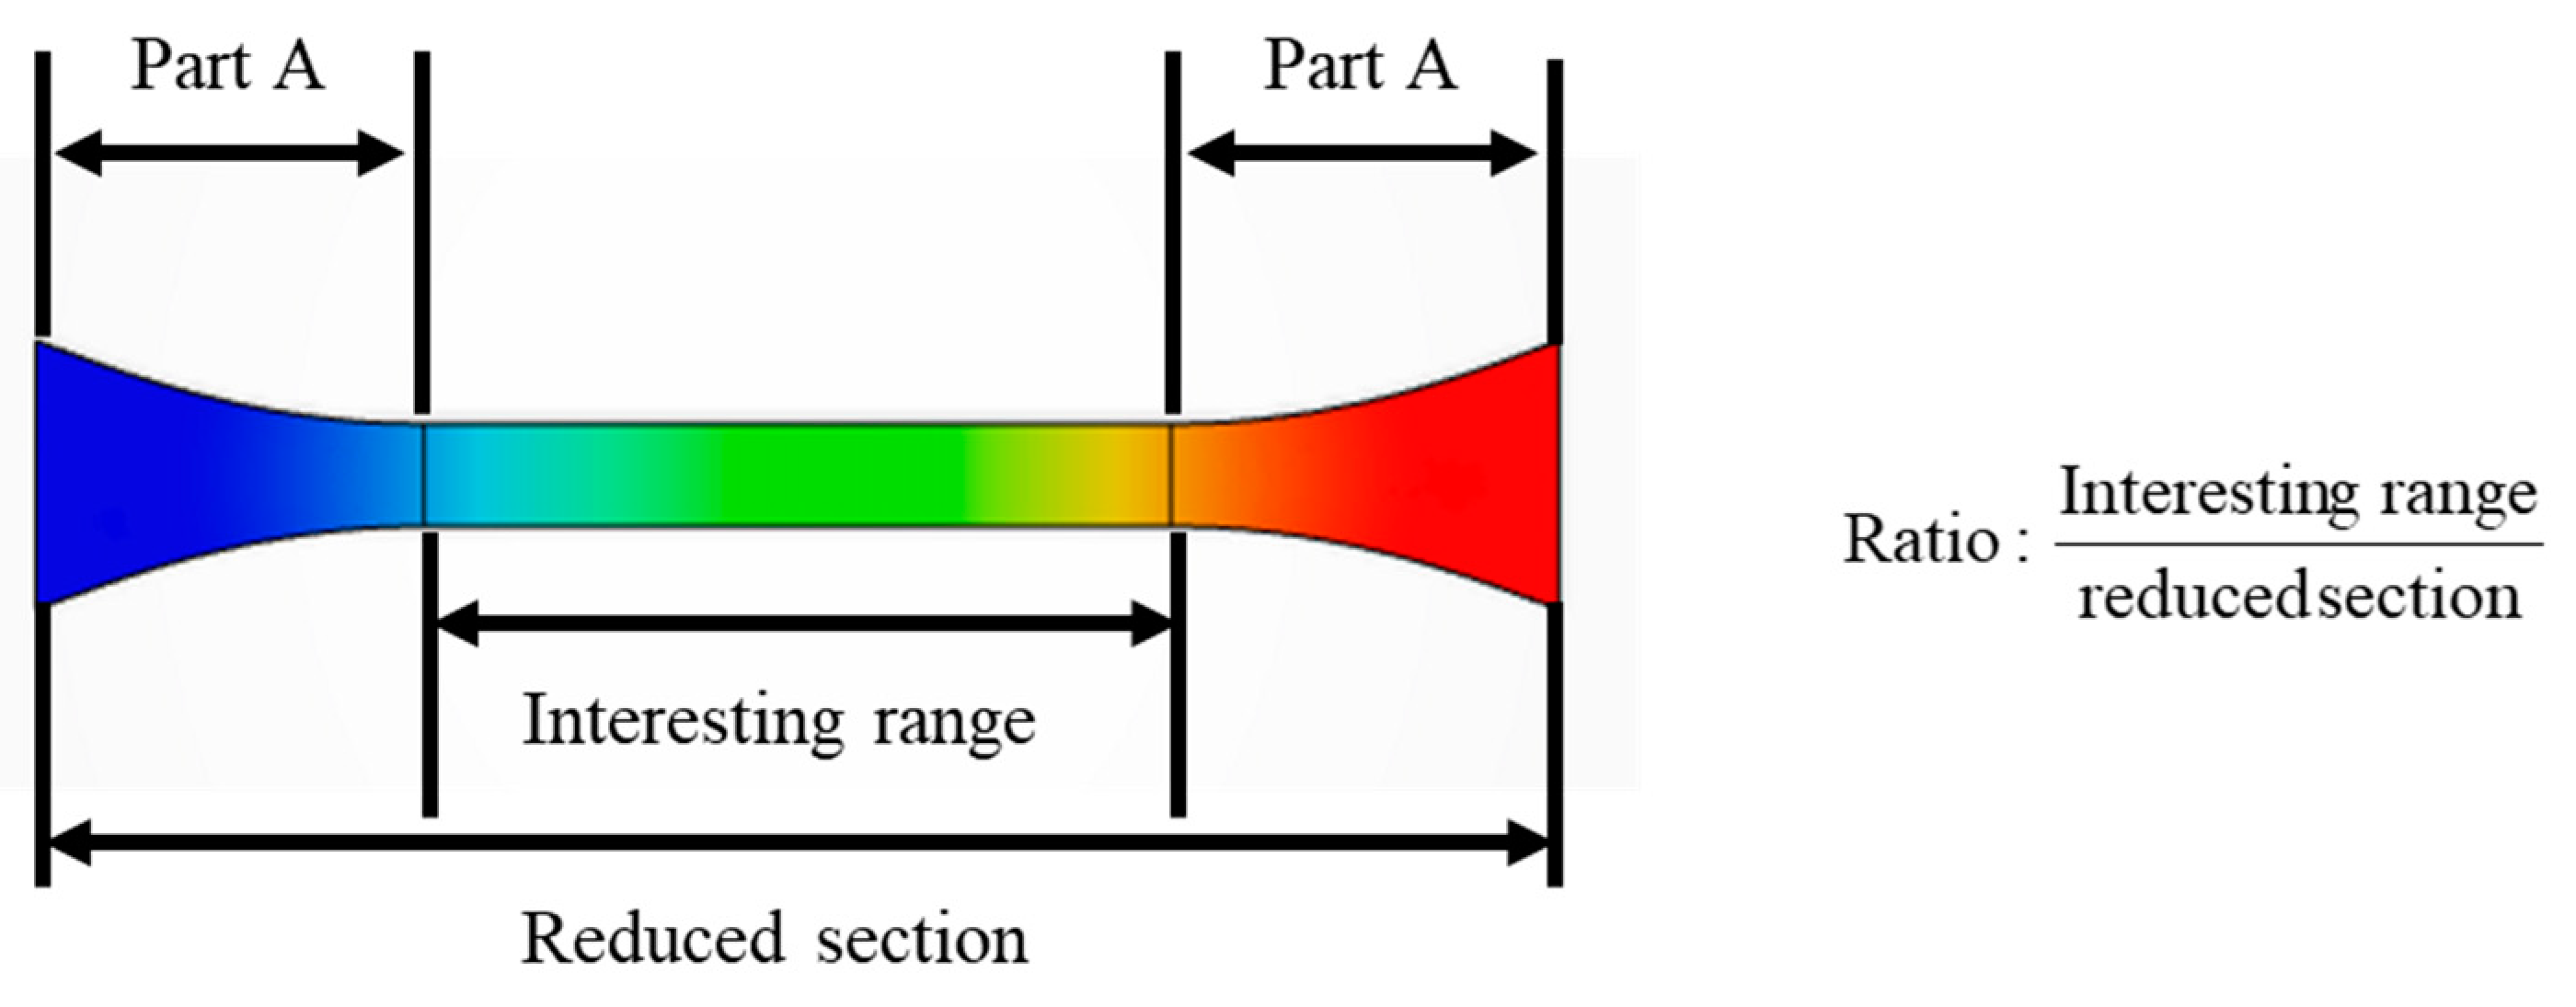
The thin film specimen has limitations in using attached sensors such as extensometers. Therefore, in this paper, we use a capacitance displacement sensor for measuring the displacement during the tensile test. To obtain the tensile properties accurately, it has to be measured the displacement of the interesting range in the specimen (5000 μm in Figure 1a). However, the capacitance displacement sensor can measure only the length of reduced section in the specimen (13,500 μm in 
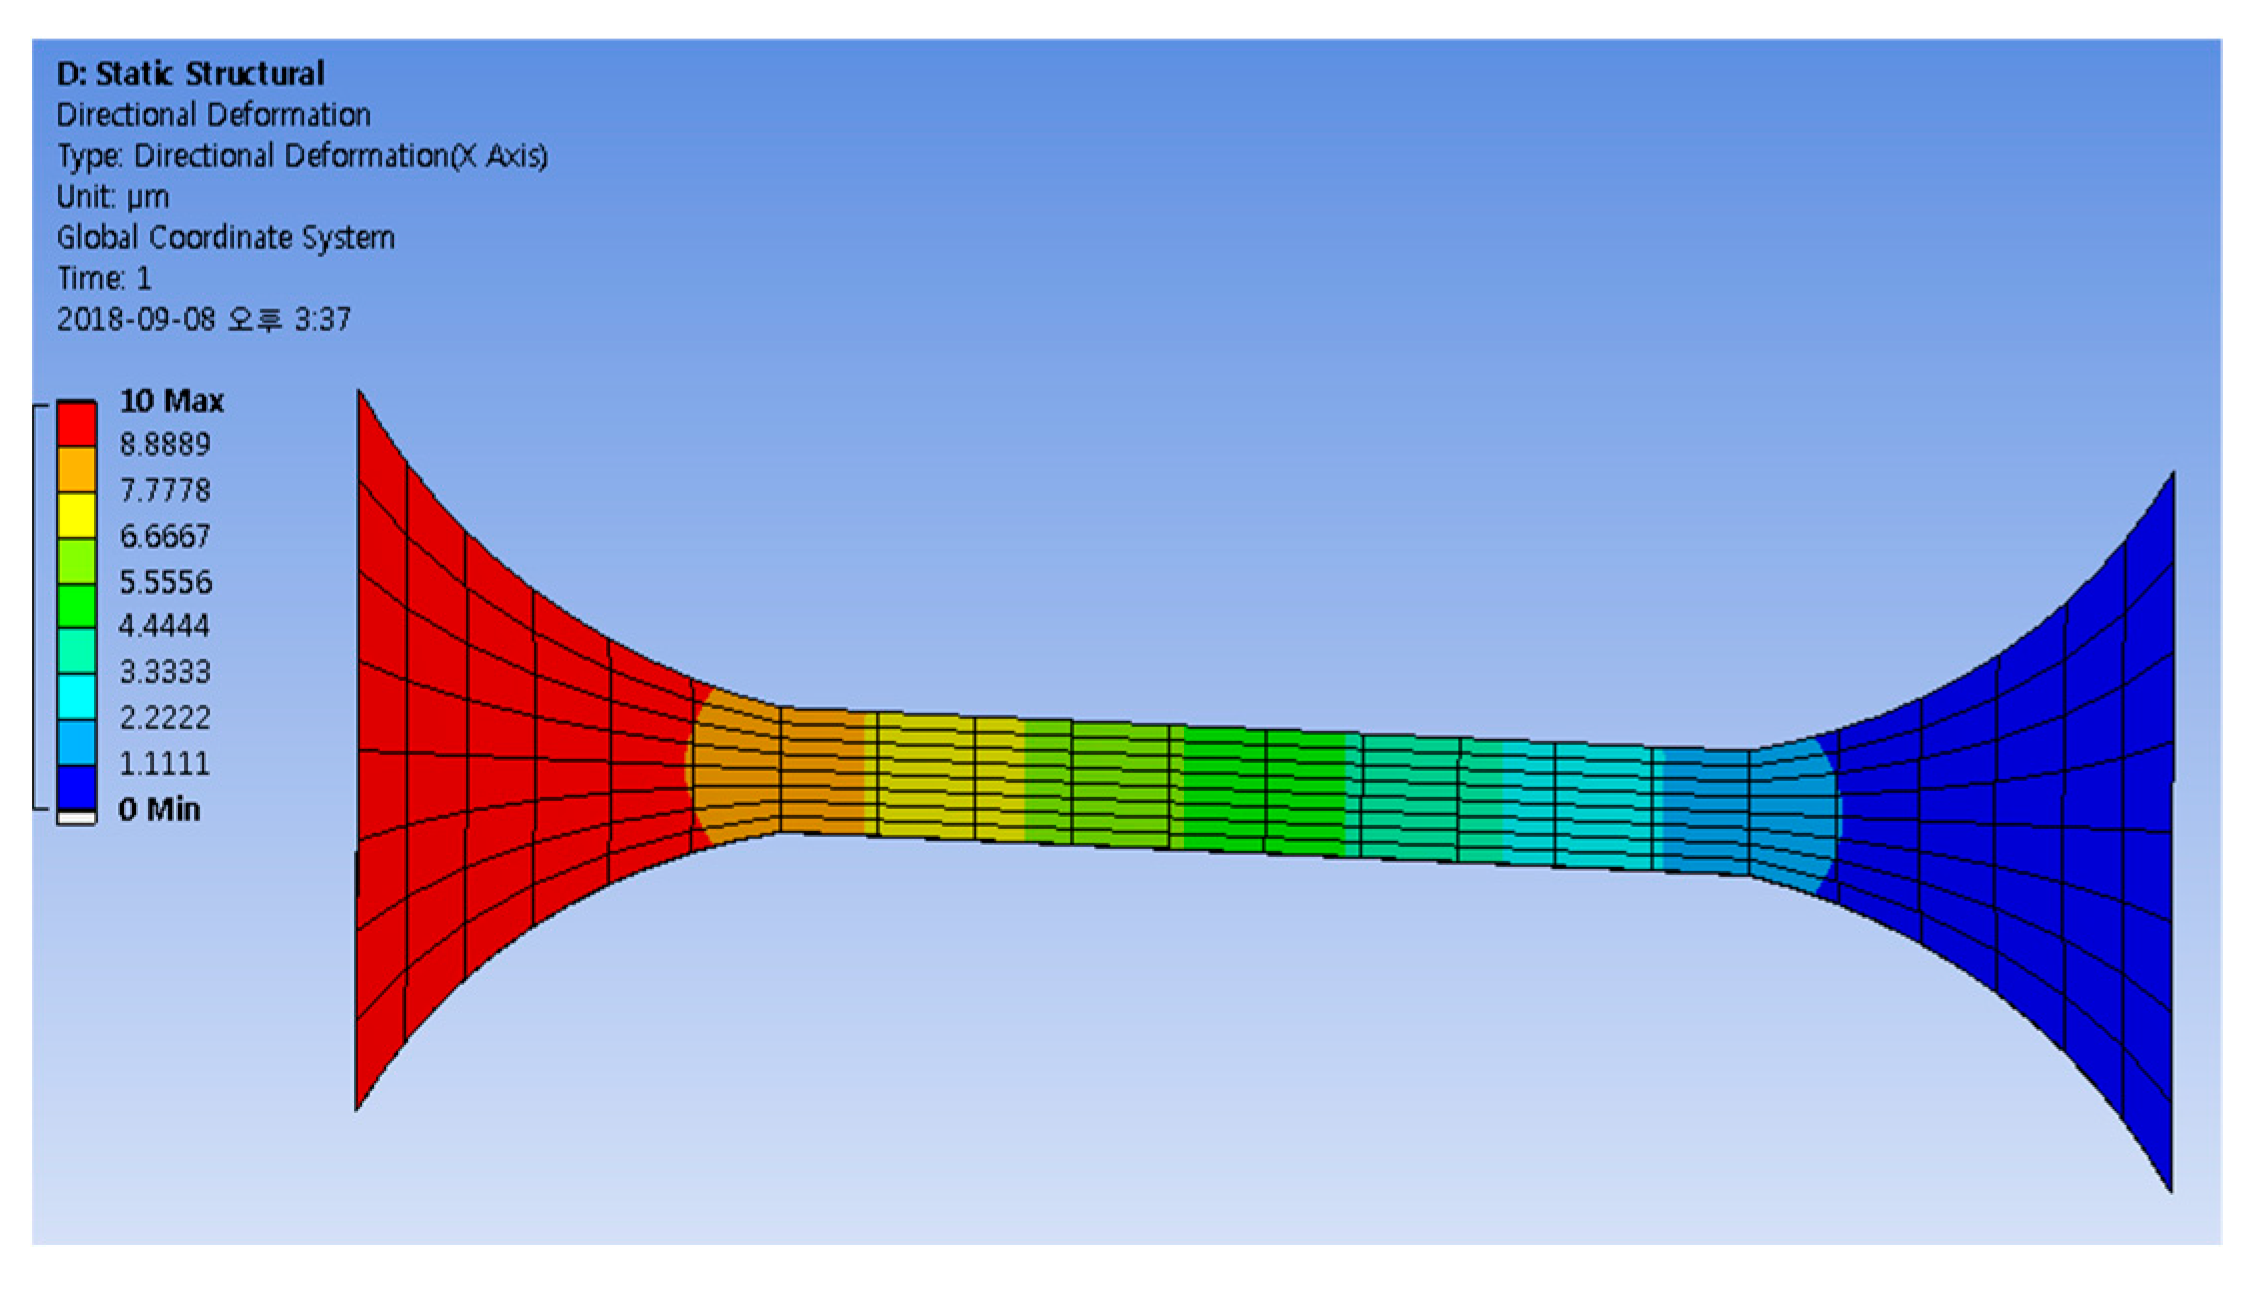
Figure 1a). Therefore, we use the finite element analysis method to calculate the ratio of reduced section and an interesting range as shown in Figure 7. In addition, the deformation of interesting range is yield by multiplying the measurement data and the ratio. Figure 8 shows the results of applying finite element analysis. The result of ratio is 0.635 [14].
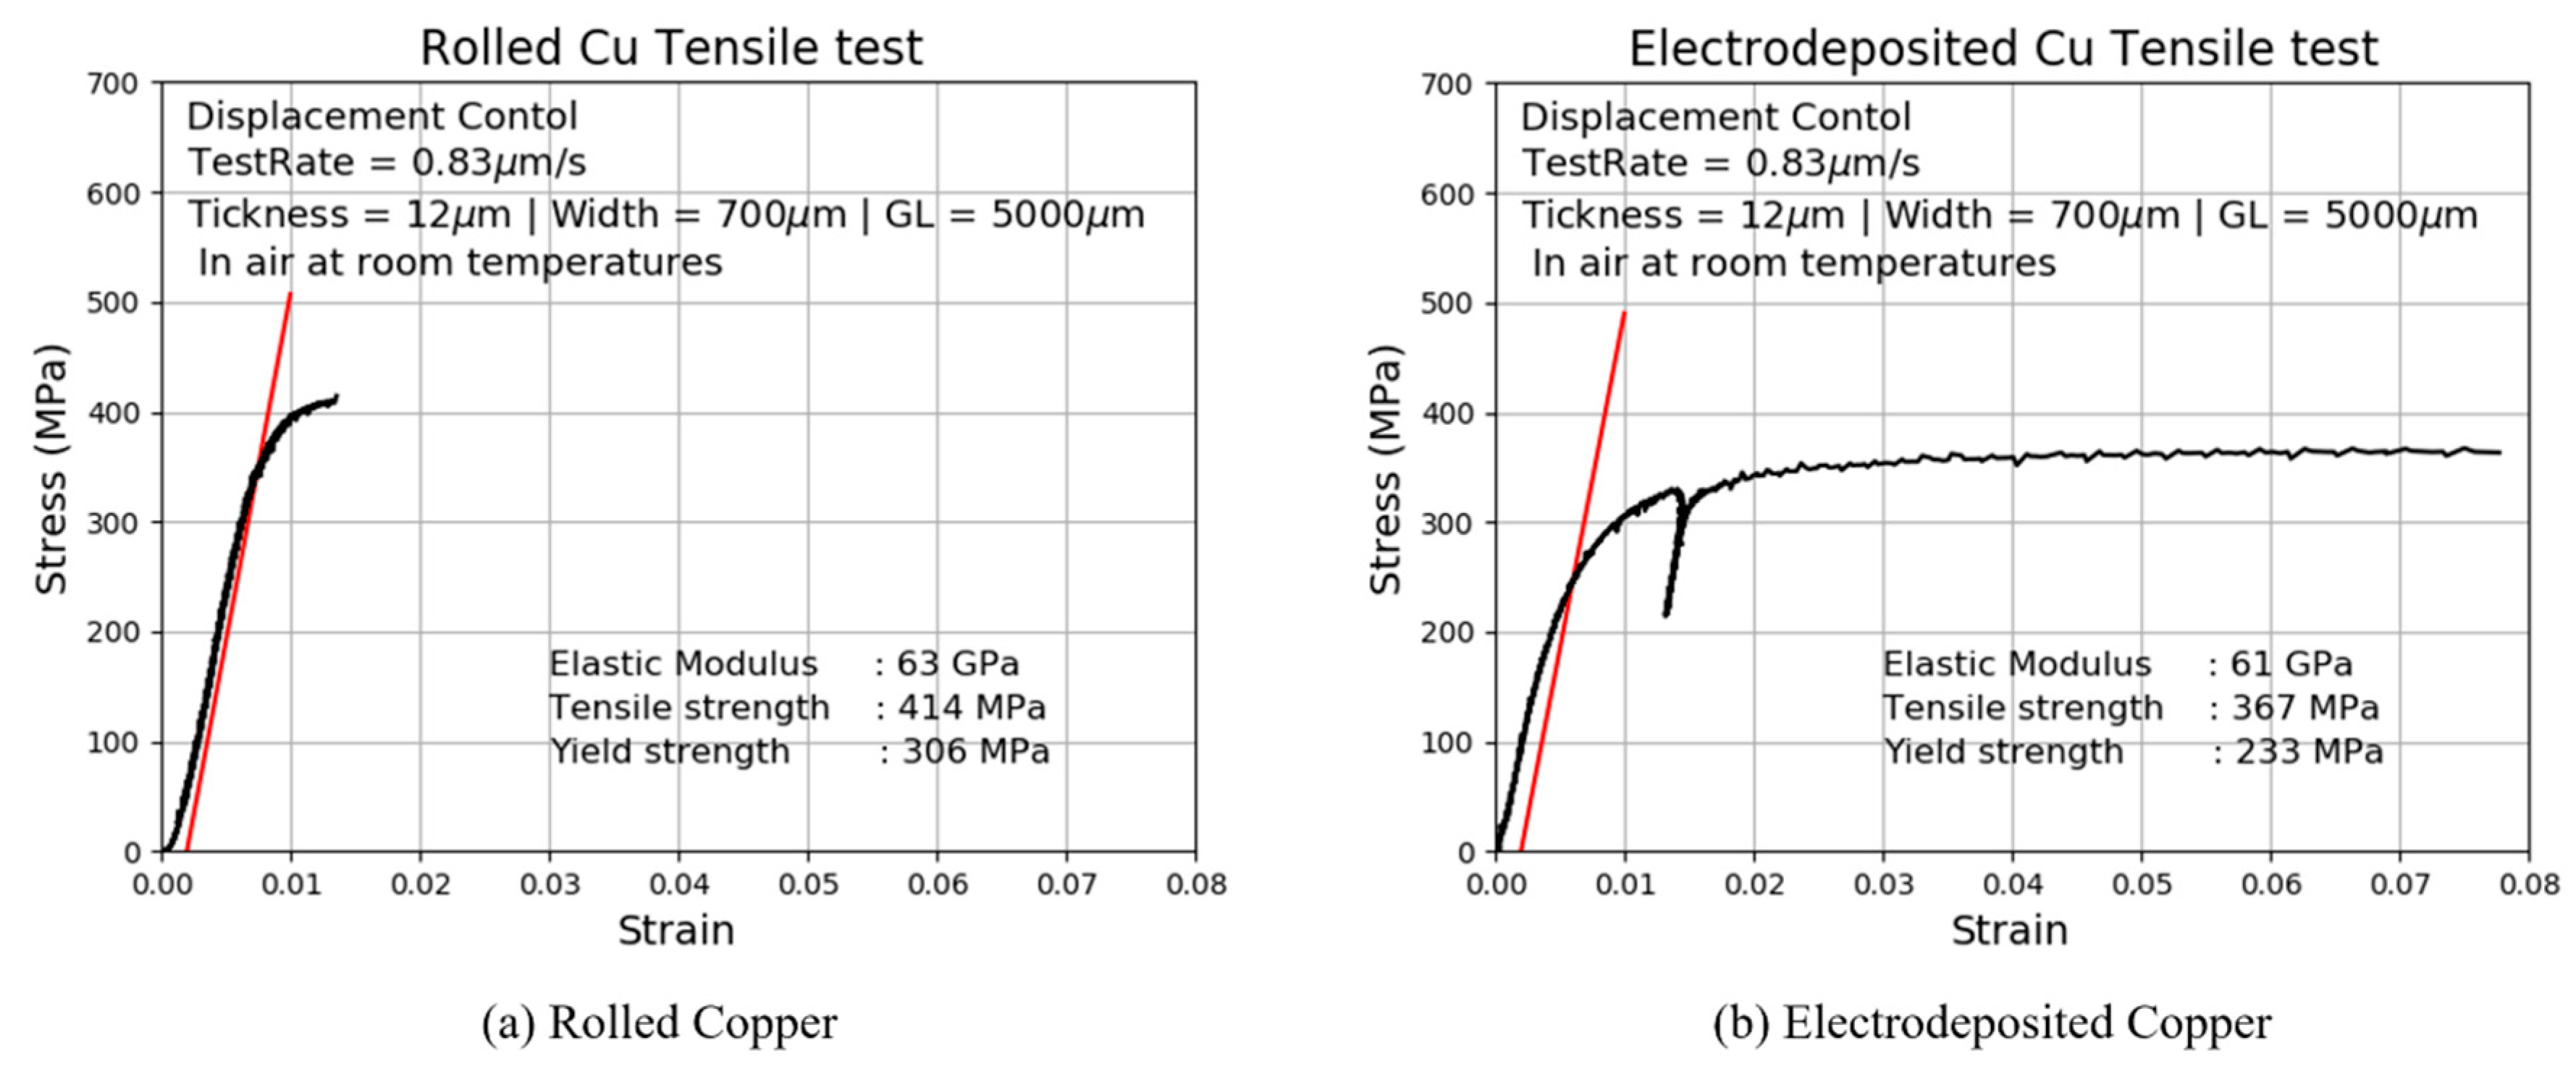
The stress-strain curve for copper thin film is obtained from load and displacement, as shown in Figure 9. For the load, the data obtained from the load cell are used, and the strain is calculated using the data obtained from the displacement sensor. To analyze the mechanical properties of thin film copper according to the process method, we compare the typical mechanical properties such as elastic modulus, 0.2% offset yield strength and ultimate tensile strength.
The unloading test is essential for obtaining the elastic modulus more accurately. Therefore, the unloading test is applied to the electrodeposited copper around the strain 0.015, as shown in Figure 9b. However, the unloading test cannot be applied on the rolled copper because it had a brittle fracture.
The mechanical properties of the rolled and electrodeposited copper are shown in Table 1, which are experimental results obtained from the stress-strain curve. As a result, the elastic modulus of the rolled and electrodeposited copper is 63 GPa and 61 GPa. 0.2% yield strength is 306 MPa, 233 MPa, and ultimate tensile strength is 414 MPa, 367 MPa. The elastic modulus is similar depending on the process method, but the 0.2% yield strength and ultimate tensile strength are different depending on the process method. In particular, it can be seen that the electrodeposited copper has a lower yield strength than the rolled copper.
The mechanical properties of the copper thin films obtained in this study were compared with those of the copper thin films tested in [12]. To compare the mechanical properties of copper thin films according to the fabrication method, the specimens in [12] were fabricated with pre-plating (type A), the other with post-plating (type B), and finally double-plated (type C). A copper film fabricated pre-plating (type A) was deposited by electro-plating the whole pattern with SR (solder resist) printing. In addition, the SR film was cured to protect the pattern. A post-plating (type B) was first fabricated the SR coating and after was cured. A double-plated (type C) was fabricated by electro-plating on polyimide and pure Sn was coated before and SR film was printed and cured. The specimens were dog-bone type and length of specimen was 8000 μm, width was 2000 μm, and thickness was 15.26 μm.
The paper reported that elastic modulus of Type A, B and C are 72, 71 and 69 GPa [12], respectively, which are lower than the bulk value, 117 GPa [15]. In addition, the 0.2% offset yield strength of Type A, B and C are 358, 350 and 346 MPa, respectively, about 10 times higher than 33 MPa of bulk copper and the ultimate tensile strength of Type A, B and C are 462, 456 and 446 MPa, respectively, about 2.5 times higher than 210 MPa of bulk copper.
From Table 1, the elastic modulus shows little difference between the two types but are all lower than the bulk material and even the previous study for three types. In addition, there is difference between the two types in that the 0.2% offset yield strength and the ultimate tensile strength of the rolled copper thin film are higher than the electrodeposited copper thin film but the both copper thin film are higher than the bulk material.

3.2. Fatigue Test and Fatigue Properties

In this study, in order to obtain the fatigue properties for each of the rolled copper and the electrodeposited copper through the stress-life curve, the target of fatigue life is set to four levels (10,000/50,000/100,000/500,000 cycles). At least three tests were performed for each target level to obtain stress and life data. To analyze the fatigue properties, the stress and life data from the fatigue test were used to plot the stress-life curve. When the fatigue test, the stress ratio between the maximum stress value and the minimum stress value was set to R = 0.1, and a cyclic load of 3 Hz was applied.
The relationship between the number of cycles to failure ( N f ) and the amplitude stress ( S a ), which are frequently used to evaluate fatigue properties, is obtained. In the stress-life ( S a N f ) curve of the log-log scale, the linear equation is generally expressed as Equation (1) [16], as in the form of the Basquin’s equation. Where σ f and b are the fatigue strength coefficients and the exponents, respectively.
S = σ f ( 2 N f ) b
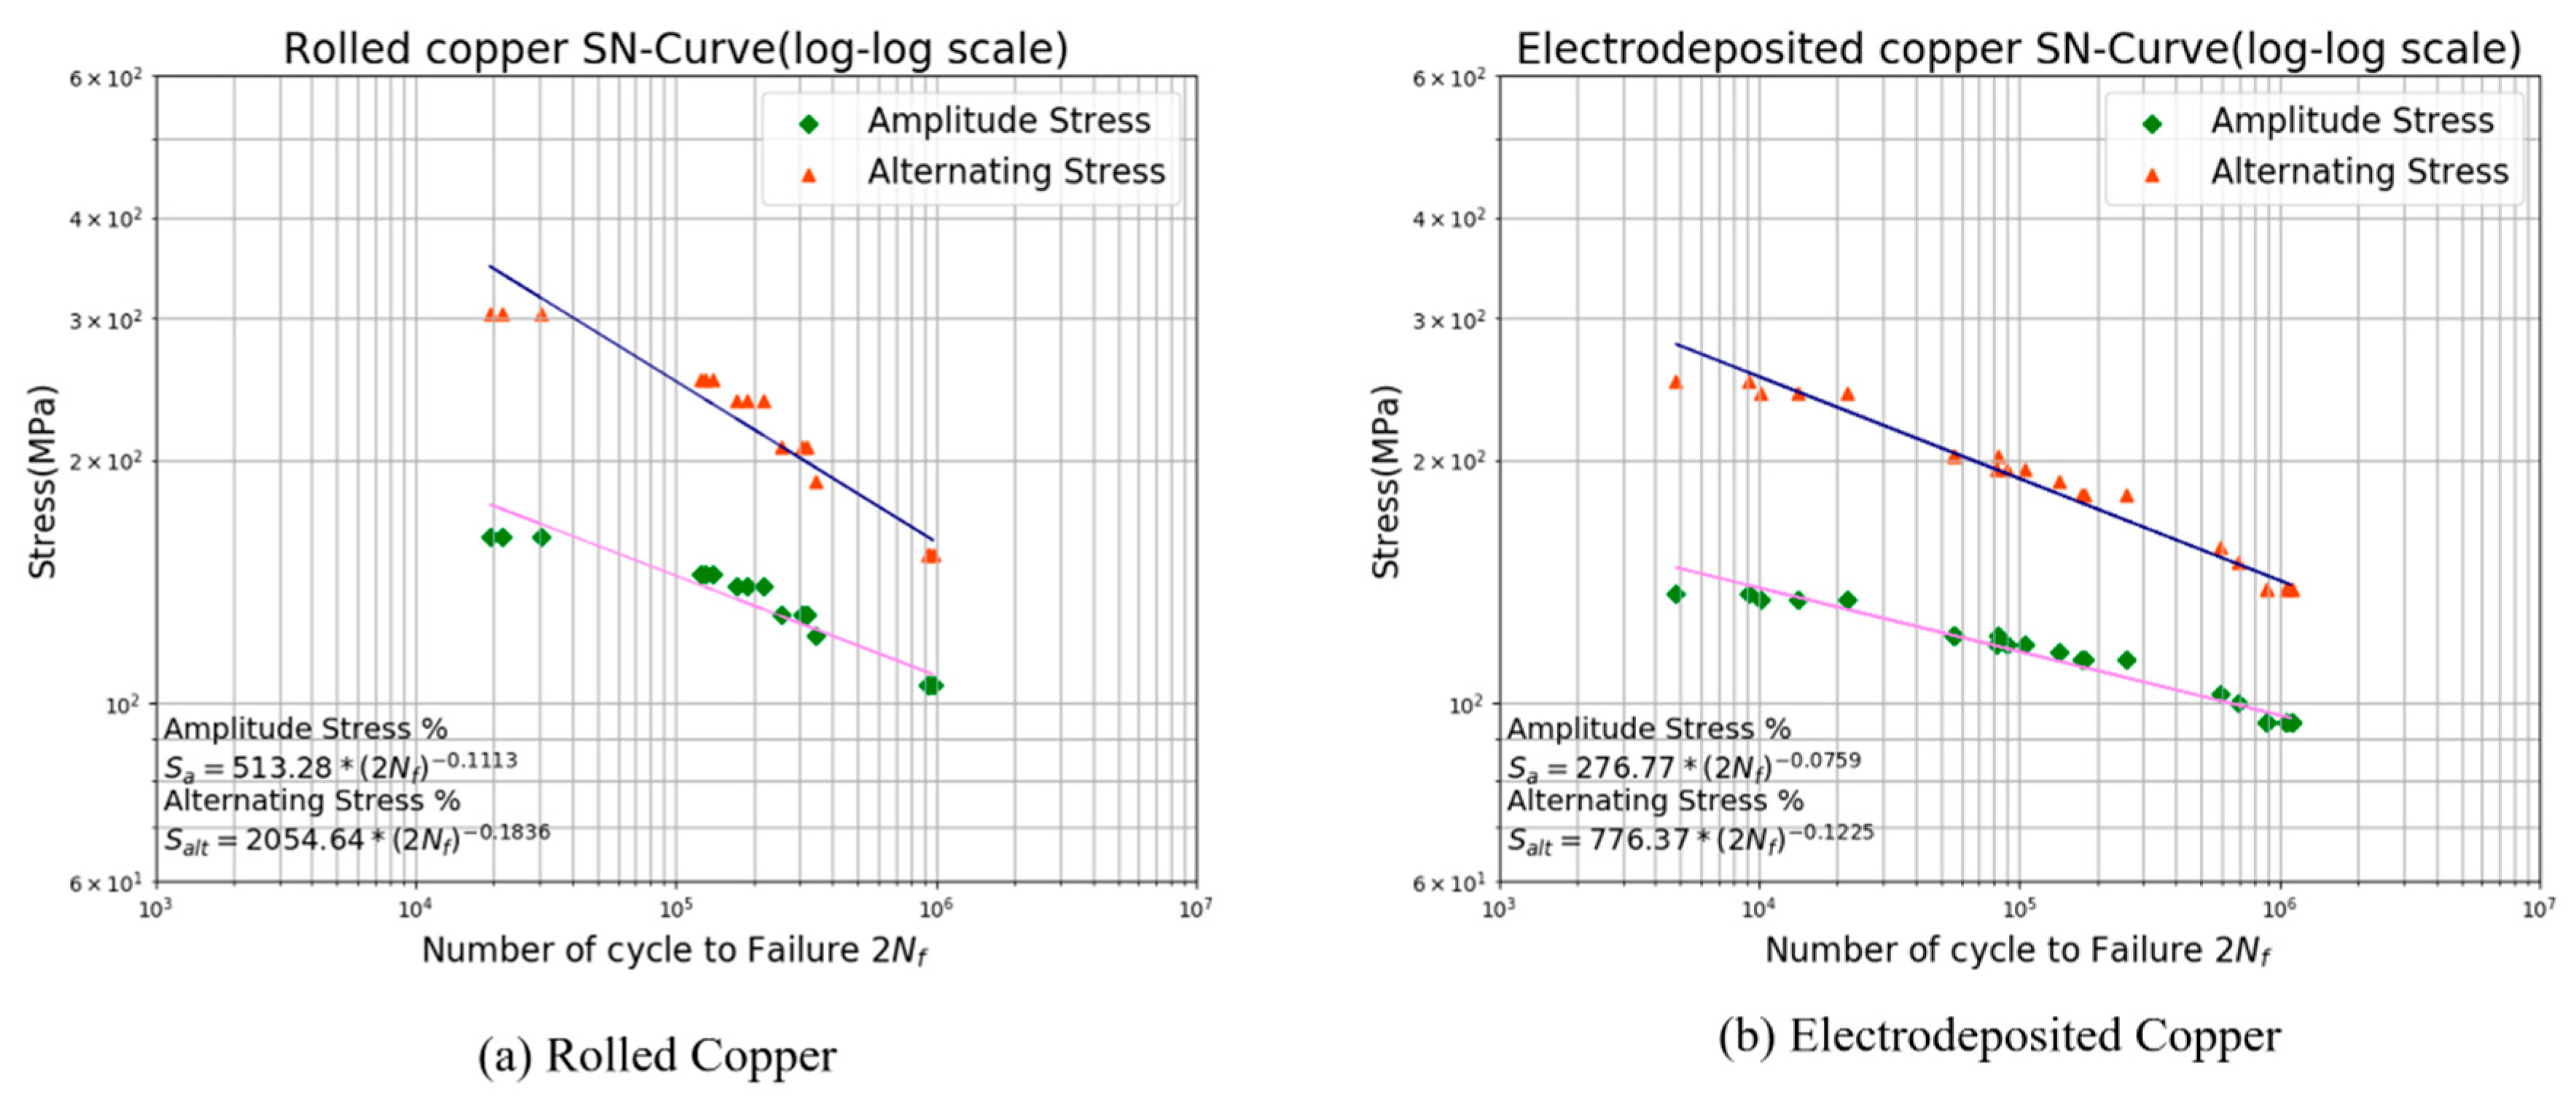
Figure 10 is a stress-life curve which is shown the relationship between amplitude stress and life for the fatigue test results of rolled and electrodeposited copper depending on the process. In addition, stress-life curves were obtained for amplitude stress and alternating stress. Alternating stress was calculated by applying Goodman’s fatigue equation as shown in Equation (2) [17]. It was obtained using experimental data repeated three times for each target life level, and the error of experimental data was small. Since copper is a nonferrous metal material, the fatigue limit cannot be obtained. However, the fatigue test was performed up to 500,000 cycles with a high cycle [18].
Goodman   method :   S a S a l t + S m S u = 1
where S a is amplitude stress, S m is mean stress, S u is ultimate tensile strength, and S a l t is alternating stress.
In this study, the mean stress is not 0 when the fatigue test performed. The fatigue test is not considered the mean stress, but fixed the stress ratio R = 0.1 and set the maximum stress for life. We performed the fatigue test without considering the average stress. Fatigue experiments were performed by fixing the stress ratio R = 0.1 and finding the maximum stress for the target life. It is difficult to compare the fatigue properties at R −1 with the bulk material or with other experimental results. Goodman method had originally been proposed to consider mean stress when predicting the fatigue life. Therefore, we obtained the alternating stress using the Goodman method that is best known for a reasonable comparison considering the mean stress.
As a result, from the fatigue life equation obtained for amplitude stress, the fatigue strength coefficients were 513.28 MPa and 276.77 MPa, respectively, and the fatigue strength exponents are −0.1113 and −0.0759, respectively. The fatigue life equations for the alternating stresses of the rolled and the electrodeposited copper were 2054.64 MPa and 776.37 MPa, respectively, and the fatigue strength exponents were −0.1836 and −0.1225, respectively. The experimental results show that the rolled copper has higher fatigue strength and fatigue limit than the electrodeposited copper.
In this study, fatigue life equations in the finite-life region are obtained and analyzed. In Table 2, the results of the fatigue life equations of the rolled and electrodeposited copper and the fatigue life equations according to the plating method of [12] are presented as amplitude stress and alternating stress. Types A, B, and C are the results of fatigue tests with constant 0.5 of tensile strength at mean stress. Therefore, in order to compare the results of the rolled and the electrodeposited copper which are the experimental results of this study, the fatigue life equation for alternating stress was obtained. As a result, fatigue strength coefficients of 910 MPa, 1191 MPa, and 1743 MPa were obtained for each plating type, and the fatigue strength exponents were −0.08955, −0.10913, and −0.15072, respectively. The fatigue properties are different according to the plating method, and it can be seen that the fatigue strength is the highest when the double-plating is performed.
However, as a result of comparing both the fatigue properties according to the process method and the plating method, it can be seen that the copper thin film by the rolling process method has the highest fatigue strength.
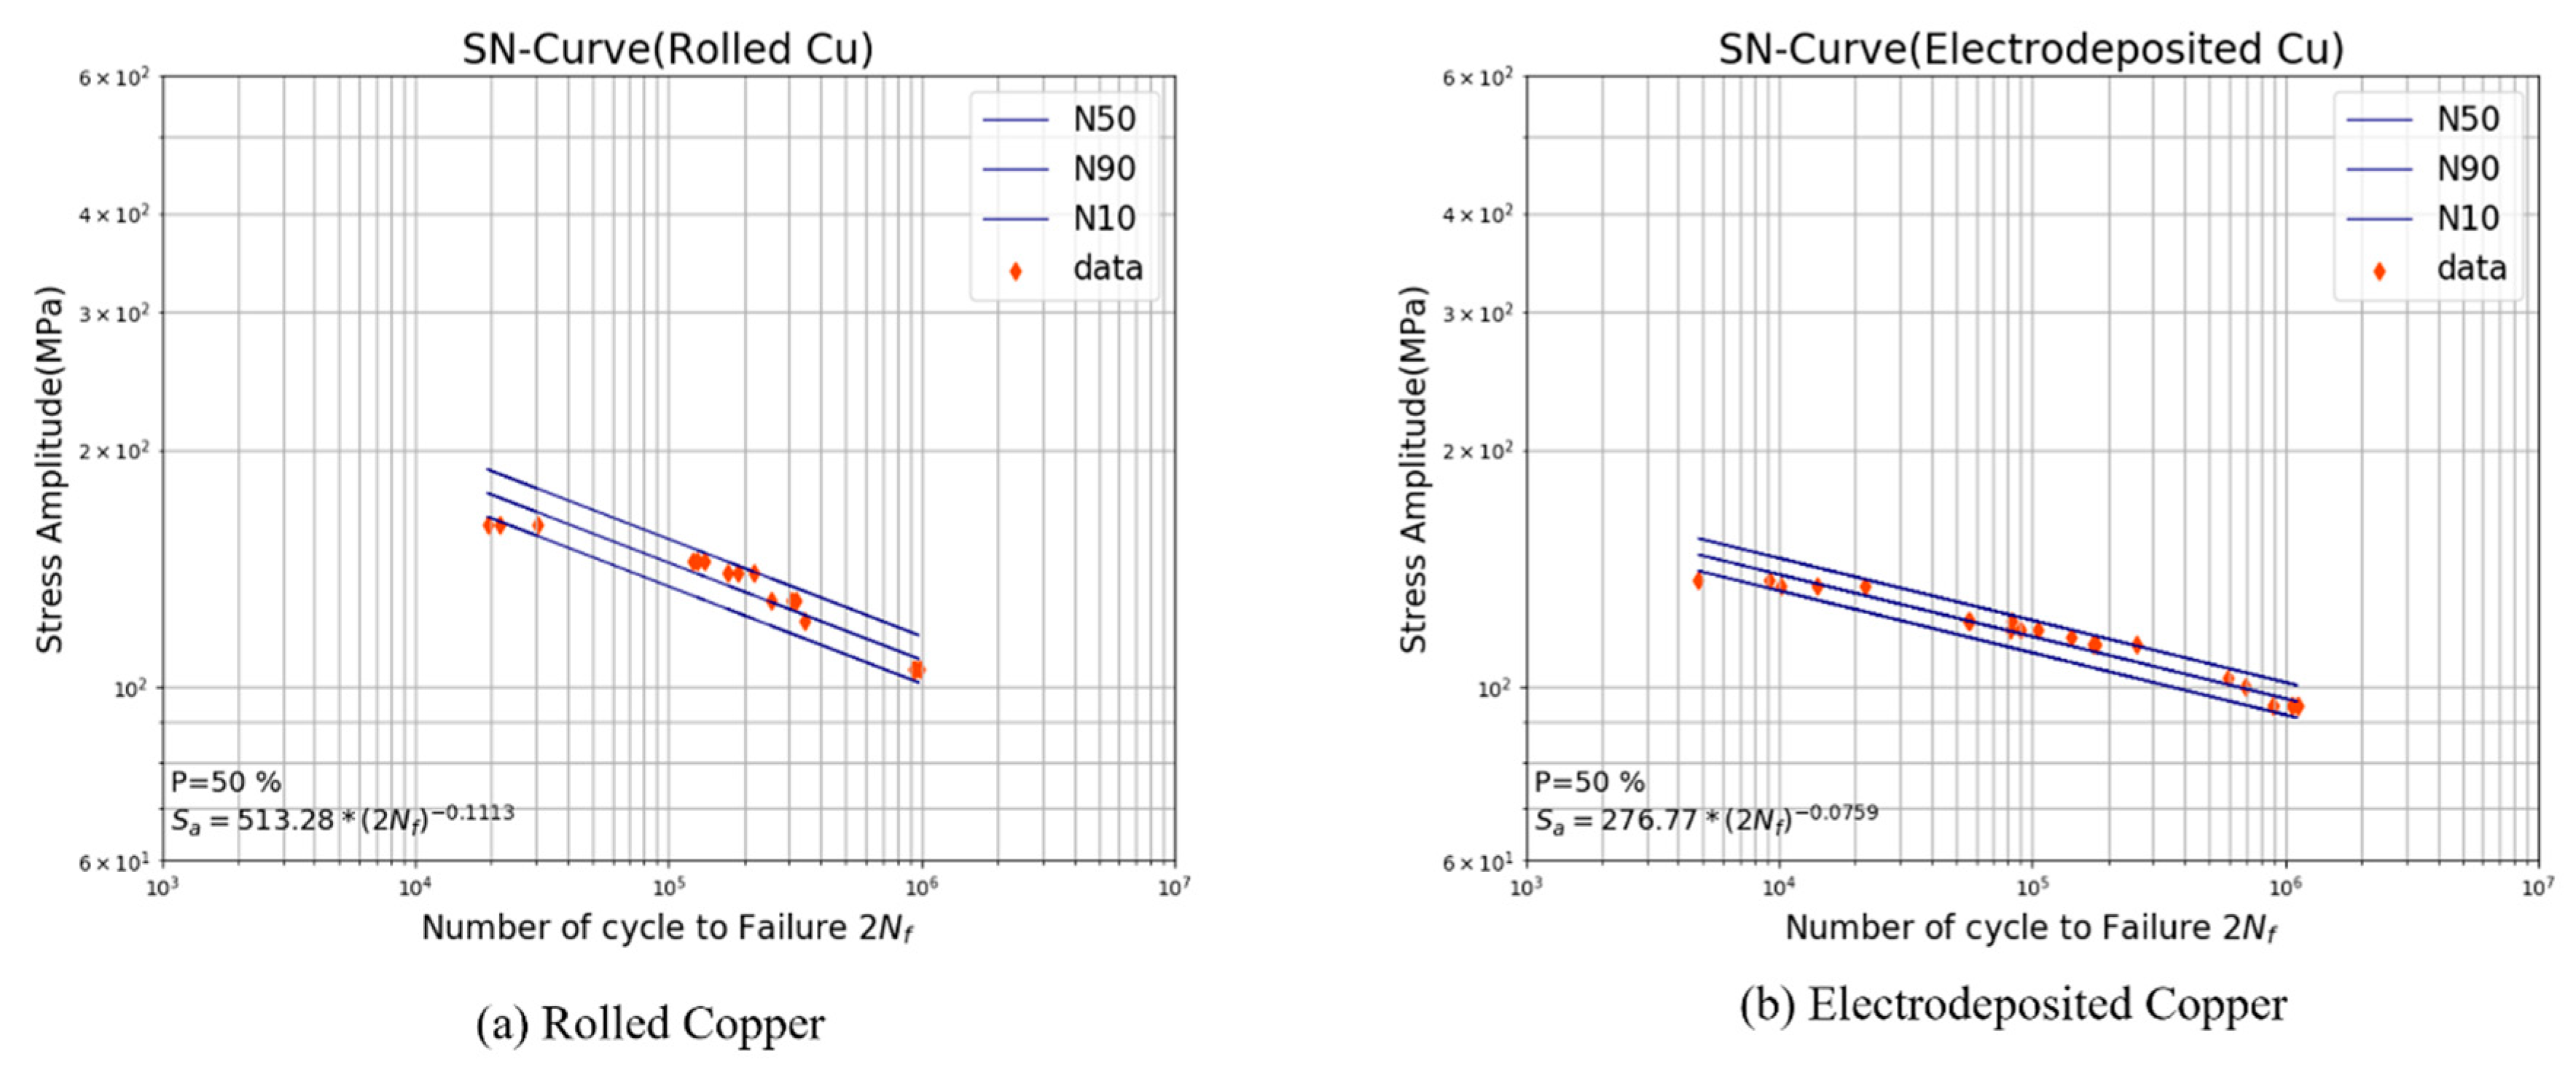
The P-S-N diagram showing the confidence band of fatigue life for each process is shown in Figure 11. When the fatigue life is 50%, the equation of the rolled thin film obtained by regression analysis is S a = 513 ( 2 N f ) 0.1113 and the equation of the electrodeposited thin film is S a = 277 ( 2 N f ) 0.0759 .
In this study, tensile and fatigue tests were performed and analyzed to evaluate an influence of fabrication method on mechanical characteristics of copper thin film which widely used in flexible printed circuit board (FPCB). Tensile test results showed that the elastic modulus was similar for each process, but the 0.2% yield strength and ultimate tensile strength were greater in the rolling process. The elastic modulus of the rolled copper thin films and the electrodeposited copper thin films are 63 and 61 GPa, respectively, which are lower than the bulk value, 117 GPa [15]. In addition, the 0.2% offset yield strength of the rolled copper thin films and the electrodeposited copper thin films are 306 and 233 MPa, respectively, higher than 33 MPa of bulk copper and the ultimate tensile strength of the rolled copper thin films and the electrodeposited copper thin films are 414 and 367 MPa, respectively, about higher than 210 MPa of bulk copper. The tensile test results show that the copper thin films by the rolling process are more brittle than by the electrodeposition process.
In addition, fatigue tests were performed with three or more specimens at four levels and S-N curves and P-S-N curves were calculated by regression analysis with the obtained data. The fatigue test results show that the copper thin films by the rolling process are better than by the electrodeposition process in fatigue life in all region. The fatigue strength coefficient of the rolled copper thin films and the electrodeposited copper thin films are 513 and 277 MPa, respectively. In addition, the fatigue strength exponent of the rolled copper thin films and the electrodeposited copper thin films are −0.1113 and −0.07590, respectively.
From the experimental results, the mechanical characteristics of the thin film are influenced by the manufacturing method even if they are the same material, and it is important to directly obtain the mechanical properties to secure the reliability of an electric product.

4. Conclusions

This study investigated the effect of fabrication on the tensile and fatigue properties of copper thin film, which is widely used in FPCB. Some conclusions are drawn:
(1) The tensile test results show that the copper thin films by the rolling process are more brittle than by the electrodeposition process. Elastic moduli show little difference between the two types but are all lower than the bulk material and even previous study for three types. In addition, there is difference among the two types that the 0.2% offset yield strength and the ultimate tensile strength of the rolled copper thin film are higher than the electrodeposited copper thin film but the both copper thin film are higher than the bulk material.
(2) The fatigue test results show that the copper thin films by the rolling process are better than by the electrodeposition process in fatigue life in all region. From the experimental results, the mechanical characteristics of the thin film are influenced by the manufacturing method even if they are the same material, and it is important to directly obtain the mechanical properties to secure the reliability of an electric product.
From the results of this study, in order to secure the reliability of electronic products using FPCB, it is found that it is appropriate to use a rolled copper thin film. However, there is a great difference between the mechanical characteristics depending on the direction of the rolling in the rolled thin film, so care must be taken when using it.

Author Contributions

Conceptualization, J.-H.P.; methodology, J.-H.P.; software, D.-J.K.; validation, J.-H.P. and D.-J.K.; formal analysis, H.-G.M. and J.-H.P.; investigation, H.-G.M.; resources, J.-H.P. and H.-G.M.; data curation, H.-G.M.; writing—original draft preparation, H.-G.M. and J.-H.P.; writing—review and editing, H.-G.M., D.-J.K. and J.-H.P.; visualization, H.-G.M.; supervision, D.-J.K. and J.-H.P.; project administration, J.-H.P.; funding acquisition, J.-H.P., This paper was prepared the contributions of all authors. All authors have read and agreed to the published version of the manuscript.

Funding

This work was supported by the KETEP (Korea Institute of Energy Technology Evaluation and Planning) and National Research Foundation of Korea (NRF) grant funded by the Korea government (MSIT No. 20153010024470, NRF-2019R1H1A2101531).

Conflicts of Interest

The authors declare no conflict of interest.

References

  1. Leong, W.C.; Abdullah, M.Z.; Khor, C.Y. Application of Flexible Printed Circuit Board (FPCB) in Personal Computer Motherboards: Focusing on Mechanical Performance. Microelectron. Reliab. 2012, 52, 744–756. [Google Scholar] [CrossRef]
  2. Zhang, S.; Sakane, M.; Nagasawa, T.; Kobayashi, K. Mechanical Properties of Copper Thin Films Used in Electronic Devices. Procedia Eng. 2011, 10, 1497–1502. [Google Scholar] [CrossRef] [Green Version]
  3. Connolley, T.; Mchugh, P.E.; Bruzzi, M. A Review of Deformation and Fatigue of Metals at Small Size Scales. Fatigue Fract. Eng. Mater. Struct. 2005, 28, 1119–1152. [Google Scholar] [CrossRef]
  4. Haque, M.A.; Saif, M.T.A. Strain Gradient Effect in Nanoscale Thin Films. Acta Mater. 2003, 51, 3053–3061. [Google Scholar] [CrossRef]
  5. Dunstan, D.J.; Bushby, A.J. The Scaling Exponent in the Size Effect of Small Scale Plastic Deformation. Int. J. Plast. 2013, 40, 152–162. [Google Scholar] [CrossRef]
  6. Hirakata, H.; Nishijima, O.; Fukuhara, N.; Kondo, T.; Yonezu, A.; Minoshima, K. Size Effect on Fracture Toughness of Freestanding Copper Nano-Films. Mater. Sci. Eng. A 2011, 528, 8120–8127. [Google Scholar] [CrossRef]
  7. Schwaiger, R.; Kraft, O. Size Effects in the Fatigue Behavior of Thin Ag Films. Acta Mater. 2003, 51, 195–206. [Google Scholar] [CrossRef]
  8. Ben-David, E.; Landa, M.; Janovská, M.; Seiner, H.; Gutman, O.; Tepper-Faran, T.; Shilo, D. The Effect of Grain and Pore Sizes on the Mechanical Behavior of Thin Al Films Deposited under Different Conditions. Acta Mater. 2015, 87, 321–331. [Google Scholar] [CrossRef]
  9. Merchant, H.D.; Minor, M.G.; Liu, Y.L. Mechanical Fatigue of Thin Copper Foil. J. Electron. Mater. 1999, 28, 998–1007. [Google Scholar] [CrossRef]
  10. Park, J.H.; Myung, M.S.; Kim, Y.J. Tensile and High Cycle Fatigue Test of Al-3% Ti Thin Films. Sens. Actuators A Phys. 2008, 147, 561–569. [Google Scholar] [CrossRef]
  11. Park, J.H.; Chun, Y.B.; Kim, Y.J.; Huh, Y.H.; Kang, D.J. Tensile and High Cycle Fatigue Tests of NiCo Thin Films. Procedia Eng. 2011, 10, 1303–1308. [Google Scholar] [CrossRef] [Green Version]
  12. Park, J.H.; An, J.H.; Kim, Y.J.; Huh, Y.H.; Lee, H.J. Tensile and High Cycle Fatigue Test of Copper Thin Film. Materwiss. Werksttech. 2008, 39, 187–192. [Google Scholar] [CrossRef]
  13. Lee, Y.-B.; Kim, S.-Y.; Oh, B.-D. Characteristics of Fatigue Crack Propagations with Respect to Loading Directions in Butt-Welded Steel Plates with the Same Direction of Rolling and Welding Bead. J. Weld. Join. 2005, 23, 37–42. [Google Scholar]
  14. Park, J.H.; Shin, M.S. Reliability Design and Assessment of a Micro-Probe Using the Results of a Tensile Test of a Beryllium-Copper Alloy Thin Film. J. Micromech. Microeng. 2011, 21. [Google Scholar] [CrossRef]
  15. Gad-el-Hak, M. The MEMS Handbook, Second Edition-3 Volume Set; Mechanical and Aerospace Engineering Series; Taylor and Francis: London, UK, 2005. [Google Scholar]
  16. Basquin, O.H. The exponential law of endurance tests. Proc. Am. Soc. Test Mater. 1910, 10, 625–630. [Google Scholar]
  17. Forrest, P.G. Fatigue of Metals; CRC: Boca Raton, FL, USA, 1962. [Google Scholar]
  18. Dowling, N.E. Mean Stress Effects in Stress-Life and Strain-Life Fatigue. In Second SAE Brasil International Conference on Fatigue; SAE International: Warrendale, PA, USA, 2004. [Google Scholar]
Figure 1. The shape and dimension of the specimens (μm). (a) Tensile specimen (b) Fatigue specimen.
Applsci 10 00388 g001
Figure 2. Copper thin film surface image by process method from SEM (Scanning Electron Microscope). (a) the surface image of rolled copper (b) the surface image of electrodeposited copper.
Applsci 10 00388 g002
Figure 3. EDS analysis of copper thin film surface. (a) Rolled copper thin film (b) Electrodeposited copper thin film.
Applsci 10 00388 g003
Figure 4. The system configuration for tensile and fatigue testing.
Applsci 10 00388 g004
Figure 5. Alignment and attaching process to fix specimen to aluminum plate.
Applsci 10 00388 g005
Figure 6. The fracture images of specimen when alignment is correct.
Applsci 10 00388 g006
Figure 7. The ratio for reduced section and interesting range at the specimen.
Applsci 10 00388 g007
Figure 8. The finite element analysis (FEA) results to find the ratio of interesting range and reduced section.
Applsci 10 00388 g008
Figure 9. Stress-Strain curves: Mechanical properties for Cu thin films depending on process method.
Applsci 10 00388 g009
Figure 10. Stress-Fatigue life curve (S-N curve): Comparison of fatigue properties of Cu thin films depending on process method.
Applsci 10 00388 g010
Figure 11. P-S-N curve from fatigue test for Cu thin films depending on process method.
Applsci 10 00388 g011
Table 1. The result of mechanical properties rolled and electrodeposited copper and depending on process method at other condition (Elastic modulus, 0.2% offset yield strength, ultimate tensile strength).
Elastic ModulusYield Strength (0.2% Offset)Ultimate Tensile Strength
Rolled Copper63 GPa306 MPa414 MPa
Electrodeposited Copper61 GPa233 MPa367 MPa
Type A72 GPa359 MPa463 MPa
Type B71 GPa351 MPa456 MPa
Type C69 GPa347 MPa447 MPa
Table 2. Comparison of stress-life equation according to the process using Goodman method.
MaterialS-N CurvesS-N Curves Modified by Goodman Method
Rolled Copper R = 0.1 S a = 513 ( 2 N f ) 0.1113 S a l t = 2055 ( 2 N f ) 0.1836
Electrodeposited copper R = 0.1 S a = 277 ( 2 N f ) 0.0759 S a l t = 776 ( 2 N f ) 0.1225
Type A Sm = 0.5STS S a = 431 ( 2 N f ) 0.0834 S a l t = 910 ( 2 N f ) 0.0895
Type B Sm = 0.5STS S a = 872 ( 2 N f ) 0.1507 S a l t = 1191 ( 2 N f ) 0.1091
Type C Sm = 0.5STS S a = 519 ( 2 N f ) 0.0923 S a l t = 1743 ( 2 N f ) 0.1507

