Article

Study on Seismic Performance of a Mold Transformer through Shaking Table Tests

School of Architecture, Soongsil University, 369 Sangdo−ro, Dongjak−gu, Seoul 06978, Korea
*
Author to whom correspondence should be addressed.
Appl. Sci. 2020, 10(1), 361; https://doi.org/10.3390/app10010361
Submission received: 1 December 2019 / Revised: 30 December 2019 / Accepted: 31 December 2019 / Published: 3 January 2020

Abstract

:
This study presents an experimental seismic investigation of a 1000 kVA cast resin-type hybrid mold transformer through tri-axial shaking table tests. The input acceleration time histories were generated in accordance with the specifications recommended by the International Code Council Evaluation Services Acceptance Criteria ICC-ES AC156 code, with scaling factors in the range of 25–300%. The damage and the dynamic characteristics of the mold transformer were evaluated in terms of the fundamental frequency, damping ratio, acceleration time history responses, dynamic amplification factors, and relative displacement. The shaking table test results showed that the damage of the mold transformer was mainly governed by the severe slippage of the spacers and the loosening of the linked bolts between the bottom beam and the bed beam. In addition, the maximum relative displacement at the top beam in Y and Z-directions exceeded the boundary limit recommended by the Korean National Radio Research Agency. Moreover, the operational test of the specimen was performed based on the IEC 60076-11 Standard before and after the shaking table test series to ensure the operational capacity of the transformer.

1. Introduction

Non-structural elements that are attached to or supported by structural components play various functions and services in maintaining operation in existing buildings, and to support human activities. According to the complete classification specified in Federal Emergency Management Agency (FEMA) FEMA-74 [1], non-structural elements can be classified into three main categories of architectural components, mechanical and electrical components, and building furnishings and contents. In the building construction, the non-structural elements account for a high percentage of 82–92% of the total economic investment, while structural components account for the remaining 18–8% [2]. Thus, it is obvious that in several vital types of buildings, such as hospitals, high-tech laboratories, power stations, etc., the loss of non-structural elements due to natural disasters could lead to huge replacement costs [3].
During the past few decades, strong earthquake ground motions have caused severe physical, as well as functional, damage to non-structural elements, especially to electrical components, which have led to major operational failures and economic loss of electrical power systems in buildings and special facilities. Depending on the dynamic characteristics, electrical components can be exposed to high-frequency acceleration arising from resonance effects, which result in the loosening of anchor bolts or connecting fasteners, and damage to enclosed plates and frames [4]. For example, the 1994 Northridge earthquake in Los Angeles caused severe damage to crucial non-structural equipment in a major local hospital, such as the emergency power systems, control systems of medical equipment, and water supply piping systems [5]. The 1985 Mexico Earthquake with magnitude 8 and the 2010 Haiti Earthquake with magnitude 7 caused entire failure to unanchored and anchored cabinets in vital facilities [1]. Recently, in South Korea, the 2016 Gyeongju and 2017 Pohang earthquakes caused significant deterioration of non-structural electrical elements within crucial public buildings, such as hospitals, Korea train express (KTX) railway stations, high schools, broadcasting stations, and shopping malls [6]. Thus, nowadays, the investigation of the seismic behavior of non-structural elements is recognized as a key topic in the framework of earthquake risk mitigation.
So far, several research studies have been conducted to evaluate the performance of non-structural elements attached to structural components, subjected to earthquake load. Di Sarno et al. [4] experimentally evaluated the seismic performance of hospital building equipment via unidirectional and bidirectional shaking table testing, considering the presence of internal partitions and cabinet contents. The main purpose of the study was to investigate the correlation between the dynamic response of sample cabinets, and the peak floor accelerations and velocities corresponding to the system limit states, such as overturning and rocking. Based on the test results, fragility curves were also constructed for the components and contents, considering both acceleration and velocity intensity measure. In addition, Petrone et al. [7] performed full-scale shaking table tests in both horizontal directions for the seismic assessment of hollow brick internal partitions. In the study, a steel frame was used to simulate the seismic action at a generic building story and the specimen boundary conditions. The test results showed that the specimen exhibited significant damage at a 0.3% interstorey drift, and extensive damage at a drift close to 1%. In addition, the dynamic characteristics of test specimens were also investigated in terms of damping ratios and natural frequencies, in order to evaluate the influence of the hollow brick partitions on the steel test frame. More recently, Fiorino et al. [8] performed dynamic shaking table tests on prototypes made of indoor partition walls, outdoor facade walls, and suspended continuous ceilings. Based on the test results, the dynamic characteristics in terms of the fundamental frequency and damping ratio, and dynamic amplification were assessed and compared between the non-structural elements with and without anti-seismic solutions. In addition, the seismic response of the tested prototypes was also evaluated in terms of fragility curves.
Nonetheless, the studies on electrical and mechanical components, such as switchboards or transformers commonly used in structural buildings for power systems, are still limited [9,10,11,12,13]. Wang et al. [9] performed a series of quasi-static cyclic loading and shaking table tests to investigate the behavior of a prototype diesel generator equipped with a restrained vibration isolation system. The test results indicated that the failure modes of the restrained isolators were severe fatigue damage of the connection between the vertical restraint rods and top plate, together with the pull-out failure of the vertical restraint rods. In addition, the incorporation of snubbers into the vibration system could provide more restrains, which resulted in effectively preventing the restrained isolators from plastic deformation and severe damage. Hwang et al. [10] performed a seismic fragility analysis of electrical equipment in a typical electric substation in the eastern United States by using actual earthquake damage data. The fragility analysis results revealed the expected performance of electrical equipment in the substation and provided the necessary data for the seismic performance evaluation of an entire electrical substation for reliability analysis. Moreover, Fathali et al. [12] experimentally investigated the seismic performance of an isolation system supporting heavy mechanical equipment. A centrifugal liquid chiller was used as a prototype specimen supported by the American Society of Heating, Refrigerating and Air Conditioning Engineers (ASHRAE)-type isolation system consisting of coil springs and rubber snubbers constraining vertical and horizontal displacement. The test results showed that the isolation system could effectively reduce the response of specimens by energy dissipation and reduce the amplification of the peak acceleration response at the center of the chiller mass with an increase of the peak input acceleration. In addition, the influence of parameters such as the gap size and rubber pad thickness on the seismic performance of the prototype was also analyzed and discussed in detail.
In the present study, dynamic shaking table tests were carried out to investigate the seismic vulnerability of mold transformers, with the aim of expanding the knowledge of the behavior of mechanical and electrical non-structural components. A 1000 kVA hybrid mold transformer was selected as the test specimen, with conventional anchoring details connecting it to a concrete slab. The input acceleration time histories were artificially generated to match the requirements proposed by the International Code Council Evaluation Services Acceptance Criteria ICC-ES AC156 code [14], with different scaling factors. Moreover, random input signals were also used for dynamic system identification, according to FEMA 461 [15]. Based on the test results, the damage stages and dynamic characteristics of the mold transformer during tri-axial acceleration, simulating earthquake load, were evaluated and investigated in terms of the fundamental frequency, damping ratio, acceleration time history responses, and maximum displacement response, as well as dynamic amplification factors.

2. Experimental Program
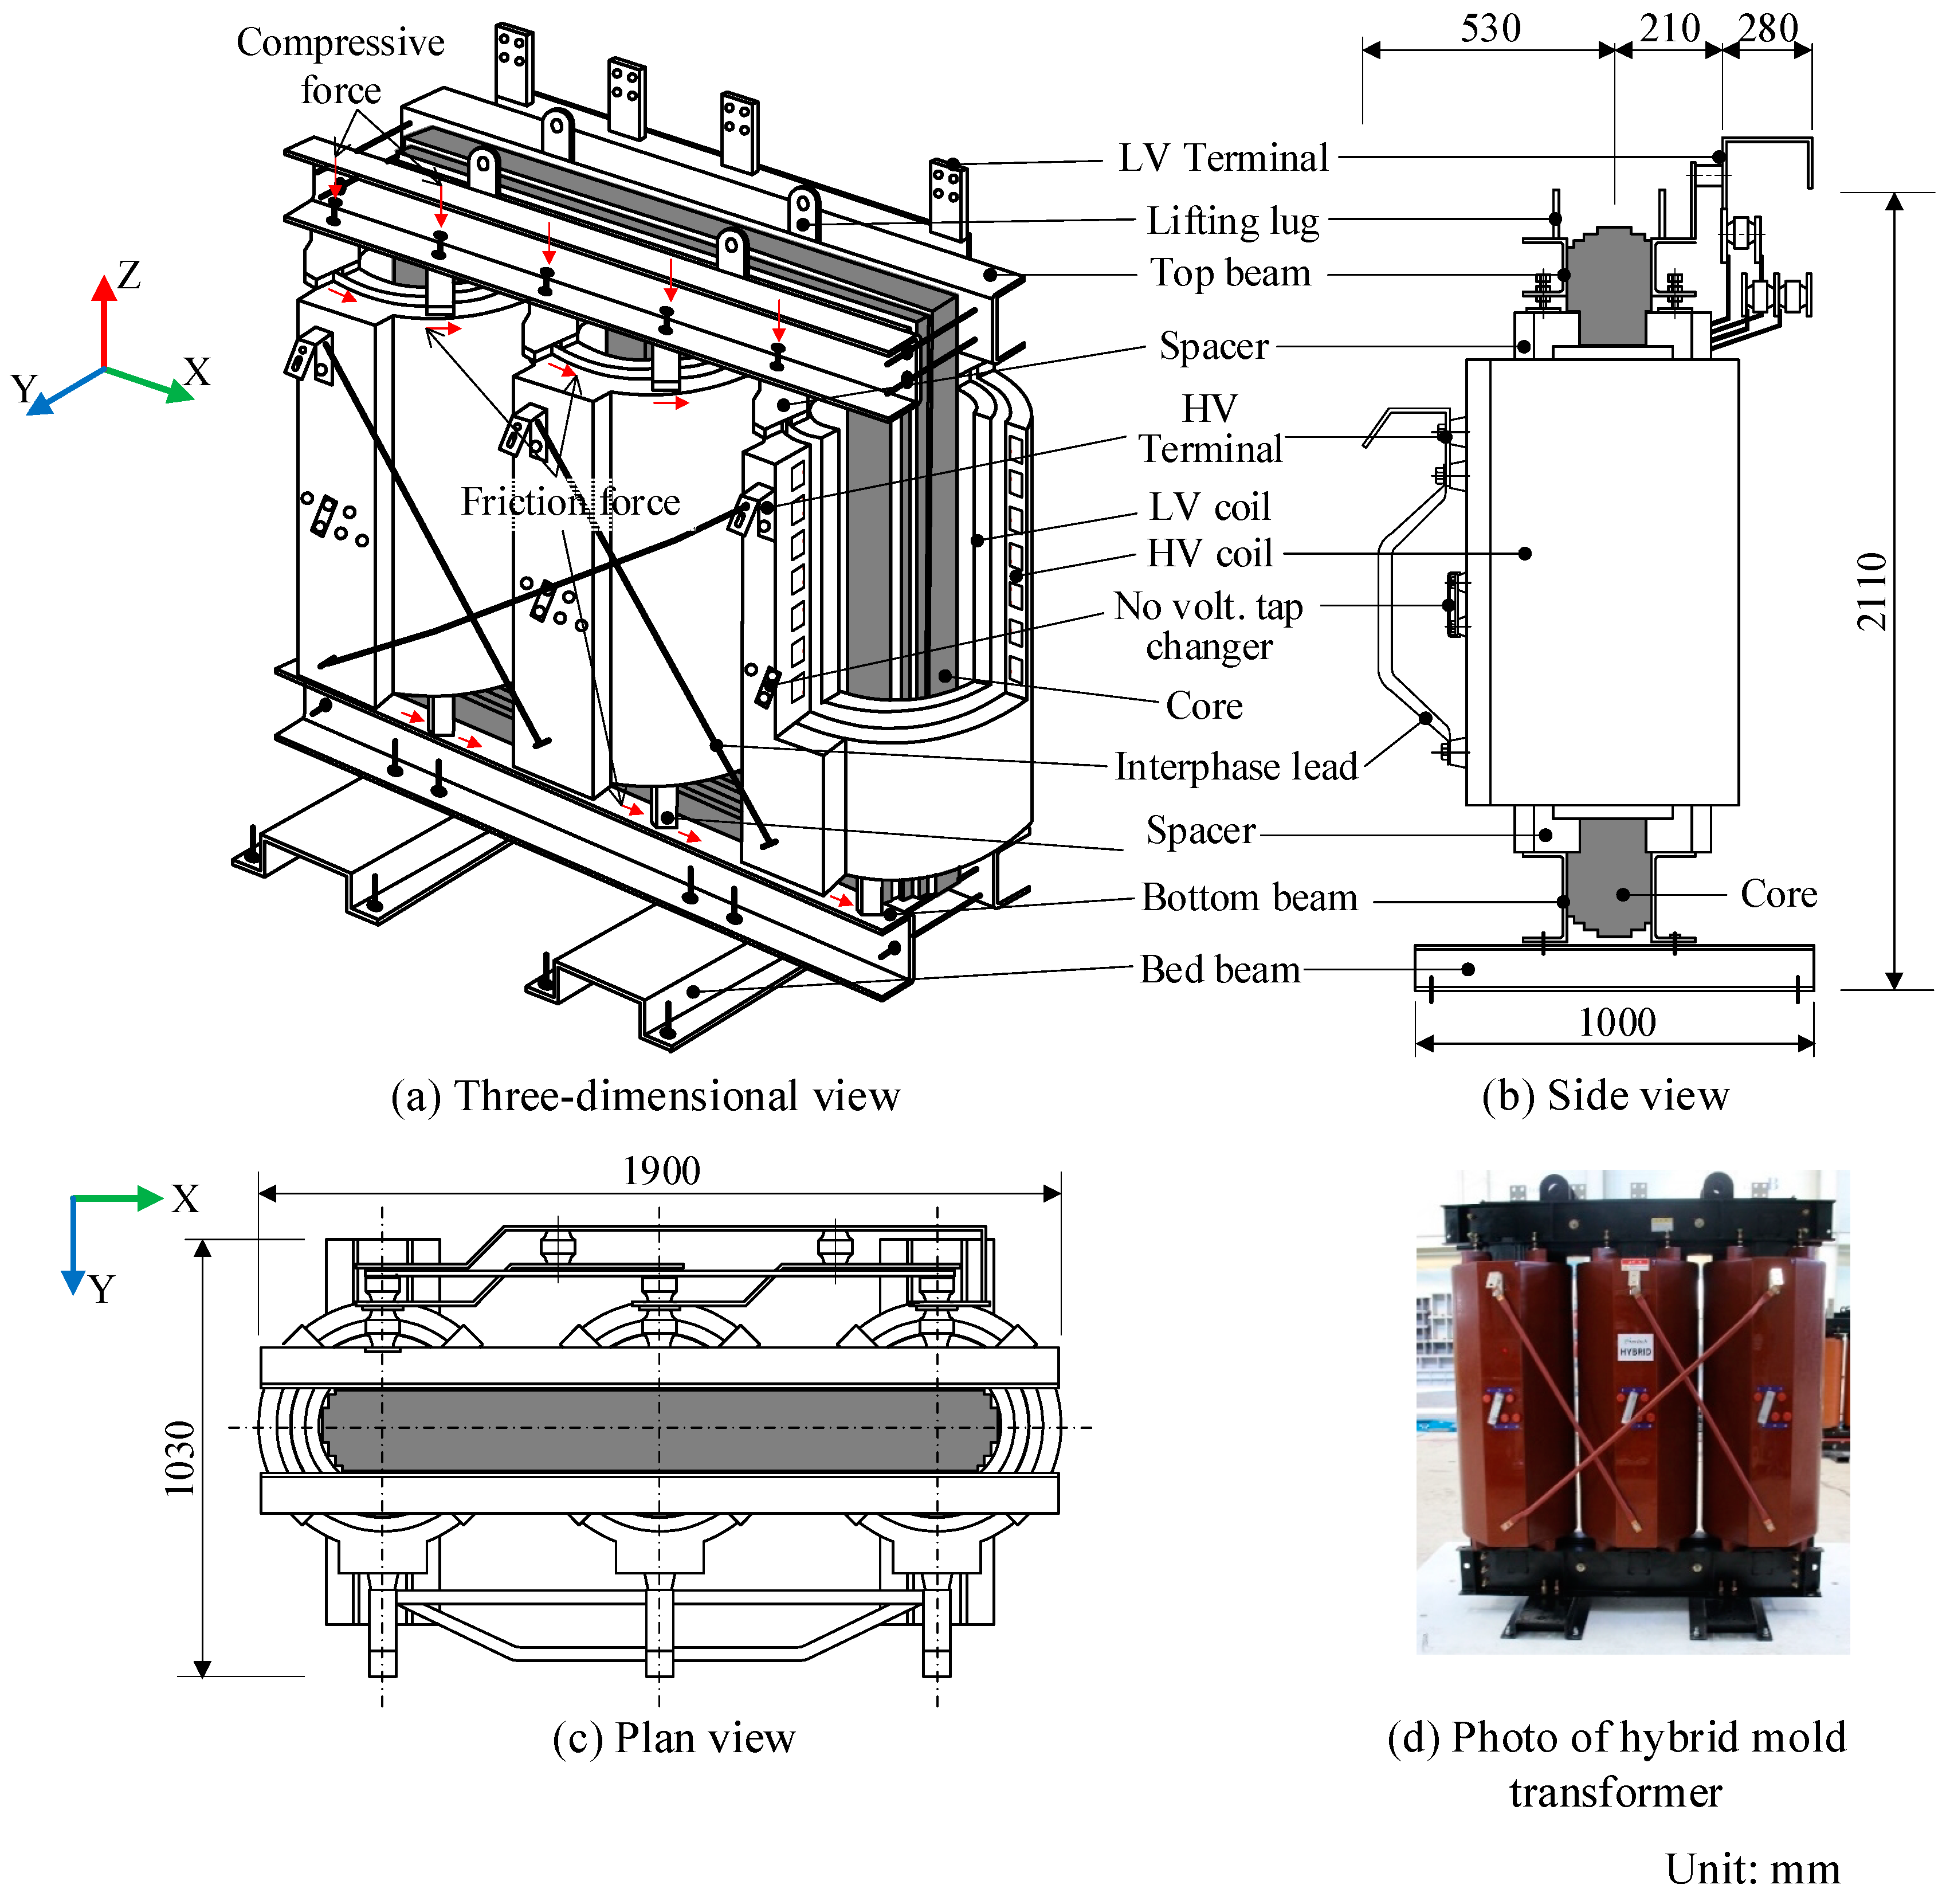
2.1. Test Specimen

The non-structural electrical component used as a prototype is a hybrid mold transformer that has the advantages of being a high-efficiency transformer and a power-saving function. Such transformers are power saving devices that can help save power in buildings by reducing unnecessary power loss. The hybrid mold transformer used in this study is cast resin-type with the maximum capacity of 1000 kVA and overall dimensions of 2110 mm (height) × 1900 mm (length) × 1030 mm (width). The total mass of the transformer was 3800 kg, according to the data provided by the manufacturer. Figure 1 and Table 1 present a brief description of the major components of the test specimen, which include core, frame system (top beam, bottom beam, and bed beam), high-voltage (HV) coils, low-voltage (LV) coils, and various accessories (lifting lugs, LV and HV terminal, spacer, etc.). Figure 1 shows that the core was made of cold rolled silicon steel and assembled with the frame system via bolt connections; the HV and LV coils were cast in epoxy with a mold under vacuum and were not fixed to the core but were indirectly connected through compressive forces generated from tightened bolts and friction through the spacers.

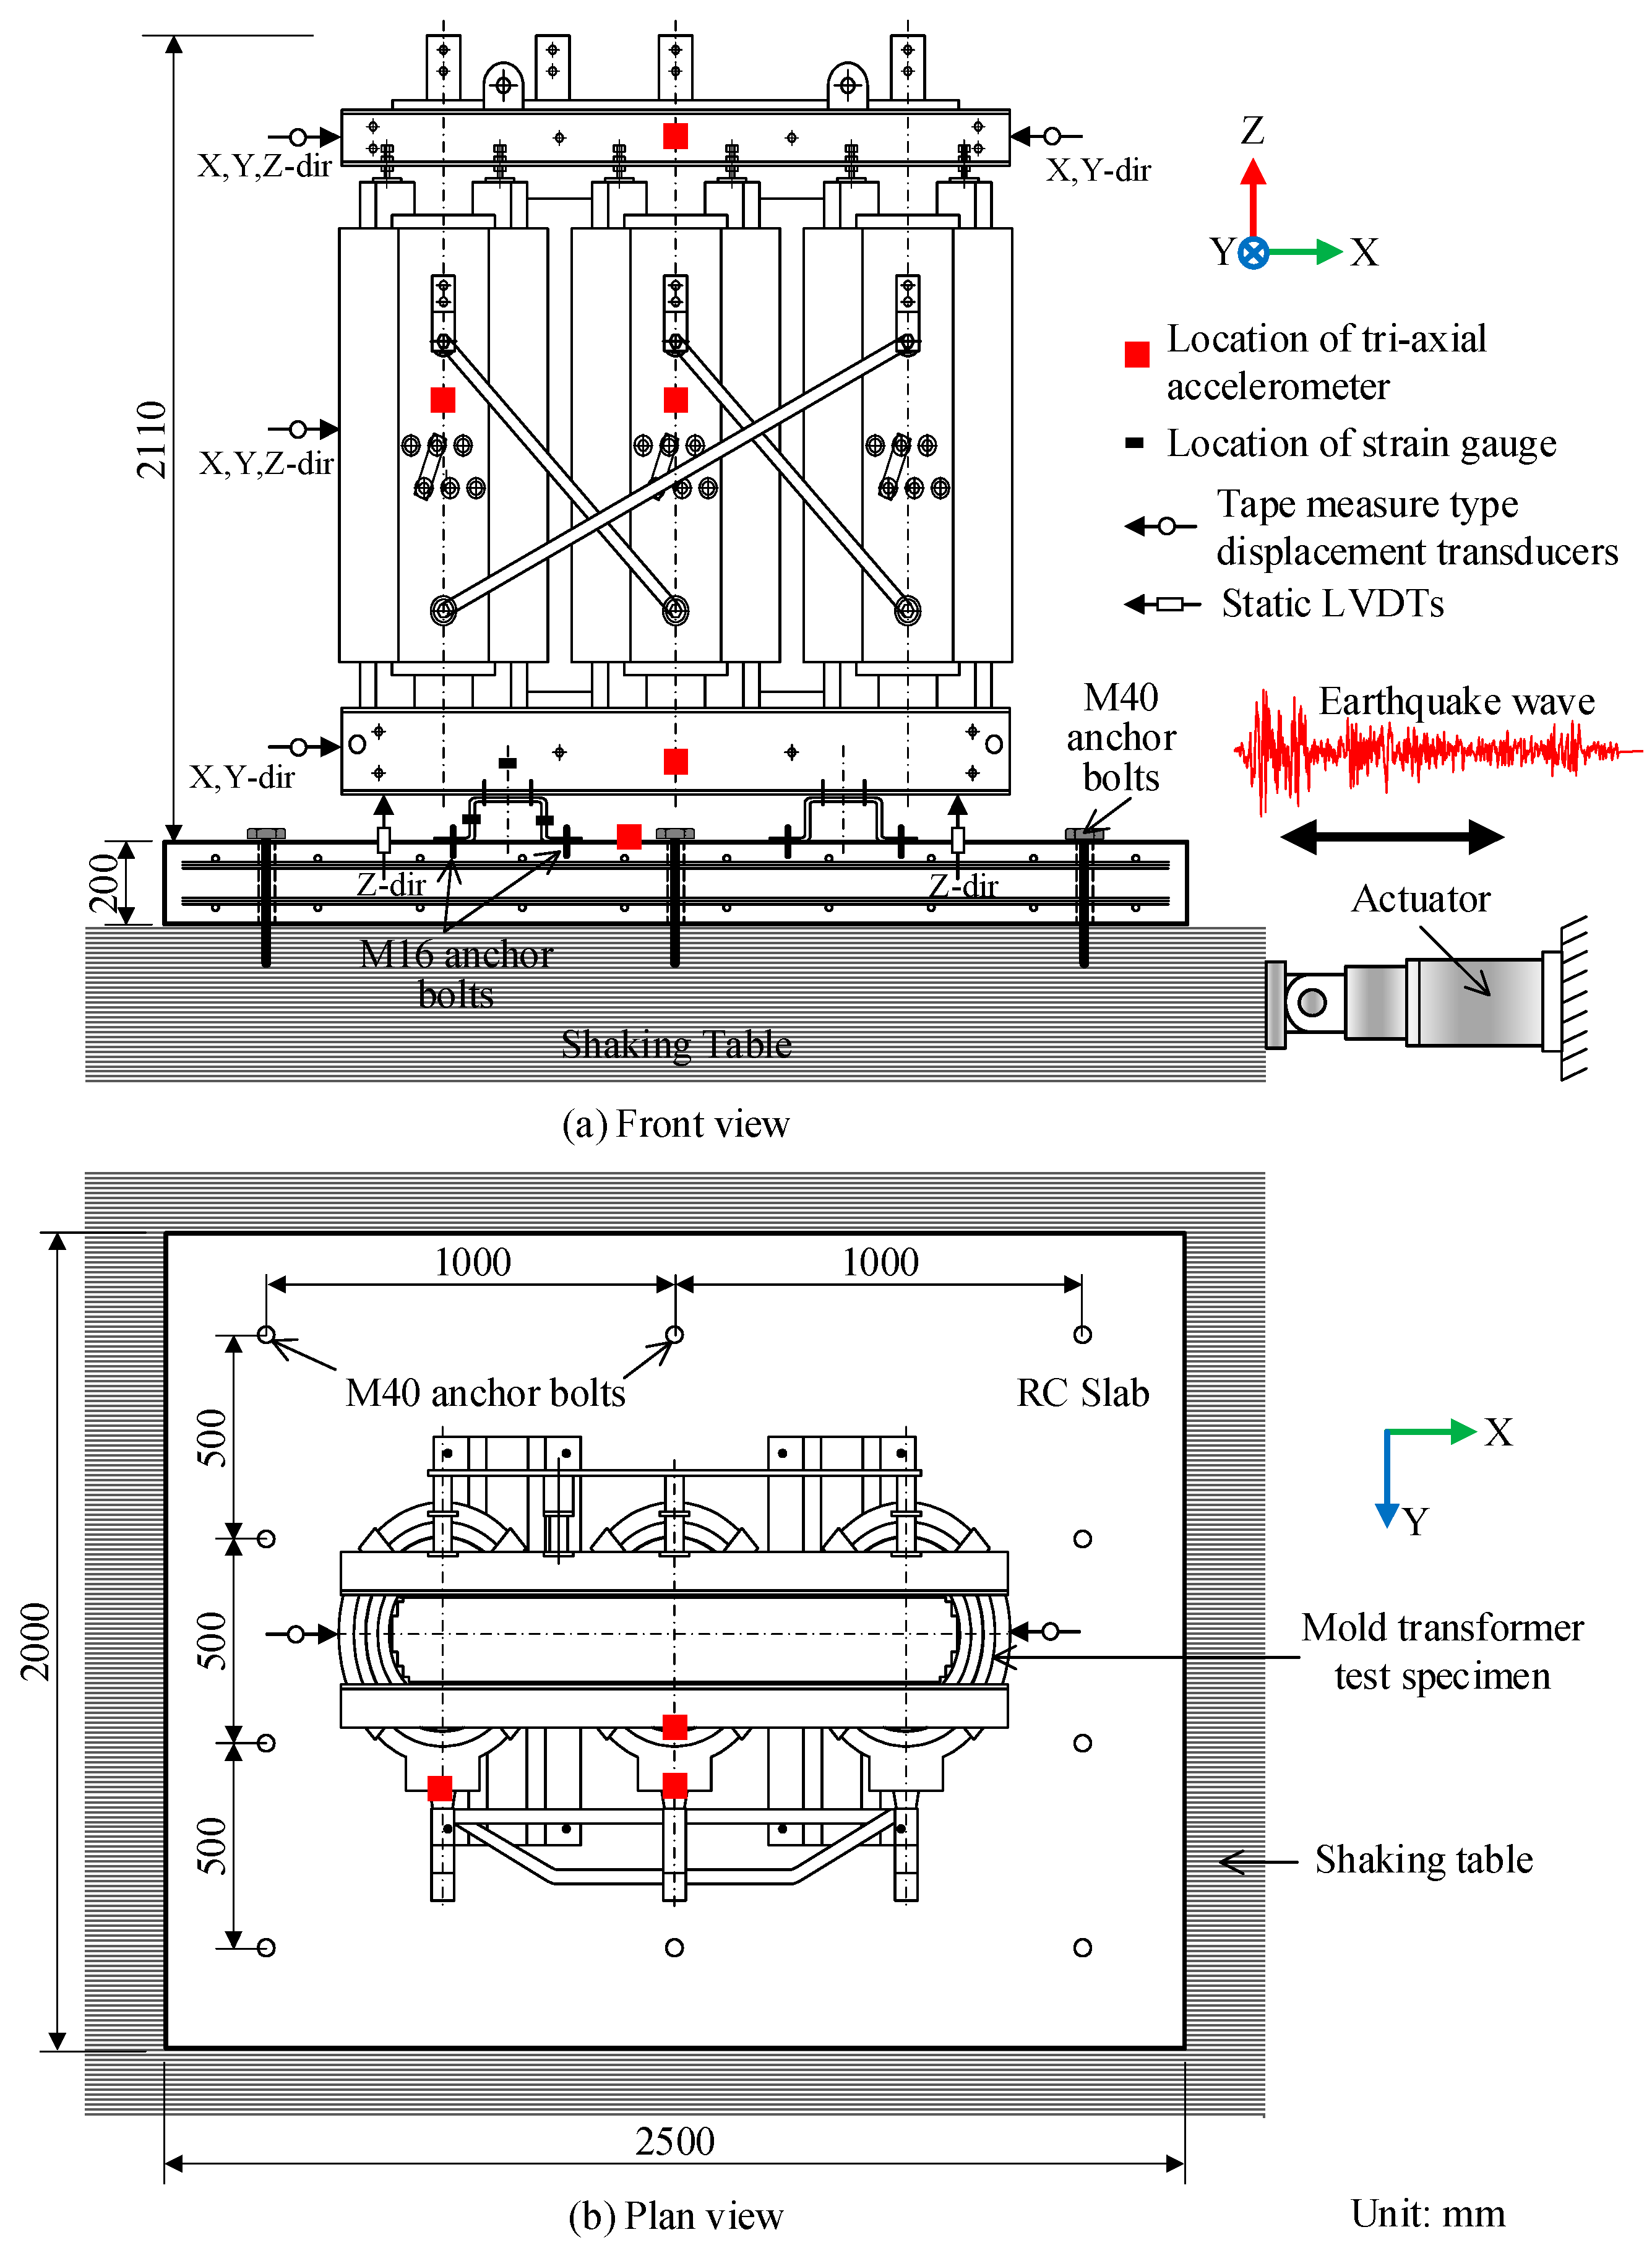
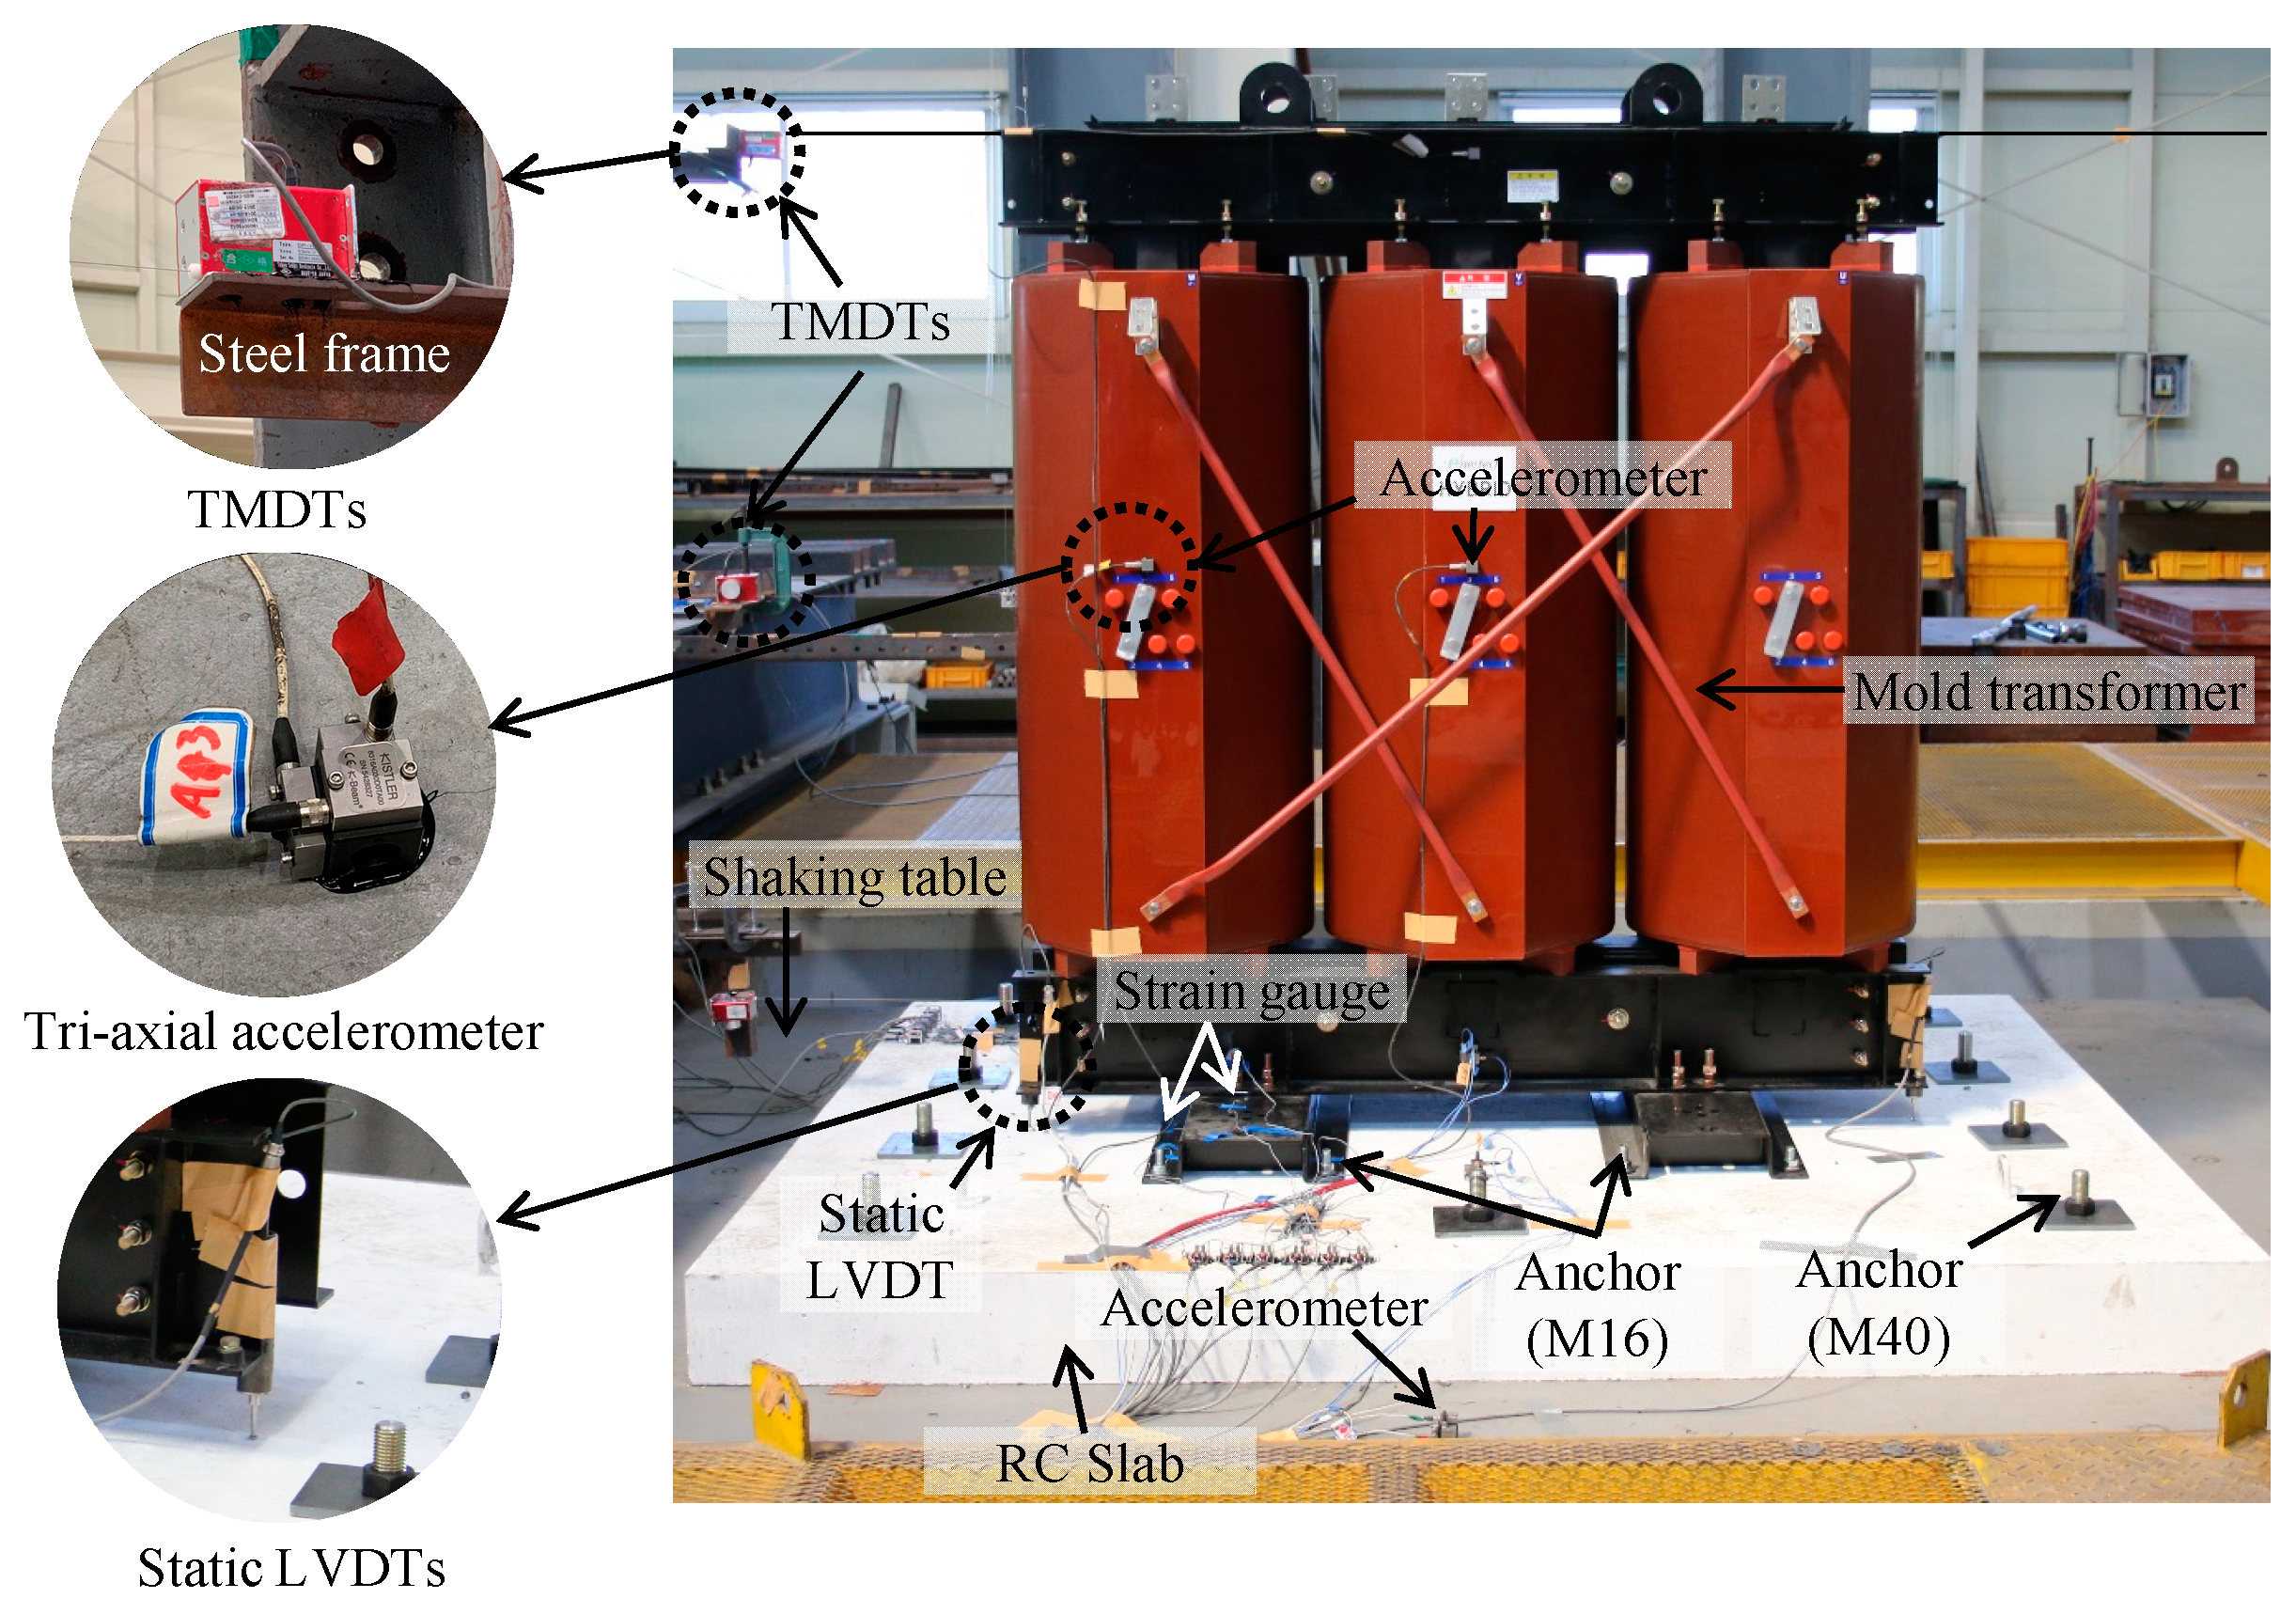
2.2. Test Setup and Measuring Instruments

Figure 2 and Figure 3 show the experimental setup and measuring instruments. The tri-axial tests were carried out using a shaking table, as shown in Figure 4. The main characteristics of the shaking table include: 4.0 m × 4.0 m plan dimensions, six degrees of freedom (SDOF), maximum acceleration of 1.5, 1.5, and 1.0× g in the X, Y, and Z-directions, respectively, maximum pay load of 300 kN, and maximum overturning moment of 1200 kNm. The table is capable of reproducing earthquake input ground motions through a system of eight hydraulic actuators. Table 2 summarizes the specifications of the shake table. The mold transformer test specimen was anchored to a reinforced concrete slab via bed beam systems with eight M16 anchor bolts with diameters of 15.88 mm, according to the manufacturer’s installation manual. The concrete slab was connected to the shaking table via M40 anchor bolts with diameters of 40 mm.
For measuring instruments, a total of five tri-axial accelerometers were used to record the acceleration response of the test specimen in three orthogonal directions during the tests. Four were mounted on the transformer at the top frame, left side, center zone, and the bed frame, while the fifth was mounted on top of the reinforced concrete (RC) slab (Figure 2 and Figure 3). The accelerometer used in this test has a maximum capacity of ±200× g. To measure the mold transformer displacement, tape measure type displacement transducers (TMDTs) and static linear variable displacement transducers (LVDTs) were employed. As shown in Figure 2 and Figure 3, a total of ten TMDTs were fixed on the steel frame out of the shaking table and positioned along the X, Y, and Z-directions at the top left and top right sides of the transformer; and two static LVDTs were positioned along the Z-direction at the bed beam. Furthermore, a total of six steel strain gauges were attached to the bottom beam and bed beam around the locations of linked bolts to monitor the variation of strain during shaking table tests, as shown in Figure 2.

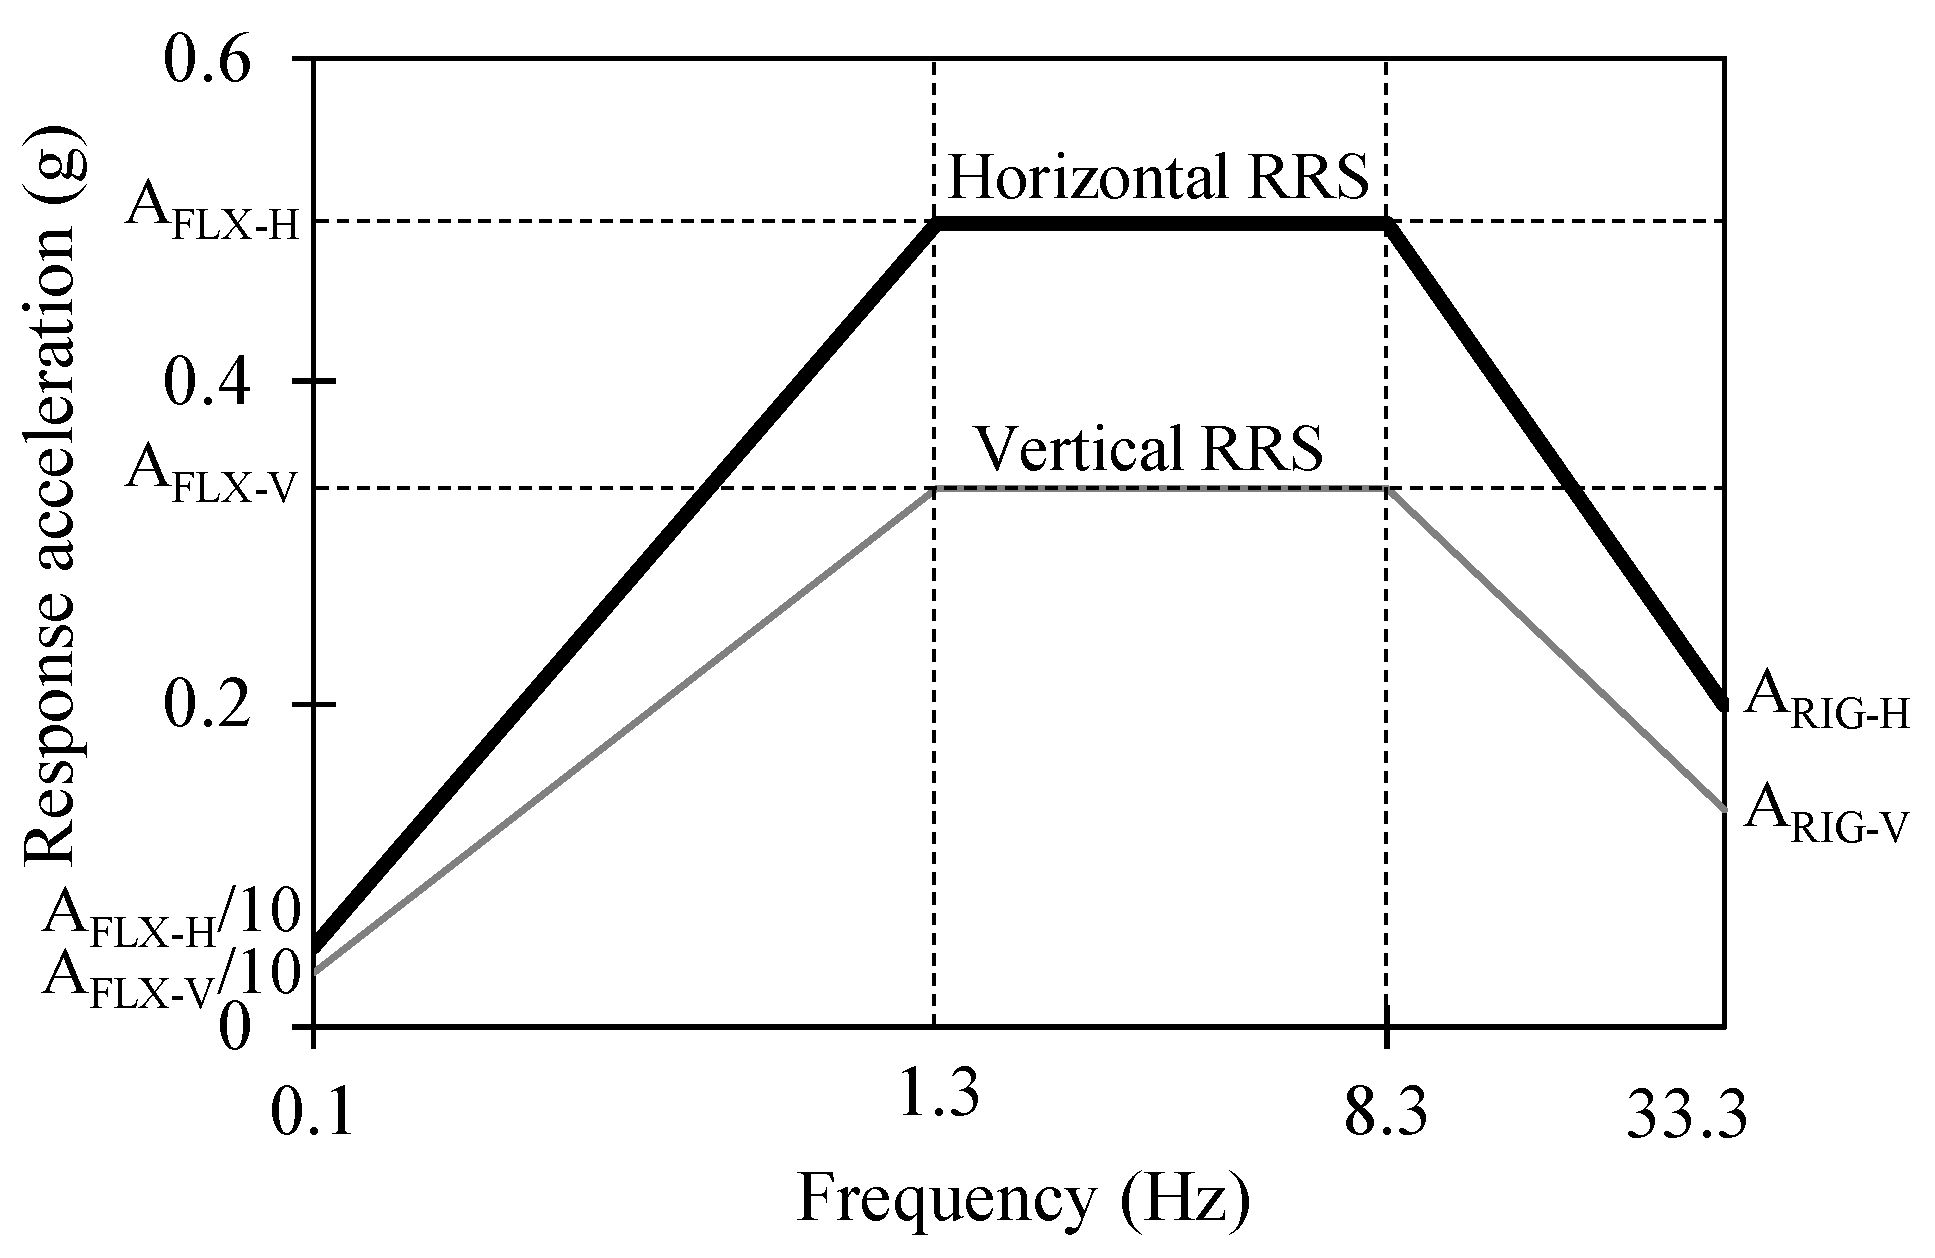
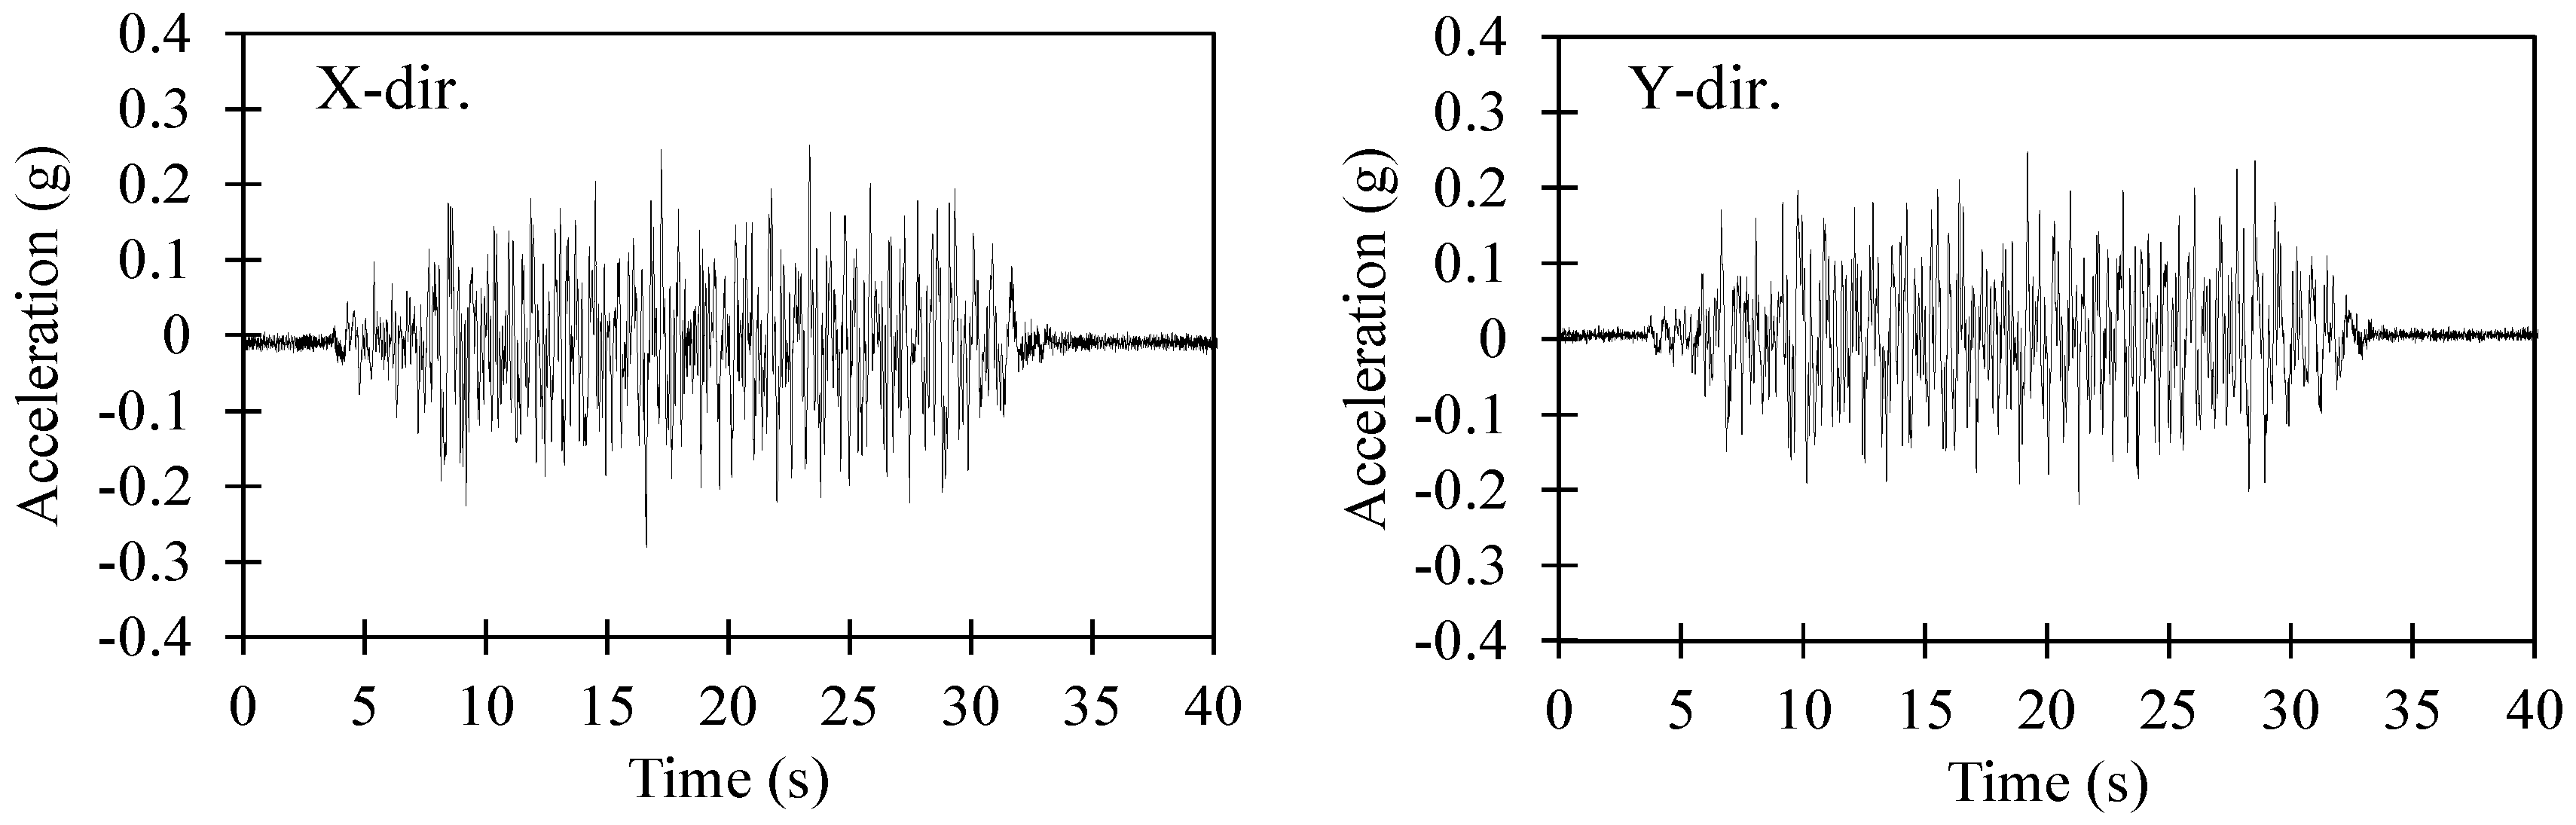
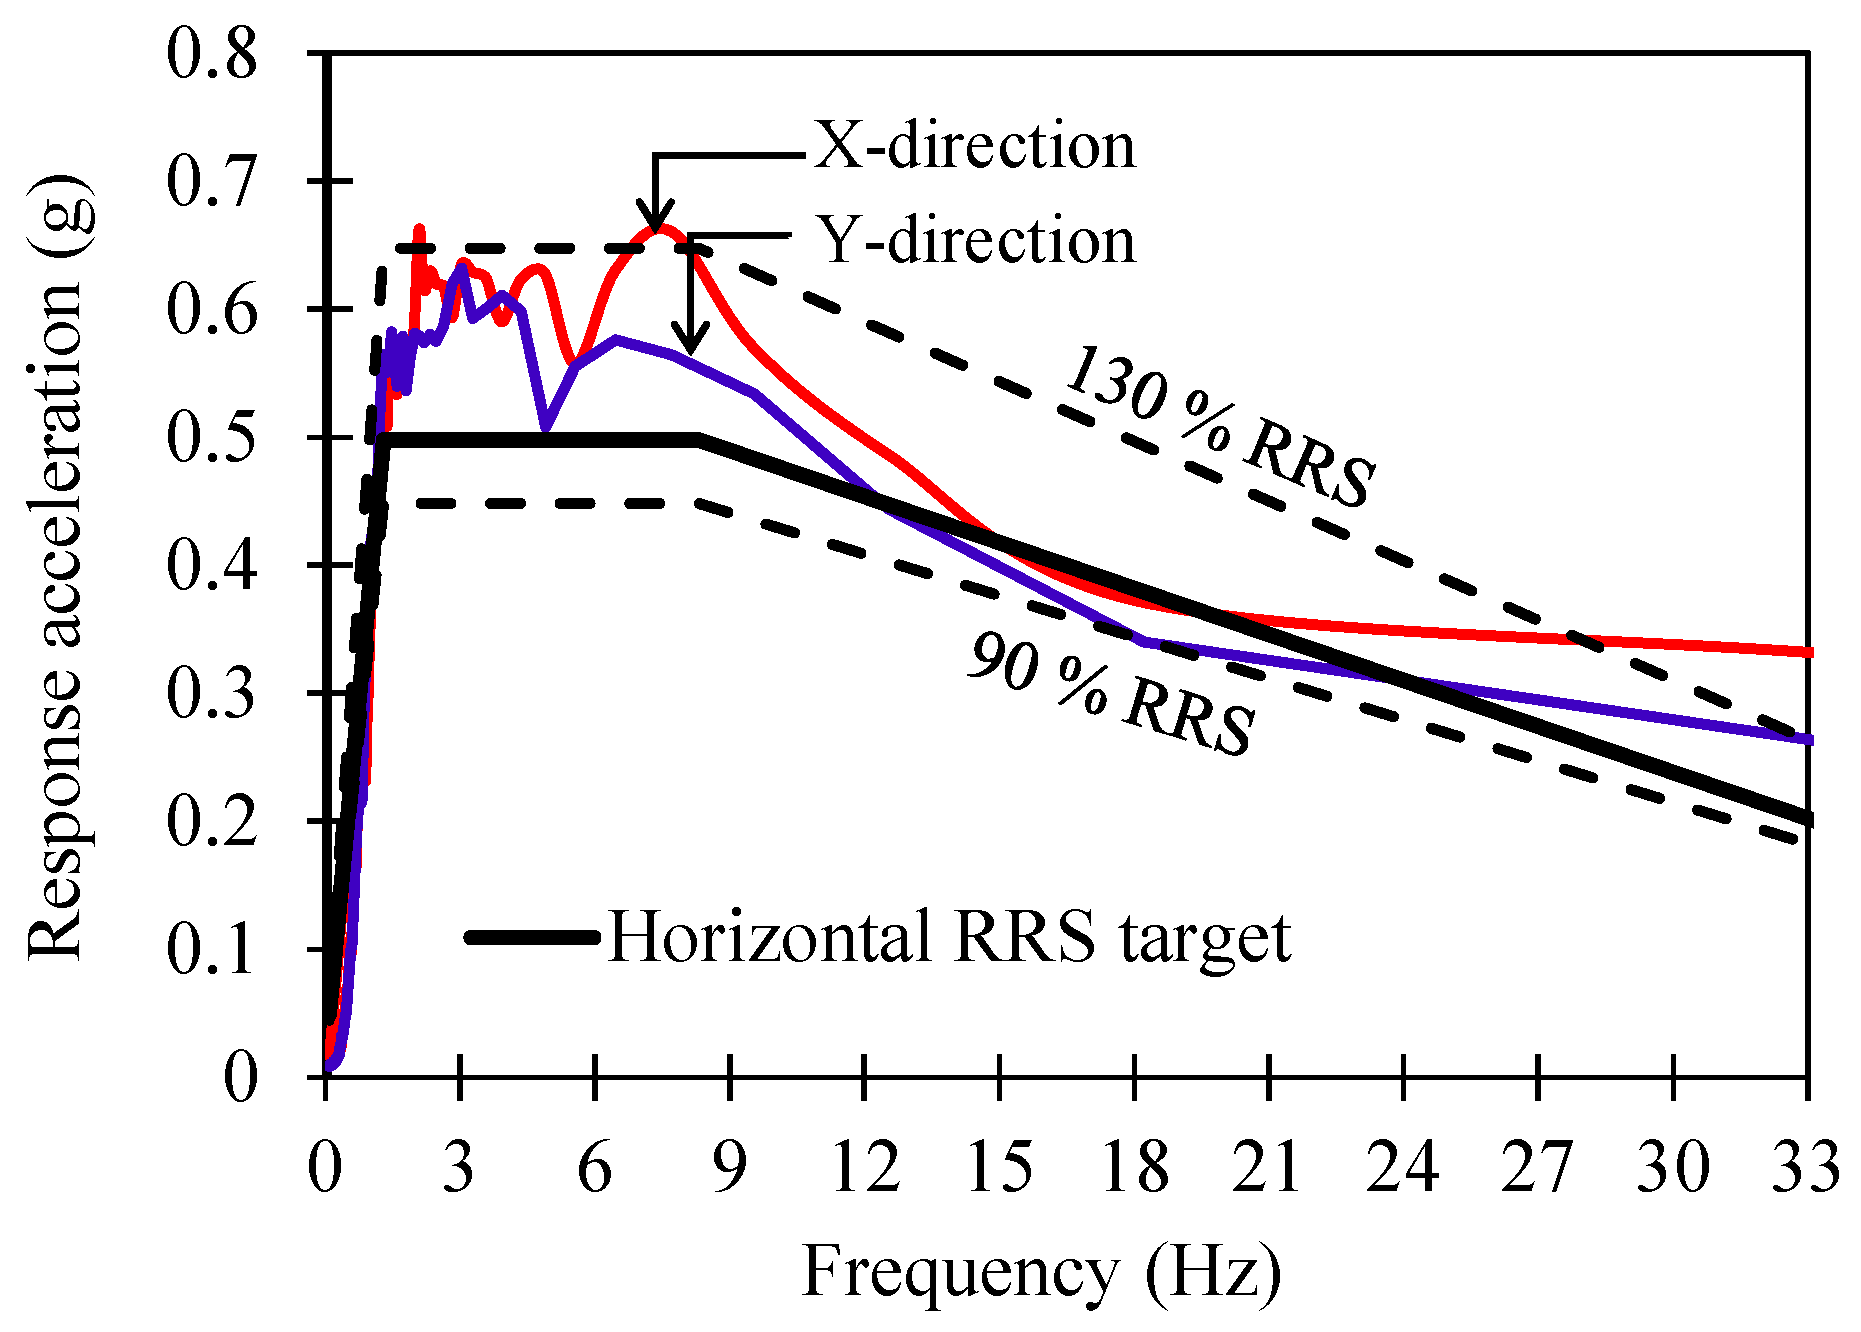
2.3. Input and Testing Protocol

In this study, tri-axial accelerations were generated according to the ICC-ES AC156 code [14]. The input acceleration-time history was artificially generated to match the required response spectrum (RRS) specified by the AC156 code for non-structural components that have fundamental frequencies in the range of 1.3–33.3 Hz. Figure 5 shows that for horizontal RRS, the horizontal spectral acceleration for flexible components, AFLX-H, and horizontal spectral acceleration for rigid components ARIG-H, were determined as:
A F L X H = S D S ( 1 + 2 z h ) 1.6 S D S ,  
A R I G H = 0.4 S D S ( 1 + 2 z h ) ,  
S D S = 2 3 F A S S ,  
where SDS is the site-specific ground spectral acceleration factor, defined according to the Korea Building Code [16], (SDS = 0.498 in this study); z and h are the height of the component’s attachment point to the structure and the average height of the building roof with respect to the base, respectively; F A is the site soil coefficient; and S S is the mapped maximum considered earthquake spectral acceleration at a short period. In the current study, the ratio z/h was equal to 0, with the assumption that the mold transformer was located at the base of the structure.
Regarding vertical RRS, the vertical spectral acceleration for flexible components, AFLX-V, and vertical spectral acceleration for rigid components, ARIG-V, were determined as [14]:
A F L X V = 0.67 A F L X H ,  
A R I G V = 0.27 A R I G H   .  
Moreover, according to the specifications in ICC-ES AC156 [14] and Eurocode 8 [17], the elastic acceleration spectrum acquired from the selected artificial acceleration time history shall be in a range of 90–130% of RRS, and the matching procedure shall be validated for a range of frequency from 1.3 to 33.3 Hz.
Table 3 summarizes the test program in this study. The test nos. 4–7, 11–14, 18, and 19 are the primary tests. The initial input acceleration time histories in the X, Y, and Z-directions of test no. 7 were artificially generated based on the AC156 code using Equations (1)–(5) and denoted as AC156_100. In the test nos. 4–6, 11–14, 18, and 19, the acceleration magnitudes were scaled from AC156_100 using different scaling factors in the range of 25–300%, corresponding to SDS in the range of 0.12–1.49× g, and denoted as AC156_25 to AC156_300. Figure 6 shows the acceleration time history in the X and Y-directions of AC156_100 used in test no. 7, whereas Figure 7 shows the comparison between the result of the input spectrum of AC156_100 in the X and Y-directions for a damping ratio of 5% and the AC156 target spectrum, as well as its limited boundaries. As shown in the figure, the AC156_100 input spectrum is in a range with a lower limit of 90% RRS and an upper limit of 130% RRS. Table 3 also summarizes the input peak ground accelerations (PGA) of the primary tests corresponding to the scaling factors for each test.
Along with the primary tests, the intermediate tests (test nos. 1–3, 8–10, 15–17, and 20–22) were carried out for dynamic identification of the test specimen. Such tests were performed in the X, Y, and Z-directions by applying low-amplitude random input signals with the frequency domain in the range of 1–50 Hz, according to FEMA 461 [15]. To be more specific, test nos. 1–3 were carried out before the AC156_25 (test no. 4) in the X, Y, and Z-direction, respectively; test nos. 8–10 were carried out after the AC156_100 (test no. 7) in the X, Y, and Z-direction, respectively; test nos. 15–17 were carried out after the AC156_200 (test no. 14) in the X, Y, and Z-direction, respectively; and test nos. 20–22 were carried out after the AC156_300 (test no. 19) in the X, Y, and Z-direction, respectively. Note that each dynamic identification test had the same peak acceleration amplitude of approximately ±0.2× g, but had different acceleration time history.

3. Test Results and Discussion

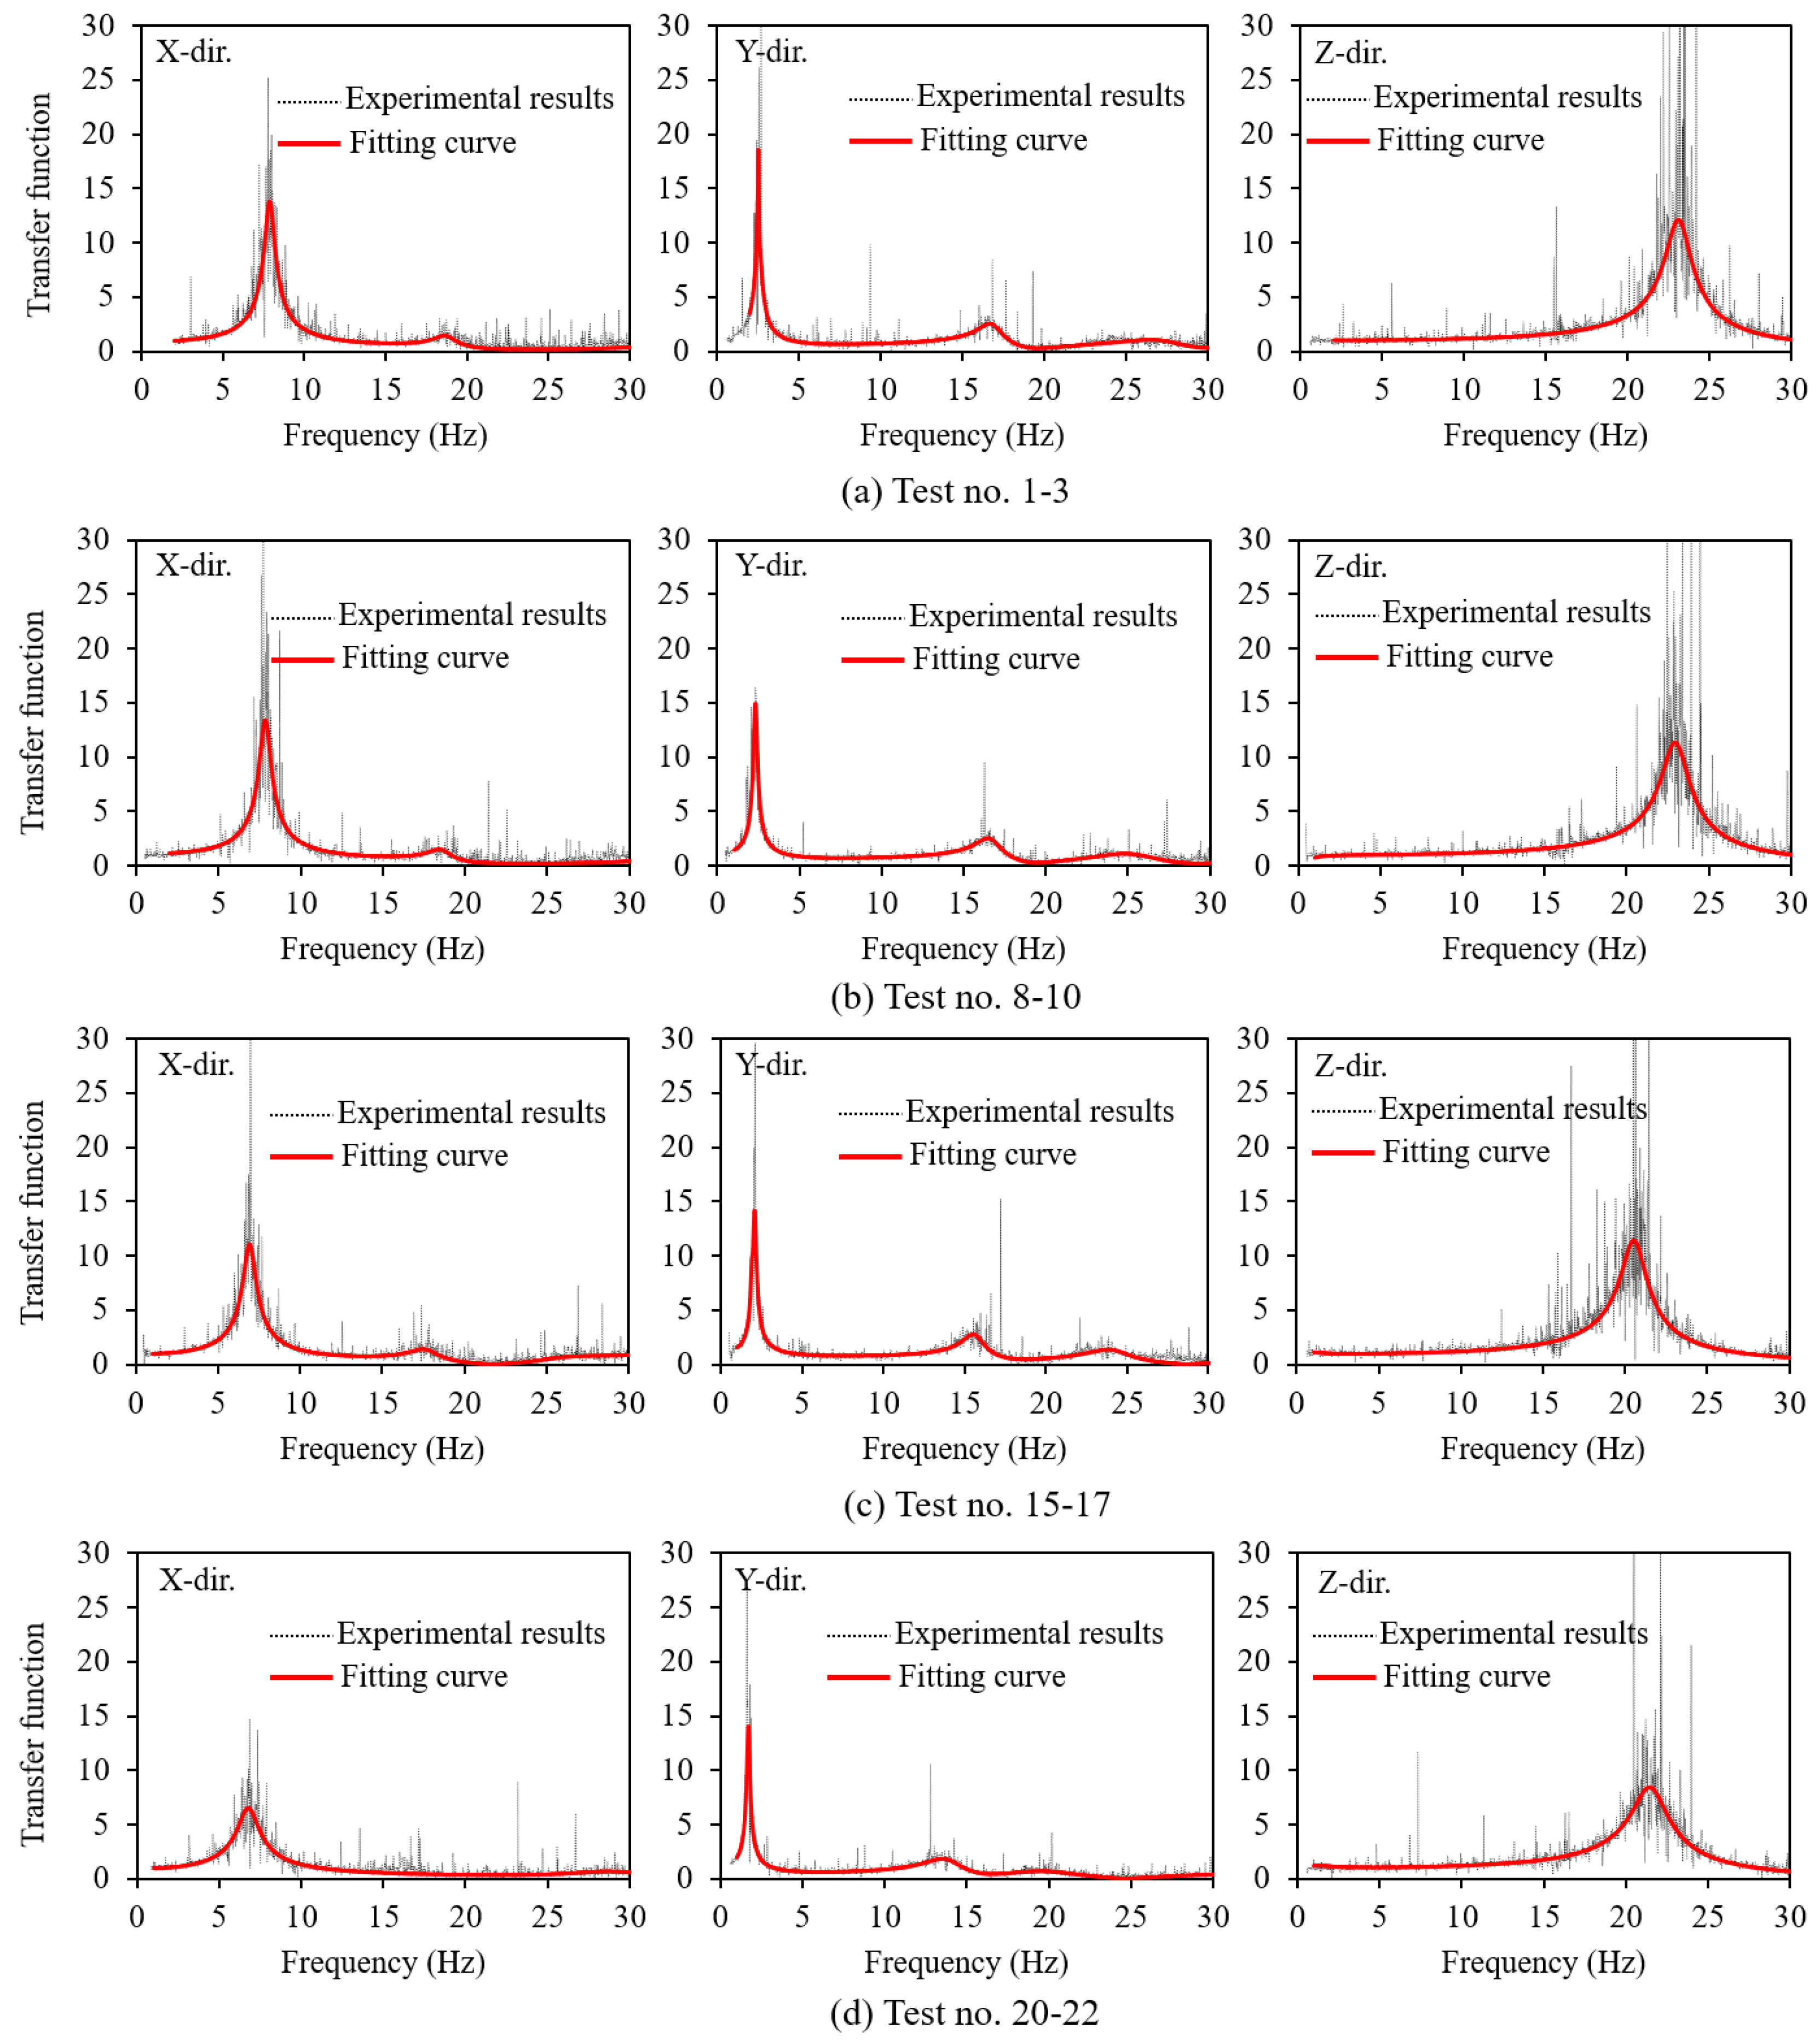
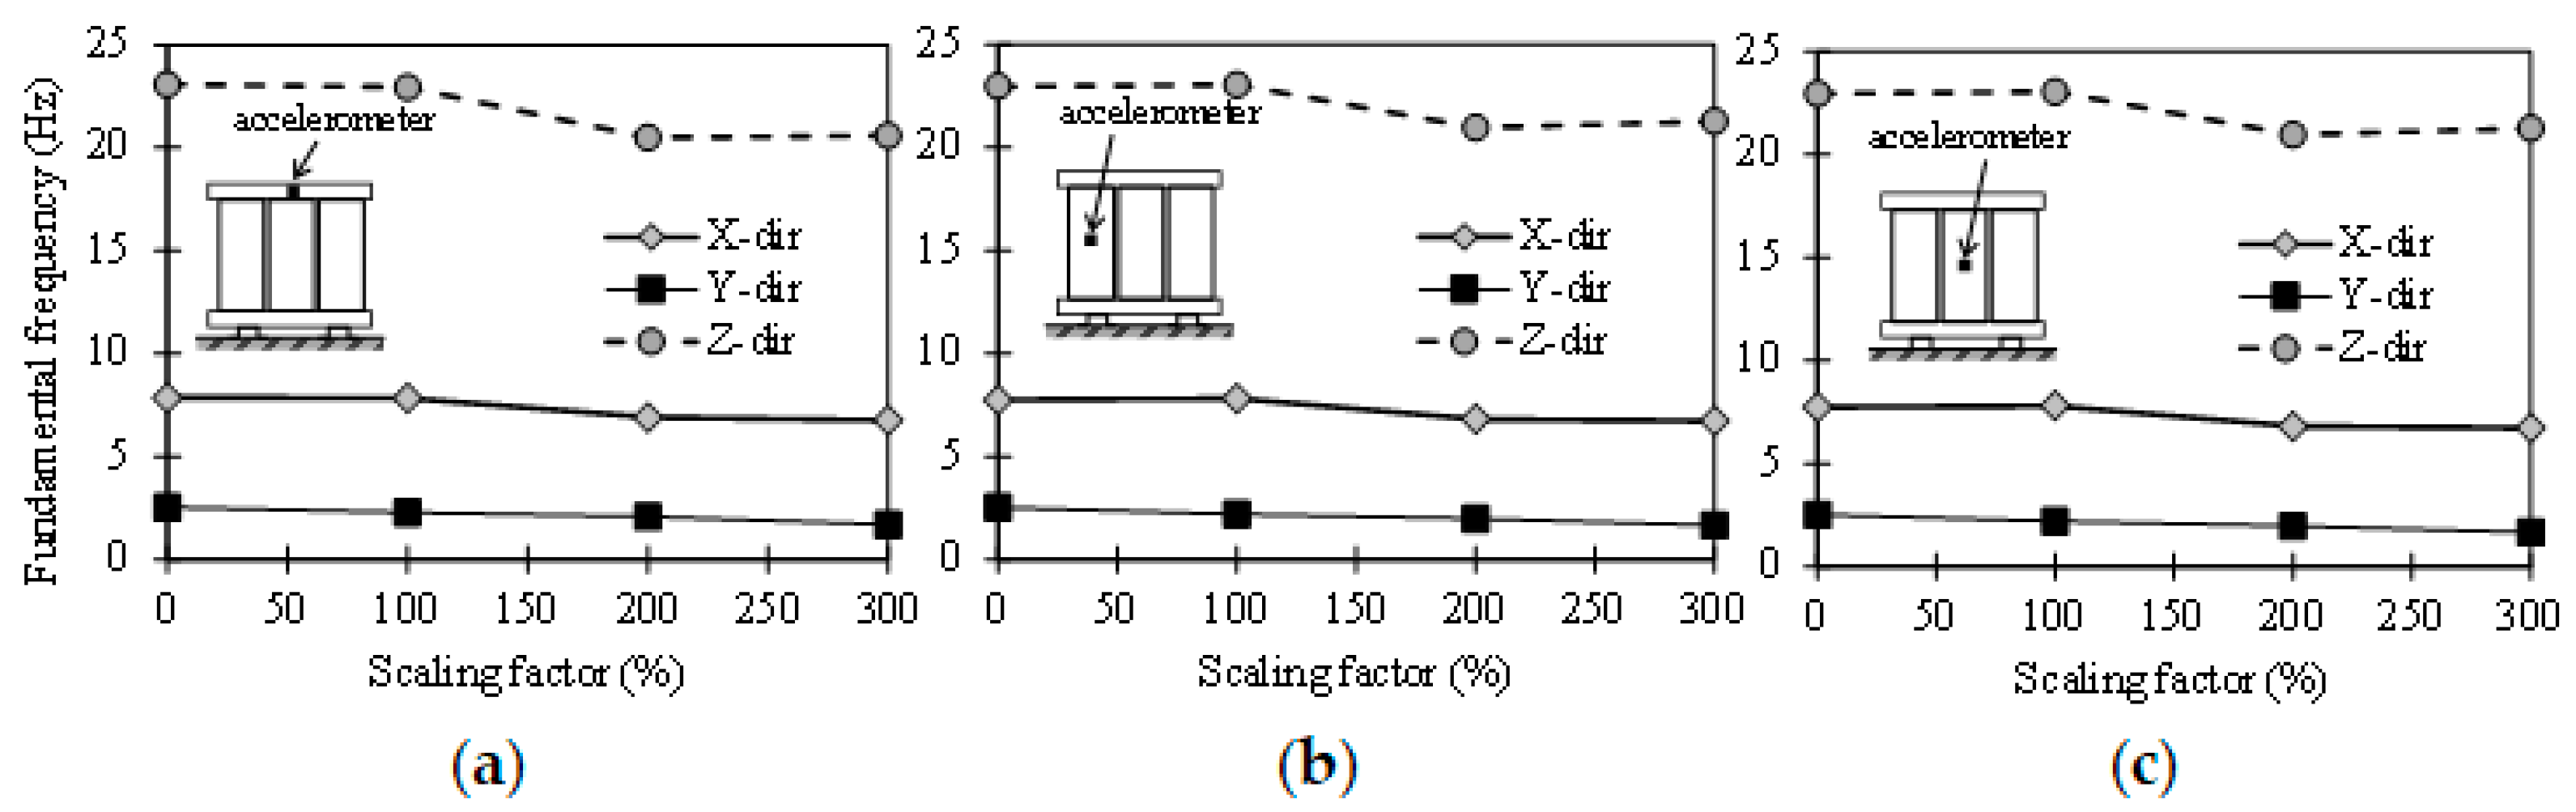
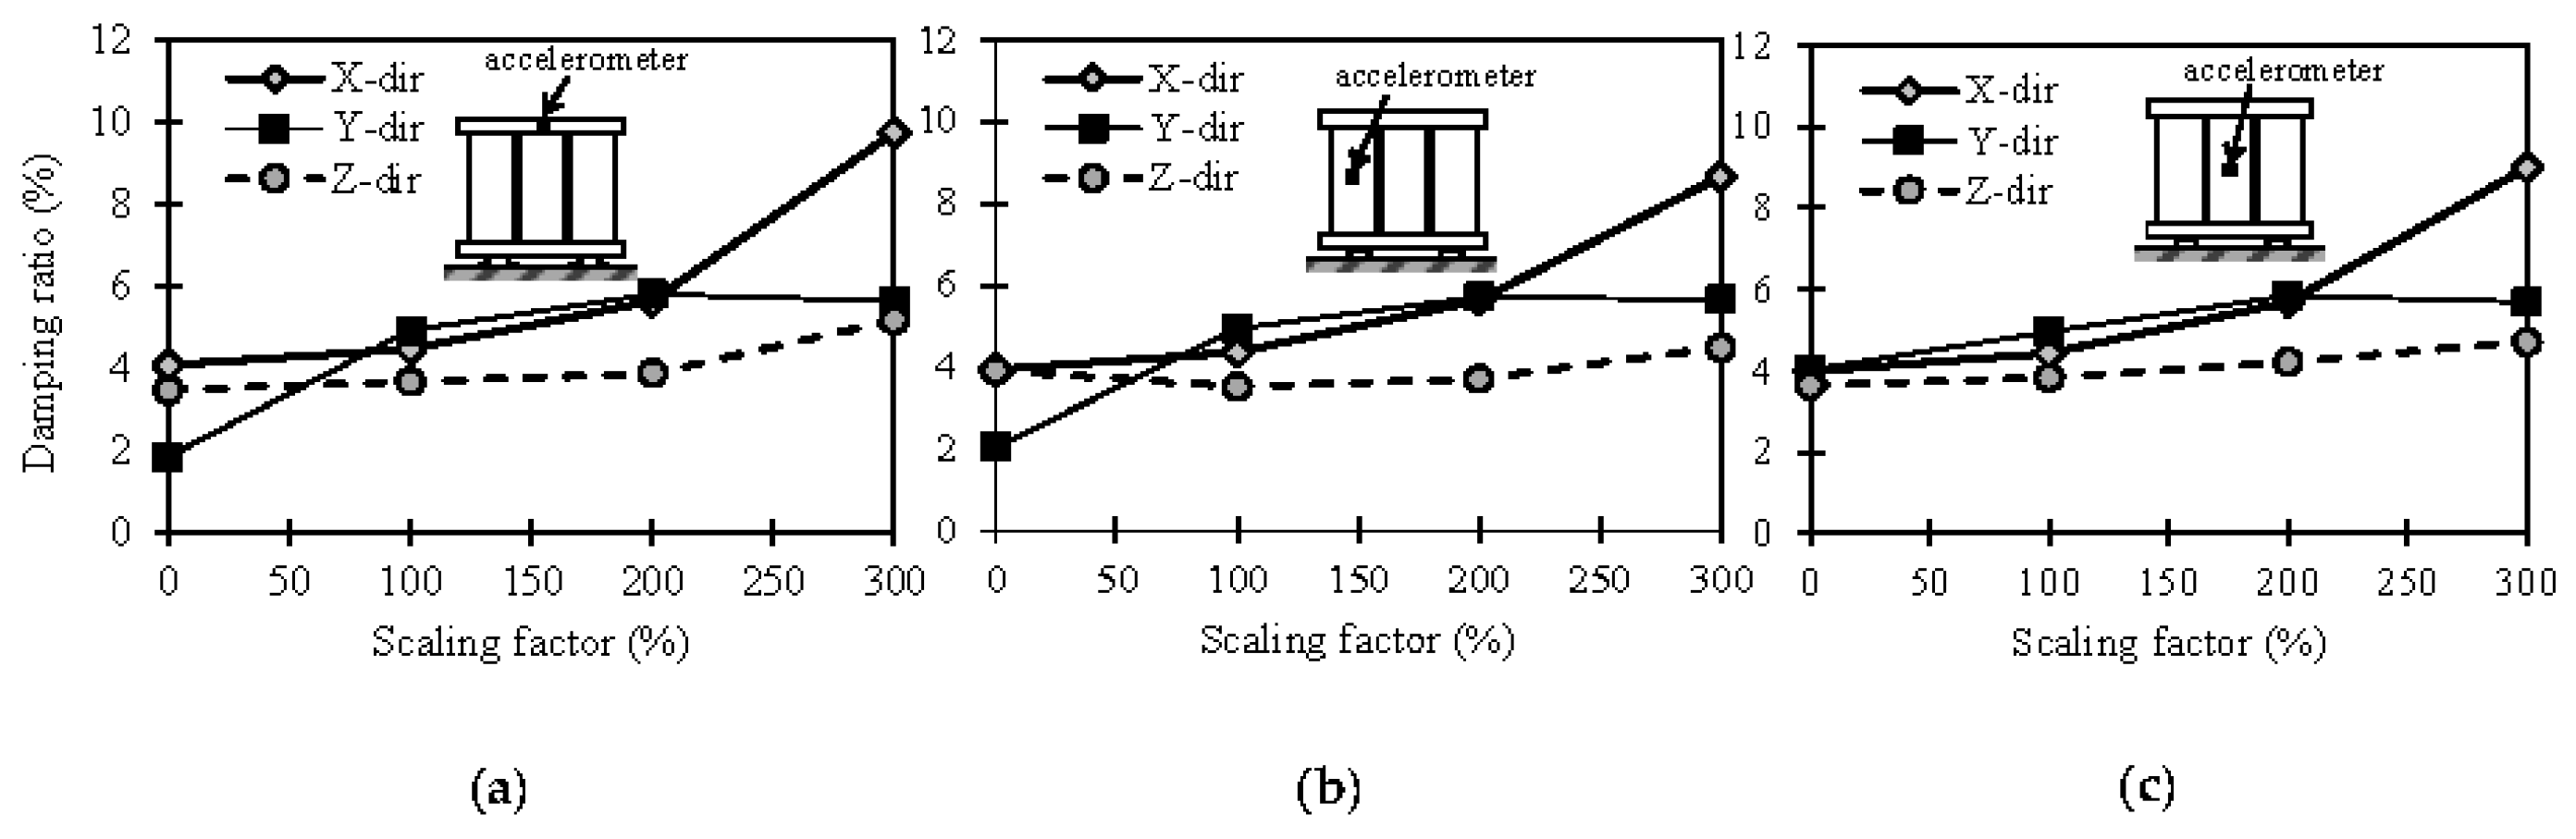
3.1. Dynamic Identification

The dynamic properties, including the natural frequencies, f, and damping ratios, ξ, of the test specimen were investigated in this study. The acceleration responses obtained from dynamic identification tests were analyzed to identify the dynamic properties of the test specimen in both the horizontal and vertical directions. The fundamental frequencies were evaluated based on the transfer function method in the frequency domain. The transfer function amplitude was determined as the ratio between the Fourier transformation of the input signals, and the response output signals collected from accelerometer data installed on the several points of the mold transformer [7,8,11,18]. The sampling frequency of the accelerometer in this study was equal to 512 Hz, and the size of each data block (window) was set to 5120, corresponding to 10 s. The transfer function amplitude has local peaks at the natural frequency of the system [18].
Figure 8 illustrates the dynamic identification results and transfer function curves evaluated from the data recorded at the top beam. To eliminate the noise from the experimental results and obtain the fitting curves, the estimation algorithm was used to obtain the continuous-time transfer function model using time-domain data from the input and output signals [19]. From the Fourier transformation results, the data gathering showed an inefficient trend in the high-frequency domain, due to the fluctuation. Therefore, to get an effective transfer function model, the frequency domain was defined as below 30 Hz to filter the input and output data.
Figure 9 shows the results of the fundamental frequency as a function of the scaling factor at different locations of the test specimen: the top beam, the left coil, and the center coil. In general, the initial fundamental frequencies of the mold transformer were almost the same regardless of the location, and those in the X, Y, and Z-directions were 7.87, 2.52, and 23.12 Hz, respectively. In the Y-direction, the specimen showed a low natural frequency, which indicated low stiffness in this direction. The fundamental frequency in the Z-direction was much larger than those in the X and Y-directions. This was attributed to the contribution of axial stiffness of all anchors in the vertical direction, leading to the high stiffness of the test specimen. Similar test results and trends were observed in the previous study by Wang et al. [9], despite the discrepancy in the electrical testing prototype. In Figure 9, since the damage grew as the input acceleration amplitude increased, the fundamental frequency shows a decreasing trend; however, the level of frequency decline was not significant.
Furthermore, after determining the transfer function curves in the frequency domain, the damping ratios were then calculated at a given resonant of frequency using the half-power bandwidth method [20,21,22], as follows:
ξ = f 2 f 1 2 f o × 100 % ,  
where fo (Hz) is the frequency at the peak transfer function amplitude, and f1 and f2 (Hz) are the frequencies associated with the amplitude that is ( 1 / 2 ) times lower and higher than the peak transfer function amplitude, respectively. Figure 10 presents the variation of damping ratio measured at several points on the test specimen according to the increase of scaling factor. Overall, the initial damping ratio of the test specimen was in the range of 2–4%. The damping ratio increased to 4–10%, along with the increase of input ground motion amplitude due to the damage accumulated in the transformer as the input acceleration amplitude increased. The analogous results were observed in the previous study by Fathali [12,13] on non-structural electrical equipment.

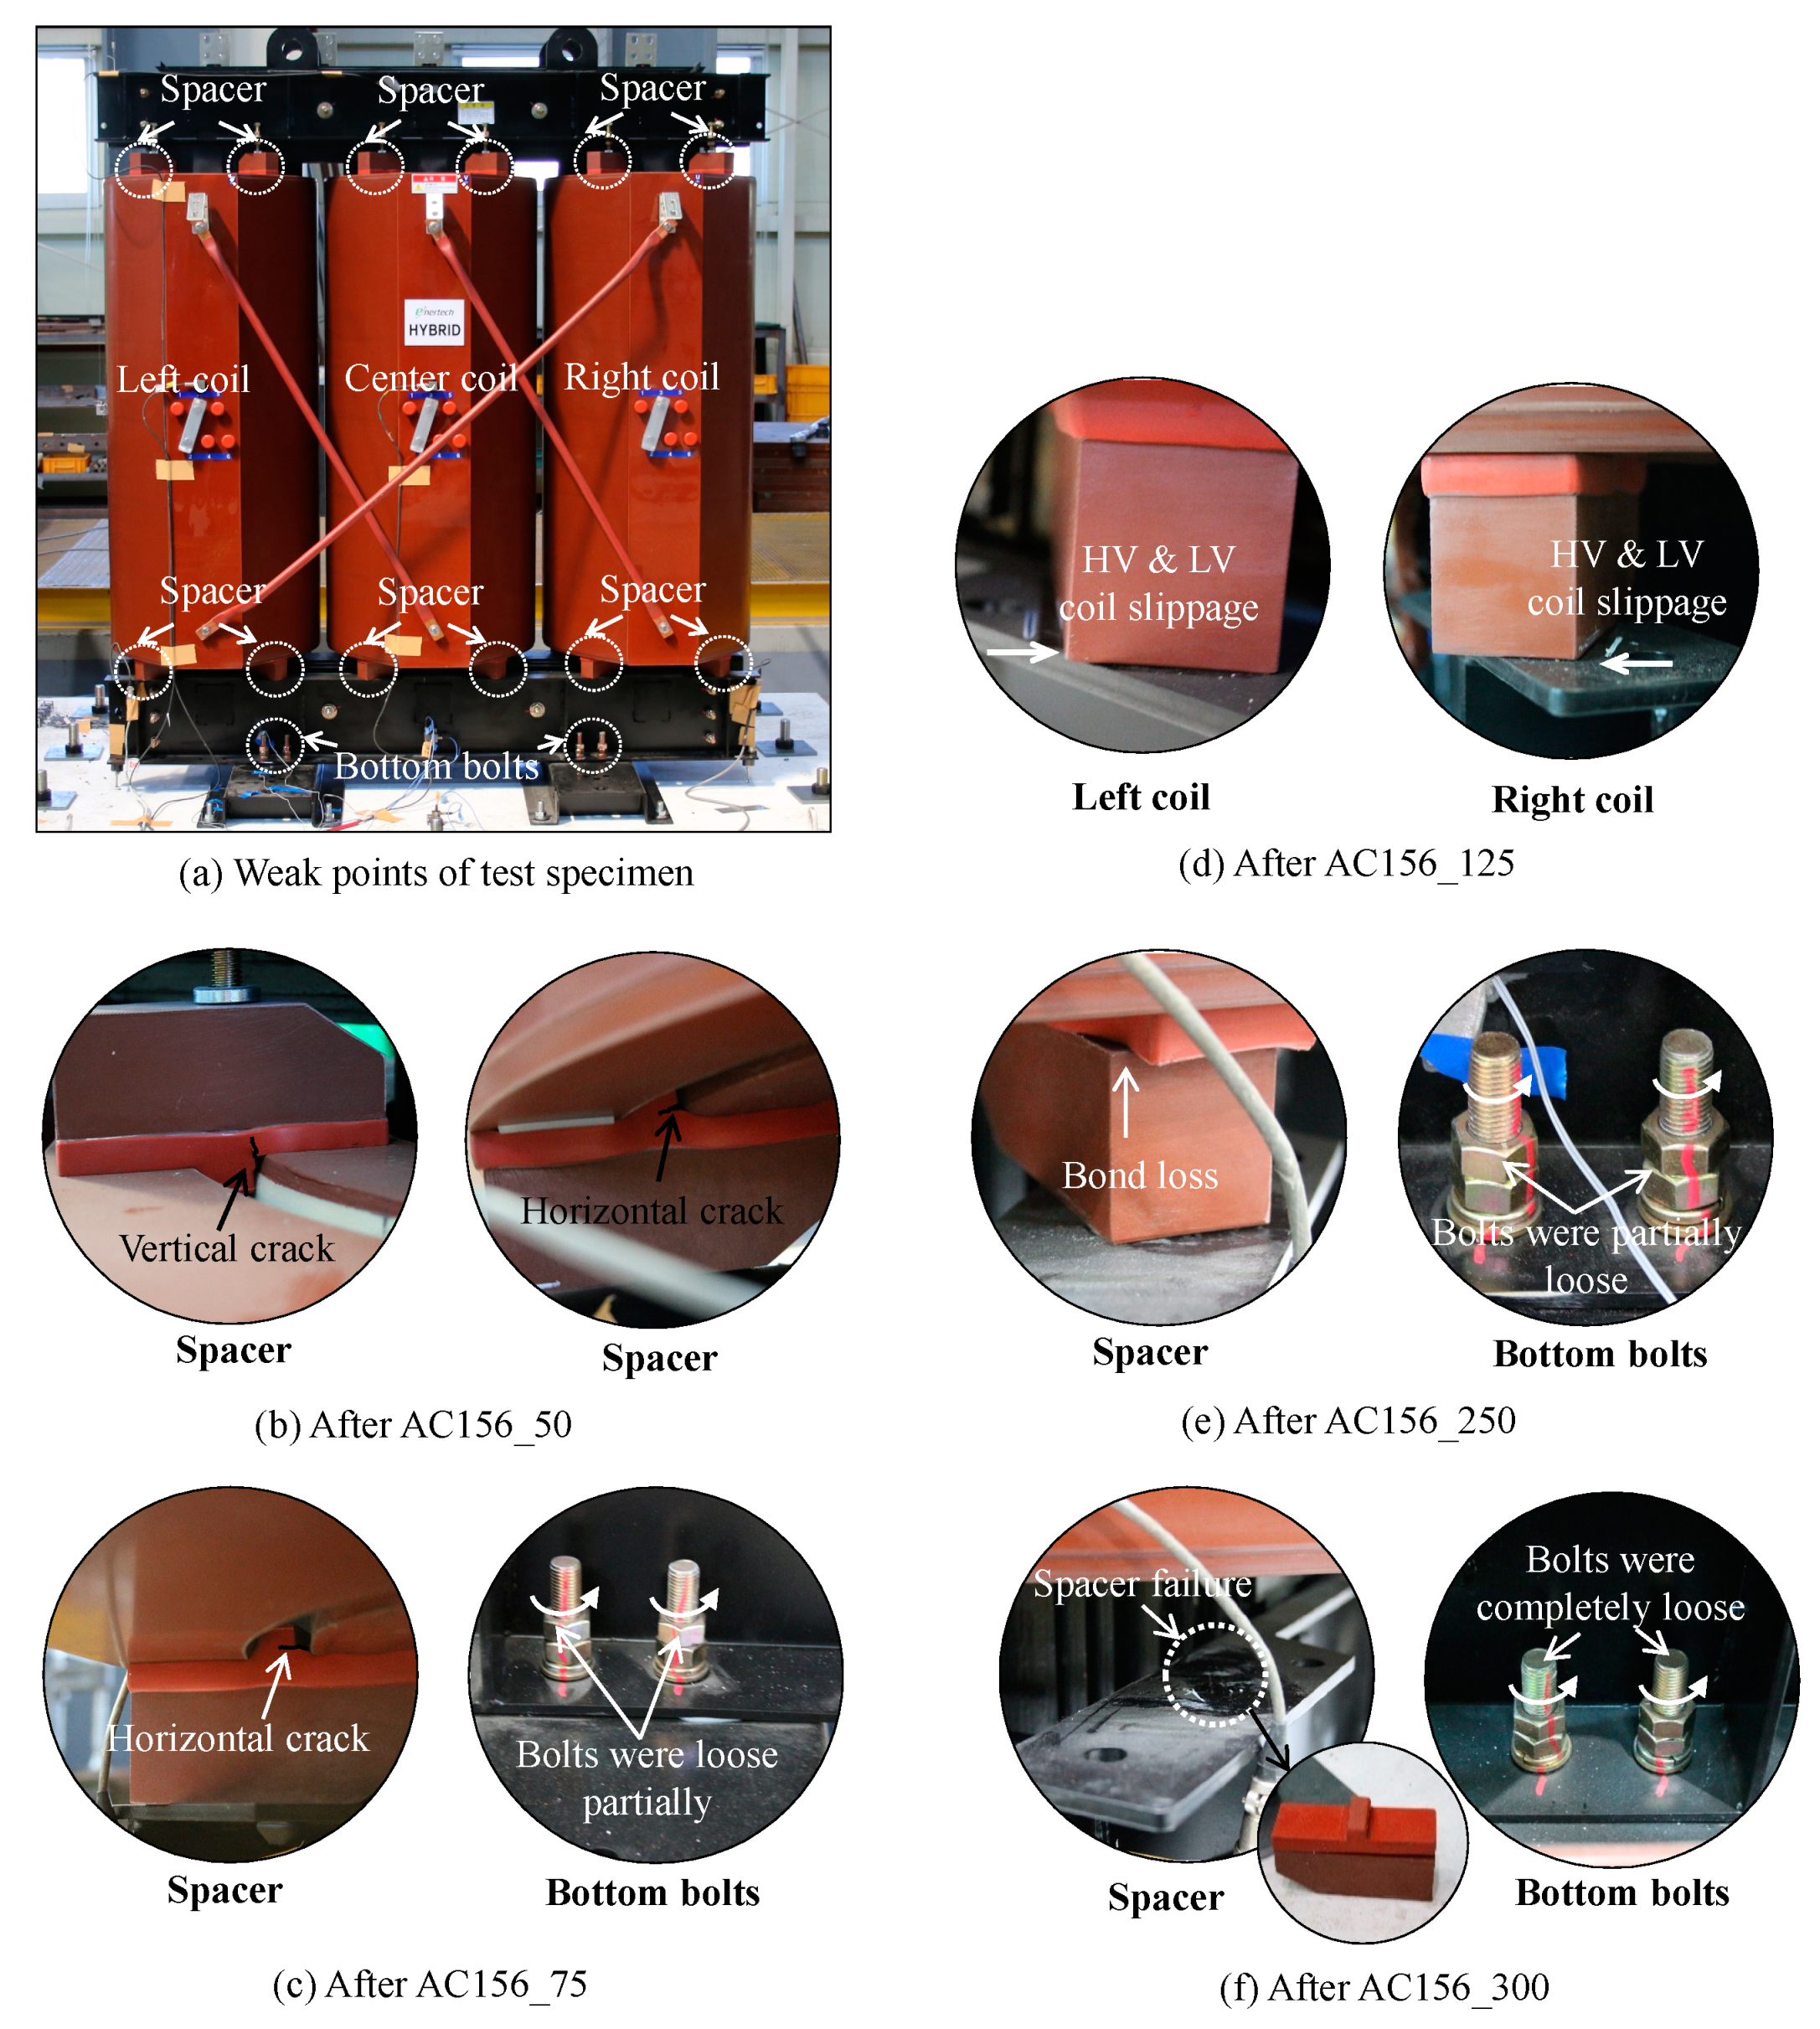
3.2. Damage Observation

Figure 11 presents the typical damage of test specimen observed during a series of shaking table tests. Overall, three weak points are shown, as evident in Figure 11a: The failure of the spacers, the slippage of coils, and the loosening of linked bolts between the bottom beam and bed beam. The first damage was observed after AC156_50 (Test no. 5), with respect to the PGA of 0.15, 0.14, and 0.16× g in the X, Y, and Z-directions, respectively. The local damage could be observed in the spacers located on the right and left coils of the transformer in terms of vertical and horizontal crack, as shown in Figure 11b.
Figure 11c–f demonstrate the damage of the test specimen observed after AC156_75, AC156_125, AC156_250, and AC156_300, respectively. To be more specific, after AC156_75 (Test no. 6), with respect to the PGA of 0.21, 0.17, and 0.18× g in the X, Y and Z-directions, respectively, the horizontal crack continues to develop in the spacers located on the left coil at the bottom of the transformer (Figure 11c). Simultaneously, the bolts connecting the bottom beam and bed beam partially loosen. After AC156_125 (Test no. 11), with respect to the PGA of 0.33, 0.31, and 0.27× g in the X, Y and Z-directions, respectively, the HV and LV coils have slipped away from the original positions (Figure 11d). This is due to the fact that the inertia force caused by the high acceleration level exceeds the friction force between the spaces and bottom beams, leading to the slippage of the HV and LV coils. The slippage of the HV and LV coils continued to grow during test AC156_250 and caused bond loss between the upper part and lower part of the spacers (Figure 11e). After the final test (AC156_300), with respect to the PGA of 0.90, 0.79, and 0.66× g in the X, Y, and Z-directions, respectively, the bond between the upper part and lower part of the spacers located at the bottom of the transformer was completely lost, leading to the failure of the spacers. Simultaneously, the bolts connecting the bottom beam and bed beam became completely loose, as shown in Figure 11f.
In general, at the final test, the specimen neither overturned nor collapsed; however, the spacers showed severe slippage, which to avoid magnetic stress and dangerous geometrical dissymmetry, should keep constant distances between the core and the coils, and between the HV coils and LV coils [23]. Such failure of the spacers was mainly concentrated at the bottom region of the test specimen, along with the loosening of the linked bolts between the bottom beam and bed beam.

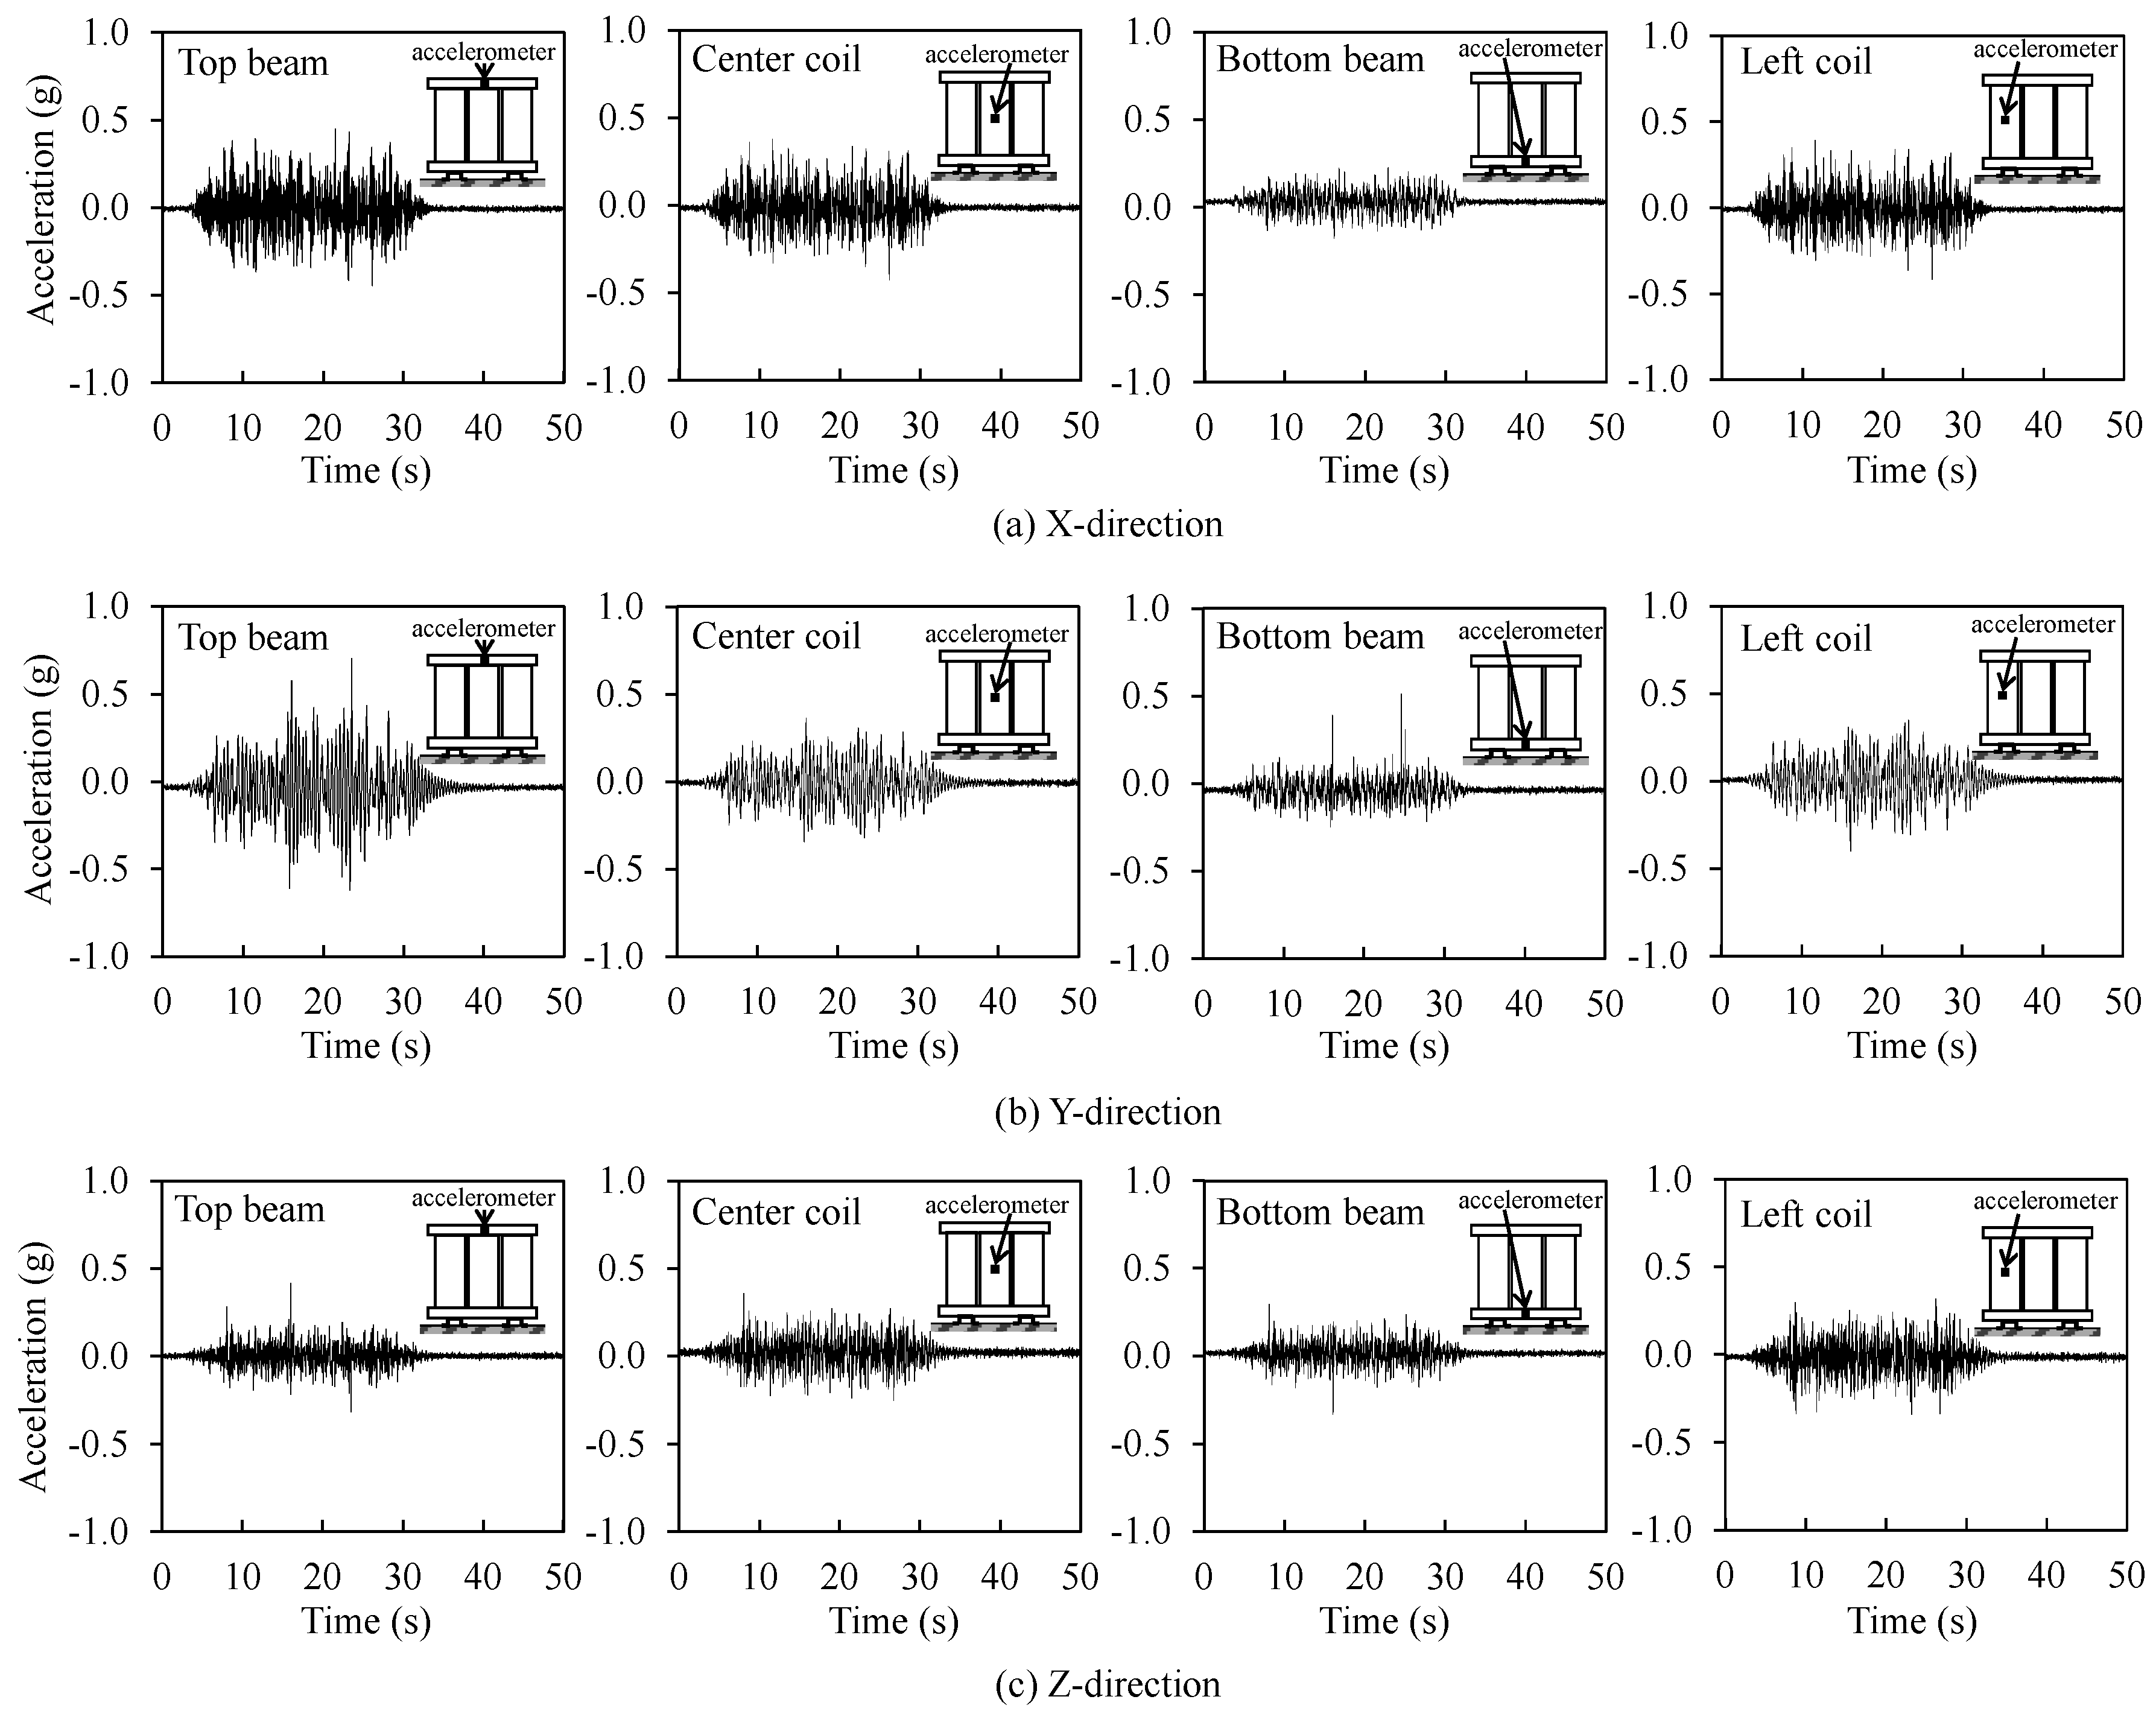
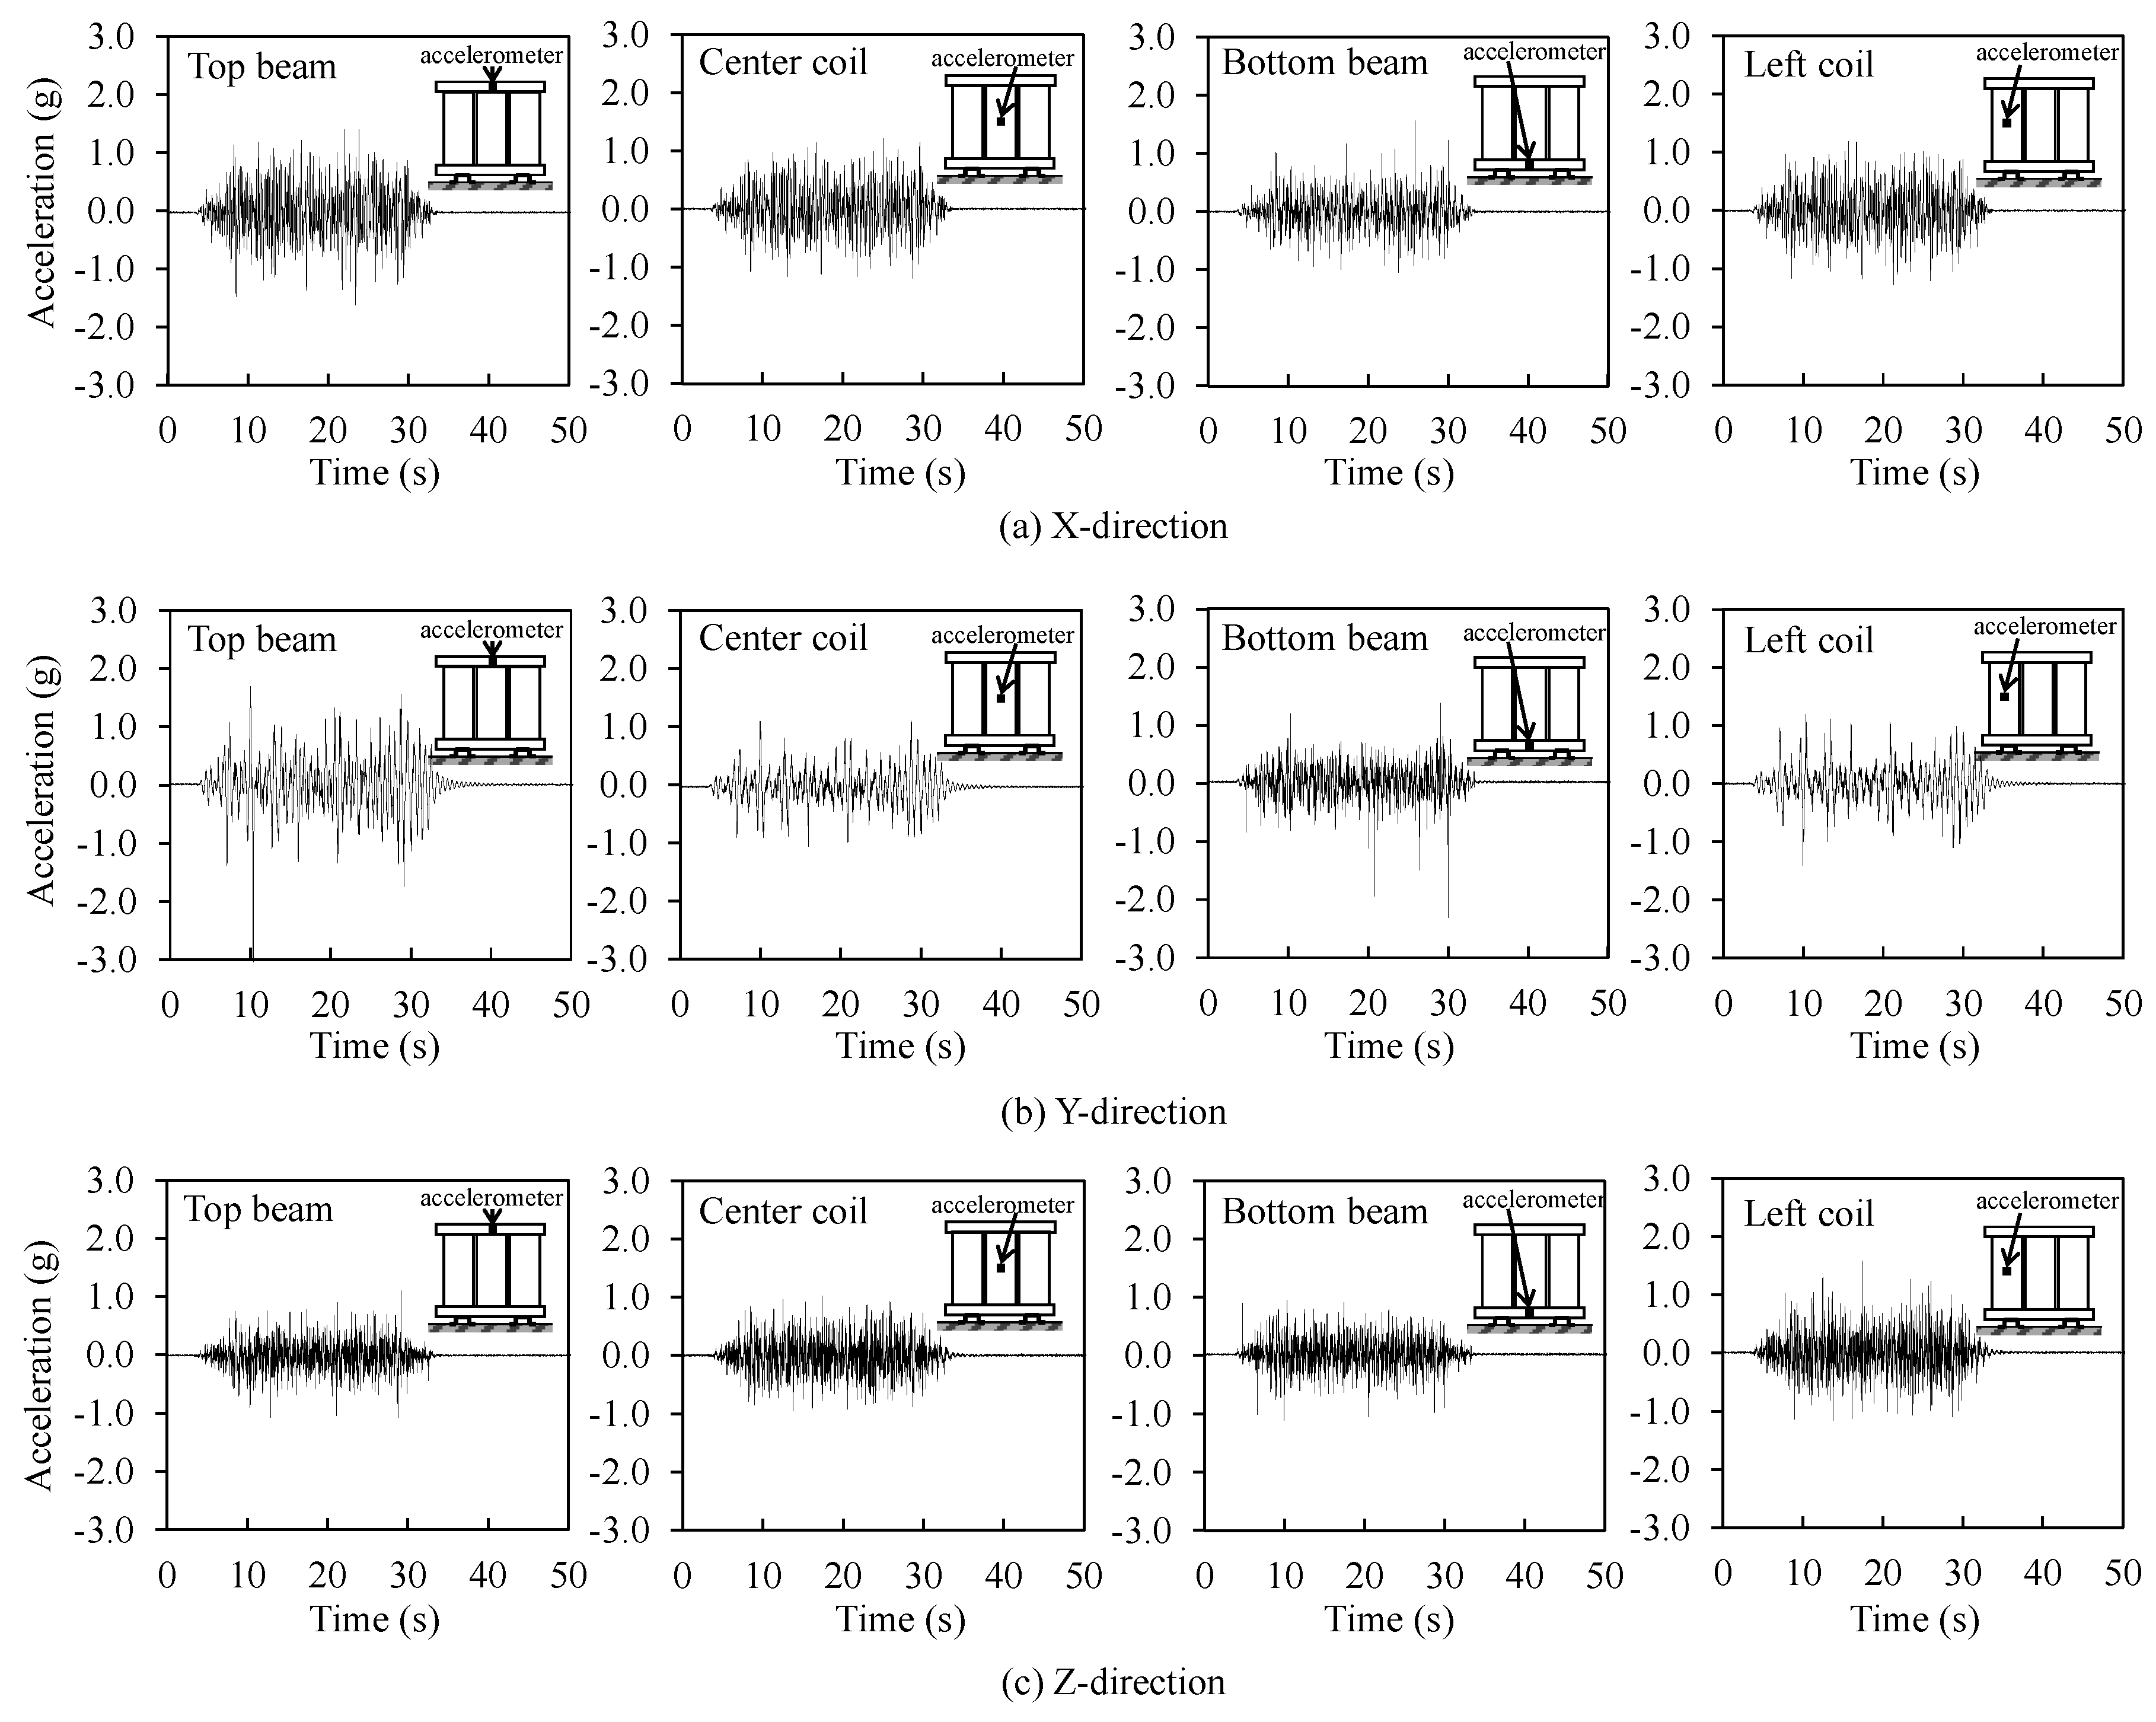
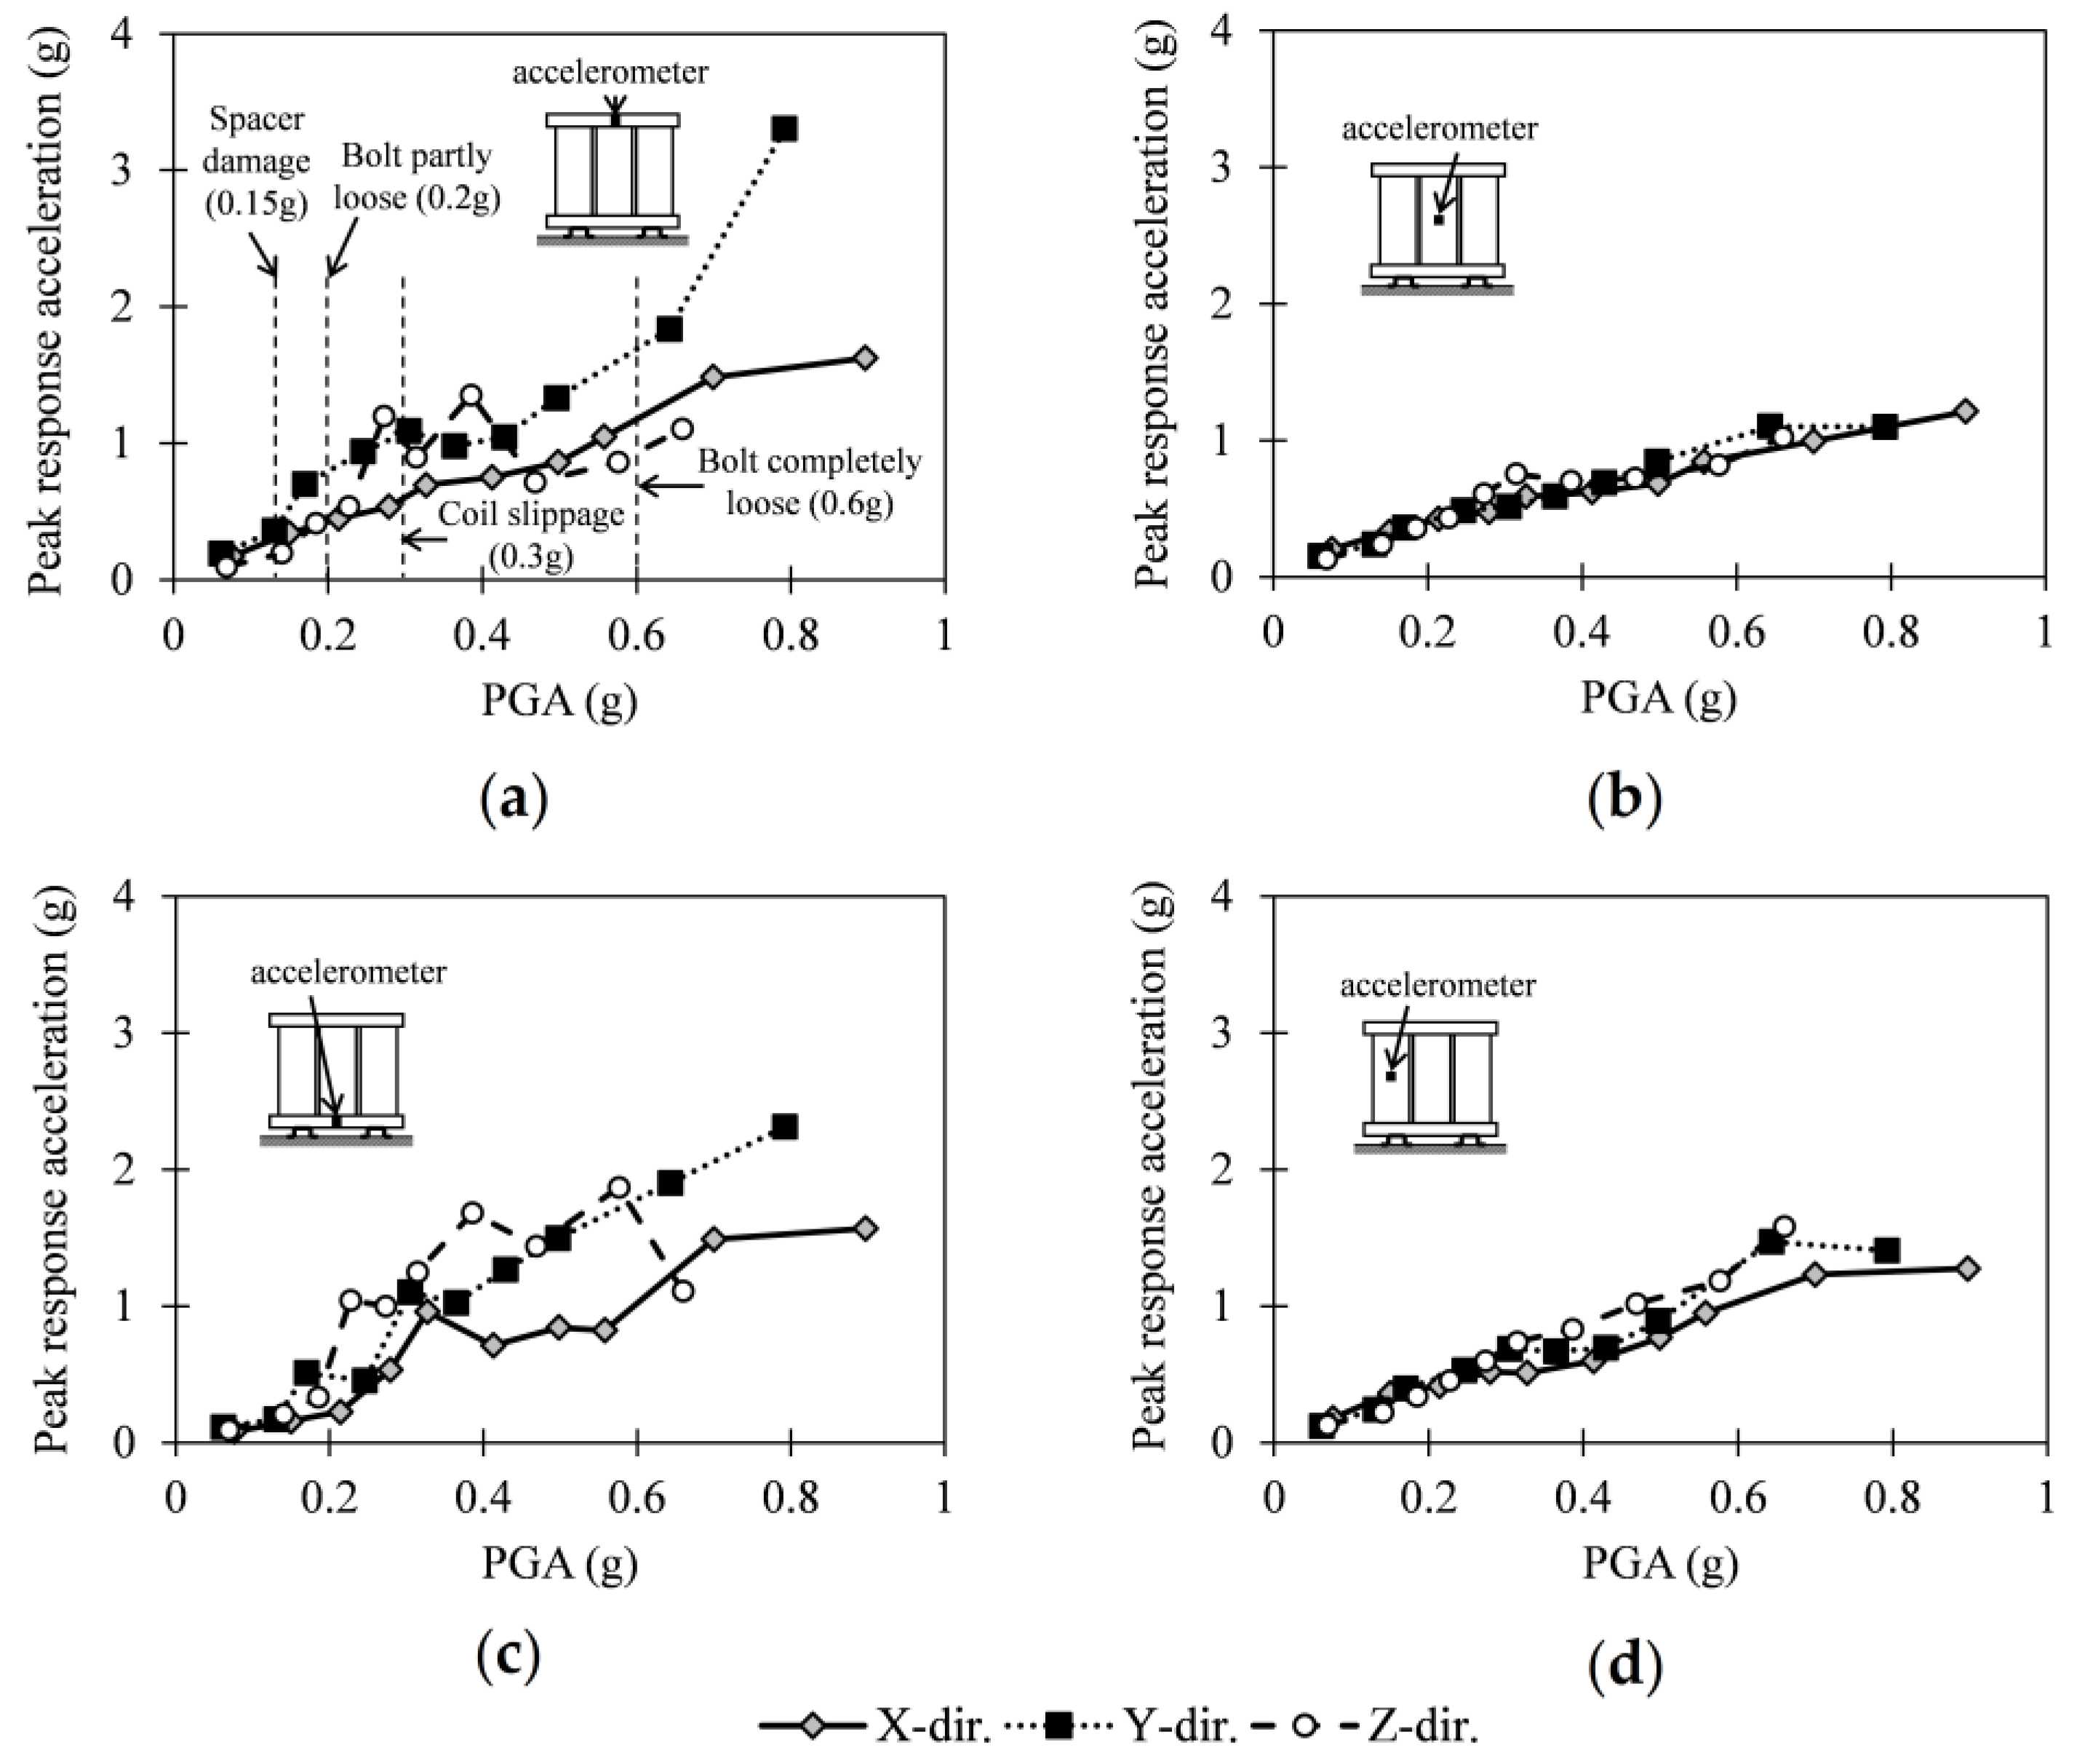
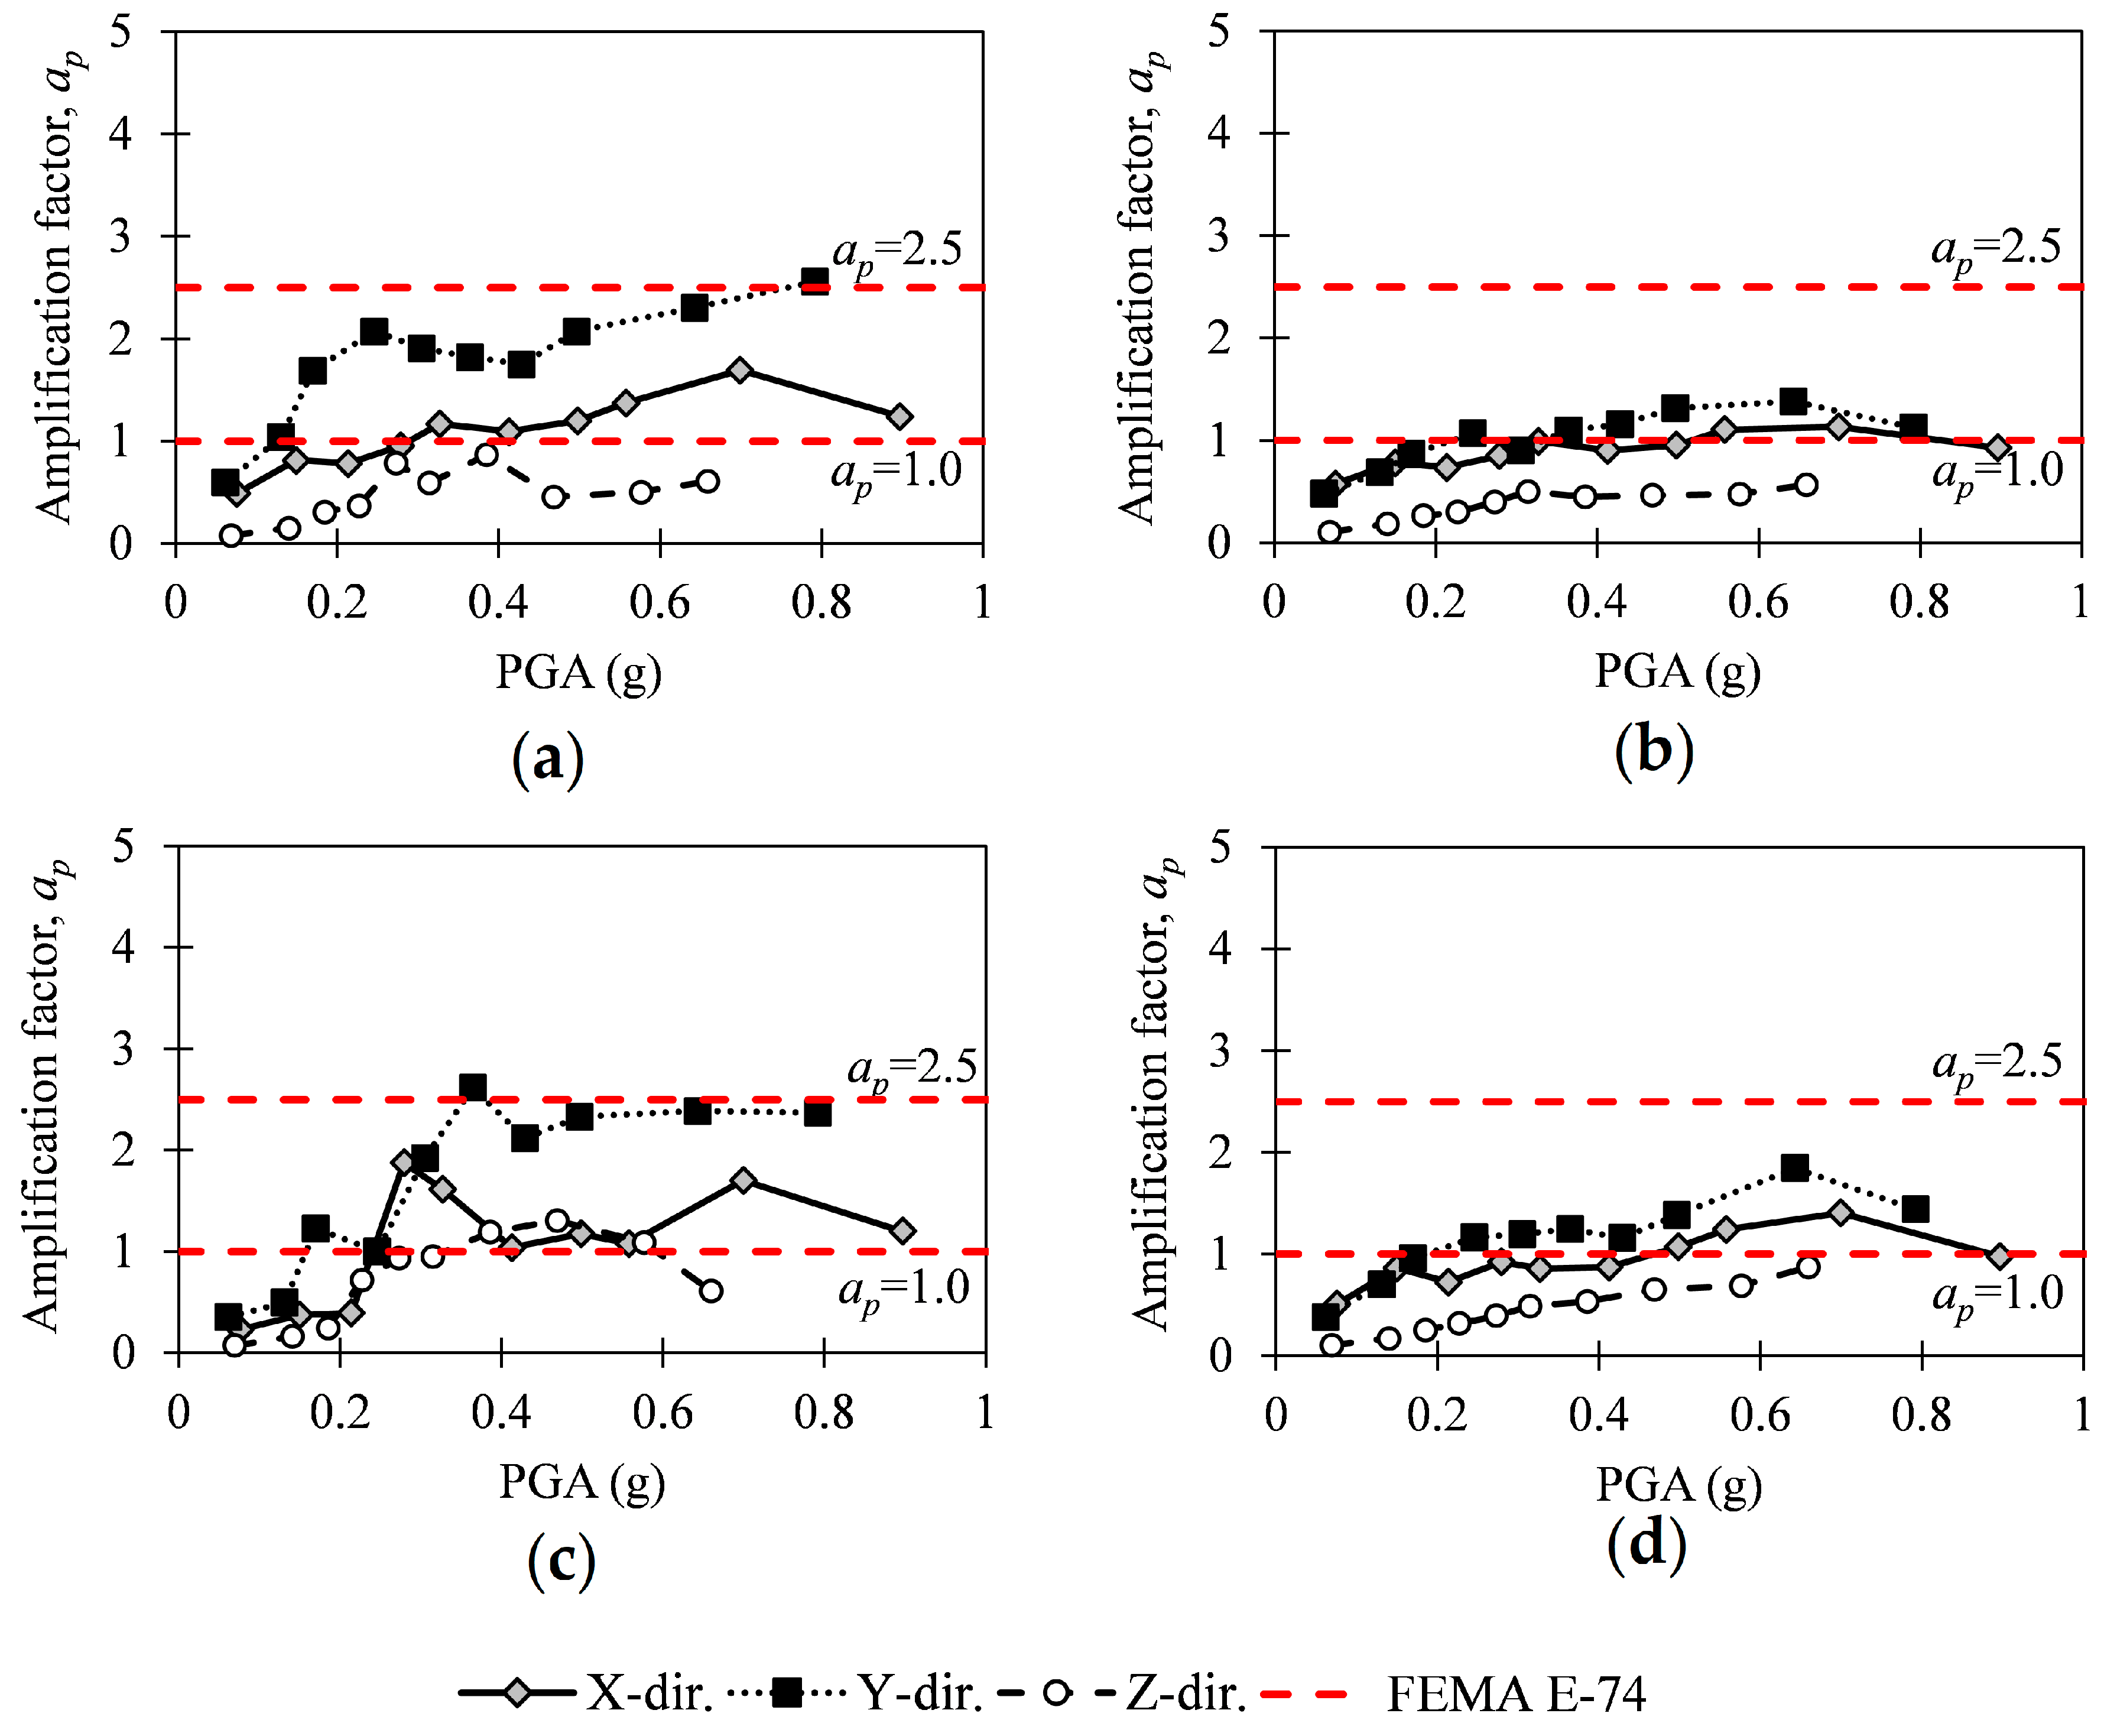
3.3. Acceleration Response and Dynamic Amplification of Test Specimen

The tri-axial acceleration response histories measured at different locations (top beam, bottom beam, left coil, and center coil) of the mold transformer were used to analyze the test results. Table 4 summarizes the peak acceleration responses of the test specimen in the X, Y, and Z-directions. Figure 12 and Figure 13 present the acceleration response time histories of the test specimen subjected to 75% tri-axial AC156 input ground motion (AC156_75 test) and 300% tri-axial AC156 input ground motion (AC156_300 test), respectively. Figure 12 shows that the acceleration responses at the center coil and the left coil of the test specimen were almost the same. In the Y-direction, where the specimen showed low stiffness, the acceleration response showed a big difference, compared to those in the X and Z-directions, the top beam vibrated severely with 0.7× g being the largest value of response acceleration; in general, the bottom beam showed less vibration than the other locations; however, transient peak accelerations were recorded with a maximum value of 0.51× g. Figure 13 shows that the specimen also revealed almost the same acceleration responses at the center coil and the left coil. In the Y-direction, the trend was similar to the test of AC156_75, the top beam vibrated more severely than the other locations with a peak response acceleration of 3.30× g; overall, at the bottom beam the level of vibration was not different from those of the left coil and center coil; however, transient peak accelerations were recorded with a maximum value of 2.31× g. This can be attributed to the high amplitude of input ground motion, which caused the damage accumulation in the bottom beam and the shift of natural frequency, as well as damping ratio, as presented in the aforementioned section.
Figure 14 presents the results of the peak response acceleration of the test specimen with respect to peak input accelerations at different locations. Overall, it can be observed that the specimen showed almost similar peak response acceleration, regardless of location in the X-direction. However, in the Y and Z-directions, it showed big differences in response acceleration at different locations. In the Y-direction, after a PGA of around 0.2× g, the peak response acceleration at the top beam and bottom beam were higher than those of the center coil and left coil and reached values of 3.30 and 2.31× g at AC156_300, respectively. Meanwhile, the peak acceleration responses at the center and left coils were 1.10 and 1.47× g, respectively. This is because the center and left coils are partly isolated due to the epoxy and vibrated separately from the steel frame core of the transformer. Moreover, Figure 14a also presents the damage stages of the test specimen: the local damage of spacers was observed at a PGA of around 0.15× g, the bolts connecting the bottom beam and bed beam were partly loose at a PGA of around 0.20× g, the slippages of HV and LV coils were observed at PGA of around 0.30× g, and the bolts connecting the bottom beam and bed beam were completely loose at a PGA of around 0.60× g.
In addition, the dynamic amplification was evaluated, which is the key parameter in seismic engineering of non-structural components. In this study, the dynamic amplification of the mold transformer can be evaluated by means of the acceleration amplification factor, a P , which was defined as the ratio between the peak response acceleration of the test specimen (PRA), and the peak floor acceleration (PFA) [4,8]:
a P = PRA PFA .  
In Equation (7), the values of PRA were obtained from the accelerometers mounted on the specimens and the values of PFA were obtained from the accelerometers mounted on top of the RC slab, as shown in Figure 2 and Figure 3. Figure 15 illustrates the values of the amplification factor according to the peak ground acceleration calculated at the top beam, center coil, bottom beam, and left coil of the test specimen with respect to the X, Y, and Z-directions. According to the recommendations of FEMA E-74 [1] and American Society of Civil Engineers (ASCE) ASCE 7-16 [24], the design component amplification factor varies from 1.0 (for rigid components) to 2.5 (for flexible components), which is also presented in Figure 15 for comparison. Overall, the amplification factors in the X and Y-directions were in the range of those for non-structural elements specified in FEMA E-74 [1]. Meanwhile, in the Z-direction, the acceleration amplification factors were smaller than the lower limit specified in FEMA E-74 [1]. From the study by Fathali et al. [12,13] on the seismic performance of electrical components, the amplification factors in the horizontal and vertical directions were almost the same, which showed a discrepant trend to the present results. This could be attributed to the discrepancy of anchoring details connecting the transformer to the concrete slab, resulting in the different response acceleration of the test specimen in horizontal and vertical directions.

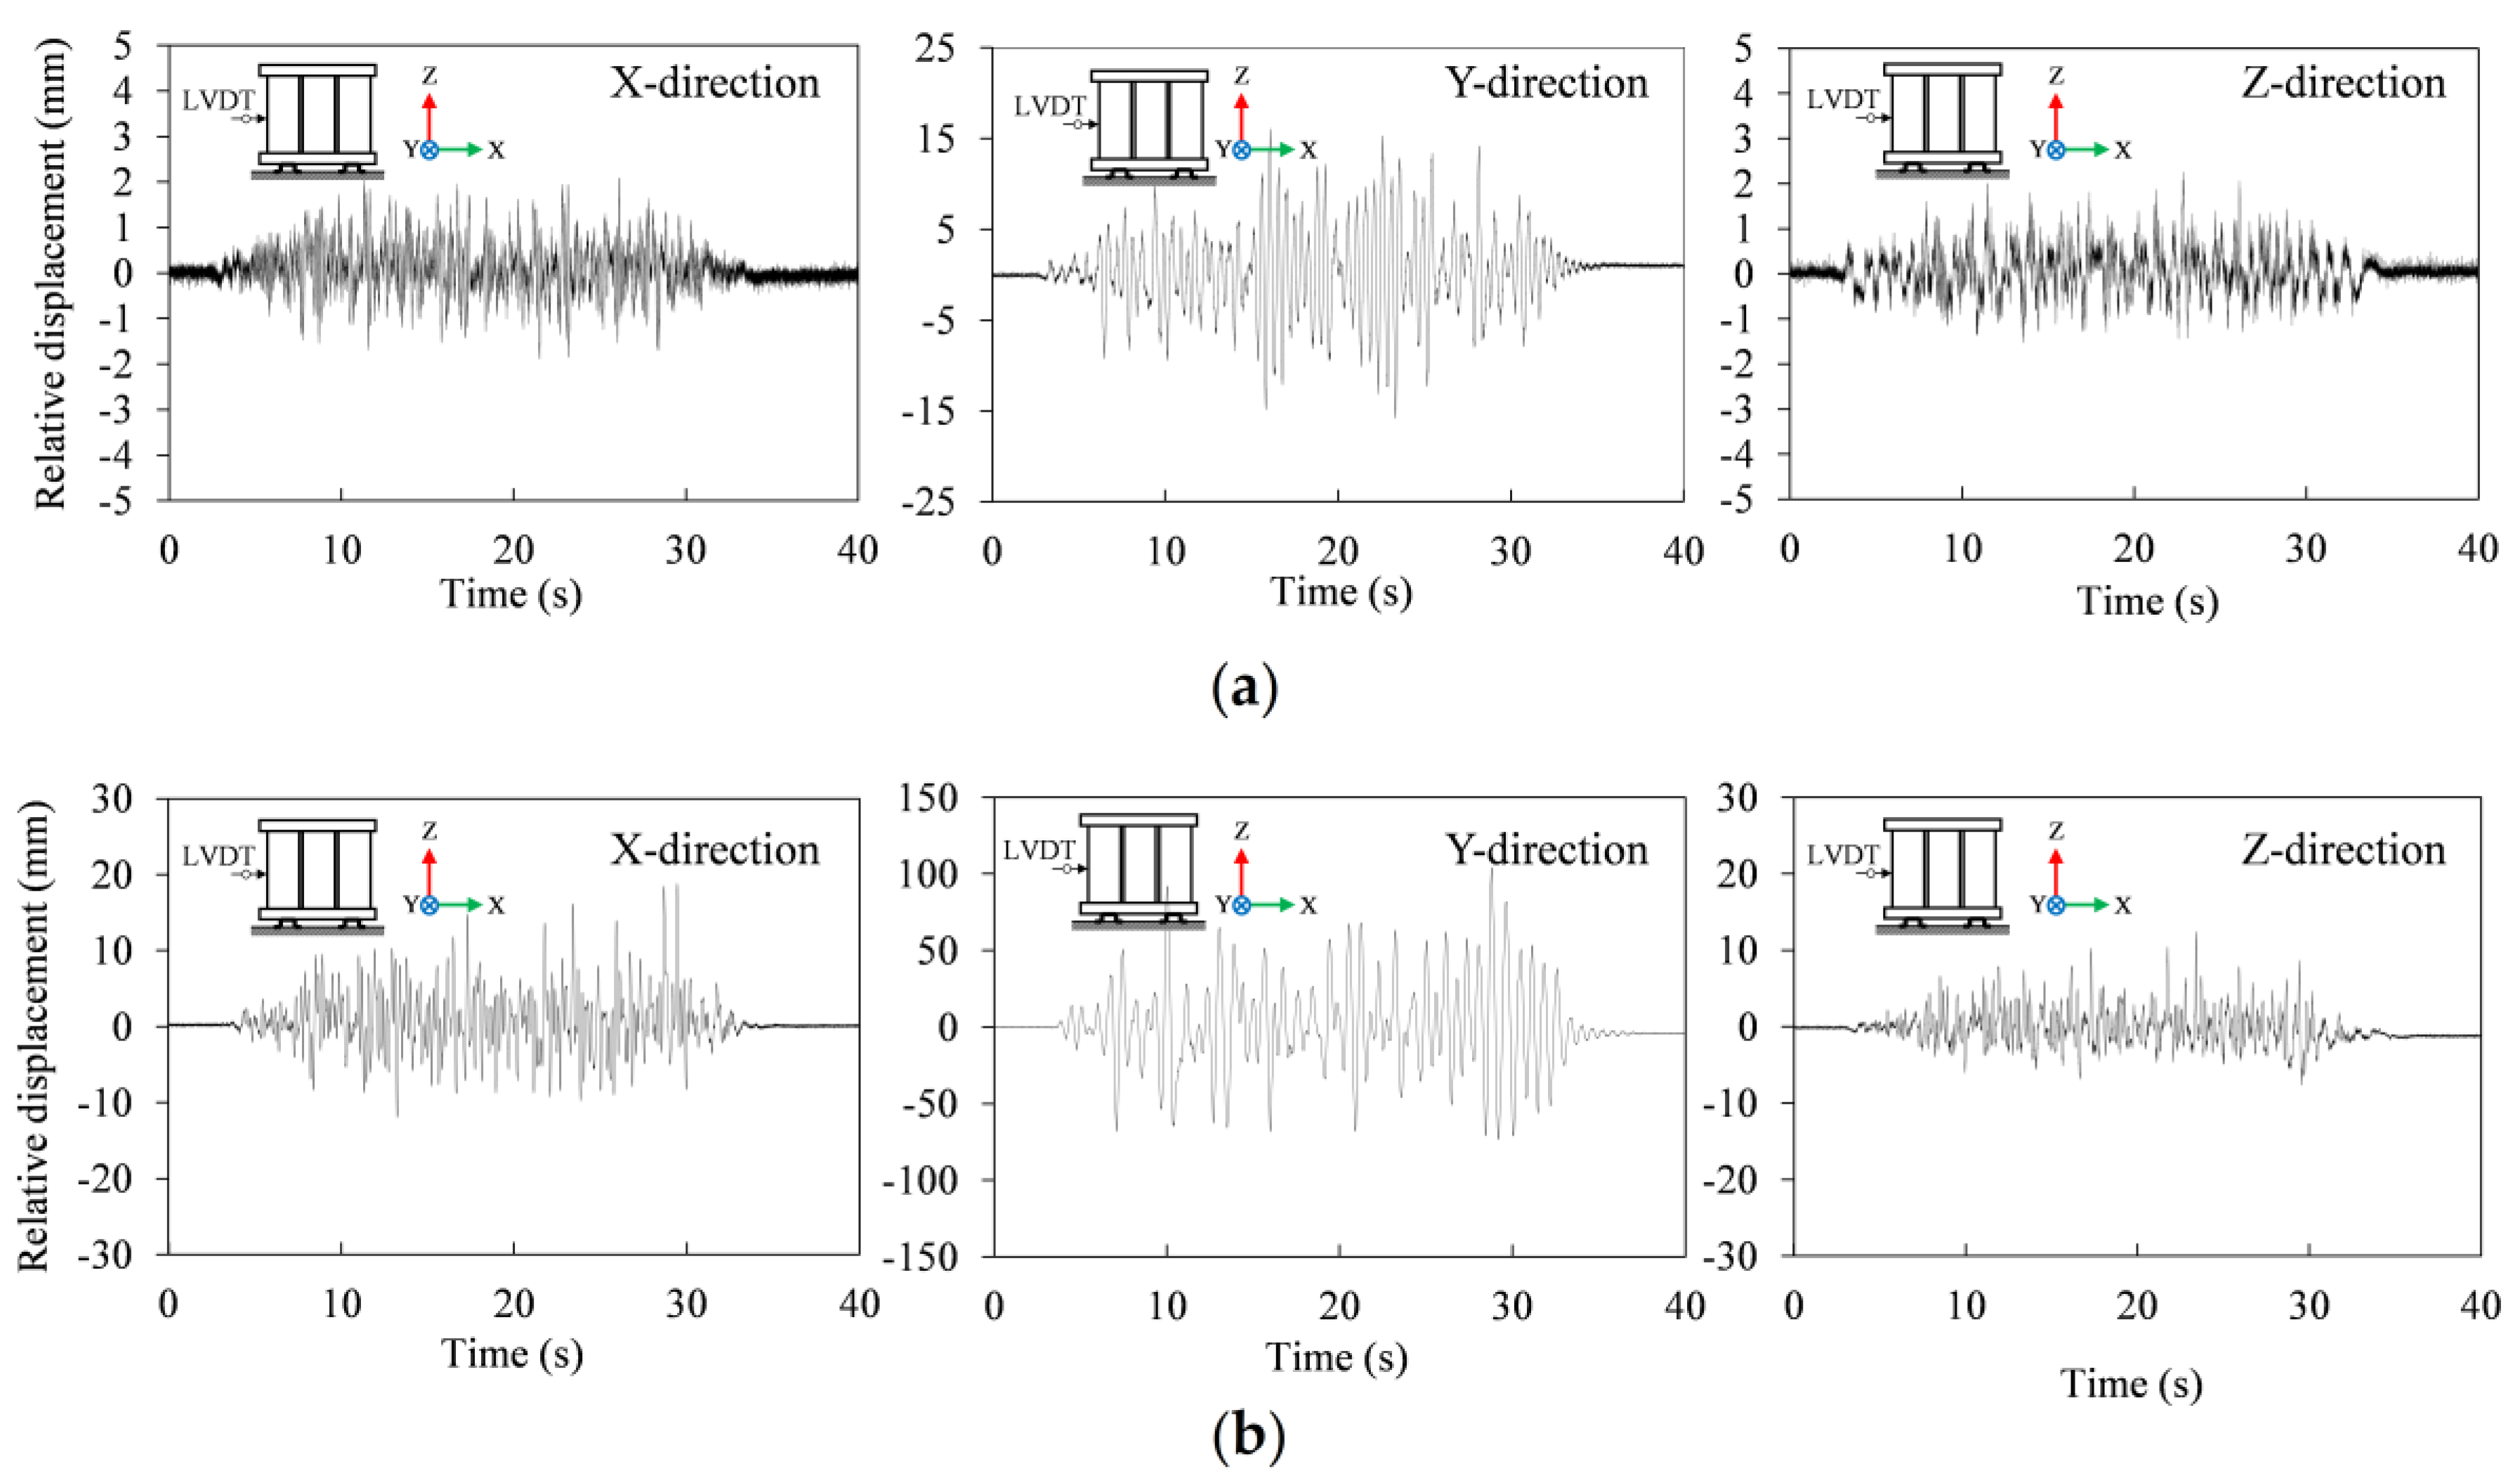
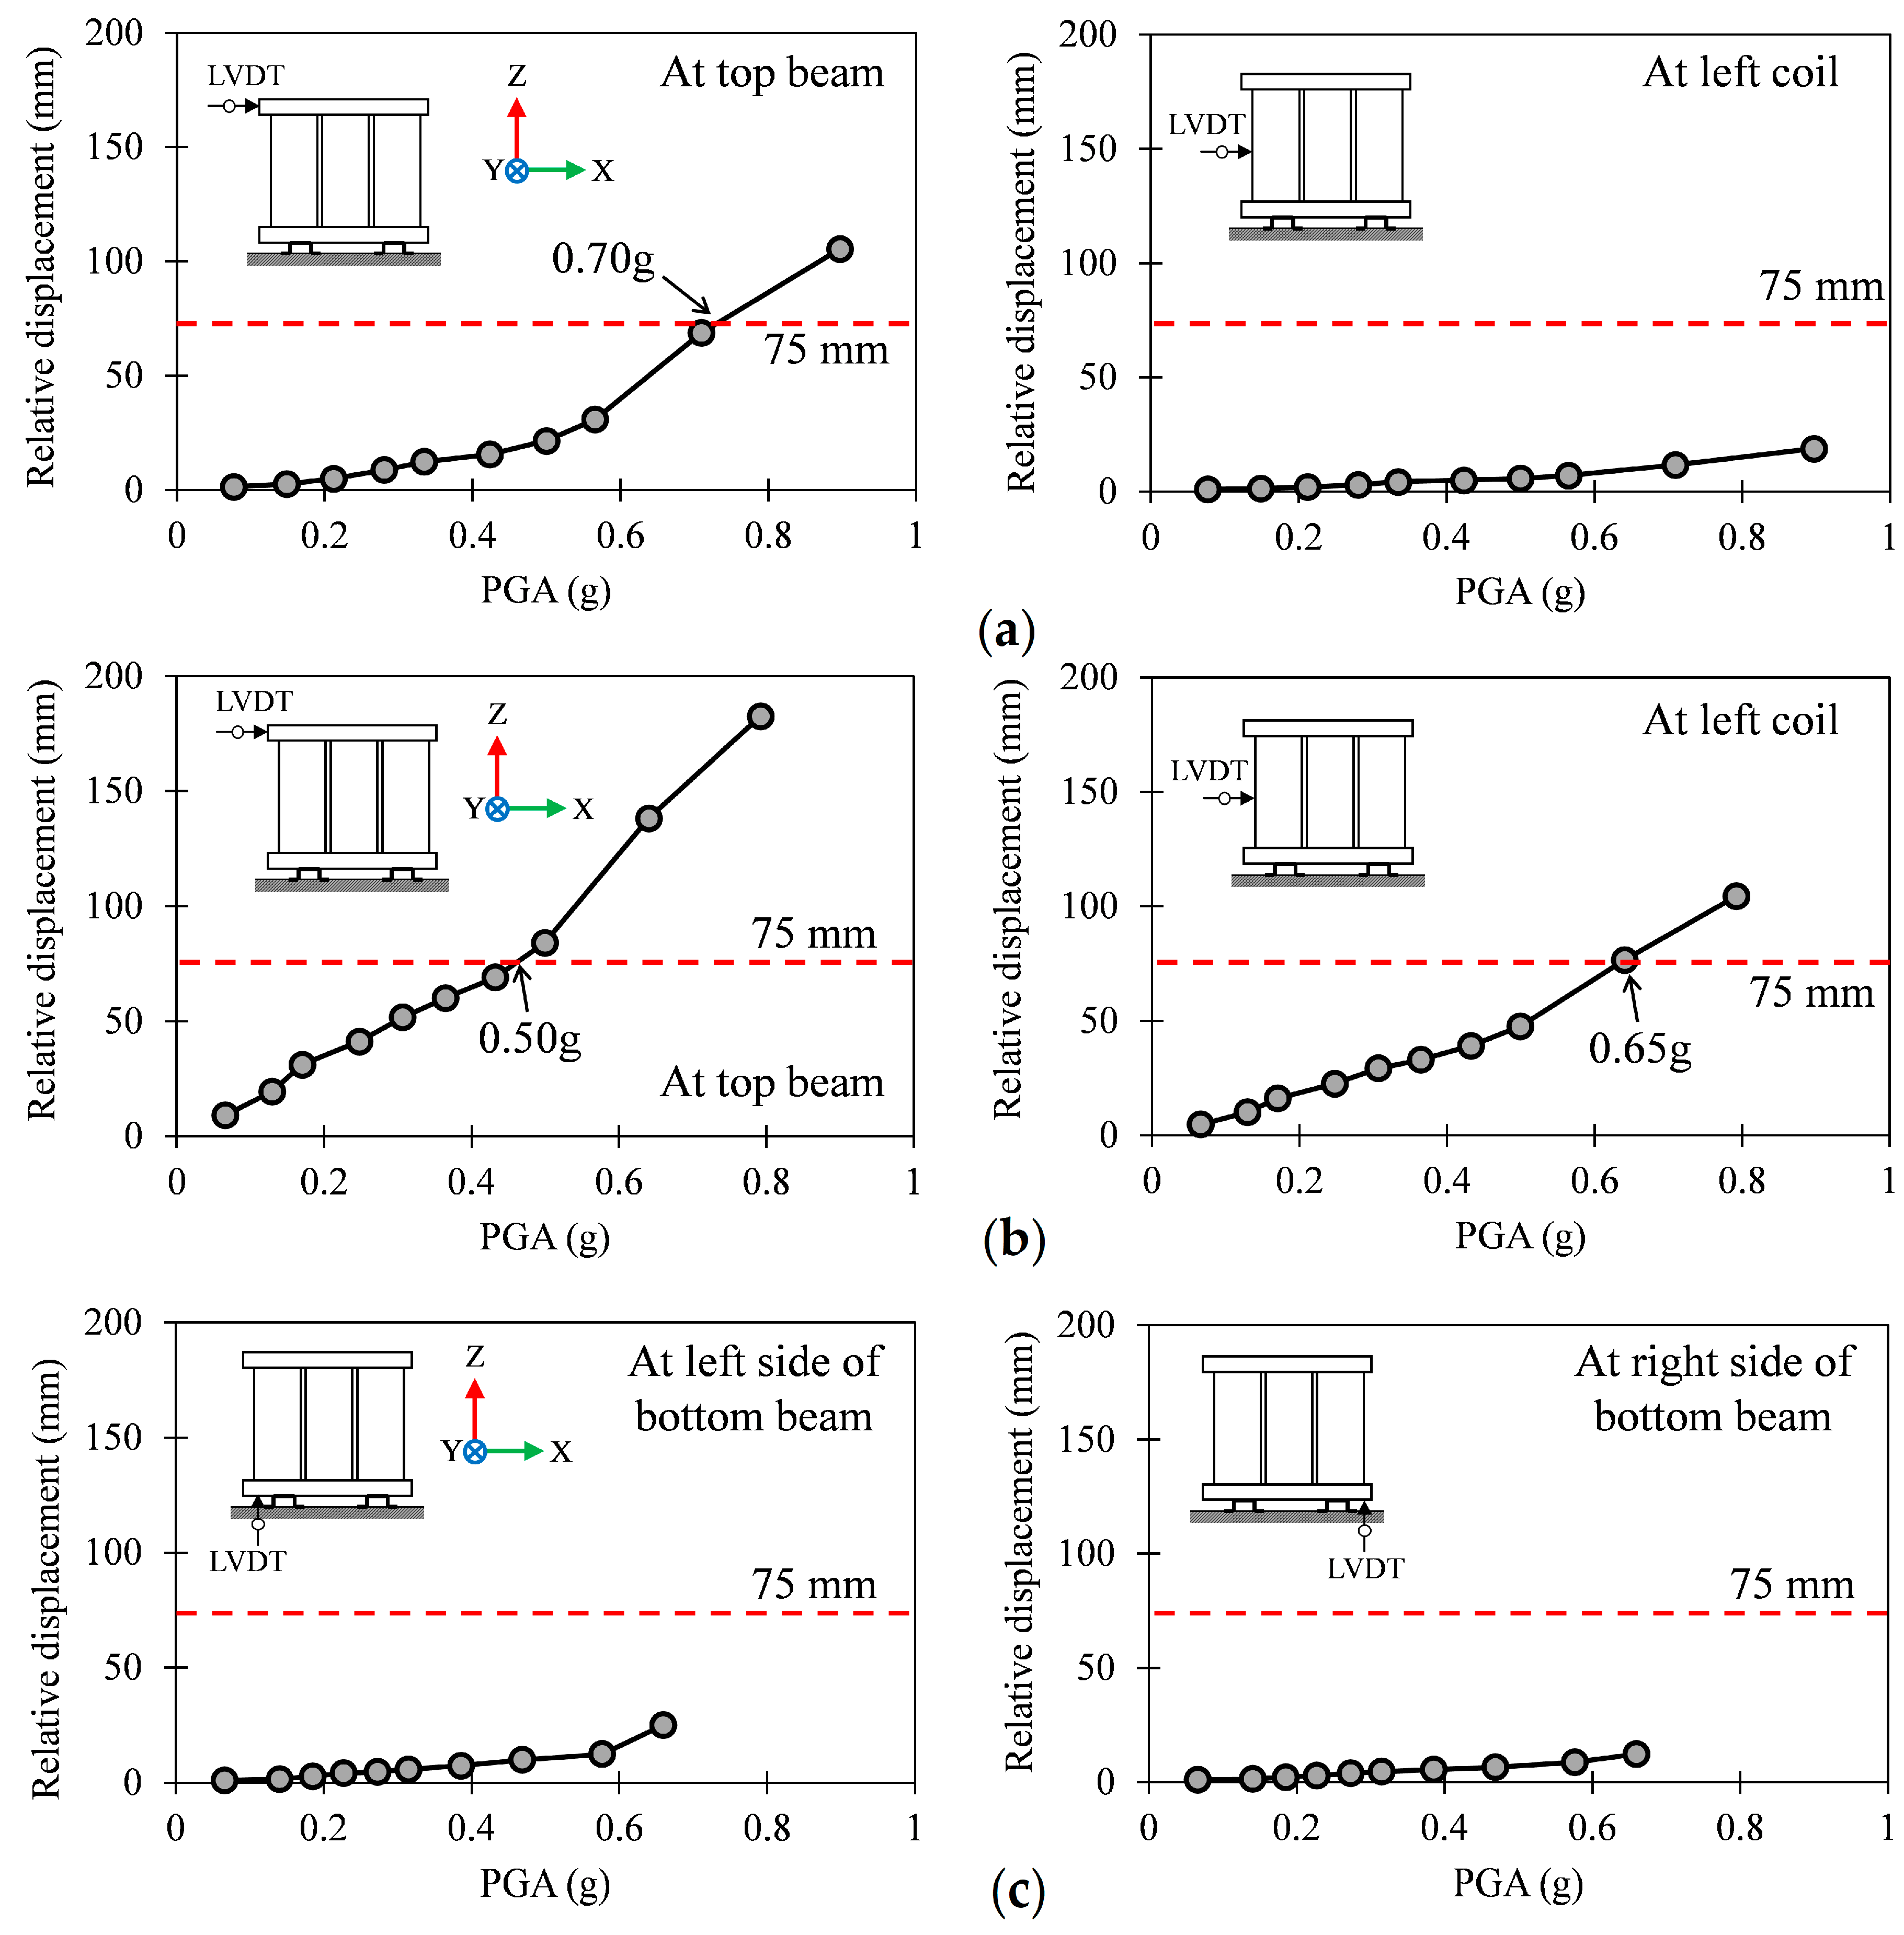
3.4. Displacement Response of Test Specimen

The data recorded from the TMDTs and static LVDTs were calibrated to determine the relative displacement response of the test specimen. The tri-axial relative displacement response at a specified location of the transformer could be derived from a system of quadratic equations:
{ ( x x o ) 2 + y 2 + z 2 = r x 2 x 2 + ( y y o ) 2 + z 2 = r y 2 x 2 + y 2 + ( z z o ) 2 = r z 2 ,  
where x, y, and z are the calculated relative displacements of a specified location of the transformer in X, Y, and Z-directions, respectively; xo, yo, and zo are the absolute distances between the fixed locations of TMDTs to the measured locations of the transformer in X, Y and Z-directions, respectively; and rx, ry, and rz are the absolute displacement values recorded from the TMDTs in X, Y and Z-directions, respectively. Figure 16 expresses the relative displacement response-time histories at the left coil of the test specimen subjected to 75% tri-axial AC156 input ground motion (AC156_75 test) and 300% tri-axial AC156 input ground motion (AC156_300 test). Figure 17 expresses the tri-axial maximum relative displacement response of the test specimen evaluated at the top beam, left coil, and bottom beam of the test specimen with respect to the PGA. In general, the maximum relative displacement of the test specimen increased along with the increase of PGA. The maximum relative displacement in the Z-direction was much smaller than those in the X and Y-directions during the shaking table tests.
Moreover, according to the provisions and recommendations of the Korean National Radio Research Agency [25], the maximum displacement at the top of the equipment should not exceed 75 mm to ensure the safety and functional operation of non-structural components, as well as adjacent components. Figure 17 also shows the limit condition of 75 mm in comparison with the test results. The figure shows that the maximum relative displacements in the Z-direction do not exceed the boundary limit of 75 mm at the end of the tests. Meanwhile, the maximum relative displacements in the X and Y-directions exceed the boundary limit of 75 mm around the PGA of 0.70 and 0.5× g, respectively.

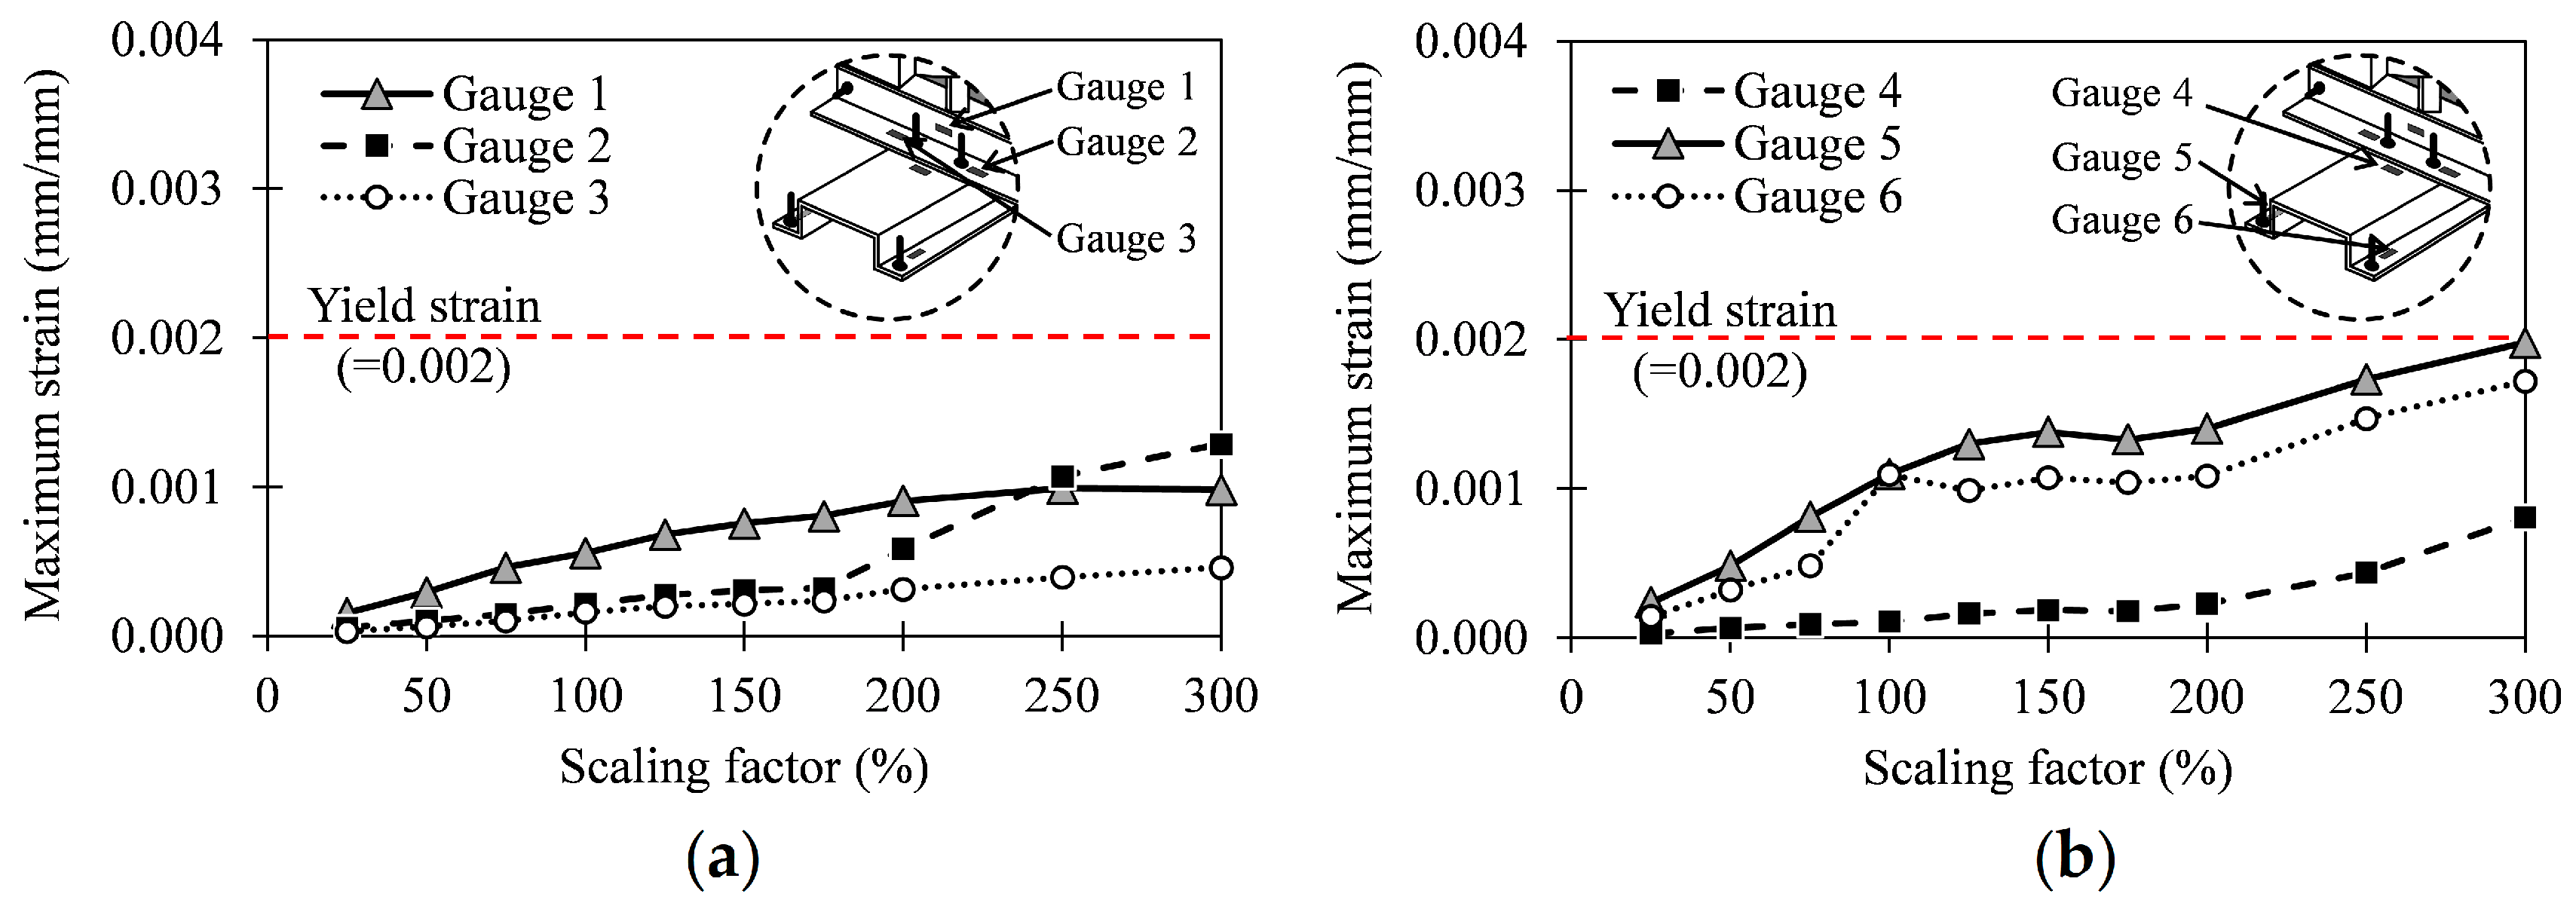
3.5. Strain Profiles

Figure 18 presents the maximum strain profiles recorded at the locations around the linked bolts of the bottom beam and the bed beam during the shaking table test series, with respect to the scaling factor. Overall, the strain of the bottom beam and bed beam increased along with the increasing input acceleration amplitude but did not exceed the yield strain. At the bottom beam (Figure 18a), the maximum measured strain was 0.00129 mm/mm at AC156_300. At the bed beam (Figure 18b), the maximum measured strain was 0.00198 mm/mm at AC156_300, which nearly reached the yield strain of 0.002 mm/mm.

4. Operational Test of the Specimen

For operational capacity assessment, the mold transformer was tested before and after the series of shaking table tests. The tests were performed based on the International Electrotechnical Commission (IEC) IEC 60076-11 Standard [26] for dry-type transformers. Table 5 summarizes the test results of the transformer before and after the shaking table test series. From the test results, the specimen remained in good condition after the shaking table tests, in terms of external appearance. Moreover, the specification data of the transformer satisfied the acceptance criteria specified in IEC 60076-11 after the shaking table tests, thus ensuring the operational capacity of the test specimen. Nevertheless, the aforementioned weak points, including the loosening of linked bolts and the failure of spacers, can affect the operational capacity of the transformer in earthquakes with higher acceleration amplitude.

5. Conclusions

In this study, the seismic performance of the electrical mold transformer was experimentally investigated through tri-axial shaking table tests. The input acceleration time histories were artificially generated according to the ICC-ES AC156 code with a range of different amplitude. A total of 22 shakings were performed during the entire test campaign. Based on the test results, the primary conclusions may be drawn as follows.
  • The dynamic properties of the test specimen were estimated through dynamic identification tests using random input signal. The initial natural frequencies of the mold transformer in the X, Y and Z-directions were 7.78, 2.52, and 23.12 Hz, respectively. Since the damage grew as the input motion amplitude increased, the fundamental frequency showed a decreasing trend; however, the level of frequency deterioration was not significant.
  • The damping ratios of the test specimen were evaluated using the half-power bandwidth method. The initial damping ratio of the test specimen was in the range of 2–4% and showed an increasing trend up to 4–10% with the increase of input ground motion amplitude.
  • In terms of damage stages, overall, at the final test, the specimen neither overturned nor collapsed; however, the spacers located on the bottom region of the transformer showed severe slippage. Simultaneously, the bolts connecting the bottom beam and bed beam were completely loose. Nonetheless, it should be noted that the prototype specimen was tested with conventional anchoring details; thus, further investigations on the seismic performance of the mold transformers with different anchoring details should be taken into account to assess the damage characteristics of the mold transformer.
  • The dynamic amplification of the mold transformer by means of the acceleration amplification factor was evaluated. The amplification factors during the tests were in the range of 1.0–2.5 in the X, Y-directions, which complied with the ASCE 7-16 and FEMA E-74 Standard. Meanwhile, the acceleration amplification factors in the Z-direction were smaller than the lower limit specified in FEMA E-74.
  • During the shaking table test series, the maximum relative displacements in the X-direction did not exceed the boundary limit of 75 mm, which was recommended by the Korean National Radio Research Agency [25]. Meanwhile, the maximum relative displacements in the Y and Z-directions exceeded the boundary limit of 75 mm around the PGA of 0.50 and 0.47× g, respectively. Moreover, at the end of the shaking table tests, the maximum strain of the bottom beam and bed beam did not exceed the yield strain.
  • The specimen showed good condition of external appearance and satisfied the acceptance criteria specified in IEC 60076-11 after shaking table tests, thus ensuring the operational capacity of the transformer.

Author Contributions

Methodology, N.H.D.; Investigation, N.H.D., S.-J.L. and J.-Y.K.; Writing—original draft Preparation, N.H.D.; Writing—review and editing, K.-K.C.; Supervision, K.-K.C. All authors have read and agreed to the published version of the manuscript.

Funding

This research was supported by a grant (19AUDP-C146352-02) from the Architecture and Urban Development Research Program, funded by the Ministry of Land, Infrastructure and Transport of the Korean Government.

Acknowledgments

We gratefully acknowledge the supports of Ministry of Land, Infrastructure and Transport of the Korean Government, and Soongsil University.

Conflicts of Interest

The authors declare no conflict of interest.

References

  1. Federal Emergency Management Agency (FEMA). Reducing the Risks of Nonstructural Earthquake Damage: A Practical Guide (FEMA E-74); FEMA: Washington, DC, USA, 2011.
  2. Whittaker, A.S.; Soong, T.T. An overview of nonstructural components research at three US Earthquake Engineering Research Centers. In Proc. ATC Seminar on Seismic Design, Performance, and Retrofit of Nonstructural Components in Critical Facilities; Earthquake Engineering Research Centers: Irvine, CA, USA, 2003. [Google Scholar]
  3. Taghavi, S.; Miranda, E. Response Assessment of Nonstructural Building Elements; Pacific Earthquake Engineering Research Center: Irvine, CA, USA, 2003. [Google Scholar]
  4. Di Sarno, L.; Magliulo, G.; D’Angela, D.; Cosenza, E. Experimental assessment of the seismic performance of hospital cabinets using shake table testing. Earthq. Eng. Struct. Dyn. 2019, 48, 103–123. [Google Scholar] [CrossRef] [Green Version]
  5. Villaverde, R. Methods to assess the seismic collapse capacity of building structures: State of the art. J. Struct. Eng. 2017, 133, 57–66. [Google Scholar] [CrossRef] [Green Version]
  6. Korea Architectural Institute. Pohang Earthquake Damage Survey Report; Korea Architectural Institute: Seoul, Korea, 2018. [Google Scholar]
  7. Petrone, C.; Magliulo, G.; Manfredi, G. Shake table tests for the seismic assessment of hollow brick internal partitions. Eng. Struct. 2014, 72, 203–214. [Google Scholar] [CrossRef]
  8. Fiorino, L.; Bucciero, B.; Landolfo, R. Evaluation of seismic dynamic behaviour of drywall partitions, façades and ceilings through shake table testing. Eng. Struct. 2019, 180, 103–123. [Google Scholar] [CrossRef]
  9. Wang, S.J.; Yang, Y.H.; Lin, F.R.; Jeng, J.W.; Hwang, J.S. Experimental study on seismic performance of mechanical/electrical equipment with vibration isolation systems. J. Earthq. Eng. 2017, 21, 439–460. [Google Scholar] [CrossRef]
  10. Hwang, H.H.; Huo, J.R. Seismic fragility analysis of electric substation equipment and structures. Probabilistic Eng. Mech. 1998, 13, 107–116. [Google Scholar] [CrossRef]
  11. Porter, K.; Johnson, G.; Sheppard, R.; Bachman, R. Fragility of mechanical, electrical, and plumbing equipment. Earthq. Spectra 2010, 26, 451–472. [Google Scholar] [CrossRef] [Green Version]
  12. Fathali, S.; Filiatrault, A. Experimental Seismic-Performance Evaluation of Isolation/Restraint Systems for Mechanical Equipment Part I: Heavy Equipment Study Technical Report, No. MCEER-07-0007; University at Buffalo, The State University of New York: Buffalo, NY, USA, 2007. [Google Scholar]
  13. Fathali, S.; Filiatrault, A. Experimental Seismic Performance Evaluation of Isolation/Restraint Systems for Mechanical Equipment Part 2: Light Equipment Study Technical Report, No. MCEER-07-0022; University at Buffalo, The State University of New York: Buffalo, NY, USA, 2007. [Google Scholar]
  14. International Code Council Evaluation Services Acceptance Criteria (ICC-ES AC156). Acceptance Criteria for Seismic Certification by Shake-Table Testing of Nonstructural Components; International Code Council Evaluation Service, Inc.: Whittier, CA, USA, 2000. [Google Scholar]
  15. Federal Emergency Management Agency (FEMA). Interim Protocols for Determining Seismic Performance Characteristics of Structural and Nonstructural Components through Laboratory Testing (FEMA 461); FEMA: Washington, DC, USA, 2017.
  16. Architectural Institute of Korea. Korean Building Code; Architectural Institute of Korea: Seoul, Korea, 2006. [Google Scholar]
  17. European Committee for Standardization. Eurocode 8: Design of Structures for Earthquake Resistance—Part 1: General Rules, Seismic Actions and Rules for Buildings, EN 1998–1; European Committee for Standardization: Brussels, Belgium, 2011. [Google Scholar]
  18. Wheeler, A.J.; Ganji, A.R. Introduction to Engineering Experimentation; Prentice Hall: Upper Saddle River, NJ, USA, 1996; pp. 180–184. [Google Scholar]
  19. Ljung, L. System Identification: Theory for the User; Prentice Hall: Upper Saddle River, NJ, USA, 1999. [Google Scholar]
  20. Irvine, T. The Half Power Bandwidth Method for Damping Calculation. 2005. Available online: www.vibrationdata.com (accessed on 17 June 2019).
  21. Wang, J.; Lü, D.; Jin, F.; Zhang, C. Accuracy of the half-power bandwidth method with a third-order correction for estimating damping in multi-DOF systems. Earthq. Eng. Eng. Vib. 2013, 12, 33–38. [Google Scholar] [CrossRef]
  22. Clough, R.W.; Penzien, J. Dynamics of Structures; Computers and Structures Inc.: Berkeley, CA, USA, 2003. [Google Scholar]
  23. Legrand Group. Cast Resin Transformers. For Distribution, Rectification, Traction and Special Solution. 2016. Available online: https://www.legrand.nl (accessed on 17 June 2019).
  24. American Society of Civil Engineers (ASCE). Minimum Design Loads and Associated Criteria for Buildings and Other Structures; ASCE Standard ASCE/SEI 7-16; ASCE: Reston, VA, USA, 2016. [Google Scholar]
  25. Korean National Radio Research Agency. Earthquake Resistance Test. Method for Telecommunication Facilities; Korean National Radio Research Agency: Naju-si, Korea, 2015.
  26. International Electrotechnical Commission (IEC). Power Transformers-Part. 11: Dry-Type Transformers; IEC Standard IEC 60076-11; IEC: Geneva, Switzerland, 2018. [Google Scholar]
Figure 1. Configurations and details of test specimen. HV, high-voltage; LV, low-voltage: (a) Three-dimentional view; (b) Side view; (c) Plan view; (d) Photo of hybrid mold transformer.
Applsci 10 00361 g001
Figure 2. Schematic of test set-up and measurement instrumentation. LVDTs, linear variable displacement transducers: RC = reinforced concrete.
Applsci 10 00361 g002
Figure 3. Photograph of test set-up and measurement instrumentation. TMDTs, tape measure type displacement transducers.
Applsci 10 00361 g003
Figure 4. Photograph of the shaking table system used in this study.
Applsci 10 00361 g004
Figure 5. Require response spectrum (AC156 code).
Applsci 10 00361 g005
Figure 6. Input acceleration time history in the X and Y-directions for AC156_100.
Applsci 10 00361 g006
Figure 7. Comparison between the input spectra of AC156_100 and required response spectrum (RRS) target.
Applsci 10 00361 g007
Figure 8. Transfer function amplitude versus frequency curves at top beam: (a) Test no.1–3; (b) Test no.8–10; (c) Test no.15–17; (d) Test no.20–22.
Applsci 10 00361 g008
Figure 9. Variation of fundamental frequency of test specimen evaluated based on acceleration data at different locations. (a) At top beam; (b) At left coil; (c) At center coil.
Applsci 10 00361 g009
Figure 10. Variation of damping ratio of test specimen evaluated based on acceleration data at different locations. (a) At top beam; (b) At left coil; (c) At center coil.
Applsci 10 00361 g010
Figure 11. Damage observation after different shaking table tests: (a) Weak points of test specimen; (b) After AC156_50; (c) After AC156_75; (d) After AC156_125; (e) After AC156_250; (f) After AC156_300.
Applsci 10 00361 g011
Figure 12. Acceleration response-time histories of test specimen of AC156_75.
Applsci 10 00361 g012
Figure 13. Acceleration response-time histories of test specimen of AC156_300.
Applsci 10 00361 g013
Figure 14. Peak acceleration response versus PGA at different locations of accelerometers. (a) At top beam; (b) At center coil; (c) At bottom beam; (d) At left coil.
Applsci 10 00361 g014
Figure 15. Amplification factor of test specimen at different locations of accelerometers. (a) At top beam; (b) At center coil; (c) At bottom beam; (d) At left coil.
Applsci 10 00361 g015
Figure 16. Relative displacement response-time histories of test specimen at the left coil. (a) at AC156_75; (b) at AC156_300.
Applsci 10 00361 g016
Figure 17. Maximum relative displacement of test specimen according to PGA. (a) X-direction; (b) Y-direction; (c) Z-direction.
Applsci 10 00361 g017
Figure 18. Maximum strain of the bottom and bed beams of test specimen according to scaling factor. (a) At the bottom beam; (b) At the bed beam.
Applsci 10 00361 g018
Table 1. Detailed specifications of the tested mold transformer.
Power Rating (kVA)Impedance (±10%)Voltage Regulation (%)No-Load Current (%)Standard Efficiency (%)DimensionsOperating Weight (kg)
Length (mm)Width (mm)Height (mm)
10004.991.32.599.41900103021103800
Table 2. Detailed specifications of the shaking table used in this test.
Table Size (m × m)4.0 × 4.0
TypeFixed
Degrees of freedom6
Full payload (kN)300
Overturning moment (kNm)1200
Acceleration at full payload (× g)
X-axis1.5
Y-axis1.5
Z-axis1.0
Maximum stroke (mm)
X-axis±300
Y-axis±200
Z-axis±150
Operational frequency range (Hz)0.1–60
Table 3. Input and test protocol. PGA, peak ground acceleration.
Test no.Test LabelRemarkScaling Factor (%)Input PGA (× g)
X-dirY-dirZ-dir
1–3Low-amplitude random testDynamic identification test. Random input signal, 1–50 Hz
4AC156_25 250.080.070.07
5AC156_50 500.150.130.14
6AC156_75 750.210.170.18
7AC156_100 1000.280.250.23
8–10Low-amplitude random testDynamic identification test. Random input signal, 1–50 Hz
11AC156_125 1250.330.300.27
12AC156_150 1500.420.360.31
13AC156_175 1750.500.430.39
14AC156_200 2000.570.500.47
15–17Low-amplitude random testDynamic identification test. Random input signal, 1–50 Hz
18AC156_250 2500.700.640.58
19AC156_300 3000.900.790.66
20–22Low-amplitude random testDynamic identification test. Random input signal, 1–50 Hz
Table 4. Peak response acceleration of the test specimen at different locations.
Test no.Test LabelPeak Response Acceleration (× g)
Top BeamCenter CoilBottom BeamLeft Coil
XYZXYZXYZXYZ
4AC156_250.170.190.100.200.150.130.080.110.090.180.120.13
5AC156_500.340.360.200.330.240.240.160.170.210.360.240.22
6AC156_750.450.700.420.420.360.360.230.510.330.420.400.34
7AC156_1000.540.940.540.480.490.430.540.451.040.520.530.46
11AC156_1250.701.091.200.590.520.610.961.101.000.510.690.60
12AC156_1500.750.980.900.620.590.760.711.031.250.600.670.74
13AC156_1750.861.051.350.680.690.700.841.271.680.770.690.83
14AC156_2001.051.330.720.840.850.720.821.501.440.950.891.02
18AC156_2501.481.840.860.991.100.821.491.901.871.231.471.18
19AC156_3001.623.301.111.211.101.021.572.311.111.281.411.58
Table 5. Operational test results.
Name of TestAcceptance Criterion (IEC 60076-11)Test Results
Before Shaking Table TestsAfter Shaking Table Tests
External appearance evaluation GoodGood
Winding resistance measurement (at 100 °C) (Ω; Ω)HV winding resistance0.1740.179
LV winding resistance0.0008460.000797
No-load current (%)<2.50.240.24
No-load loss (W) 14761487.00
Impedance voltage test (V; %) 328.6360.00
<104.995.46
Load loss (W) 4859.665327.99
Full-load loss (W) 6335.666814.99
Efficiency (%)>98.699.3799.32
Voltage fluctuation rate (%)<1.30.610.68
Insulation resistance measurement GoodGood
Separate-source withstand voltage test GoodGood
Impulse withstand voltage test GoodGood
Temperature-rise test GoodGood
Noise level test (dB)<7053.6950.9
Partial discharge test<1055

