Article

Modeling Palletized Products: The Case of Semi-Filled Bottles under Top-Load Conditions

by
Ana Pavlovic
1,
Cristiano Fragassa
1,*,
Luca Vegliò
1,
Felipe Vannucchi de Camargo
1,2 and
Giangiacomo Minak
1
1
Department of Industrial Engineering, University of Bologna, viale Risorgimento 2, 40136 Bologna, Italy
2
Post-Graduation Program in Mining, Metallurgical and Materials Engineering, Federal University of Rio Grande do Sul, Rua Osvaldo Aranha 99, Porto Alegre 90035-190, Brazil
*
Author to whom correspondence should be addressed.
Appl. Sci. 2020, 10(1), 332; https://doi.org/10.3390/app10010332
Submission received: 21 August 2019 / Revised: 1 October 2019 / Accepted: 7 October 2019 / Published: 2 January 2020

Abstract

:
An investigation on numerical methods able to simplify the mechanical behavior of PET bottles, partially filled with liquid, under compression loadings is presented here. Compressive stress conditions on bottles are very common during their transportation and can be accompanied by large deformations and instabilities that can compromise the integrity of the pack, with the risk of significant damages. The present paper proposes two approaches, both based on finite elements, and with elastic-plastic material models properly defined with the scope of investigating the complex phenomena that take place during these loading conditions. Although not perfect in terms of accuracy, these numerical methods have been proven to be capable to predicti the transport-related integrity risks, showing results that agree with experimental data, especially during the initial phases of load compression.

1. Introduction

The irreversible damage of goods during transportation, caused mainly by sloshing, vibration, and shock mechanical solicitations [1], is a common scenario nowadays in the logistics sector, resulting in significant economic losses to both the retailer and manufacturer [2]. The environmental aspect is particularly affected by the greenhouse gas (GHG) emissions to produce and ship goods that, being damaged, will not satisfy the customer and will end up in a landfill. On the other hand, the economic losses can be ultimately managed in some way. For instance, an increase in the price of goods, as estimated with proper methods, as in [3], can be added to ensure the economic sustainability of the industrial investment. On the contrary, the environmental cost inferred by deteriorated goods, as claimed in [4], is often definitive and articulated on multifaceted aspects, such as materials no longer usable, energy and water used for product processing, and fuel and carbon dioxide used during the transport phases.
The loss in functionality and usability of goods during transportation can be considered a non-negligible fraction of the whole number of products moved around the world. For instance, a study commissioned by Walmart [5] estimated the phenomenon in 1,176,260 pallets damaged each year, equivalent to 58,813 truckloads of product going into landfill that, at the financial level, equates to about $2400M and 18% earnings. Many leading companies are trying to identify and stem the causes of the deterioration of goods due to transport [6]. The evaluation of the economic repercussions of these phenomena through in-depth analyses [7] can lead to the identification of solutions to be adopted by the company to minimize losses.
Several recent studies [8,9] have been directed to optimize transport conditions, developing solutions for what is commonly referred to as ‘secondary packaging’, which does not take into consideration packaging materials that are not in direct contact with the product (e.g., blisters, sachets, boxes). In particular, in the case of bottles, the secondary packaging refers to the action of arranging the bottles together into bundles covered with stretch wrap films, positioned side by side and overlapped to form the pallets (Figure 1a). The pallets, which, in the case of bottles, can also contain tens of bundles arranged on several levels, are protected by the deposition of several layers of stretch film. This plastic and thin film is deposited with special implants, combining both the wrapping and pre-tensioning actions of the film itself (Figure 1b).
In this way, a stabilization effect is created with respect to external dynamic stresses, which is added to the general protection offered by the presence of the plastic layer outside. Through a suitable choice of the type of film and the wrapping parameters it is possible to guarantee suitable levels of protection with respect to the most common stress conditions [10,11] that are generated during the transport phases. This is possible as long as the bottles retain their structural integrity. The external packaging can do very little if the stressors on the individual bottles are such that can damage them. This effect is not so rare, considering the attempt to use progressively lighter and slimmer bottles close to the limit conditions, in the face of always large and heavy pallets. The result is that bottles are subjected to various types of loads during transport and with various possibilities of damage, with one of the most dangerous being that which leads to buckling.
Plastic bottles have been widely used since 1989 as containers for water, milk, and other beverages. The body is usually made of PET (polyethylene terephthalate) from pre-printed plastics (Figure 2a) and then blown, while the bottle cap is made of PE (polyethylene). The form is not only conceived for an aesthetic purpose, but it also aims to guarantee adequate stiffness during transport (being stacked on top of each other) and specific features during use (Figure 2b).
The understanding of what happens during the crushing of the bottle involves a number of complications, and, to detail this complexity, it must be considered that plastic bottles are usually:
  • Made of Polyethylene terephthalate (PET), a material with a restricted elastic zone: by increasing the load the plastic regime is easily reached;
  • Designed in complex shapes, including reinforcing and functional elements;
  • Manufactured by highly efficient and standardized processes;
  • Designed with minimum thicknesses to reduce weight and cost.
The bottles are then filled, not completely, with the liquid to be contained and transported (natural water in the present case). By its turn, the partial filling represents one of the most significant reasons able to add complexity to the problem [12]. The air cushion inside the bottle creates a gas–liquid–structure interaction in response to any external mechanical (or thermal) stresses. This is the main reason why assembling a numerical model becomes challenging.
Several studies are available where experimental tests were conducted with methods and results similar to those presented in this study. For instance, in [13,14], the bottle was characterized by a monoaxial compression test, extrapolating the trend of the force as a function of the lowering. In [15], a system was specifically developed for the evaluation of the contact pressures between the bottom of the container and the fixed base, using pressure transducers in order to be experimentally correlated with a drop test. In [16], a probe for monitoring the internal pressure of the bottle was considered, stating the decrease in the volume of air during the deformation phase. In [17], a system of circumferential bands driven by a traction system was described to determine the radial resistance of the component, being able to characterize the body also orthotopically.
It must be also considered that there are widespread standard tests, for example, top-load tests (according to ASTM D 2659-95 [18], as in [17,19,20]), that lead this kind of test as a common practice, also in the case of industrial applications. The difficulty is not related to the implementation of these tests or in collecting pertinent experimental data, but in the possibility of generating a complete model (theoretical or numerical) able to interpret the information.
There are several studies that attempt to tackle this theoretical or numerical modeling through two different approaches. The first type of method, closely linked to the bottle-producing companies, consists of modeling the body according to the geometry, type, and quantity of material necessary to guarantee a predetermined resistance. In numerous studies (e.g., [21,22]) the simulations were totally focused on the minimization of the thickness to reduce the cost or, as analyzed in [23], to introduce new types of bottles to the market. Once implemented, the characteristics of the material and the discretization of the profiles with a small variable thickness represent a computational challenge, which can be addressed with the models presented in [24,25,26].
The second method consists of evaluating the interaction between the liquid, gas, and wall, described in [27]. This type of approach, based on both the Eulerian and Lagrangian models, is used to define the volume of liquid and air present inside the bottle, losing precision in the definition of the container itself. An example of this approach can be found in [28].
The various papers presented in [19,23] on static and dynamic simulations describe the numerical methods used for the simulation of the bottles. The effect of the interaction between water and air analyzed in [23,29] was considered only from a phenomenological point of view, that is to say, by representing it by a pressure acting on the inner surface of the container, as in [16,30,31]. In some cases, this phenomenon was modeled by means of a membrane consisting of elements that can be infinitely extended and which simulate a contact layer between the contents of the bottle and the wall. Unfortunately, such an approach, as used in [17,19], is not described in detail, making this type of simplification useless. Thus, it is possible to say that, at the moment, there are no studies that consider all the different phenomena of interest altogether. Furthermore, the complexity that has emerged would produce formulations and models that are difficult to apply in an industrial context, whereas the present interest relies on having rapid information on the risk of damage compared to the variation in shape, thickness, material, and stressors. All this seems possible only through the realization of specific experimental campaigns, one for each of the cases of interest, which represents an expensive and not always feasible approach.

2. Materials and Methods

2.1. Aim and Scope

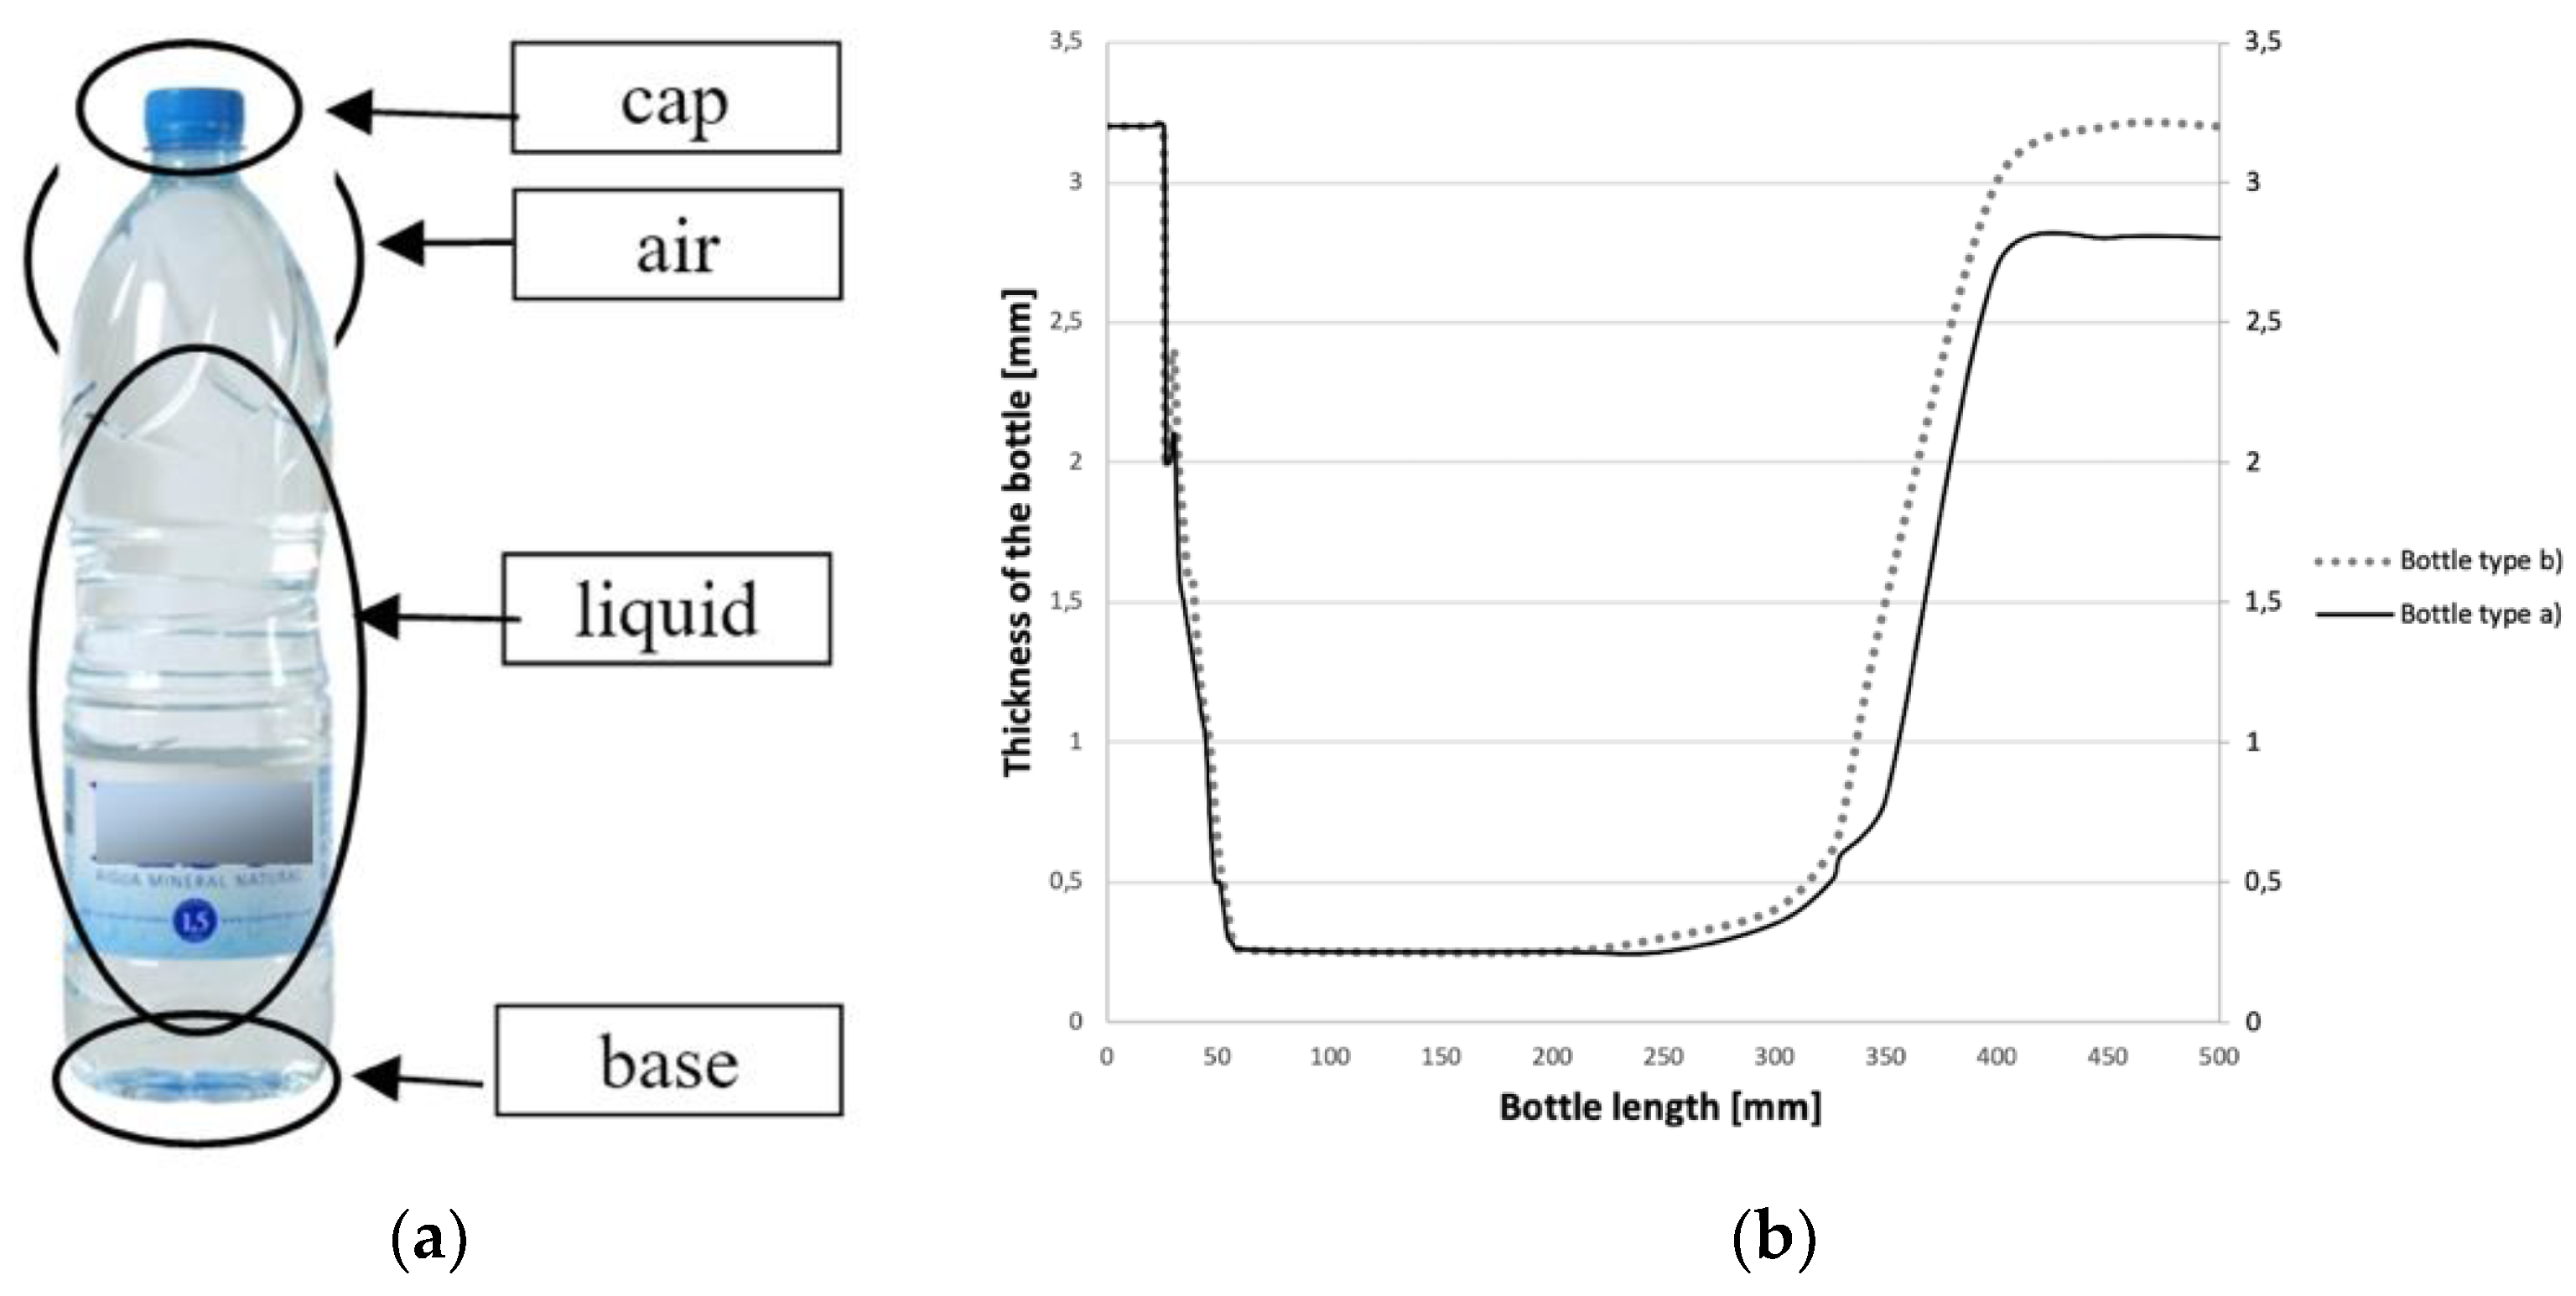
The present study aimed to analyze the behavior of a thin plastic bottle when subjected to vertical compression loads by integrating a numerical approach and an experimental one. For this purpose, the study presented a needful simplification of the phenomena acting on the bottle [32], characterized by a geometrically complex profile and made of PET, with the orthotropic characteristics given in Table 1. The same table also reports the main isotropic properties of PE, used for the bottle cap.
The bottle was considered to be partially filled with liquid, closed by the cap, constrained in the base by a friction contact, and subjected to a compression load along the longitudinal axis.
Every study took into consideration:
  • The specific tridimensional shape of the bottle (Figure 3a);
  • The variable thickness of the profile (Figure 3b);
  • The orthotropic nonlinear (elastoplastic) behavior of PET;
  • The cap rigidity, thicker than the profile, made of a more resistant PE;
  • The column of incompressible liquid, able to transmit pressure to the inner walls of the bottle;
  • The air, trapped between the free surface of the fluid and the bottle, as a compressible element.
With this scope, two approaches toward the simplification are proposed here.

2.2. Dual Approach

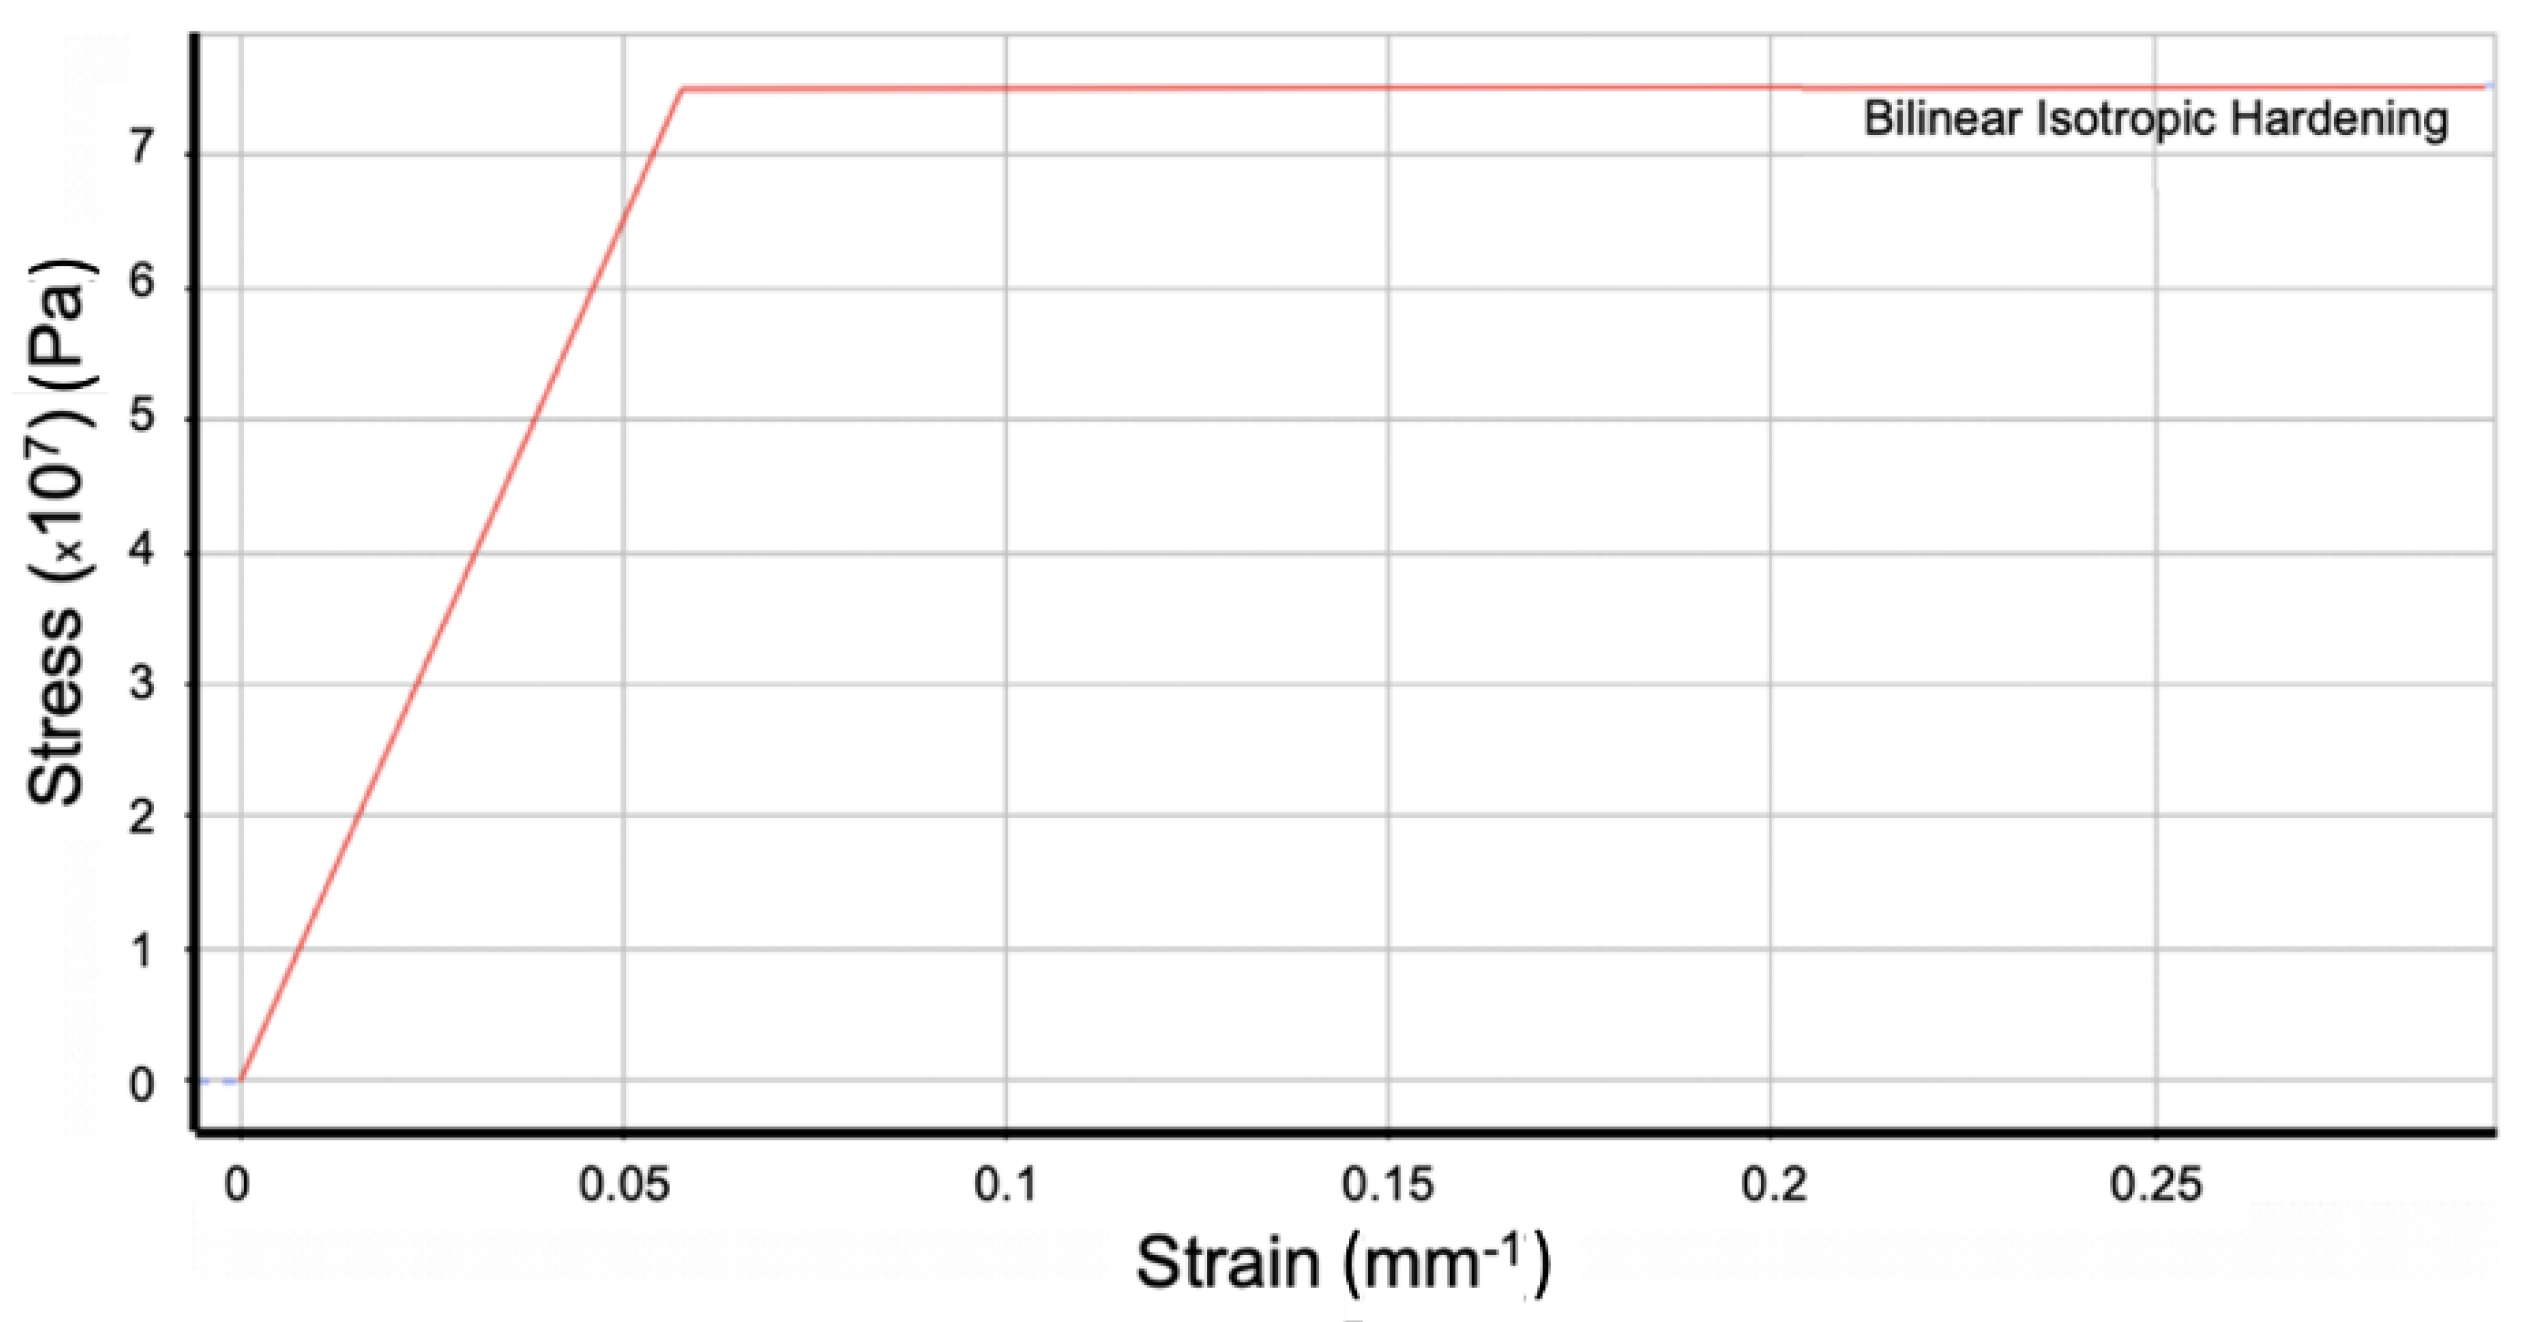
The first approach involved the use of an exactly faithful external geometry, as obtained from the 3D model supplied by the bottle manufacturer. In the case this geometry is not available, it could be obtained by reverse engineering, while the tendency of the thickness could be derived by analogy with respect to similar cases, available in the literature (Figure 3b). In terms of numerical discretization, the bottle was approximated by two-dimensional shell elements. The material properties were found in the vast specialized literature, taking into account the general characteristics of PET and PE. In particular, in the present case a bilinear isotropic hardening model was used for modeling PET (in accordance with [19,23,34]). The thin walls of the bottle were subjected to compression stress, to which a pressure component linked to the progressive compression of the air gap was added. The trend over time of the pressure during the test could be estimated through the equation of real gases (or, given the low pressures involved, through the perfect gas equation). However, according to the literature, which foresees the explosion of the bottle in the presence of internal overpressures around 1 MPa in the case of 1.5 L bottles, a linear increase was used up to this value (Figure 4) [23]. The liquid was considered incompressible and capable both of transferring the pressure exerted by the gas to the contact walls and of adding the effect of its own pressure due to the water column (Stevino’s law).
The second approach, of lower complexity, involved the use of a simplified bottle geometry, obtainable from the available databases, and chosen only by analogy with the bottles of real interest. This geometric model can be considered a single solid block, discretized by 3D solid elements (including air and liquid). The properties of the materials were assigned in such a way as to respect the macroscopic behavior of the bottle, as emerged from the experimental tests. To make this approach possible, different models and materials had to be considered and compared with the experimental evidence to verify when the top load tests were correctly reconstructed. Although this simplification may seem extreme in terms of simplification, compared to a plain investigation of the physical phenomena, sometimes it represents the only possibility. In fact, it made it possible to model the behavior of the pallet, of which the bottle represents only one of the elements. Once the model of the bottle was brought back with a black-box approach, to which numerical, literature, and experimental elements were integrated, it was possible to study the interaction between these black-boxes, grouped in bundles, which in turn interact in the composition of the pallet, all mediated through the action of polymeric coatings.

3. Experiments

3.1. Experimental Evidence

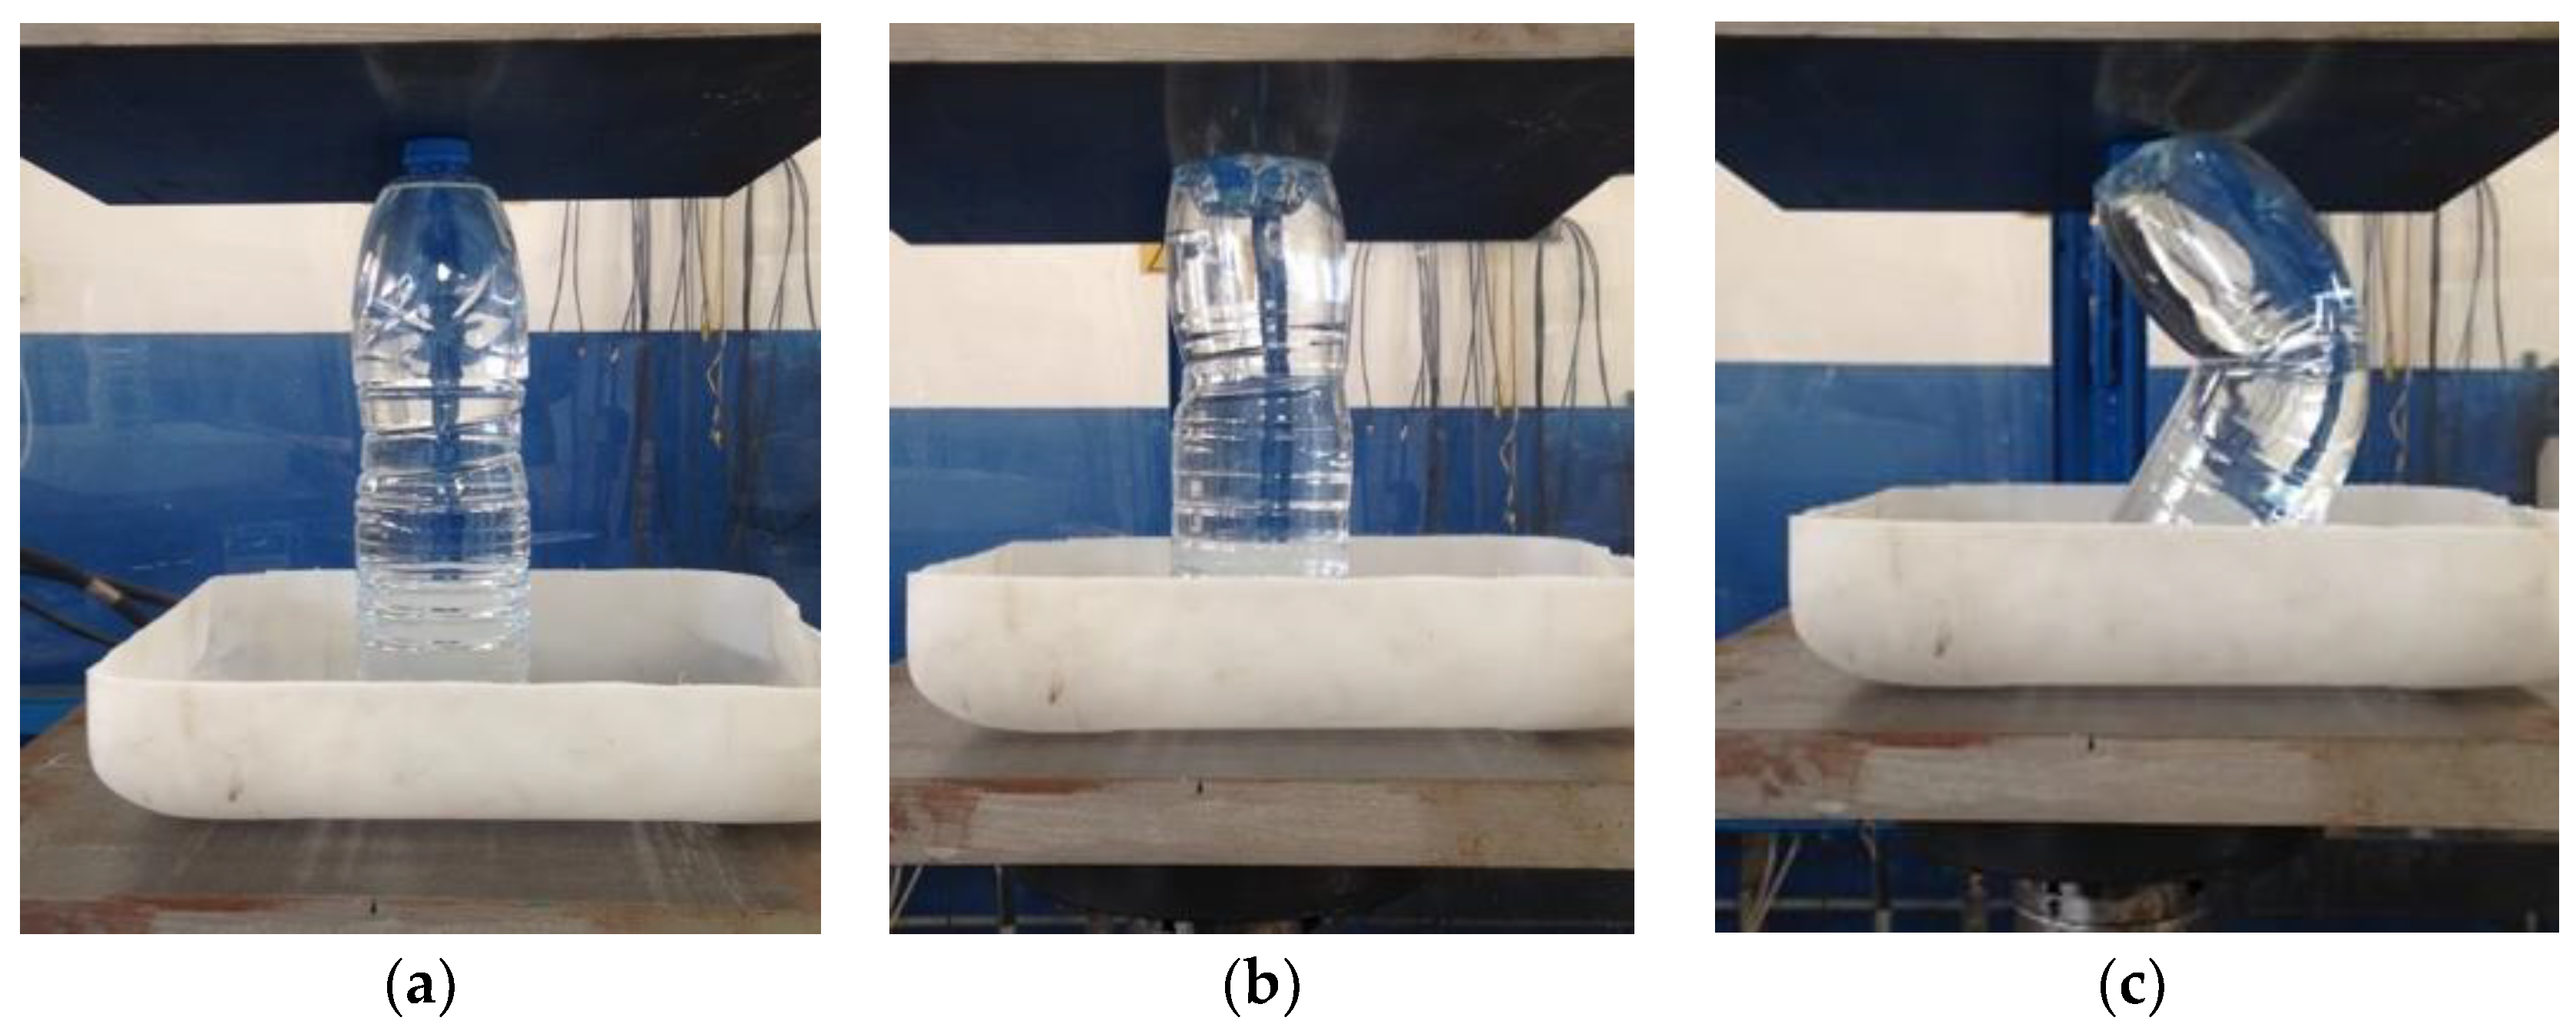
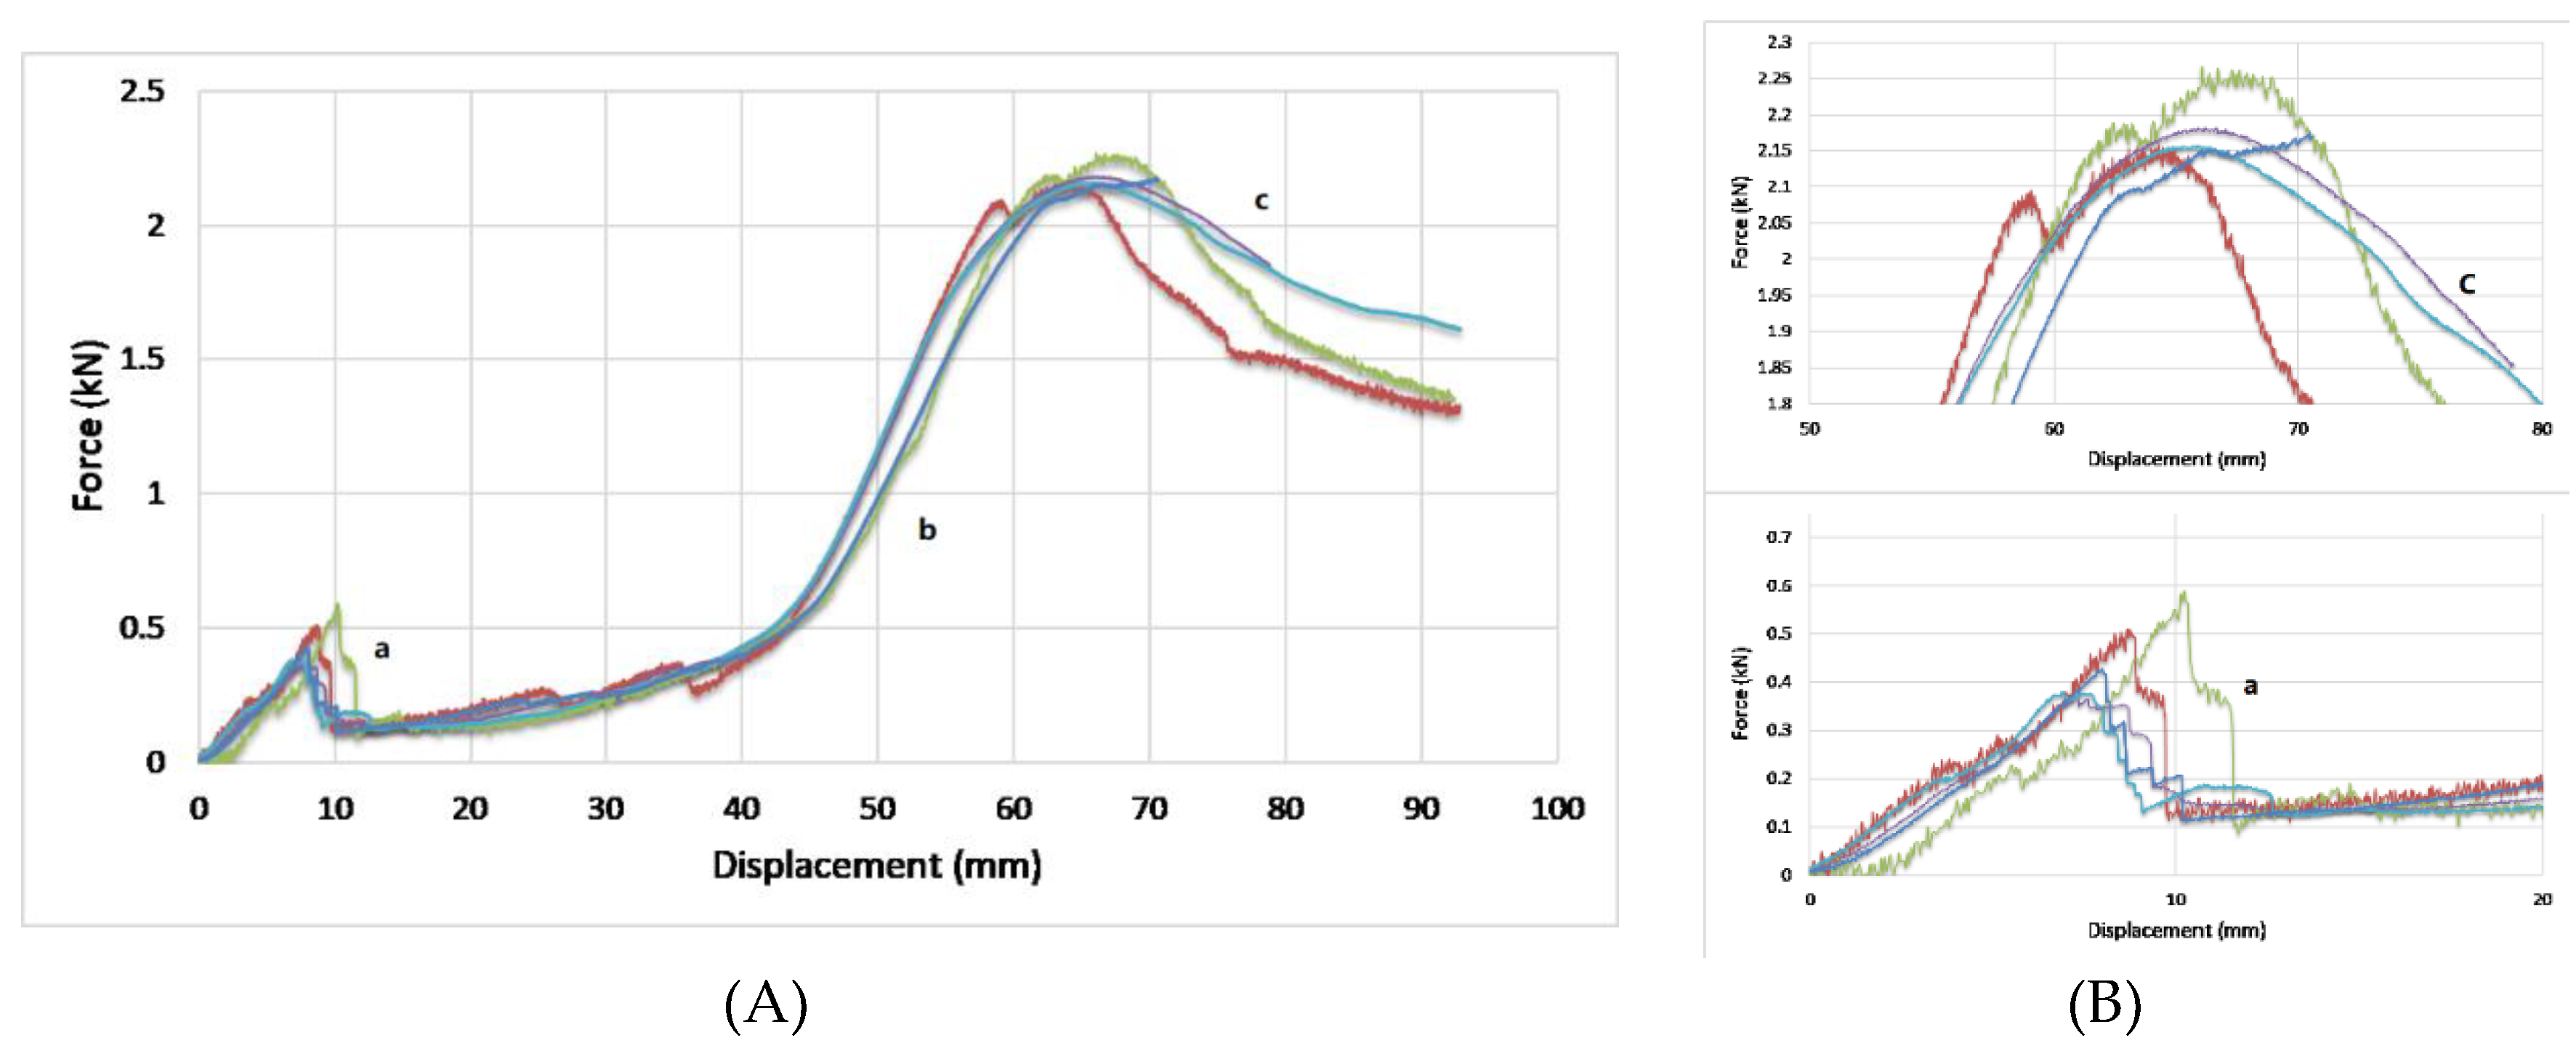
During the experimental tests, five 1.5 L water bottles (h = 310 mm, ϕ = 87 mm) were considered as specimens. Compressive tests were realized on an Instron 8032 servo-hydraulic universal testing machine with a 2517-005 load cell with ±250 kN dynamic and ±500 kN static range at a 0.25 mm/s ramp accounting for different displacements. The output data given by the testing machine were force, time, and displacement. Tests were run along the bottle axis (vertical direction), with a behaviour as shown in Figure 5. Force–displacement diagrams were also measured and displayed in Figure 6 where results from five tests are reported. These trends show an initial proportional zone (a), the bottleneck completely dented (b) and, lastly, the buckling phenomenon (c).
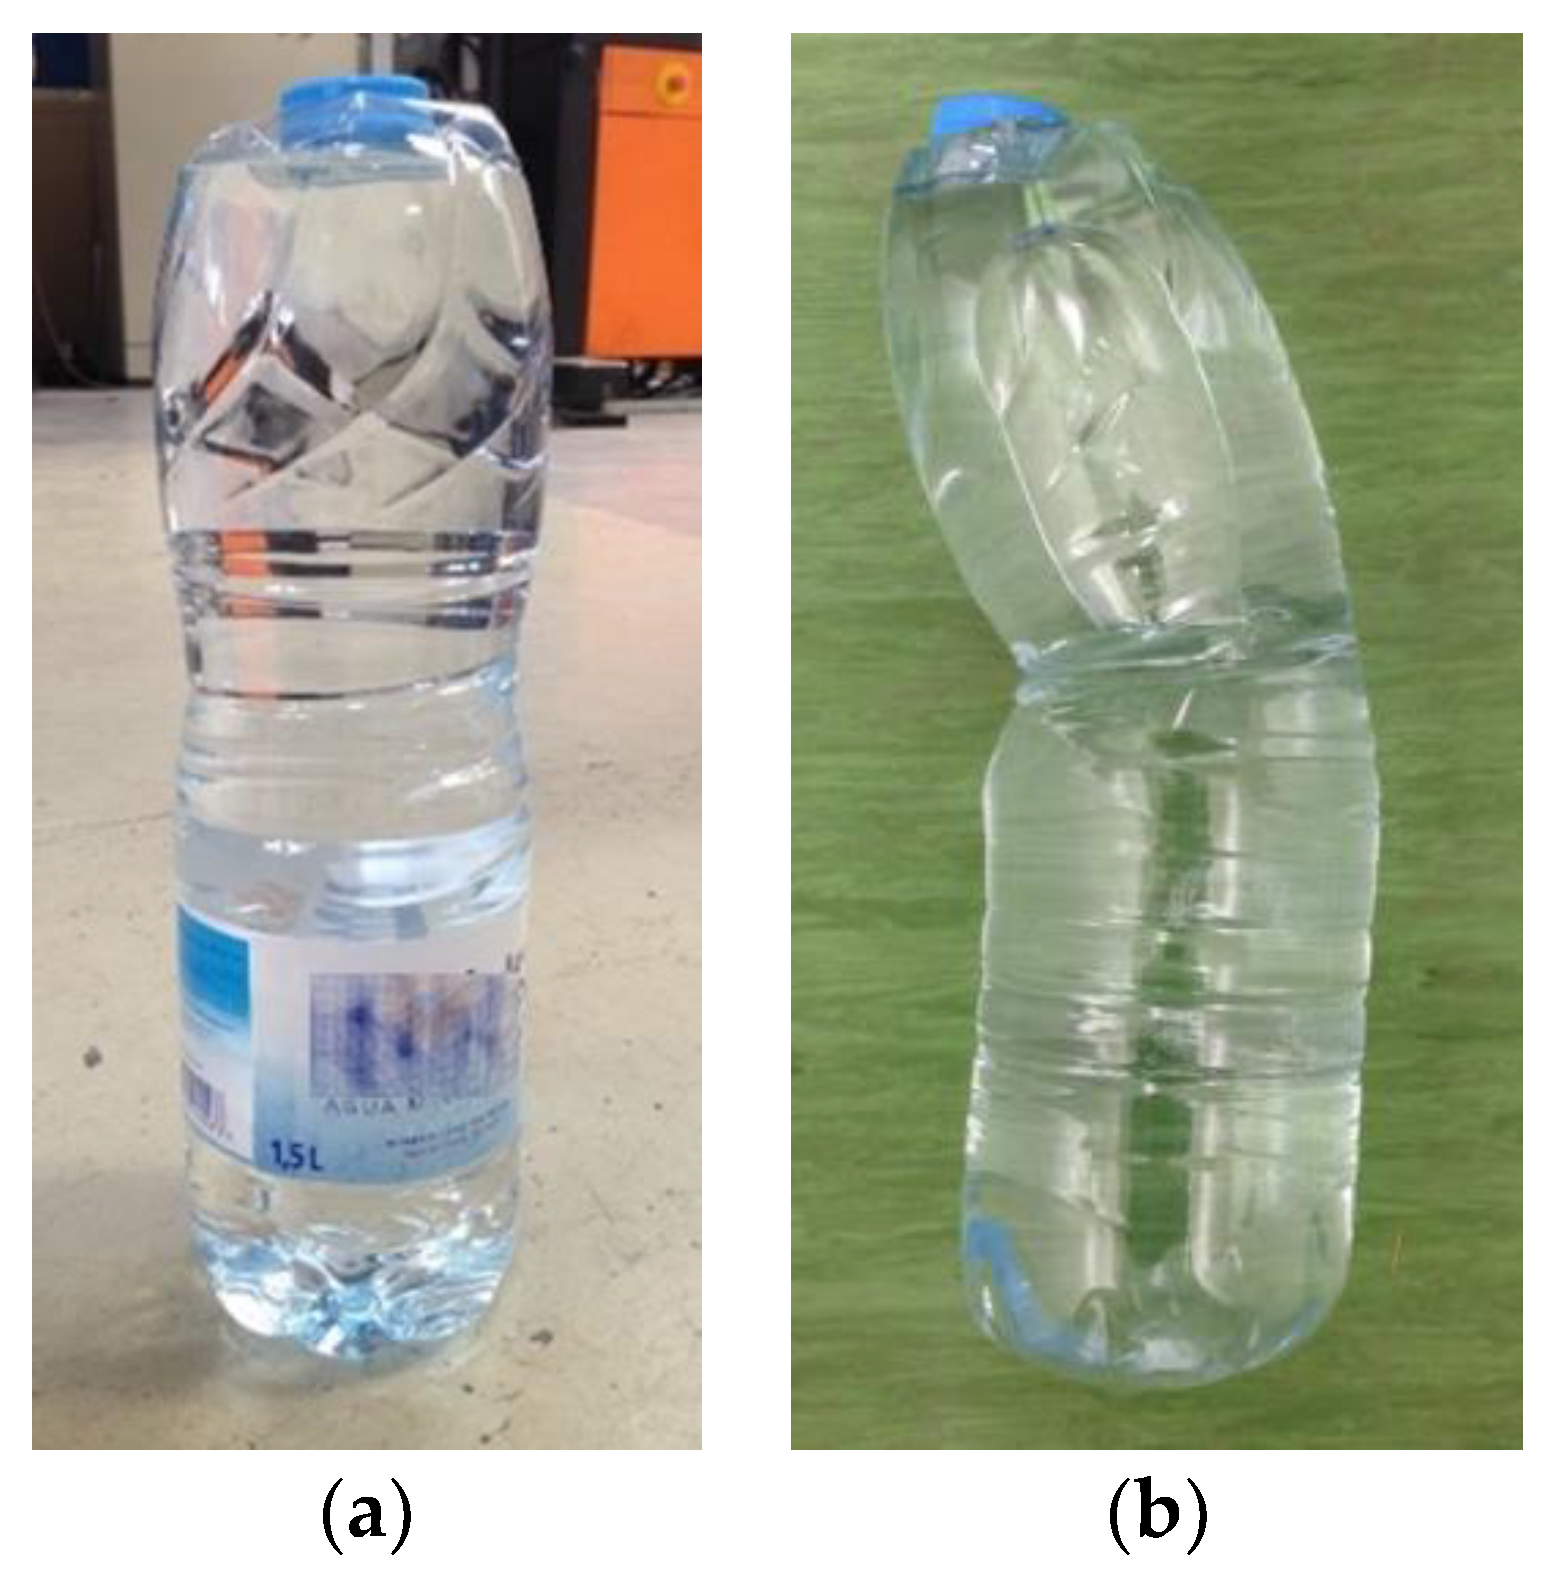
It can be noted that an exceptional event occurred at 8–10 mm of displacement, equal to around 2.5–3.0% of axial deformation and 0.5 kN, able to split the graph in two different regions, one with linear and the other with nonlinear behaviors. It corresponds to the indentation of the bottle, with the cap collapsing inside the neck (Figure 7a). Once the elastic response zone was passed, various phenomena became visible, increasing the load. In particular, over 2 kN, buckling happened in the specimens due to the geometry of the bottle: the tapered shape in the midways transversal plane prompted this behavior, whereas axial compression was left aside. At the end of the test, in the absence of a load, a residual deformation was also present (Figure 7b).

3.2. An Interpretation

Within the scope to anticipate the simplification proposed later, the single bottle can be treated as a column. In this case, from the experimental measures it was possible to build an equivalent stress–strain chart to figure out an equivalent elastic modulus. The force was transformed into stress by dividing it by the circular transversal area of the bottle, with a nominal diameter of 87 mm. On the other hand, the strain was calculated based on the initial length of the specimen, i.e., the height of the bottle, equal to 310 mm.
This stress–strain diagram is reported in Figure 8a, where it is possible to verify the same unexpected variation in the trend. Before this change, a clear elastic tendency is shown until at least 1% of deformation, in which the slope can be represented using the Young’s modulus (similarly to the case of the elastic response of materials). Then, the elastic modulus could be also calculated as the slope of a highly correlated linear fitting curve from 0% to 1% (Figure 8b). In other terms, if it was possible to consider the system of a bottle as an isotropic material, then the Hooke’s formula should be taken into account, yielding a value equal to:
E   =   3.08 ± 0.47   GPa .
Analogously, treating the single bottle as a column, the theoretical threshold force for buckling can be calculated. This theoretical analysis, given in Equations (2)–(4), assumes the moment of inertia I (mm4) of a solid circular cylinder (because after the bottleneck is dented the fluid should be considered as incompressible), the elastic modulus E (MPa), the column length L (mm) taken as 310 mm, and finally the buckling factor n which is equal to 1 in this condition where both ends are pivoted, and not fixed.
F   =   n π 2 E I L 2 ,
where:
I   =   π d 4 64 ,
so,
F b u c k , t h e o r y   750   N .
At the same time, it is evident the sharp decrease in the strain deformation diagram (shown by the transition line in Figure 8a) can be attributed to the variation in the resistant section during compression, coinciding with the collapse of the bottleneck (Figure 5b), before reaching the column of liquid. During the first compression phase, the force acts on the section corresponding to the cap, as the bottle deforms longitudinally, the resistant section widens until it reaches the maximum resistant section, which coincides with the meeting of the fluid column, equal to 5942 mm2.

4. Numerical Models

4.1. Shell (2D) Model

Two-dimensional shell elements were used in this first finite elements (FE) study to evaluate the behavior of PET bottles under compression in the case of top-load tests. In particular, both a non-linear static and a buckling analysis were done by ANSYS Workbench v.18.1.
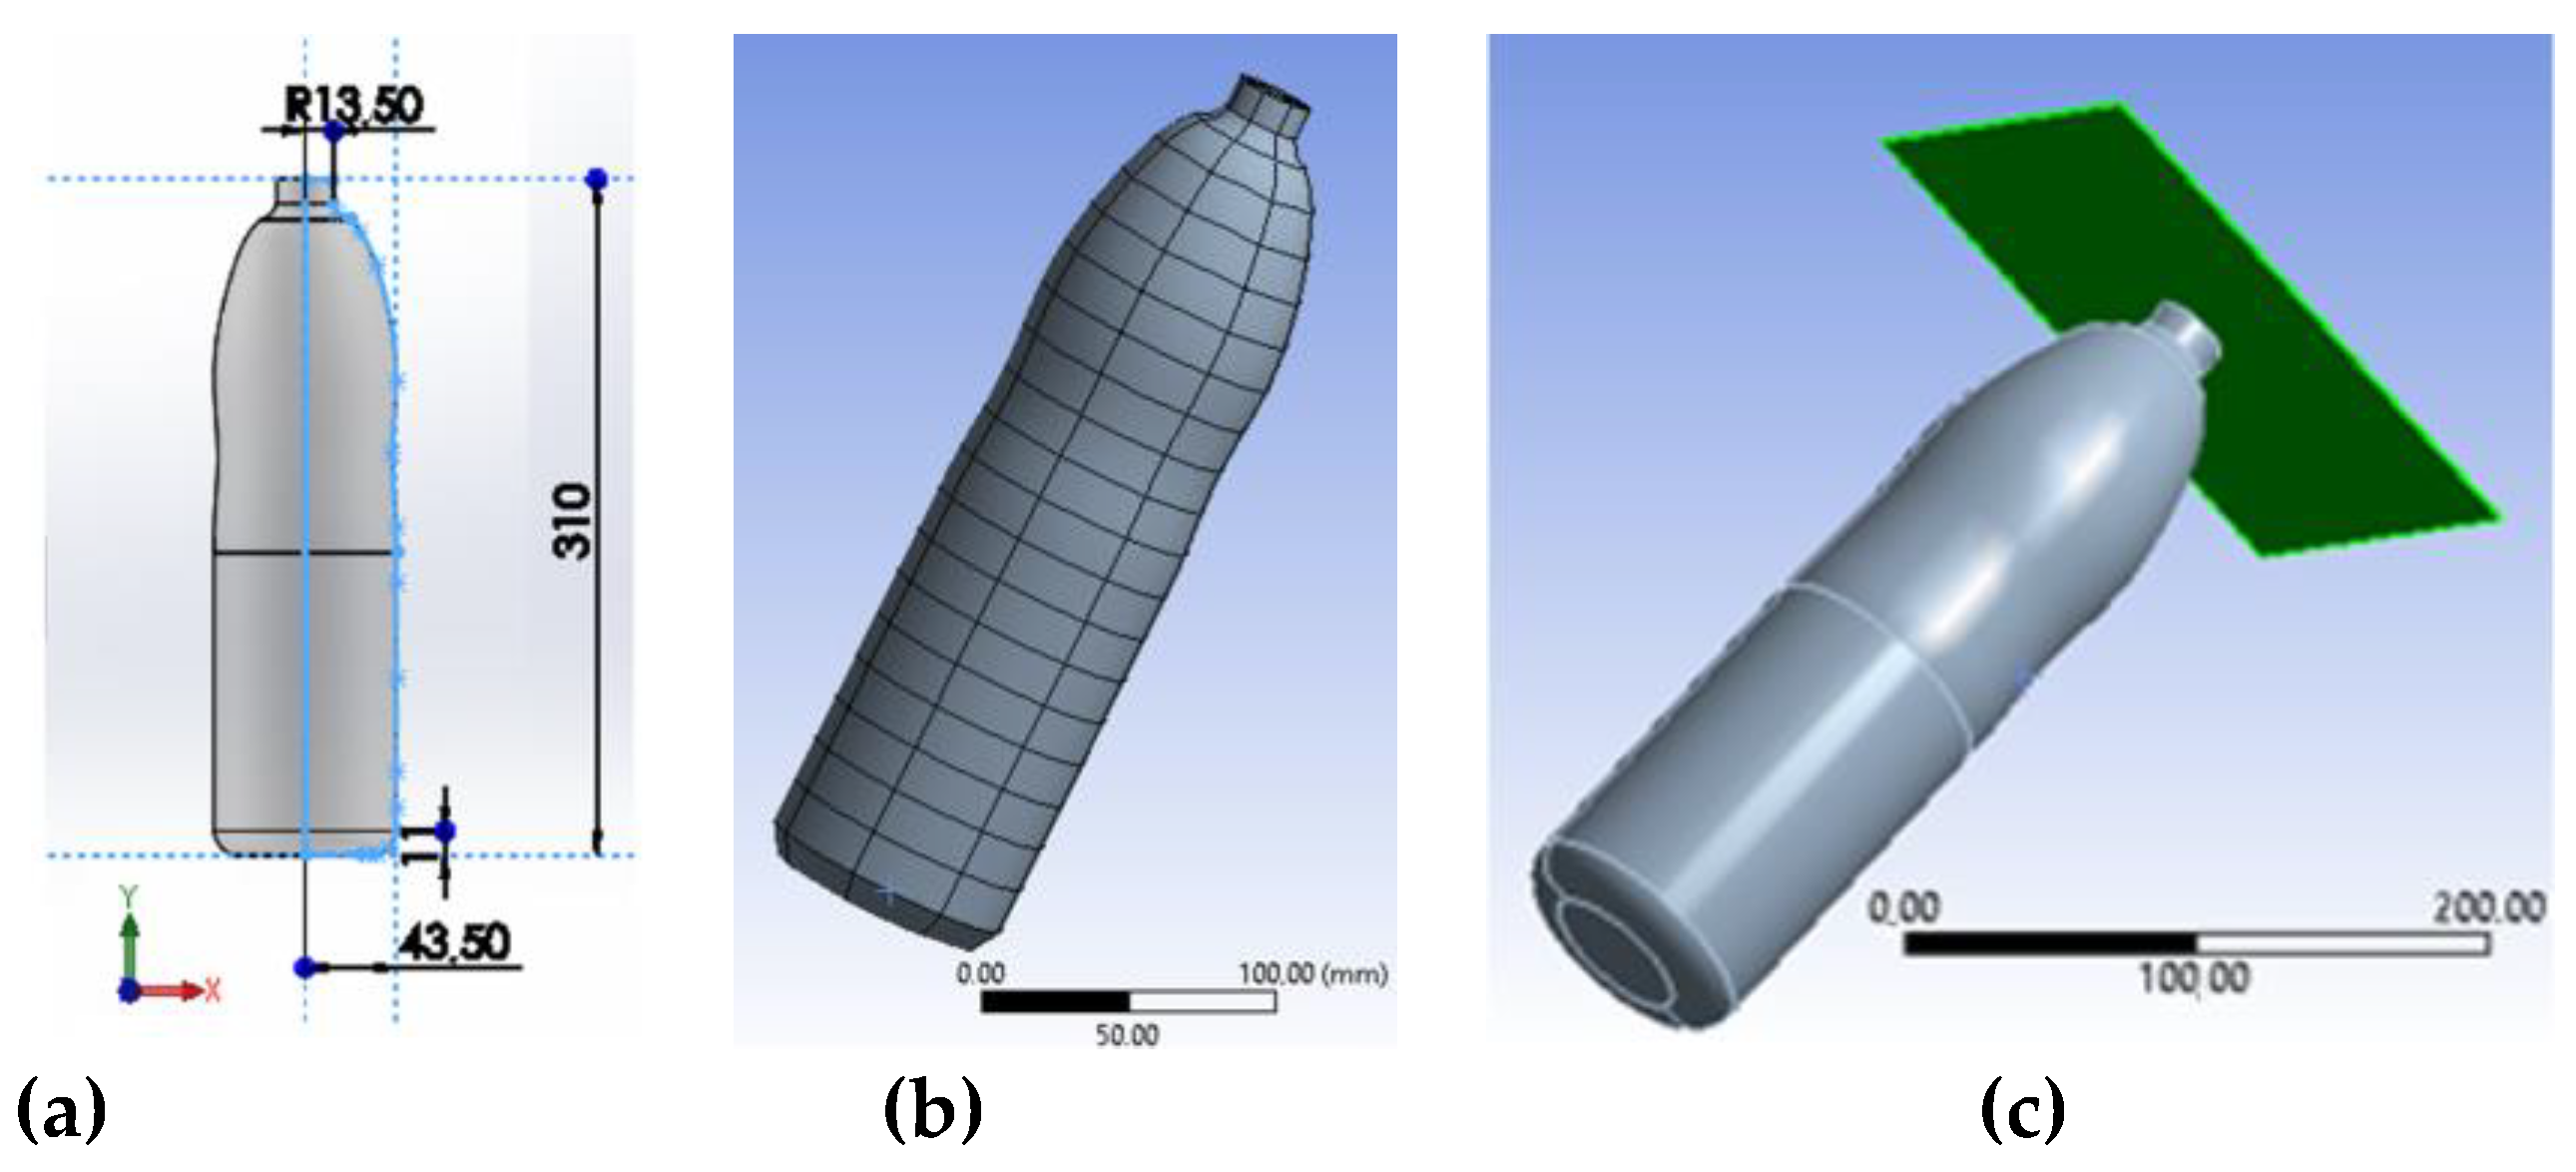
The geometry was simplified as displayed in (Figure 9a): all secondary details like fittings, chamfers, and notches were removed, since they marginally affect the system; the cap was merged to exclude contact problems; the thickness was simply defined as uniform and equal to 0.3 mm.
Four-node shell elements, 13,258 in total, were used to create the FE grid. This mesh, optimized for buckling analysis, can be observed in the area of cap and neck in Figure 9b.
In the base of the bottle all the translations and rotations were constrained (Figure 9b). The effect of water and air inside the bottle was replaced by an internal pressure, increasing over time roughly in accordance with the equation of state of perfect gases. The contact between bottle and plate was defined as a contact with friction, with a coefficient of friction equal to 0.2 representing the friction between PET and steel. Material properties were defined in line with Table 1 with a bilinear isotropic hardening model with a plastic zone starting from a yield value of 75 MPa (Figure 4).
With the scope to perform the quasi-static analysis, the bottle was loaded by a rigid plate moved by a displacement of 10 mm in the vertical (Y) direction (Figure 9c). This value was chosen by considering the maximum displacement in the elastic region as measured by top-load tests (Figure 6). In some ways, it represents the experimental evidence of the maximum load that this specific bottle can resist without moving its status to the plasticity.
The simulation of maximum load is widely used in the PET bottle industry and the vertical load test determines the weak points inside the bottles. Thus, the numerical analysis limited to this value can be extremely useful, for example, in detecting problems in the blow molding line and to check if the component failures are repeated in the same points.
Also, in this case, a non-linear structural simulation was performed with the maximum load for bottle verification in order to obtain a reliable model of an empty PET bottle. The simulation was divided into two steps: load in terms of displacement up to 10 mm, and pressure increase up to 1 MPa. Non-linearity due to geometry was taken into account through large displacements.
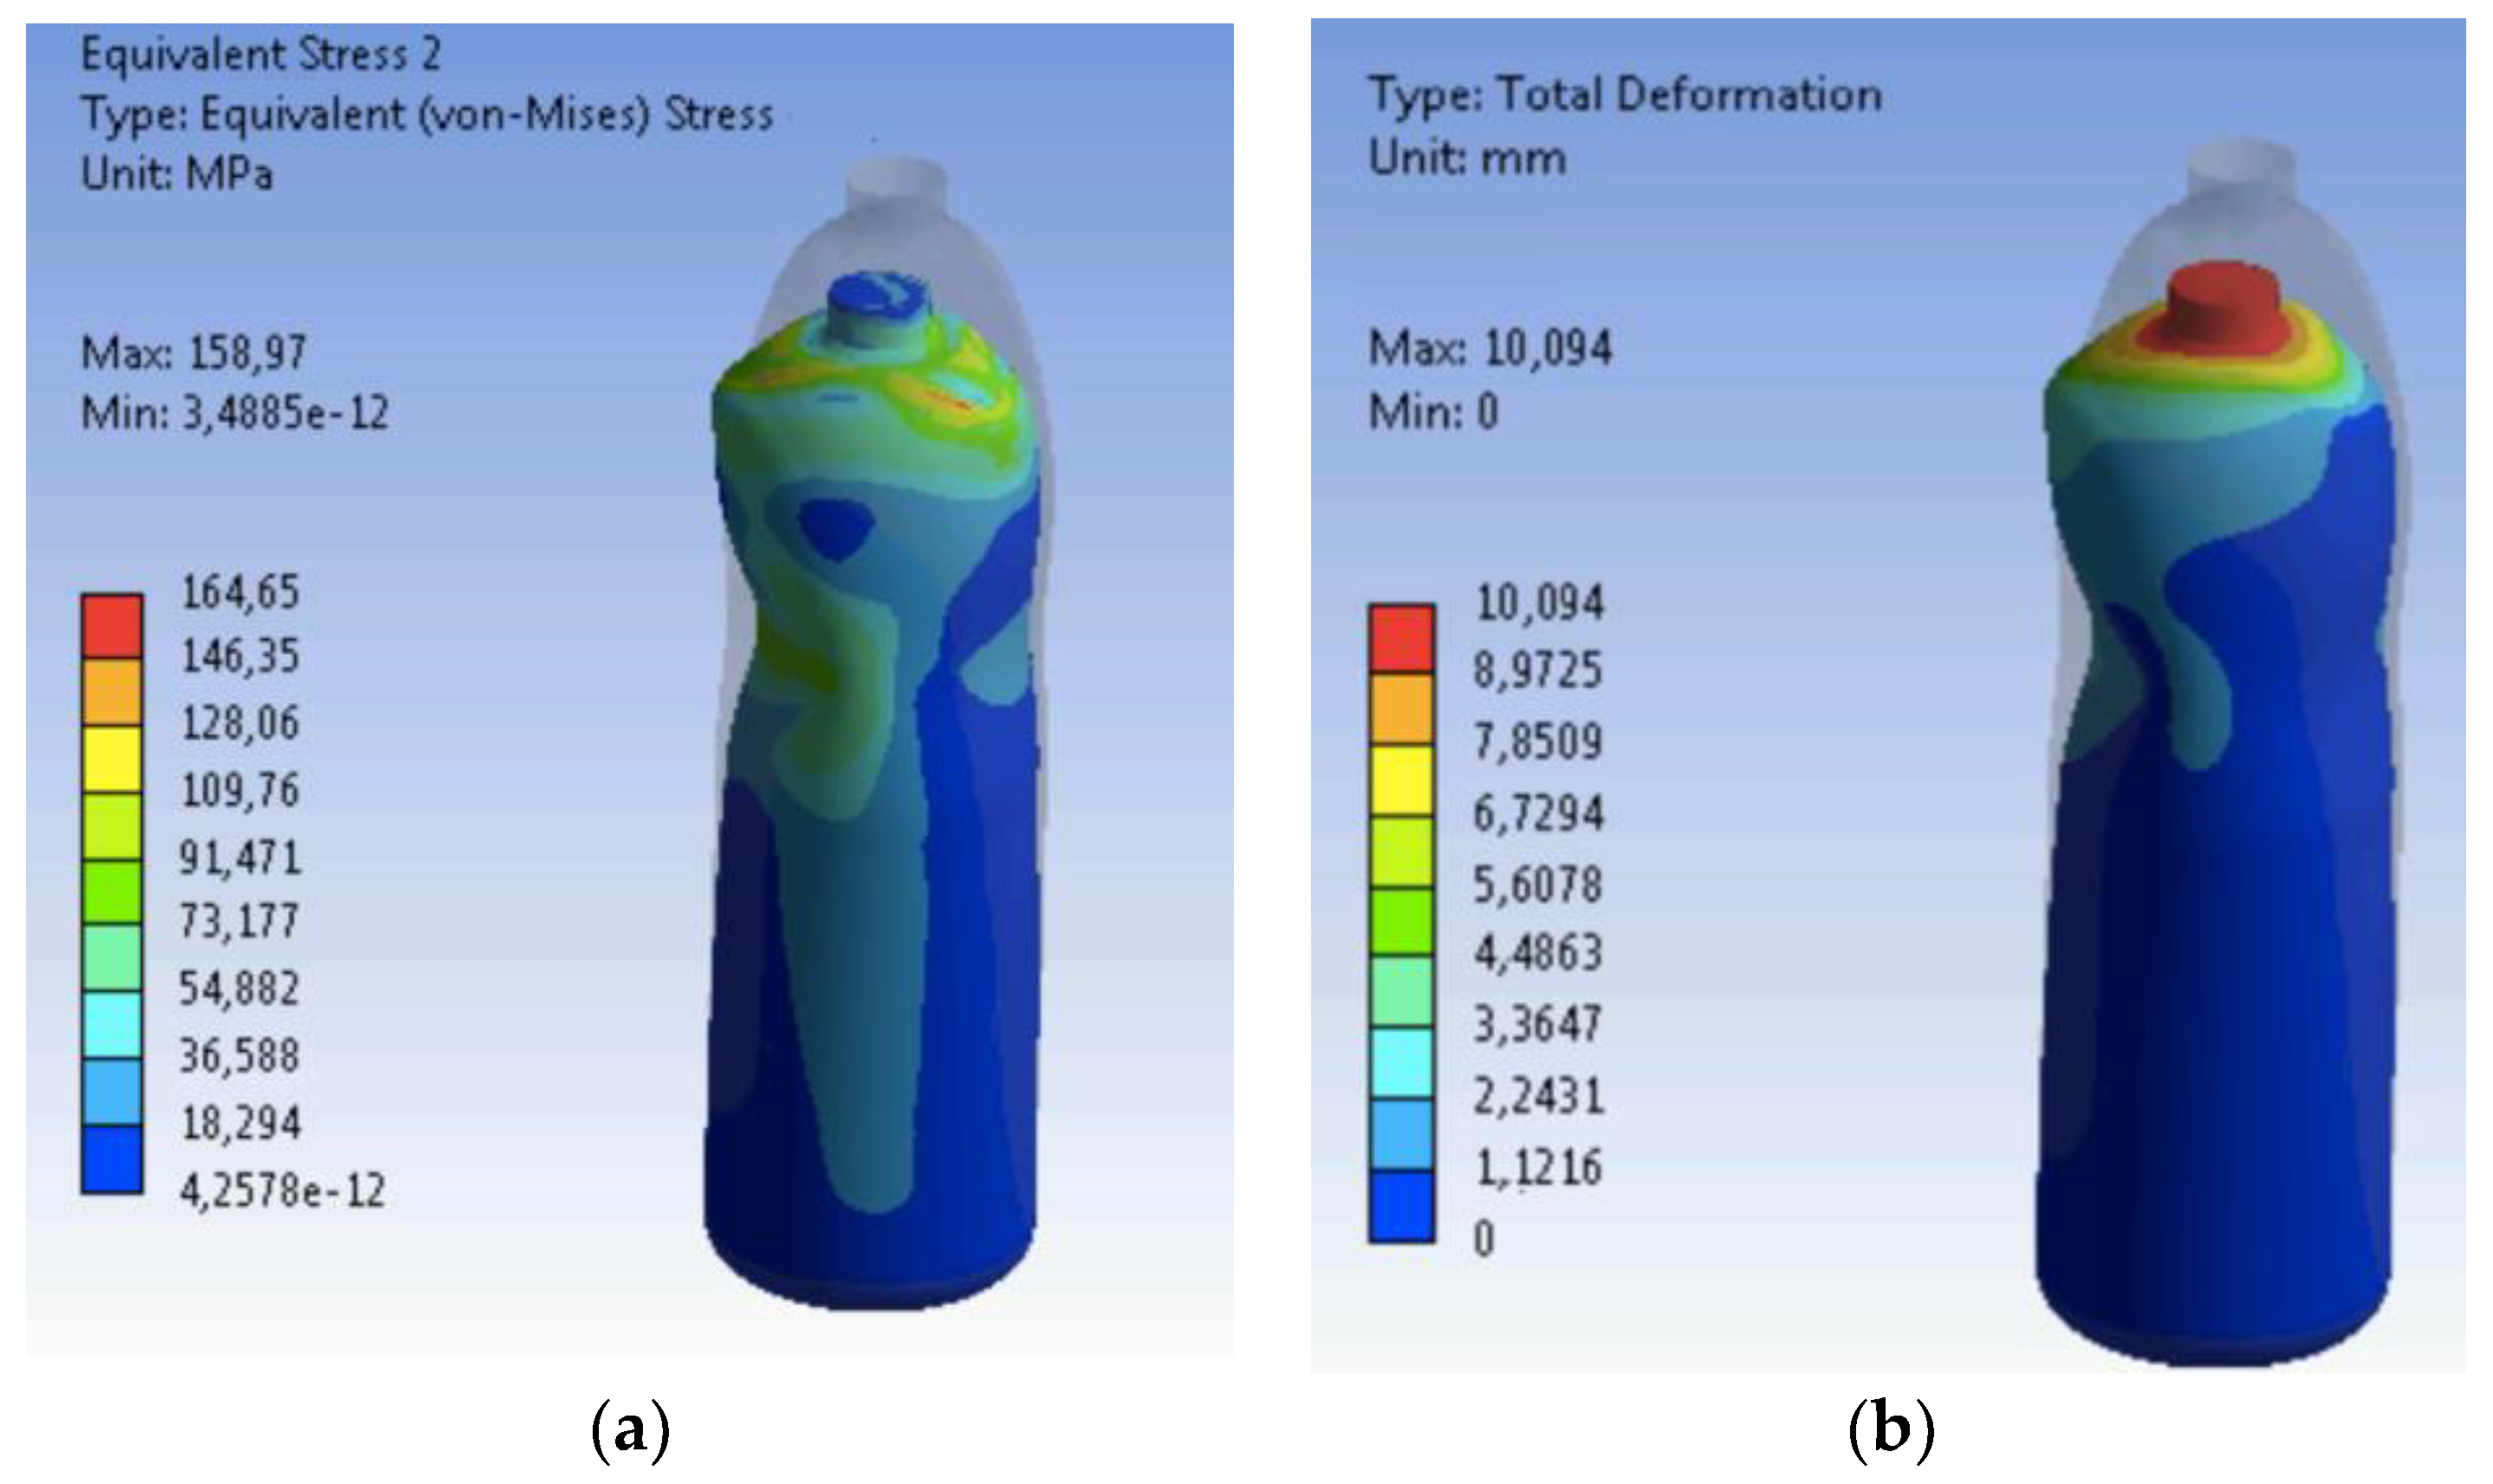
The stress versus strain status following a 10 mm displacement is shown in Figure 10 in terms of (equivalent) von-Mises stress (Figure 10a) and total deformation (Figure 10b). In particular, the maximum stress was 164 MPa. This stress state exceeds the yield point, showing the bottle in plastic conditions.
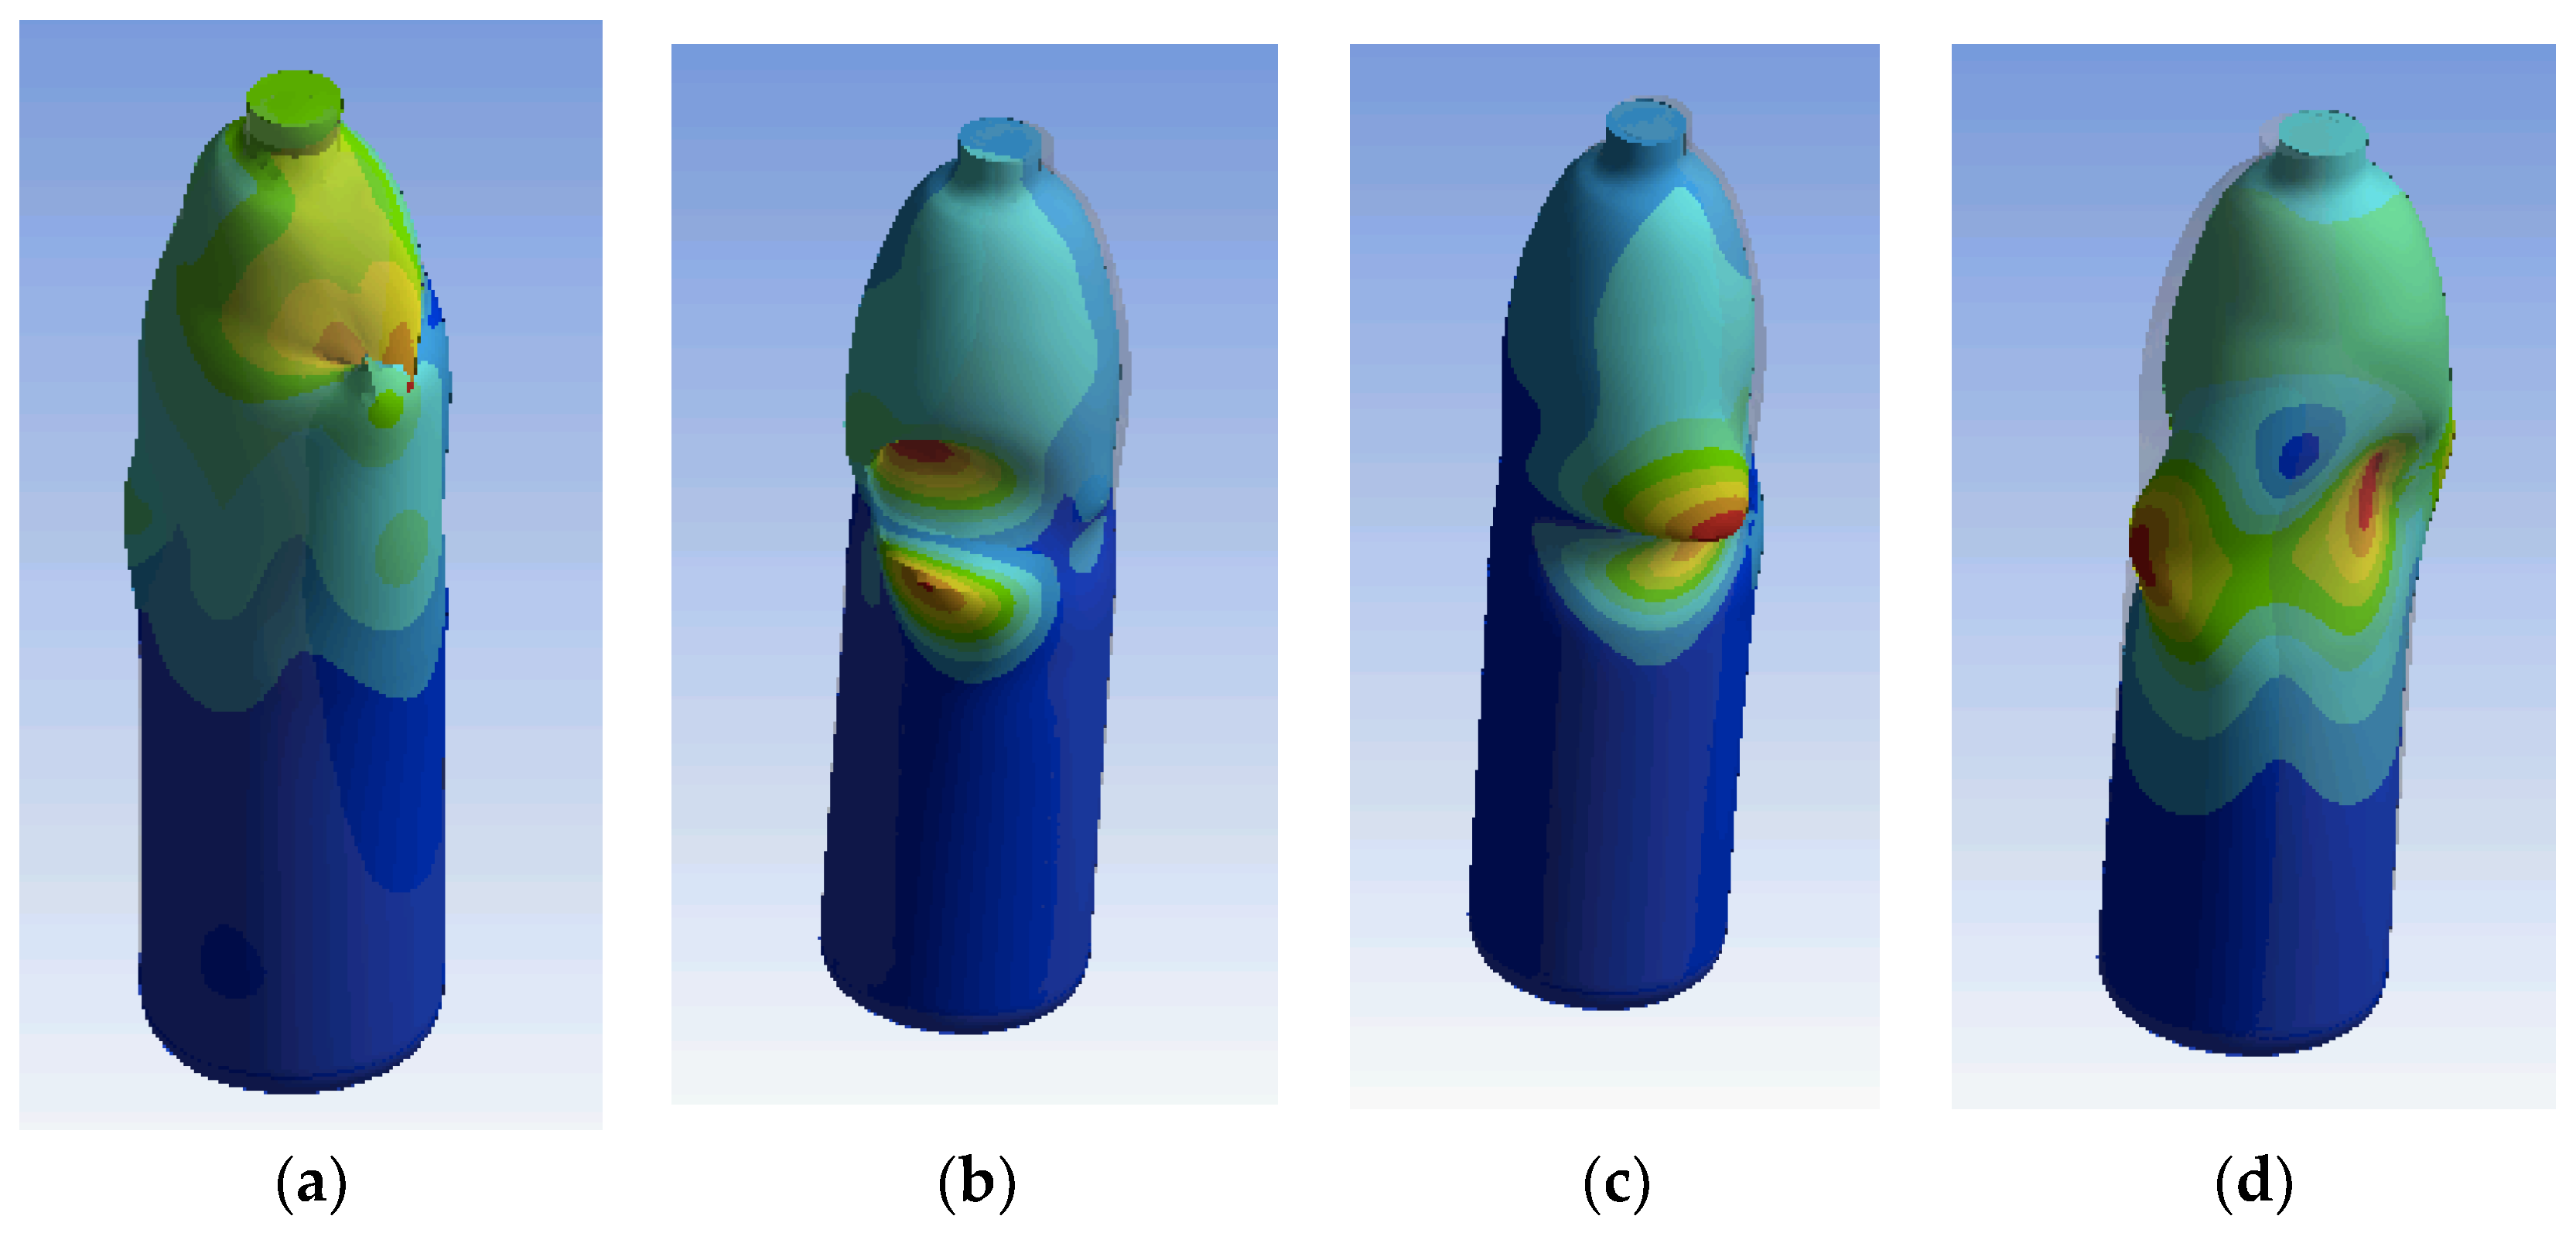
The buckling analysis was performed using the same conditions of simulation. It made it possible to detect the geometrical configuration of instability together with the related buckling load factor (BLF). This factor acted as a load multiplier with the scope to evaluate the buckling load for each condition of instability. When the BLF is greater than one, the structure is safe apart from when the external load is increased. It also means that when the buckling factor is less than one, the structure could collapse under a given load.
This consideration is exactly in line with what is highlighted by the results shown in Figure 11. With BLF < 1 in respect to several configurations, the thin bottle is not able to resist to a 10 mm displacement without buckling. At the same time, as reported by the simulation, the deformations seem very limited, suggesting the buckling is locally restricted.

4.2. Solid (3D) Model

Three-dimensional solid elements were used to evaluate an extreme hypothesis of simplification consisting of a bottle discretized by a homogeneous object, made of a single material. The presence of liquid, air, and the plastic polymers of small thickness were not taken into account separately, but the bottle was analyzed globally, as a single solid body. This body was considered as made by an equivalent material, whose characteristics were set in order to guarantee a mechanical response in line with the experimental tests. From this perspective, the geometry should be also simplified. Starting from the 2D profile, a 3D revolution solid was generated and discretized by solid elements (Figure 12a).
A critical requirement for efficient and accurate explicit analysis is a high-quality mesh, to be also balanced with the availability of computational resources. Explicit analysis benefitted from the integration of the design phase in the ANSYS Workbench environment, which includes powerful automatic mesh generation. In general, there are two options, one is to create high-quality hex (brick) elements using multi-zone meshing, while the second one automatically uses the swept method to create hex elements. Some geometries, especially those created for manufacturing and imported from CAD data, are too complex to be swept to produce a full hex mesh. Tetrahedral elements can accurately represent small portions of a part’s geometry that cannot be swept. On the contrary, tetrahedral elements can be not accurate enough in investigating large deformations and, in addition, mesh size can affect stress results. At least, different mesh density must be tuned to confirm the repeatability of this model. For this reason, it would be advisable to optimize the validity of the mesh, both in terms of element types and dimensions. At the same time, the ultimate goal of the research was to try to represent the behavior of a bottle inside a pallet in the most elementary way possible. For this reason, it was decided to limit the discretization to an automatic meshing by ANSYS tools.
In particular, quadrilateral dominant elements were used and the final mesh for explicit analysis consisted of 14,331 nodes and 13,275 elements (Figure 12a).
With respect to the first case, similarities and differences existed in the way loads and constraints were applied. The rigid plate on the top (Figure 12b) was set with a 2 mm/s speed (instead of a displacement) while bottle nodes on the bottom were fixed avoiding translations and rotations.
In an extreme simplification of this kind, which considers the entire system as homogeneous and discretized by finite elements of the same type, would be possible when a model of ‘equivalent material’ can offer the same responses as the real system (Figure 13).
Ansys Workbench 18.1 also makes it possible to insert the material behavior by additional complex methods, as in the case of the multilinear isotropic hardening or Chaboche kinematic hardening models (Figure 14). These hardening models can be generated by fitting the experimental data and are able to provide rather different responses to the simulation. In Table 2 the accuracy of predictions is evaluated by comparing real and simulated strains in the case of different hardening models.
In particular, it is shown that simulations implementing the Chaboche kinematic hardening model are able to offer a better approximation of the system (with estimated errors in strains around 7%), as is also evident in Figure 14b, where an asymmetrical effect is correctly detected despite other models.
In Figure 15 the effect of deformation of the bottle during the top-load test with 90 mm forced displacement is shown as a simulation that adopted Chaboche kinematic hardening in comparison with the reality.

5. Discussion

Disregarding the uncertainties, it is fair to assume that the experimental values of 550 N for the threshold buckling force and 3.1 MPa of elastic modulus can be used for simplified numerical simulations. Furthermore, it is also evident that both the shell model and the solid elements present interesting results, such as to make them useful for a simplified modeling of the physical system. This general aspect assumes a certain importance in consideration of the many variables involved, which make an exact solution practically unreachable. Regarding this overall complexity, it can be noted, for instance, that 188 different materials are listed in the category of unreinforced polyethylene terephthalate (PET), together with their slightly different properties to be considered.
At the same time, it should also be highlighted that the experimental and simulated values are actually closer to each other for the following reasons:
  • The accurate moment of inertia is smaller because of all the tapered curves of the bottle’s shape, being clearly smaller than that of whole cylinder;
  • The elastic modulus used in the theoretical calculations was obtained from experiments and has a high standard deviation due to the small sampling; being potentially smaller;
  • The experimental buckling force was also provided with small sampling presenting high standard deviation; being potentially higher;
  • Not only the actual moment of inertia is lower, but the tapered region in the center of the bottle acts as a massive stress concentrator, also justifying low values obtained in experiments in comparison to the theoretical model.

6. Conclusions

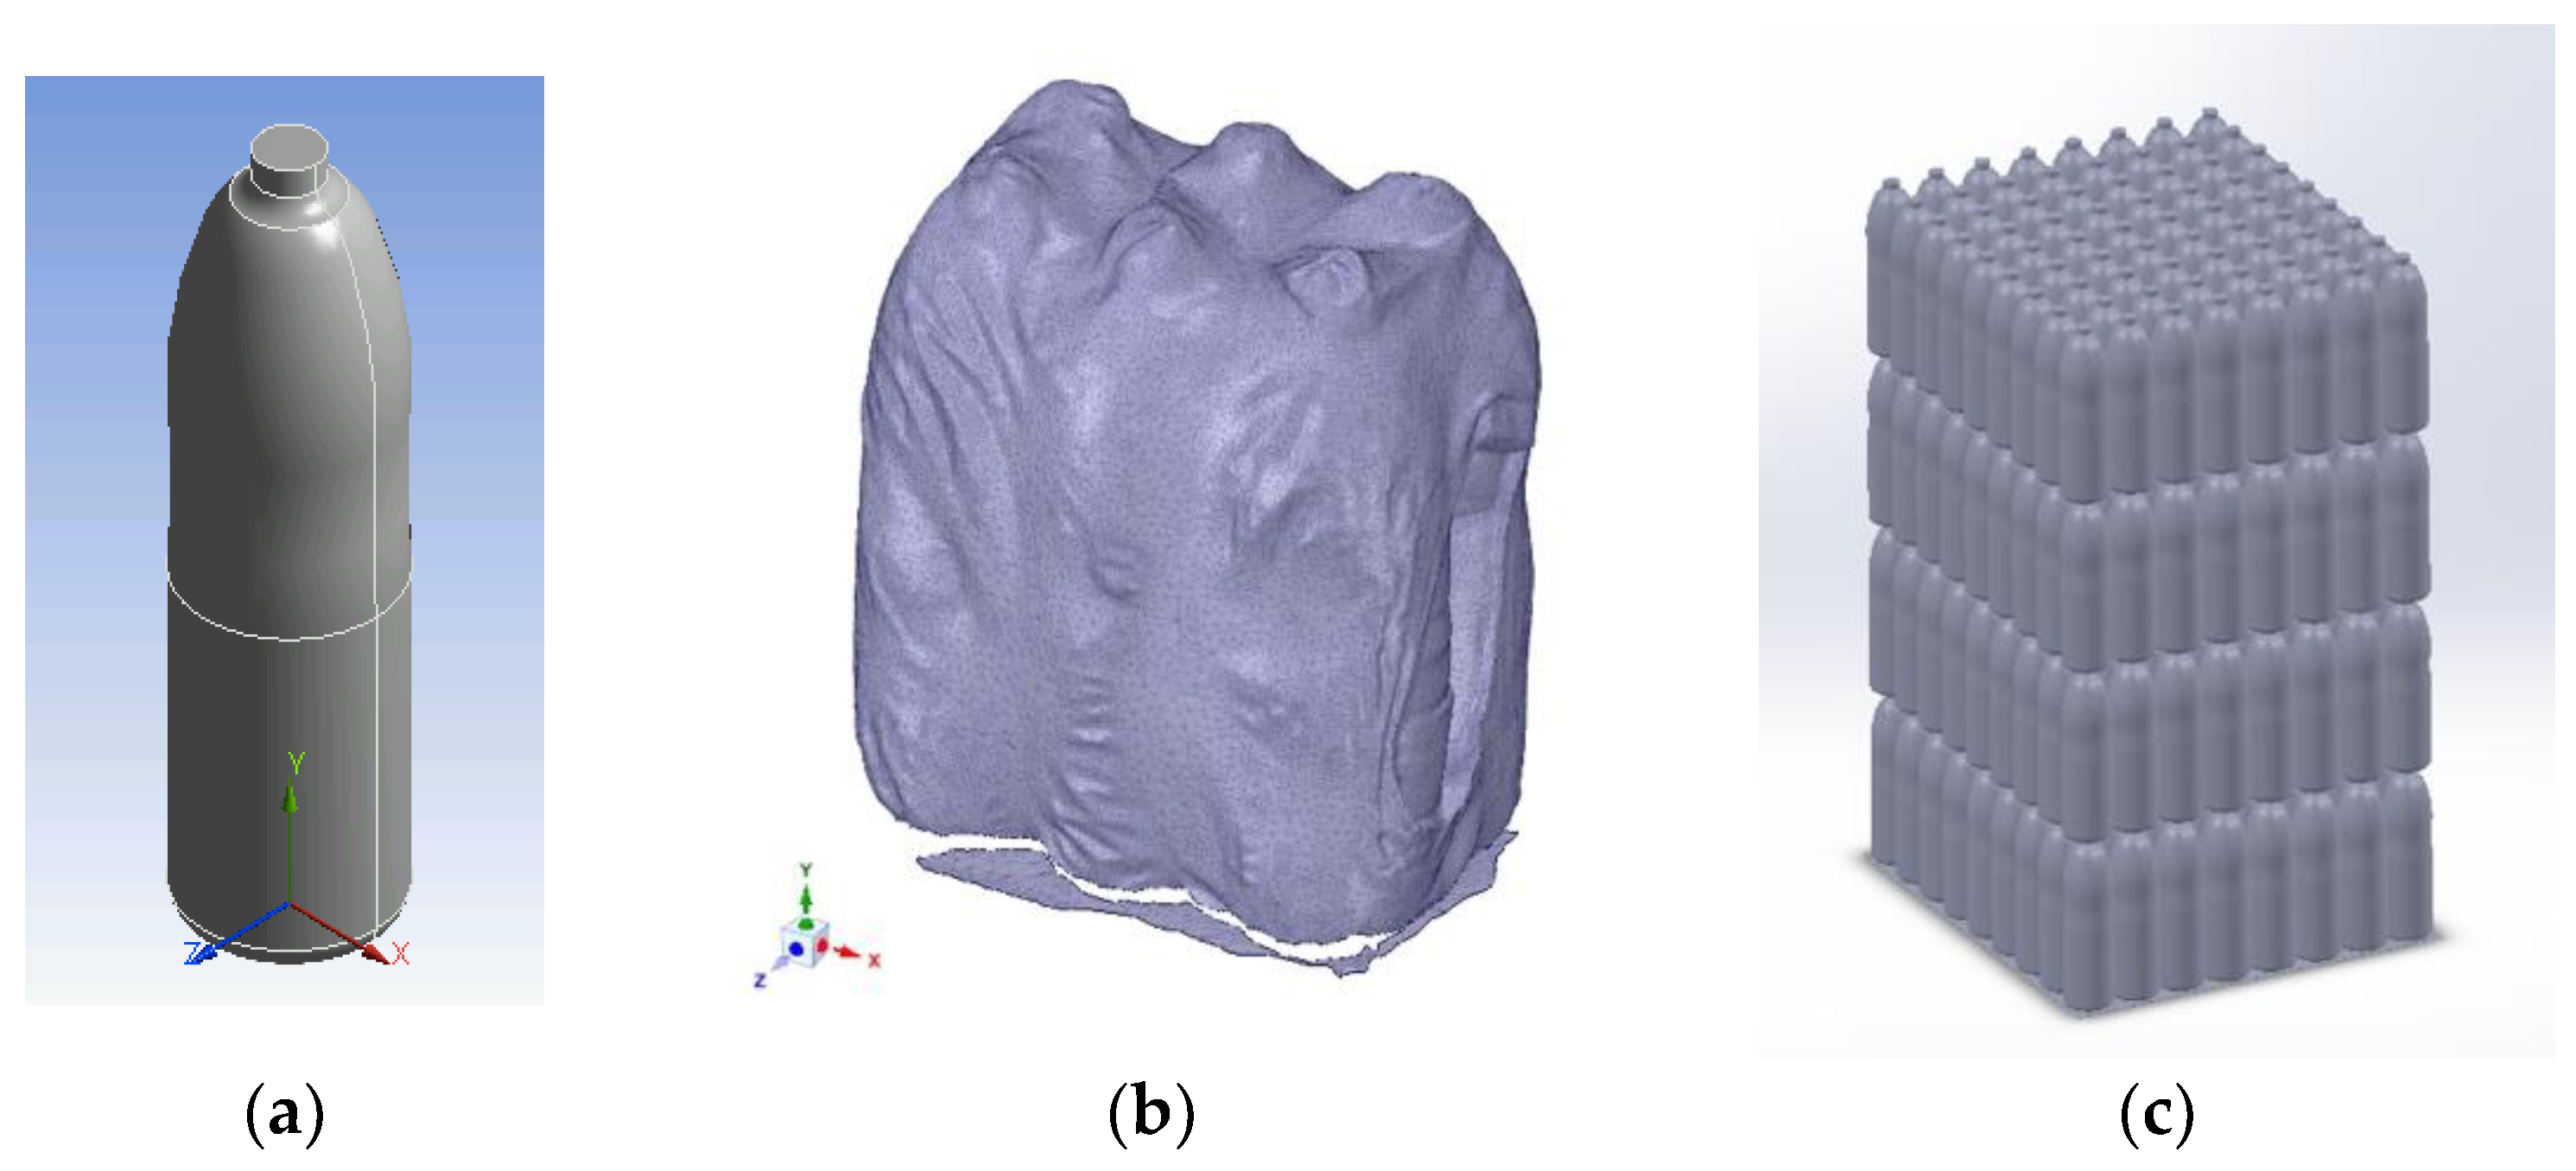
The mechanical response and the stability conditions of a single bottle under compression loads were considered in this paper, as the first fundamental step of a multilevel approach aiming at the complete discretization of a pallet behavior (Figure 16).
In terms of methodology, experimental measures were used to investigate two different models of discretization, each one able to take into account some essential aspects of the overall problem, simplifying the others. Their assumptions were validated through a comparison between the numerical predictions and the experimental evidence. In particular, a top load test was used on five partially filled bottles, which revealed a mechanical behavior articulated in different phases.
As general results, it is possible to say that both models acceptably predicted the initial phases of bottle deformation, characterized by an elastic response of the system. They also provided useful information regarding the effects of instability within an acceptable margin of error, making it possible to use these data for improving the bottle design.
These simplified models were also very efficient in terms of computation time, representing a first concrete step towards the development of a simplified model able to predict the static and dynamic behavior of an entire pallet during the transport phases, which represents the real challenge for the packaging industry.

Author Contributions

Conceptualization, C.F. and A.P.; methodology, A.P. and C.F.; software, L.V. and A.P.; validation, A.P. and C.F.; formal analysis, G.M.; investigation, F.V.d.C., L.V. and C.F.; resources, C.F.; data curation, A.P. and F.V.d.C.; writing—original draft preparation, C.F. and L.V.; writing—review and editing, C.F. and F.V.d.C.; visualization, A.P.; supervision, G.M.; project administration, G.M. All authors have read and agreed to the published version of the manuscript.

Funding

This research was funded by the European Union and Region Emilia Romagna inside the POR-FESR 2014–2020 action.

Acknowledgments

This research was implemented as part of the ‘TechnoLab 4.0’ project, managed by AETNA Group S.p.a. (Italy), thanks to the financial support from the European Union and Region Emilia Romagna inside the POR-FESR 2014–2020 action.

Conflicts of Interest

The authors declare no conflict of interest.

References

  1. Queiroz, J.P.T.P.; Silveira, A.C.F.; Vannucchi de Camargo, F.; Vaccari, M. A brief review on palletized products transportation technology. FME Trans. 2018, 46, 101–107. [Google Scholar]
  2. Vannucchi de Camargo, F.; Queiroz, J.P.T.P.; Silveira, A.C.F.; Pin, T.F.P.; Vaccari, M. Retrospect of the influence of transportation in the delivered quality of palletized product. Int. J. Qual. Res. 2018, 12, 773–788. [Google Scholar]
  3. Škerlič, S.; Muha, R.; Logožar, K. A decision-model for controlling logistic cost. Tech. Gaz. 2016, 23, 145–146. [Google Scholar]
  4. Colvile, R.N.; Hutchinson, E.J.; Mindell, J.S.; Warren, R.F. The transport sector as a source of air pollution. Atmos. Environ. 2001, 35, 1537–1565. [Google Scholar] [CrossRef] [Green Version]
  5. Càvera, L. From the market laboratory, the following packaging progresses. Leader 2015, 5, 24–25. [Google Scholar]
  6. Pierra, A.D.; Stewart, R.D. International Logistics, The Management of International Trade Operations, 4th ed.; Cicero Books Publisher: Berea, OH, USA, 2010. [Google Scholar]
  7. Mussomeli, A.; Gretchen, M.; Troy, B. Joint Industry Unsaleables Report: The Real Causes and Actionable Solutions. Available online: https://www.gmaonline.org/downloads/research-and-reports/UnsaleablesFINAL091108.pdf (accessed on 14 October 2019).
  8. Kandasamy, R.; Khamis, A.B. Effects of heat and mass transfer on nonlinear MHD boundary layer flow over a shrinking sheet in the presence of suction. Appl. Math. Mech. 2008, 29, 1309. [Google Scholar]
  9. Pagliosa, C.; Caires, F.C.; Bataglia, D.; Pelaquim, J. Strength Analysis of Thermoplastic Containers Using Numerical Simulation. In Proceedings of the Science in the Age of Experience 2016, Boston, MA, USA, 23–27 May 2016. [Google Scholar]
  10. Fragassa, C.; Macaluso, I.; Vaccari, M.; Lucisano, G. Measuring the mechanical and climatic conditions encountered by palletized products in handling and transport. FME Trans. 2017, 45, 382–393. [Google Scholar] [CrossRef] [Green Version]
  11. Paternoster, A.; Vanlanduit, S.; Springael, J.; Braet, J. Vibration and shock analysis of specific events during truck and train transport of food products. Food Packag. Shelf Life 2018, 15, 95–104. [Google Scholar] [CrossRef]
  12. Singh, S.P.; Burgess, G. Effect of internal gas pressure on the compression strength of beverage cans and plastic bottles. J. Test. Eval. 1993, 21, 129–131. [Google Scholar]
  13. Survanjumrat, C.; Chaichanasiri, E. Finite element method for creep testing of high density polyethylene lubricant oil bottle. Kasetsart J. 2014, 48, 487–497. [Google Scholar]
  14. Huang, H.H.; Chen, L.W.; Lu, W.H.; Lin, W.C.; Chen, Y.C. Design and simulation analysis of lightweight HDPE milk bottle. Polym. Polym. Compos. 2018, 26, 91–98. [Google Scholar] [CrossRef]
  15. Karac, A.; Ivankovic, A. Investigating the behaviour of fluid-filled polyethylene containers under base drop impact: A combined experimental/numerical approach. Int. J. Impact Eng. 2009, 36, 621–631. [Google Scholar] [CrossRef] [Green Version]
  16. Van Dijk, R.; Van Keulen, F.; Sterk, J.C. Simulation of closed thin-walled structures partially filled with fluid. Int. J. Solids Struct. 2000, 37, 6063–6083. [Google Scholar] [CrossRef]
  17. Vaidya, R. Structural Analysis of Poly Ethylene Terephthalate Bottles Using the Finite Element Method. Ph.D. Thesis, Oklahoma State University, Stillwater, OK, USA, 2012. [Google Scholar]
  18. ASTM, D2659-16. Standard Test Method for Column Crush Properties of Blown Thermoplastic Containers; ASTM Standard on Disc.: Philadelphia, PA, USA, 2005; Volume 8, Available online: https://webstore.ansi.org/standards/astm/astmd265916 (accessed on 14 October 2019).
  19. Rajakutty, A. Static and Dynamic Mechanical Properties of Amorphous Recycled Poly-Ethylene Terephthalate. Ph.D. Thesis, Oklahoma State University, Stillwater, OK, USA, 2012. [Google Scholar]
  20. Van Dijk, R.; Sterk, J.C.; Sgorbani, D.; Van Keulen, F. Lateral deformation of plastic bottles: Experiments, simulations and prevention. Packag. Technol. Sci. Int. J. 1998, 11, 91–117. [Google Scholar] [CrossRef]
  21. Abbès, B.; Zaki, O.; Safa, L. Experimental and numerical study of the aging effects of sorption conditions on the mechanical behavior of polypropylene bottles under columnar crush conditions. Polym. Test. 2010, 29, 902–909. [Google Scholar] [CrossRef]
  22. Baude, C.K. A Preliminary Analysis of PET Barrier Technologies and Mechanical Performance Related to a 3L PET Wine Bottle. Master’s Thesis, Department of Packaging Science College of Applied Science and Technology Rochester Institute of Technology Rochester, New York, NY, USA, 2008. [Google Scholar]
  23. Masood, S.H.; KeshavaMurthy, V. Development of collapsible PET water fountain bottles. J. Mater. Process. Technol. 2005, 162, 83–89. [Google Scholar] [CrossRef]
  24. Schneider, M.H. Investigation of the stability of imperfect cylinders using structural models. Eng. Struct. 1996, 18, 792–800. [Google Scholar] [CrossRef]
  25. Vaziri, A. Mechanics of highly deformed elastic shells. Thin-Walled Struct. 2009, 47, 692–700. [Google Scholar] [CrossRef]
  26. Mukherjee, S. Virtual Simulation of Top Load Performance of Plastic Bottles. In Proceedings of the 68th Annual Technical Conference of the Society of Plastics Engineers 2010 (Antec), Orlanod, FL, USA, 16–20 May 2010. [Google Scholar]
  27. Reed, P.E.; Breedveld, G.; Lim, B.C. Simulation of the Drop Impact for Moulded Thermoplastic Containers. Int. J. Impact Eng. 2000, 24, 133–153. [Google Scholar] [CrossRef]
  28. Suvanjumrat, C.; Puttapitukporn, T.; Thusneyapan, S. Comparison of Simulation for Fluid-Structure Interaction of Water Filled Plastic Bottles during Drop Test. Master’s Thesis, Kasetsart University, Bangkok, Thailand, 2007. [Google Scholar]
  29. Harshath, C.; Chandan, R.; Shashikantha, N.; Venkatesha, R. Buckling Evaluation of a Plastic Bottle Design. Int. Res. J. Eng. Technol. 2018, 5, 549–553. [Google Scholar]
  30. Karalekas, D.; Rapti, D.; Papakaliatakis, G.; Tsartolia, E. Numerical and experimental investigation of the deformational behaviour of plastic containers. Packag. Technol. Sci. Int. J. 2011, 14, 185–191. [Google Scholar] [CrossRef]
  31. Yuan, W.; Xie, L.H.; Zhang, G.M.; Liao, D.Z.; Lu, J.D. Structural Analysis and Design Optimization of PET Beer Bottles. Appl. Mech. Mater. 2013, 312, 21–24. [Google Scholar] [CrossRef]
  32. Allahkarami, M.; Ahmed, R.U.; Bandla, S. Thickness measurement methods aiding light weighting of PET bottles. In Proceedings of the 72nd Annual Technical Conference of the Society of Plastic Engineers (SPE Antec), Las Vegas, NV, USA, 28–30 April 2014. [Google Scholar]
  33. Fugen, D.; Bilal, D. An energy saving approach in the manufacture of carbonated soft drink bottles. Procedia Eng. 2012, 49, 280–286. [Google Scholar]
  34. Callister, W.D.; Rethwisch, D.G. Materials Science and Engineering: An Introduction; John Wiley & Sons: New York, NY, USA, 2007; Volume 7, pp. 665–715. [Google Scholar]
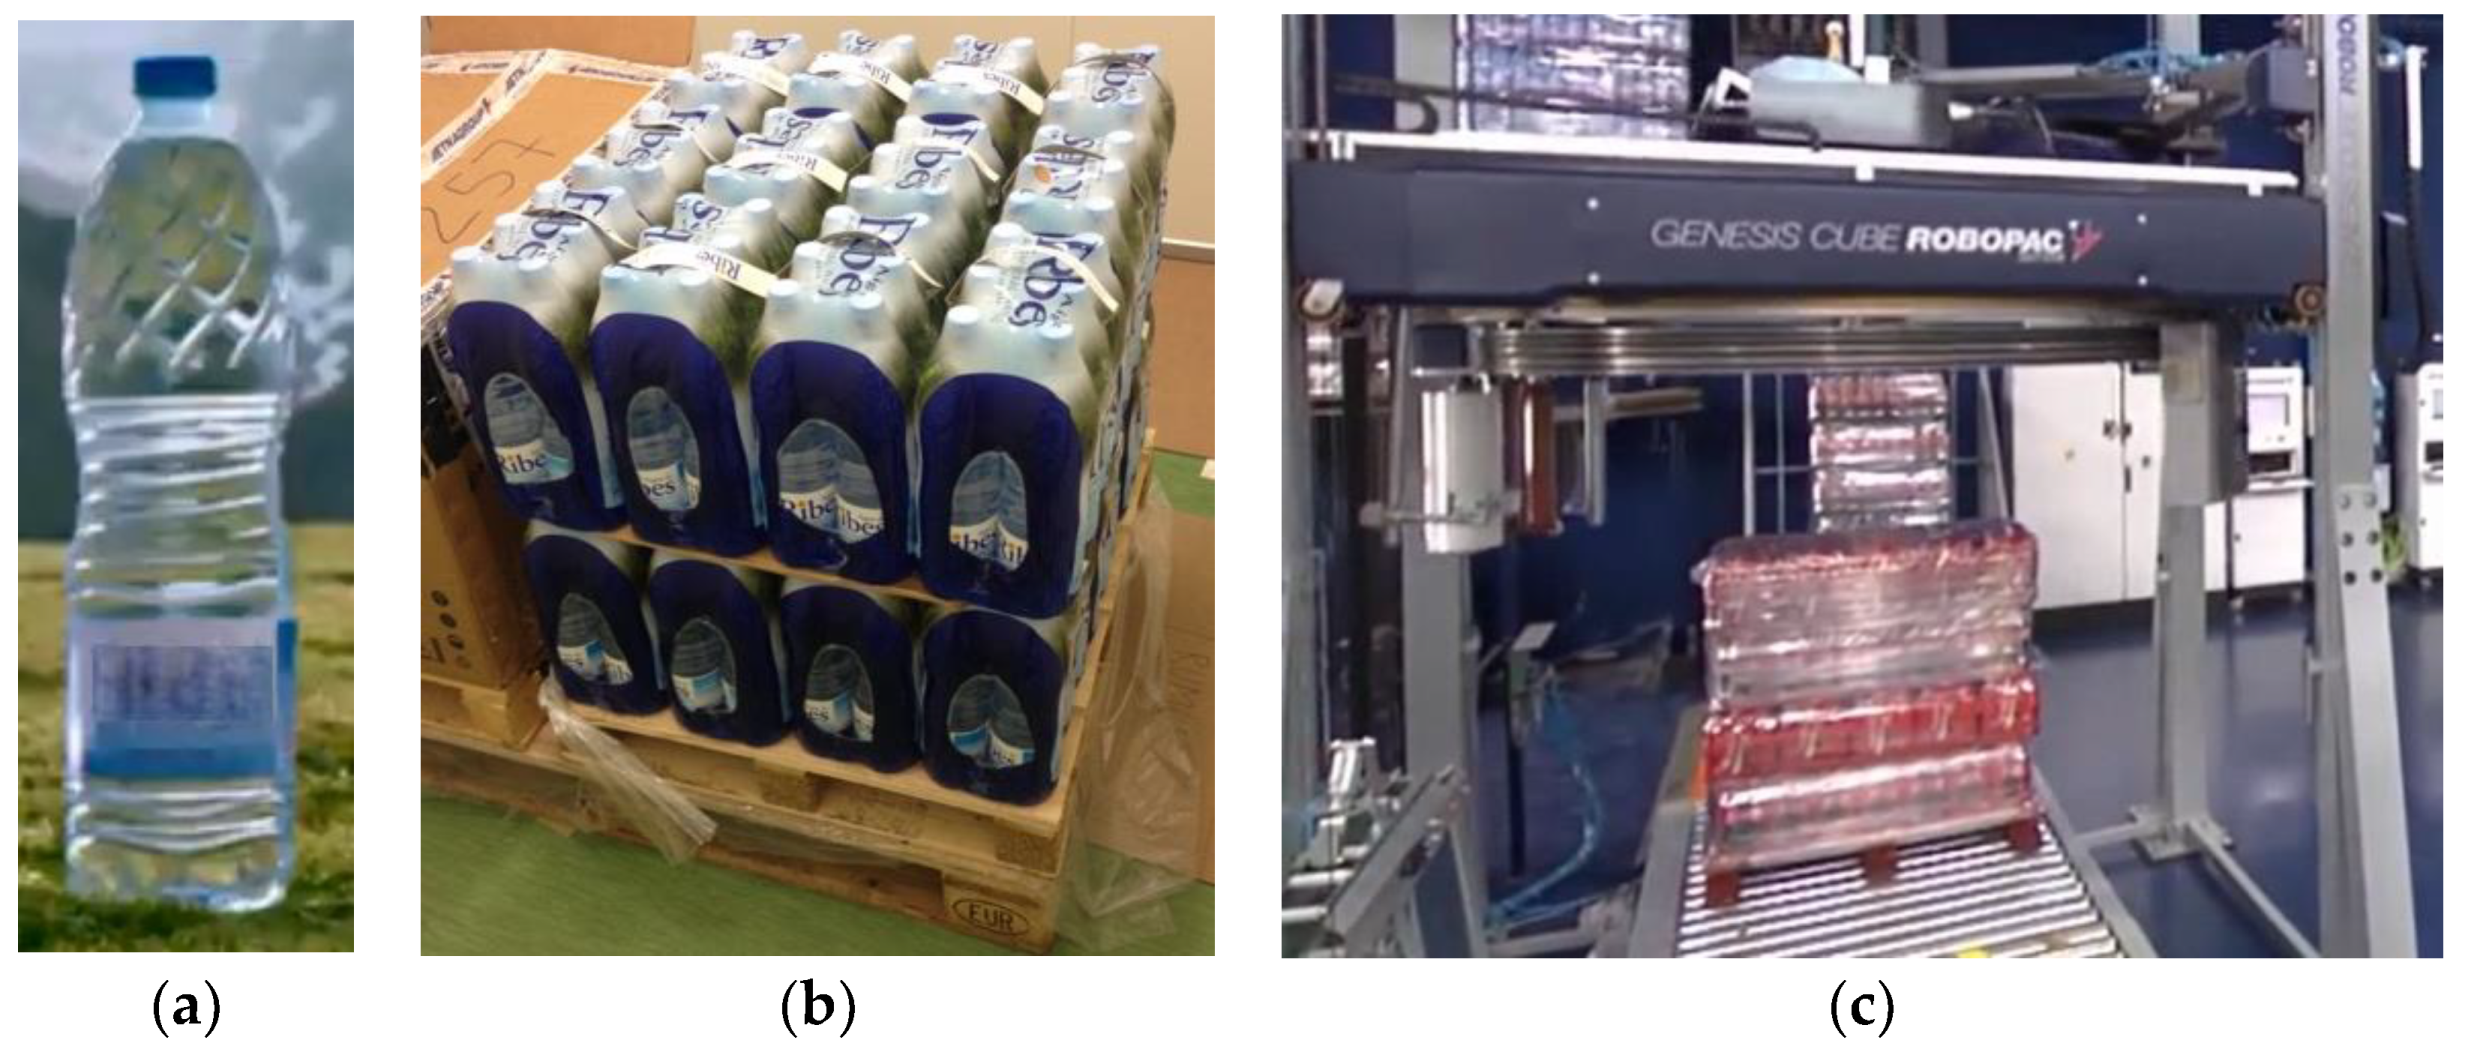
Figure 1. A multilevel system: (a) a single bottle; (b) bottles grouped in bundles; (c) pallet and palletizing plant.
Applsci 10 00332 g001
Figure 2. (a) Preform in PET (polyethylene terephthalate), from which the bottle is obtained through a thermoforming process; (b) example of the final geometric complexity of a bottle.
Applsci 10 00332 g002
Figure 3. Modeling the bottle: (a) main elements; (b) example of characteristic thickness [33].
Applsci 10 00332 g003
Figure 4. Bilinear isotropic hardening material model (in the case of 75 MPa for the yield strength and 1 MPa for the tangent modulus).
Applsci 10 00332 g004
Figure 5. Predominance of buckling on single-bottle compression tests: initial part of the test with a proportional response (a), as soon as the bottleneck is completely dented (b), and near to the 3% strain region when buckling takes place (c).
Applsci 10 00332 g005
Figure 6. Force–displacement diagrams of specimens: (A) whole trend and (B) details showing the proportional response zone (a), the bottleneck completely dented (b) and final buckling (c).
Applsci 10 00332 g006
Figure 7. Residual deformations with tests ending before (a) and after buckling (b).
Applsci 10 00332 g007
Figure 8. (a) Experimental stress–strain curve; (b) calculation of elastic modulus on the linear zone.
Applsci 10 00332 g008
Figure 9. (a) Bottle geometry before and after simplification; (b) detail of geometry and mesh by shell elements; (c) application of forces and boundary conditions (case of non-linear static analysis).
Applsci 10 00332 g009
Figure 10. Quasi-static analysis in top-load conditions for a 10 mm vertical displacement: diagram of stress (a) and strain (b).
Applsci 10 00332 g010
Figure 11. Buckling analysis in top-load conditions for a 10 mm vertical displacement, limited to the initial four modes of instability and for a load multiplier (k) of: (a) k = 0.19; (b) k = 0.16; (c) k = 0.12; (d) k = 0.09.
Applsci 10 00332 g011
Figure 12. Finite Element modeling by solid elements: (a) 3D bottle model; (b) tetrahedral mesh; (c) boundary conditions.
Applsci 10 00332 g012
Figure 13. Experimental stress–strain curve discretization by linear trends, namely bilinear isotropic hardening.
Applsci 10 00332 g013
Figure 14. Discretization by advanced hardening models: (a) multilinear isotropic; (b) Chaboche kinematic.
Applsci 10 00332 g014
Figure 15. Effect of a top-load test with 90 mm forced displacement: simulation (a) of deformations in the case of the use of a Chaboche kinematic hardening model compared with the reality (b).
Applsci 10 00332 g015
Figure 16. Discretization by a multilevel approach: (a) single bottle; (b) bottles in bundles; (c) pallet.
Applsci 10 00332 g016
Table 1. Material characteristics of PET and polyethylene.
Polyethylene Terephthalate (PET)—Orthotropic Characteristics
DensityYoung Modulus
X dir.
Young Modulus
Y dir.
Young Modulus
Z dir.
Poisson’s
Ratio
X, Y, Z
Shear
Modulus
XY
Shear
Modulus
YZ
Shear
Modulus
XZ
Tensile Yield StrengthTensile
Ultimate
Strength
(kg/m3)(MPa)(MPa)(MPa)(/)(MPa)(MPa)(MPa)(MPa)(MPa)
13351250134512500.44484804486490
Polyethylene (PE)—Isotropic Elastic Characteristics
DensityYoung ModulusPoisson’s
Ratio
Tensile Yield StrengthTensile Ultimate Strength
(kg/m3)(MPa)(/)(MPa)(MPa)
95011000.42250330
Table 2. Comparing measured and simulated residual strains (ε) for different hardening models.
Residual StrainHardening Model
Measure (εe)Bilinear IsotropicMultilinear IsotropicChaboche Kinematic
mm46.554.961.943.2
Δ +18%+33%−7%