Featured Application
Supply chain management, online business management, smart manufacturing.
Abstract
Integrating a partnership with potentially stronger suppliers is widely acknowledged as a contributor to the organizational competitiveness of a supply chain. This paper proposes an event-based model which lists the events related with all phases of cooperation with partners and puts events into a dynamic supply chain network in order to understand factors that affect supply chain partnership integration. We develop a multi-objective supply chain partnership integration problem by maximizing trustworthiness, supplier service, qualified products rate and minimizing cost, and then, apply a hybrid algorithm (PSACO) with particle swarm optimization (PSO) and ant colony optimization (ACO) that aims to efficiently solve the problem. It combines the advantages of PSO with reliable global searching capability and ACO with great evolutionary ability and positive feedback. By using the actual data from 1688.com, experimental studies are carried out. The parameter optimizing of the hybrid algorithm is firstly deployed and then we compare the problem solution results of PSACO with the original PSO, ACO. By studying the partnership integration results and implementing analysis of variance (ANOVA) analysis, it shows that the event based model with PSACO approach has validity and superiority over PSO and ACO, and can be served as a tool of decision making for supply chain coordination management in business.
1. Introduction
In a dynamically changing business environment, the model of the market competition has moved from individual enterprises to a supply chain [1]. Generally, a supply chain is defined as a network of partners which develop products by converting raw materials into finished goods through coordinated planning and continuous activities [2]. In the market, the key competitive capability is largely decided by a specific supply chain across multiple enterprises rather than single enterprises [3]. That is, enterprises should plan to replace separate business strategies with a cooperation strategy among partners [4]. Through successful supply chain partnership integration, enterprises can develop long-term relationships with appropriate prospective suppliers for mutual benefit [5]. The benefits of such partnership integration can be attained through efficient linkage among various events and activities in the supply chain process [6]. By exercising judgement on events, such as costs, quantities, timing of deliveries, service quality and so on, the suppliers and buyers can decide to create a collaborative relationship or not [5]. For buyers in e-commerce, they usually have limited information about the suppliers and need to take more risks, because they can neither physically examine products nor verify the reliability of the sellers in an open, virtual environment [7]. Meanwhile, the asymmetric information between supply side and demand side will affect their long-term business relationship, generating more negative consequences for the well-functioning relationship [8]. Many kinds of difficulties can be overcome successfully if enterprises can focus on important events to understand the dynamic characteristics of supply chain.
As supply chain processes become highly information intensive, supply chain participants and processes generate more events increasingly [4]. Events can affect the information or the performance of running supply chain processes by influencing relevant sub-processes e.g., products returned, order management and time of delivery etc. A relationship between suppliers involves various activities and events that determine process of partnership formation and change. Therefore, events are important for enterprises to gain a better understanding of the changes and information exposed in a supply chain, so that enterprises select appropriate suppliers responding to shifting circumstances. Drawing on Halinen [9] and Konovakenko [10], we define supply chain processes as a series of interrelated events that unfold over time and understand factors that influence partnership integration.
In existing research, mathematical non-linear programming and a general heuristics algorithm were used to solve supply chain integration problems. Objective functions were designed to identify the optimal supply chain solution that minimized the combined cost of operating the supply chain network along with the cost of processing information [11,12,13]. Other approaches mainly included proposing multi-objective function model according to different scenario defined by rules for factors such as the total expenses for the manufacturers, quality of product, total profit for the distribution center, and supplier service etc. [5,14,15,16]. However, these models ignored the dynamic nature of the supply chain and considered the acting factors discretely. In reality, process analysis of elaborating events from a moderate constructivist perspective is necessary, as this enables the information flow among different parties in supply chain to be traced and understood and the structure of the supply chain in a multilayered network context to be captured.
In this paper, we introduce an event-based analysis strategy to study the process of a supply chain in order to identify the key events by employing a steering wheel that combines both retrospective and real time analysis. We develop the event based model to present a method to obtain more reliable solutions for partnership integration in a dynamic and changing supply chain environment. It considers unforeseen events of orders to reduce uncertainties to provide accurate and up-to-date information for enterprises to improve efficiencies. By implementing event information synergy about orders, trustworthiness, products received, delivery, and cost in supply chain, the concordancy of supply chain can be realized from the precise knowledge about how to adjust the sourcing, manufacturing, and distribution plans across the parties in the supply chain.
A supply chain partnership integration problem has multiple criteria and needs sophisticated decision support, and we propose a hybrid algorithm by integrating particle swarm optimization (PSO) and ant colony optimization (ACO) to solve the multi-objective problem. PSO is good at global optimization, whereas it has the disadvantages of easily trapping in a local optimum [17]. ACO finds better solutions of effective feedback and distributed computation, although it has shortcomings of long-searching time and an initial lack of pheromone [18]. By fusing these two algorithm, we can improve the convergence rate and avoid trapping into local optimum [19]. In the hybrid algorithm, PSO is employed for global search and ACO is used for local optimization. That is, we can use the distribution of pheromone from initial PSO searching and feed into ACO to improve efficiency and reach an optimal solution.
The major contributions of the study are summarized below.
- This is a work regarding the design of an event-based framework in a supply chain partnership integration problem, which is based on a clear understanding of key events in a dynamic supply chain process and focuses on how events can be used to reveal factors that influence partnership in supply chain operations.
- The hybrid algorithm, PSACO, which utilizes the functions of PSO and ACO, is proposed. In the algorithm, a linear decreasing inertia weight schema is introduced to achieve relatively high performance for PSO, and a new pheromone strategy is used for ACO.
- In order to improve the precision of experiment solutions, experimental analyses are carried out to select the optimal parameters of ACO.
- Experimental results demonstrate that PSACO can obtain better performance than traditional PSO and ACO.
The rest of the paper is organized as follows: the related literatures about supply chain partnership integration and events are reviewed in Section 2. Section 3 presents the event-based supply chain partnership integration and the mathematical optimization model. Section 4 introduces the background of particle swarm optimization and ant colony optimization, and the key idea of a hybrid algorithm is described. Section 5 presents the process of the hybrid algorithm in solving the multi-objective supply chain partnership integration problem. Section 6 explores the optimization of the algorithm coefficiency, and compares the performance of PSACO with PSO and ACO. Finally, Section 7 presents the conclusions and further research directions.
2. Related Work
2.1. Supply Chain Partnership Integration
In recent years, more attention has been given to partnership building in supply chain strategy in order to achieve better performance in business [20]. Partnerships with participants in a supply chain can enhance strategic benefits and it is critical to the management and development of single enterprise and the success of whole supply chain [21]. Cheng [22] reported that a supplier may provide a collaborative mechanism to build procurement partnerships so as to help the cooperative enterprises and themselves to gain more profit together. Multiparty collaboration is essential to effectively solve complex problems and help enterprises to adapt constantly to the changing environment.
However, compared with the short-term business partnership aiming at supply chain efficiency, supply chain partnership integration requires organizational compatibility and the vision of senior management whose aim is long-standing partnerships that focus on strategic goals of providing value to customers and bringing profits to partners [23]. Actively integrating partnership of suppliers and partners effectively increases available resources and information, and will jointly accomplish goals to meet customer needs [24]. Supply chain partnership integration can develop a strategic collaboration between suppliers [25] and create a win-win situation by helping enterprises look for the best ways to raise the ability of making a profit of every link partner in the supply chain [26].
As the nature of supply chains becomes increasingly complex, making the right decisions of partner integration involves the consideration of many different factors [27]. By considering the cost, customer services and capacity utilization balance of the supply chain, Fulya [14] built a multi-objective supply chain network optimization model using genetic algorithm. Faroop and Qazi [5] developed a framework for supplier integration and took into account factors like quality, cost, lead time, delivery and technical capability. Luan and Yao [28] established a multiple objective optimization model and developed a hybrid algorithm of a genetic algorithm and ant swarm optimization for a supplier selection problem, considering minimizing cost and maximizing quality, delivery capability, innovation and development capability. Hou [29] presented a trust-based supplier selection rule with a multi-agent framework to build a dynamic supply chain network to show that trust could significantly improve the resilience of the whole supply chain network. By referring the previous studies and current corporate strategy, we consider the cost of the supply chain, qualified products rate, trustworthiness and supplier service to be key factors that affecting partnership integration in this paper.
2.2. The Analytical Value and Identification of Event
An event emerges when a single or related action occurs over a given period of time and it is a powerful methodological tool for process analysis [9,30]. In network research, an event is very useful in network development, it can be used to confirm the time period of the study, define the starting point for the change process being studied, and make the changes visible [31]. The ability of events to link processes to specific points in time and context makes them particularly available for analyzing processes. Only in relation to the space and time environment can the process become comprehensive [18]. Events are defined through the perception and interpretation of business actors and they are, therefore, necessarily relational, and exist in a particular process. Various studies have suggested that events may happen in different process or organization, from a network, or from some stages. Furthermore, events can be organized over time and be used to effectively analyze the changes of activities. Relationships that involve sets of interconnected events among enterprises in a B2B market differ from individual interactions that relate to process exchange, routine formation or cooperation [32]. These events connect participants in a partnership and lead to an interdependence of resources and activities. Therefore, the success or failure of supply chain partnership integration is closely connected to the outcome of these events, and these events are unique to each business [33].
Effective events not only improve enterprises’ experience, productivity and performance of a supply chain, but also allow enterprises in a supply chain network to find suitable suppliers to achieve competitive advantages and growth. Accurately using events in a supply chain network can be beneficial in the field of making cooperation plan and supply chain integration. The challenge is that different events occur at different times and stages of a supply chain network, while enterprises with diverse demands and time or money constraints cannot correctly recognize the right events to analyze. In this paper, we emphasize the importance of events when suppliers are inaccessible as buyers may have insufficient historical information about potential suppliers’ trustworthiness, abilities, or quality. Events can be applied in B2B markets to create reliable and clear information for customers and partners. Events in supply chain processes are to be used as a means to get efficient information of B2B suppliers in integrating supply chain partnership. For instance, in a purchasing period, when suppliers fulfill buyers’ orders, customers will understand the ability of suppliers to meet their demand within the stipulated access time [14]. No matter how they are applied, events always provide information for partners who lack business information, allowing customers to improve the quality of decision making.
In order to overcome the challenge of identifying events, Halinen [9] developed an event recognition and tracking method based on the combination of retrospective and real-time analysis. It uses a wheel, called a “steer wheel”, to move repeatedly in a given time period when they analyze the supply chain network process. The steer wheel moves forward to accomplish real-time analysis and build the process, from left to right in Figure 1. When it moves backwards, from right to left, the steer wheel employs retrospective analysis to rebuild the process. The key idea of the steering wheel is combining different time directions into information collection and analysis. First, we collect the information in real time. This helps us form a preliminarily understanding of the events in supply chain processes. Second, we run the wheel retrospectively and repeatedly to interpret the events. Finally, through continuously reconstructing the process and reconsidering the previous events, we can obtain key events and an analytical and descriptive structure of the process.
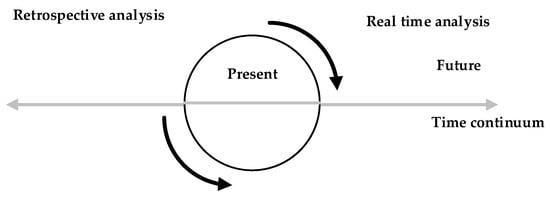
Figure 1.
The method of identifying events.
3. Model
We build an event-based model in the complex adaptive supply chain network. The model presents critical events emerged from the interaction of enterprises, and we choose trustworthiness, product quality, customer service, and cost as the performance factors to promote supply chain partnership integration. In the model we consider a constrained multiple objective optimization problem of a pull-based supply chain. Under a pull-based supply chain, the process of producing and supplying is driven by actual customer requirements. It triggers events in the supply chain. Transactions to produce and deliver only what customers have ordered move up the supply chain from retailers to distributors to manufactures and eventually to suppliers. Only products to fulfill these orders move back down the supply chain to the retailer. The model integrates event data about orders, manufacturing and delivery to provide valuable information for helping a B2B platform make better decisions and react quickly to customer demands.
3.1. Supply Chain Network Structures
We introduce a supply chain network consisting of numerous stages and multiple enterprises which is shown in Figure 2. A direct graph is used to denote the supply chain network. is the enterprise set, and is the total stages of the network. As an example, is a set of enterprises in stage . is a set of all of the relationships among enterprises in the supply chain network, where is the number of edges. This refers to the edge between two points in Figure 2. We define that each enterprise would only belong to one set of enterprise, meaning . is a direct connection from enterprise to enterprise , which means that the customer places orders from the upper supplier . As Figure 2 shows, the order flow starts from enterprises in the first stage to enterprises in the final stage, and the production flow has a reverse direction.
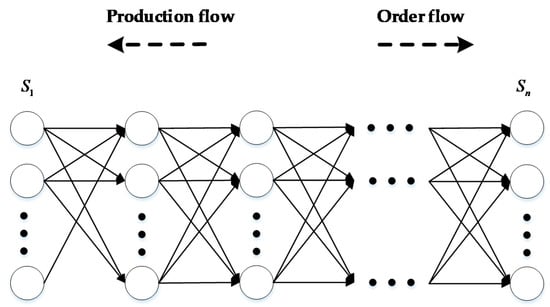
Figure 2.
Supply chain network framework.
3.2. Event-Based Supply Chain Partnership Integration Model
While using the steering wheel to identify key events in supply chain process, we split the purchase time continuum into three stages: pre-purchase, purchasing and post-purchase, as shown in Figure 3. In the real-time analysis, events are identified by following an order fulfillment process, including taking customer orders before purchase, raw material or semi-finished products receiving, the production and delivery of products during purchasing, and calculating cost after purchase. In the retrospective analysis, events are the accumulated results of repeated past interactions among parties in the process. Important data around the events can be collected from daily transaction records or public and self-disclosure information of supply chain partners. To deal with the cold start problem of historic data insufficiency, information can be captured and followed up with the default values given by the registration on the B2B e-commerce platform. The registration system usually offers basic credit levels and transaction volumes according to the backgrounds of the enterprises.

Figure 3.
Identifying events in supply chain process using the steer wheel method.
When we put these events into dynamic supply chain network to consider and analyze, and the process containing events above in the supply chain network can be presented as in Figure 4, which is discussed in the following steps:
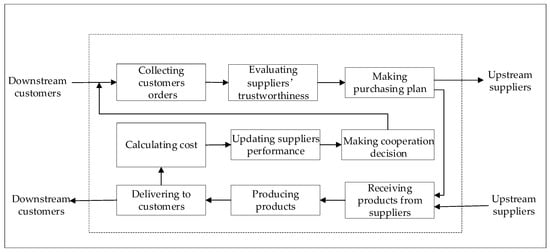
Figure 4.
The events processing of an enterprise in the supply chain network.
- (1)
- The enterprise collects orders from its customers;
- (2)
- The enterprise evaluates the degree of trustworthiness the upstream suppliers have;
- (3)
- The enterprise submits the orders to the upper suppliers;
- (4)
- The enterprise receives materials or semi-finished products from suppliers;
- (5)
- The enterprise starts producing according productivity and the material received, then sends the finished products to customers.
- (6)
- The enterprise calculates its operating cost;
- (7)
- The enterprise updates the performance of its suppliers and decides its cooperation plan.
3.2.1. Orders
At time , enterprise collects orders from its downstream partner enterprises. The set of customers of the enterprise from stage is and the order placed by a downstream enterprise to enterprise is . The orders from downstream customers to enterprise is , defined as:
After handling the orders from the downstream enterprises, enterprise will place orders to upstream suppliers. Order quantity can be influenced by numerous factors. Time factor should be what the enterprise must first take into account, since in practice, seasons and holidays can lead to the increasing of order quantity. In order to avoid the occurrence of risk events, enterprises often need to consider the resilience factor in the process of planning of their order quantity. Accordingly, enterprise ’s actual order quantity can be given as:
where is the enterprise ’s production capacity, and are the random coefficients which describe the effect of the time factor and resilience factor respectively.
After receiving the orders from the downstream customers, enterprise will evenly place order to suppliers according its demand. Denote as the set of enterprise ’s suppliers, and as the number of suppliers. The enterprise places the order with its upstream supplier according to the following rule:
The quantity of orders from enterprise equals the order quantity took by supplier :
3.2.2. Trustworthiness
The relationship between supply chain partners is built on mutual trust [29,34,35]. As a characteristic of the enterprise, the degree of trustworthiness can be adaptively estimated according to the transaction that carries a packet of information [36]. In Barone’s model [36], he calculated the average level of inconsistency between the information disclosed by partners, and used it to evaluate the trustworthiness function. Hou [37] built a trust model which is based on the order fill rate.
We build a trustworthiness mechanism from the perspective of downstream enterprises, with the degree of trustworthiness updated according to the transaction history. The downstream enterprise collects information about transaction number and the number of successful transactions at time . The trustworthiness of the upstream enterprise at time is , defined as:
3.2.3. Supplier Service
At time , enterprise receives ordering quantity of from an upstream supplier , where is the delivery time. We use the order fill rate to denote the supplier service. Therefore, supplier service in the prescribed time of the upstream supplier is , defined as:
3.2.4. Production and Products Delivery
Enterprise starts producing based on its capacity and the materials received from the suppliers. Notice that supply chain disruption may cause great damage to enterprises and links in the chain, seriously affecting production. We assume the coefficient reflecting the effect of supply chain disruption on production capacity is . Enterprise ’s production at time can be described as:
where is the materials received from suppliers in stage . When the production is finished, enterprise allocates the products among the downstream customers according to the number of orders. The products delivered from enterprise to enterprise is given as :
In response to concerns about product quality, customers would carefully examine the products received and the products of poor quality will be returned. The qualified products rate is given as:
where is the quantity of products that customer are satisfied with.
3.2.5. Cost
At the end of each period, the cost of enterprise is defined as and it is updated according to the following rule:
where is the unit cost of production, is the unit wholesale price charged on the suppliers, and is the cost due to the material loss.
3.2.6. Supplier Performance Updating and Partnership Integration
The purpose of partnership integration is to select appropriate suppliers to collaborate strategically and provide operational benefits. Depending upon the nature of the supply chain partnership integration problems, we formulated a multi-objective model that contains four objectives. The objectives of selecting suitable suppliers are to maximize trustworthiness , supplier service , qualified products rate , and to minimize cost . The objective functions are shown as follows:
Constraints:
Equation (11) defines the total trustworthiness of the supply chain, Equation (12) defines the total supplier service in the prescribed time, and Equations (13) and (14) give the objectives about qualified product rate and the total cost of the supply chain. Constraint (15) guarantees choosing only one supplier from each stage, and constraint (16) is a variable constraint.
In order to select suppliers to meet all the objectives easily, we use the linear-weighted method to deal with multiple objective optimization. By means of the technique for order preference by similarity to an ideal solution (TOPSIS) method, the multi-objective optimization supply chain partnership integration problem is reformulated into a single objective nonlinear programming problem. TOPSIS finds out the positive ideal solution and the negative ideal solution of multiple targets after the normalization of data standardization matrix, and then calculates the distance between evaluation targets and ideal targets to find the best solutions which have the shortest distance from the positive ideal solution and the longest distance from the negative ideal solution [38]. For the four objectives of the model, their positive ideal solutions and negative ideal solutions are and , respectively. The distance and of each evaluation target from the positive ideal solution and negative ideal solution are the following:
We use the linear normalization instead of vector normalization to reduce the complexity of computing when the numbers of variables and indices are large. Evaluation of supplier can be given as:
There are two categories of method to set the index weights. One is the subjective method, such as Delphi and AHP, which determines the relative importance of each index according to the experts’ knowledge and experience. In the comprehensive evaluation results or ranking, due to the different knowledge and experience of each decision maker or expert, it is easy to cause the evaluation results to have greater subjective randomness, which makes them unscientific for reflecting the objective information of the actual data on the evaluation index. The other one is to determine the objective weight of each index directly according to the characteristics of the data for each evaluated object, such as grey correlation analysis, entropy weight analysis, etc. Referring to Jing et al. [28], an objective weight vector method is introduced. It not only considers the amount of information (difference) between indicators, but also describes the independence (correlation) between indicators. The method is an ideal objective method of weighting as it avoids the influence of subjective factors. The weight of the index is obtained by the following:
where is the number of evaluation indexes, , is the value for the th indicator of supplier , and is the ideal value for the th indicator.
The multi-objective optimization problem is transformed to a single objective optimization problem:
4. Concepts of Integrating the Particle Swarm Optimization (PSO) and Ant Colony Optimization (ACO)
In addressing the challenges and improving both supply chain efficiency and integration partnership, machine learning-based forecasting could be used. The predictive analytics processes make use of a machine-learning approach that includes algorithms to analyze diverse datasets [39]. By learning from data from past and current performances, the approach continuously refines and converges to the final acceptable solution [40]. However, most machine-learning models require initial data training, and reply on the classification of learning models in terms of supervised or non supervised mode. In addition, they are difficult to tune the model parameters by themselves [41]. Compared with regular machine-learning techniques, heuristic algorithms need not to have initial data training procedure and determine the model mode in advance. ACO and PSO are two major algorithms of swarm intelligence in this field. Nevertheless, the main challenge using heuristic algorithms is finding a suitable initial point and updating mechanism to avoid local premature convergence [19]. When the two algorithms are applied separately, due to the inherent defects and deficiencies of the individual algorithm itself, the solving capability is relatively limited. Although the ant colony algorithm has a strong ability to search for a better solution in solving the supply chain partnership integration problem, it suffers from the blindness and long convergence time caused by lack of information in the initial stage. For the particle swarm optimization algorithm, this has a good global search ability, but due to the lack of use of feedback information in the system, its performance in local optimization is poor, and the convergence speed is slow and easy to stagnate in the later stage. To overcome these drawbacks from each of the individual algorithms, a hybrid algorithm based on PSO and ACO to achieve complementary advantages is considered. The proposed PSACO algorithm combines the stronger capability of global search of PSO with positive feedback of ACO to avoid the premature convergence to a local optimal solution and improve the efficiency [42].
4.1. The Concepts of PSO and ACO
Inspired by the social foraging behaviors of some animals, particle swarm optimization was first proposed in 1995. It finds the optimal solution for problems through the movements of a population of candidate solutions, here defined as particles [17]. When applying PSO, it initially comes with a number of particles, continuously calculates the fitness, and updates particles’ velocity and location till the stop condition is satisfied. As a popular intelligent algorithm, PSO has advantages of stronger global search ability, quick convergence speed and less controlling parameters. However, it does not have good ability in dealing with the feedback information. It is easy to encounter local optimization and slow convergence in the later stage [43].
On the other hand, ACO was first developed in 1992. It is simulated with the search food process of ants to solve complex optimization problems [44]. During the foraging process, each virtual ant in the colony would search the path according to the transition probability and leave some pheromones on their trails. The more pheromones left on the path, the more likely ants will use this path. ACO is a simulated evolutionary algorithm based on swarm intelligence, and has some advantages of positive feedback, distributed computation and good search capability. However, due to the lack of information at the initial stage, ACO has disadvantages such as slow convergence speed and easily gets into a local optimum [28].
4.2. The Idea of Integrating PSO and ACO
A hybrid algorithm of PSO and ACO combines the global search capability of PSO with positive feedback of ACO. In Manish’s [19] work, the hybrid algorithm fuses the distance measurement in ACO and the direction measurement in PSO to generate a new probabilistic metric. The new algorithm has good convergence speed and avoids trapping into the local optimal value. In Kiran’s [42] proposed algorithm, the global optimum is selected by comparing the optimal value obtained from PSO and ACO, with better global capability and local search capability. Huang [45] proposed a hybrid algorithm using PSO to generate new particles and updates pheromone-particle table for ACO, avoiding from falling into the local optimum.
In this paper, the key idea of fusing PSO and ACO comes from Shelokar [46] and Kaveh [47] in two steps: (1) generate the initial solution of problem using the randomness and global search capability of PSO, and (2) update initial pheromones based on the solutions of PSO, then apply ACO to search until the optimal value is found according to its positive feedback mechanism and higher optimizing precision. We summarize the advantages and disadvantages of PSO and ACO to clarify the characteristics of the hybrid algorithm in Table 1. The hybrid algorithm possesses the advantages of both algorithms of PSO and ACO, and its potential for a better solution to the objective function is anticipatorily higher than using PSO and ACO alone.

Table 1.
Advantages and disadvantages of particle swarm optimization (PSO), ant colony optimization (ACO), and the proposed hybrid algorithms.
5. Supply Chain Partnership Integration Algorithm Based on the Hybrid Algorithm
With the consideration of multiple factors such as products, production loss and production capacity, Che [16] solved a multi-echelon unbalanced supplier selection problem by using PSO, where an exchange and disturbance mechanism was provided to prevent PSO from being trapped in the local optimal. In order to achieve effective supply chain network coordination, Sinha [13] developed co-evolutionary PSO based on Cauchy distribution and it provided a shorter path towards approaching the solution. Niu’s [48] work introduced randomness in the transition probability, an improved ACO is proposed to address the partner selection problem to produce better results. Although PSO and ACO have a good ability to solve massive partnership integration problems, PSO easily falls into a local extremum at the later evolution stage and ACO is prone to slow convergence. We use a hybrid algorithm PSACO to have complementary advantages to solve the partnership integration problem.
5.1. Updating Particles’ Positions and Velocities
PSO starts with a random set of particles, each of which corresponds to a potential solution [42]. Each particle has a position and velocity. The position of each particle is represented by a dimensional vector in problem hyperspace , which can be mapped into a supplier selection problem. represents that select node supplier from stage in the supply chain and supplier performance is evaluated based on the predefined optimization mathematical model .
As particles have a memory function, each particle will update its velocity based on two values. One is the best value found by the particle itself, the other value is the best-known value found by the whole particle currently. The velocity update rule is shown as below:
where is the current position of particle , represents iteration index, is the best position at iteration number , and is the best position among all particles. Each particle of is in the interval to avoid excessive movement of particles out of the search space. and are two random variables distributed in the interval , and are cognitive and social learning coefficient, and is the inertial weight.
For general PSO, inertial weight is a fixed constant and it can easily control an algorithm’s search ability and convergence speed. It has an important impact on operation process in algorithm. The larger the inertia weight is, the stronger the global detection ability and the weaker local detection will be; while a smaller inertia weight is good at search the local area and can obtain more precise solutions. We introduce a linear inertia weight to improve the performance of PSO. This method is better at controlling the capability of global search and local search, and accelerating the convergence speed. The inertia weight is updated by:
where and represent the minimum and maximum of respectively, and is the maximum number of iterations. Particle ’s best position is calculated as:
The global optimal position in the problem space at time can be calculated as:
The position of particles update rules is shown below:
5.2. Ant Movement
After using PSO, the initial solutions for supply chain partnership integration are obtained and inferior solutions are excluded. These initial solutions are used to form the initial distribution of pheromones for ACO. In the process of the ACO algorithm, a probability function is used to decide the next move. At the beginning of the ant search for a solution, the ants are randomly placed on the starting node and update the pheromones associated with the suppliers through their tours. These nodes represent optional suppliers. The ant located on the supplier moves to supplier at moment by using the following transition probability:
where and are the parameters affecting the path searching of ants, is the pheromone left on the way between supplier and , and is defined as the evaluation goal value of a supplier. is the intensity trail on the path between supplier and at moment , and is the available node for ant .
5.3. Pheromone Updating
Each time ants complete the journey, a feasible constitution of the solution of supply chain partnership integration is constructed. The ants are updating the pheromone trail intensity when the ants march forward. The pheromone updating is a decisive factor of the performance of ant colony optimization, so some improvements of the pheromone updating rule are introduced. The pheromone reflects the quality of solutions that ants produce. The more pheromones left on the solutions, the more possible the solutions are optimal. The pheromone updating is displayed as the following formula:
where is a pheromone volatilization coefficient (), is the optimal value of pheromone variation, is the pheromone deposited between supplier and . is the value of a solution found by ant .
The process of PSACO is shown in Figure 5.
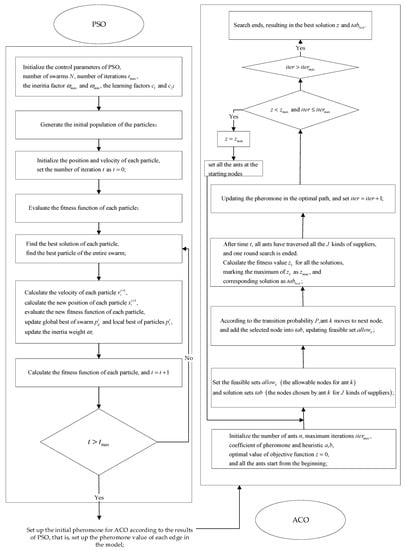
Figure 5.
The process of PSACO.
6. Numerical Experiments
A real-life example of a computer supply chain network is presented to demonstrate the applicability of the event based multi-objective optimization model and the feasibility of PSACO. The typical computer supply chain network includes multiple echelon processes—raw materials production, chips and components production, primary production and assembly, etc. In our test, we consider 10 types of raw material, mid-product and final product—silicon, semiconductor, transistor, plastic raw material, wafer, host computer, accessories, assembly, final test and computer. In each process echelon, there are 15 enterprises to complete the material supply or production and meet the demand of the downstream customer. We choose only one supplier for each material to ensure the solutions selected are reasonable and efficient.
Simulated data are collected from 1688.com, the B2B E-business platform for global wholesale trade, which serves millions of buyers and suppliers around the world. The company profile on 1688.com displays the supplier’s basic information, credit archive, transaction records within the 90 days, etc. The 4 indices in the multi-objective programming model for each supplier are learned from the profile as the following: (1) the trustworthiness is obtained from ratio of the number of customer order returns to the transactions completed; (2) the service is represented by the number of reviews satisfied in the customer ratings; (3) the quality of product is reflected by the number of customer returns resulting from quality issues; and (4) the total cost of product is substituted for by the multiplication of the number of orders and the material prices of the upstream supplier.
6.1. Parameters Optimization
In this section, we discuss the effect of four key parameters in the ACO of the PSACO algorithm. Our goal is to identify the optimal setting of parameters to produce the best results during the operation of the algorithm. The parameters include ant number M, coefficients that reflect the relative importance of pheromones and heuristic information b, pheromone evaporation coefficient . The results of optimal values for parameters are shown in the figures below.
For ACO, the efficiency of search is greatly affected by the number of ants. In the path search phase of the ant colony, when the number of ants is larger, the global searching ability can be greatly improved. However, until a certain point, the convergence rate will be slower. The relationship between the optimal solution and the number of ants is shown in Figure 6a. We can found that the critical point is 500. When M < 500, the performance of the algorithm is improved. But when M = 500, the algorithm reaches the optimal solution, proving the existence of the extremum. Therefore, we can conclude that it is sufficient to set the number of ants M = 500.
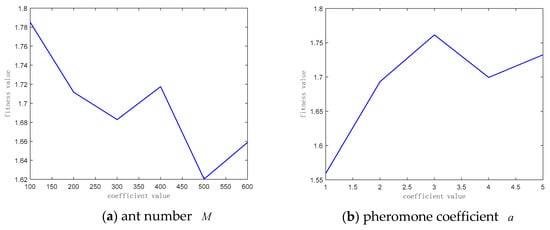
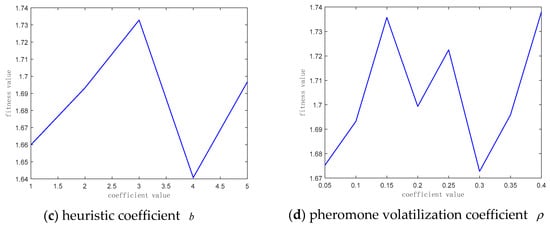
Figure 6.
Optimization of parameters of ACO. (a) ant number; (b) pheromone coefficient; (c) heuristic coefficient; (d) pheromone volatilization coefficient.
Heuristic factors a and b are critical factors for ACO algorithm, and they are used to calculate the transition probability. Pheromone volatilization coefficient is used to update the pheromone concentration after each search. In Figure 6b, when a = 1, the performance of the algorithm is the best. For heuristic coefficient b, the larger b is, the weaker convergence speed will be. We can find out from Figure 6c that the algorithm gets the optimal solution when its value is 4. Pheromone volatilization coefficient is also an important factor affecting the amount of pheromones in the path. It is a constant in interval (0, 1). The larger is, the lower the convergence speed, but it is helpful to get the global optimal solution. Instead, when the value of is lower, it reduces the searching time of ACO, while easily getting into the local optimum trap. The experiment indicates that the best value of is 0.3.
6.2. Results and Discussion
To study the performance of the proposed algorithm, we use MATLAB 9.40 (R2018a) software to carry out the experiments. Based on the simulation results, the proposed PSACO has been compared with PSO and ACO in detail. The specific results from the PSO, ACO, PSACO are shown in following figures.
Figure 7, Figure 8, Figure 9 and Figure 10 compare the search performance between the original ACO and PSO algorithms and the hybrid algorithm. The curves shown in the pictures describe the search processes up to the 60th iteration. We have two findings. Firstly, the three result curves of these algorithms have a similar tendency. The fitness value in the initial phase decreases sharply and searching efficiency reduces quickly in the final stages of the iteration. Secondly, the converging speed of PSACO is the fastest among the three algorithms. It is clearly reflected in Figure 10 when the three algorithms are shown in the same graph in which the black, blue and red curves represent PSO, ACO and PSACO respectively. The PSO’s searcher fitness value decreases gradually and unstably at the initial stage until it reaches its optimal solution of 1.4844 at the 20th iteration, revealing a defect that the algorithm tends to be trapped into local optima. The ACO’s searching fitness value quickly decreases and becomes stable at the 4th iteration with its optimal solution of 1.6588. This states that ACO has the worst result for lacking available feedback information. As for the hybrid algorithm, PSACO rapidly achieves the optimal stable result 1.4432 at the 10th iteration. The curve of PSACO has the best solution value. It conquers the flaw of redundant iterations that PSO generates, especially where the problem is on a large scale. It utilizes the optimal solutions generated by PSO to update initial pheromone and the searching speed brought by ACO. Hence, Hence, compared with PSO and ACO, PSACO has lower time cost and better performance.
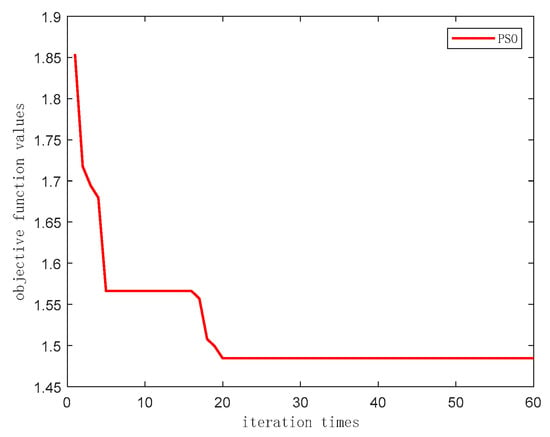
Figure 7.
Iterative process diagrams of PSO.
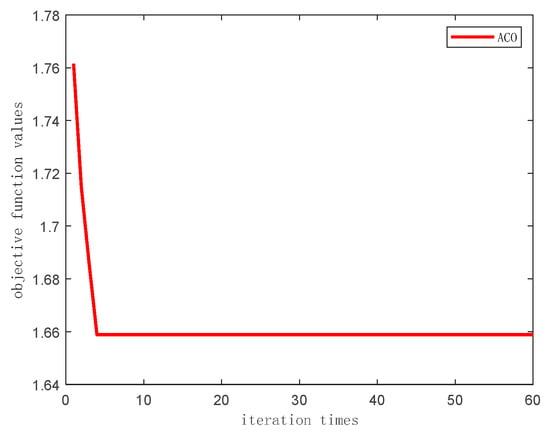
Figure 8.
Iterative process diagrams of ACO.
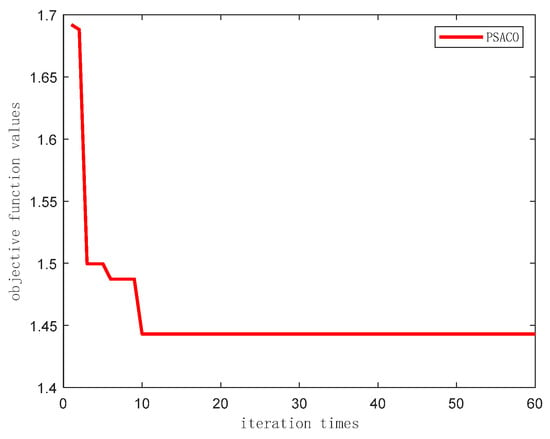
Figure 9.
Iterative process diagrams of PSACO.
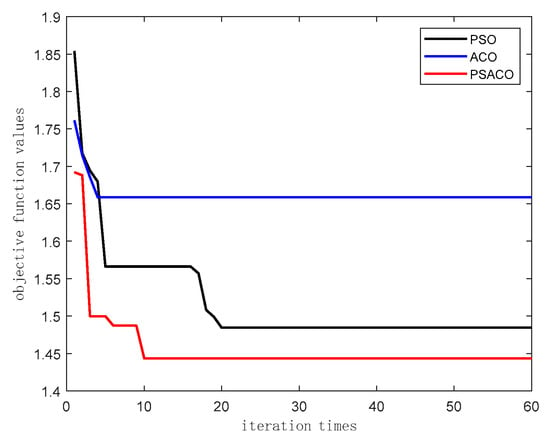
Figure 10.
Comparison among PSO, ACO and PSACO.
We undertake an analysis of variance (ANOVA) for three algorithms to validate their objective function values statistically. For each algorithm, we conducted 60 runs. Table 2 shows the result. The test proved to be significant as the p value is 0.00 < 0.05, meaning that there are great performance disparities among the three algorithms. In order to further study the significant differences between the algorithms, we conducted a Tukey post hoc test which is displayed in Figure 11. The Tukey test shows that PSACO-PSO, ACO-PSO, ACO-PSACO vary differently. Among them PSACO-PSO has closer unanimity and PSACO-ACO and ACO-PSO have great differences. Figure 12 illustrates the boxplot graphs of three algorithms. It further proves that PSACO possess better statistical performance by measuring the dispersion of data used to distinguish it from PSO and ACO. As can be seen from the figure, PSACO is the lowest and also has a larger data spread.

Table 2.
Analysis of variance (ANOVA) results for PSO, ACO and PSACO.
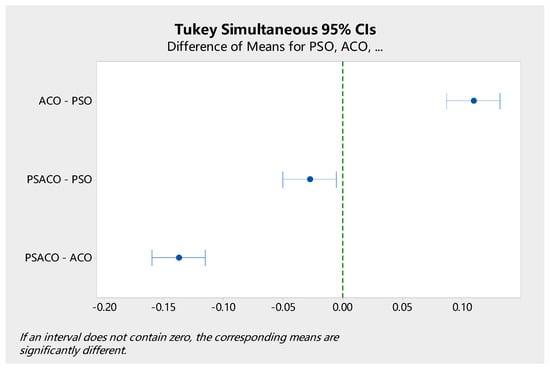
Figure 11.
Tukey test at 95% confidence interval (CI).
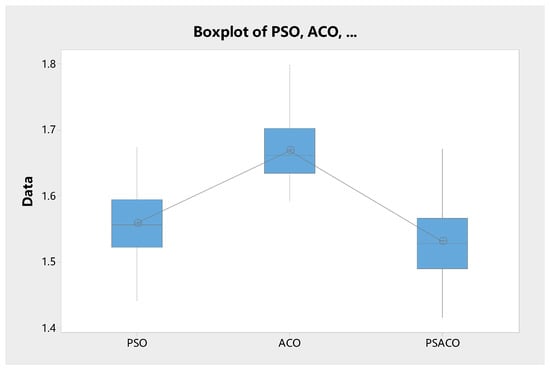
Figure 12.
BoxPlot graph for algorithm results.
The experimental results of the different algorithms are summarized in Table 3. For each algorithm, five best supplier combinations in supply chain network are listed. The optimal solution obtained by PSACO algorithm is, with the objective function value of 1.4432, comparing with the results of with 1.4844 and with 1.6588 by PSO and ACO, respectively. Apparently the optimal supplier integration result from PSACO exceeds that of PSO and ACO in terms of the objective function values. We extend the three solutions and find their event values on the four indices for each of them. Firstly, the total cost of the supply chain obtained from each algorithm is 124 on PSACO, 135.2 on PSO, and 135.6 on ACO, showing a 9.03% saving of PSACO over PSO, and 9.35% saving of PSACO over ACO. Optimizing supply chain costs at a competitive service level can greatly improve the profitability. Secondly, the trustworthiness values of the supply chains are 785.45, 683.85 and 763.11 for PSACO, PSO and ACO respectively, showing that the solution from PSACO has great advantage in improving the trust relationship among the supply chain partners. In collaborative innovation of the supply chain, trust is the foundation of building tight alliances and can greatly reduce the cooperative risk. Thirdly, the values of overall supplier chain service are 974, 971, and 975, in which PSACO is the second best. Having a high level of modularization structure of the supply chain in order fulfilment will ensure that products het to market in a fast and efficient way with the most consistent levels of fulfilment precision. Finally, the qualified product rates are 80%, 78%, and 80%, indicating that PSACO has a fine ratio. A successful supply chain system should be modelled in detail by a programming approach that takes into account not only downgraded products but also the customer requirements for the quality qualification rate to maximize the total profit of the product portfolio. In the overall performance of the key measurements, the supply chain partnership selected by PSACO creates the integration or tight process and information linkages between function across the supply which allows the smooth, synchronized flow of both information and product between customers, suppliers and logistics providers.

Table 3.
Summary of results.
7. Conclusions and Further Research
In this paper, we describe an event-based supply chain partnership integration model which lists the events related with all phases of cooperation with partners and puts events into a dynamic supply chain network to obtain factors influencing supply chain partnership integration. Based on the indices of trustworthiness, supplier’s service, qualified products rate and cost of supply chain, a multi-objective optimization model is established. A hybrid algorithm PSACO that employs particle swarm optimization (PSO) and ant colony optimization (ACO) is introduced to solve the integration model. To verify the rationality and validity of our model and PSACO algorithm, a simulation experiment using actual data of computer assembling was designed to assess the performance of PSACO in the comparisons with that of PSO and ACO. Analysis of the experimental results shows that PSACO provides better solution and has a higher efficiency than PSO and ACO. By implementing the event-driven model with a PSACO algorithm, a B2B platform can provide supply chain coordination scheme in a dynamic manner, as in most cases it will have to be adjusted under a disruption scenario. The parties in the supply chain fully coordinate their decisions for the partner selection based on the real-time values on the key events which are identified by the retrospective steeling wheel analysis.
The event-based model provides more accurate information to reduce the uncertainties and increase visibility in the supply chain. Enterprises use this information to make better decisions and achieve better integration with downstream and upstream suppliers. It is an effective tool for enterprises to build trust relationships. Our approach adapts an objective method to determine the index weights and creates several alternatives for partnership integration based on an objective method which considers both the difference and correlation between indicators. This is different from the approach in the work of Faroop and Qazi [5] which depends on the experts’ experience which results in high subjectivity. They choose alternatives for integration by using sensitivity analysis for each factor individually and try to determine the outcome.
There are some limitations and problems that are worth further discussing and improving upon. Firstly, we only considered simple events in the model. Future research should push limitations by adopting more complex events such as competitions between suppliers, bullwhip effect, and considering a different order distribution decision, such as a trust-based decision, a price-based decision rule, etc. In addition, a pull-model supply chain is considered in this paper. In reality, however, every supply chain cannot rely entirely on either push or pull strategy. Further study should employ a mixture of the two strategies to make the model reflect actual operation conditions of a supply chain more factually. Secondly, a linear decreasing inertia weight is considered in the proposed algorithm. However, according to Bansal and Singh [49], chaotic inertia weight is the best strategy for better accuracy and random inertia weight strategy is better for better efficiency. It is possible to use these strategies to enhance the performance of the algorithm. Meanwhile the optimal setting of parameters in the PSO has not yet been considered. In the future, we could integrate other heuristic algorithms, such as a genetic algorithm (GA) and memetic algorithm (MA) etc., into the PSO and ACO in order to obtain better solutions.
Author Contributions
Conceptualization, Z.L.; methodology, Z.L. and H.W.; software, H.W.; validation, Z.L., and H.W.; formal analysis, H.W.; investigation, Z.L.; data curation, H.W.; writing—original draft preparation, Z.L. and H.W.; writing—review and editing, Z.L.; visualization, H.W.; supervision, Z.L.; project administration, Z.L.; funding acquisition, Z.L. All authors have read and agreed to the published version of the manuscript.
Funding
This research was supported by the financial sponsor from Natural Science Foundation of Shanghai (grant number 18ZR1416900).
Conflicts of Interest
The authors declare no conflict of interest.
References
- Qu, W.G.; Pinsonneault, A.; Tomiuk, D.; Wang, S.; Liu, Y. The impacts of social trust on open and closed B2B e-commerce: A Europe-based study. Inf. Manag. 2015, 52, 151–159. [Google Scholar] [CrossRef]
- Yoo, T.; Cho, H.; Yücesan, E. Hybrid algorithm for discrete event simulation based supply chain optimization. Expert Syst. Appl. 2010, 37, 2354–2361. [Google Scholar] [CrossRef]
- Choi, Y.; Kang, D.; Chae, H.; Kim, K. An enterprise architecture framework for collaboration of virtual enterprise chains. Int. J. Adv. Manuf. Technol. 2006, 35, 1065–1078. [Google Scholar] [CrossRef]
- Vlahakis, G.; Apostolou, D.; Kopanaki, E. Enabling situation awareness with supply chain event management. Expert Syst. Appl. 2018, 93, 86–103. [Google Scholar] [CrossRef]
- Farooq, M.; Salman, Q.; Arshad, M.; Khan, I.; Akhtar, R.; Kim, S. An Artificial Bee Colony Algorithm Based on a Multi-Objective Framework for Supplier Integration. Appl. Sci. 2019, 9, 588. [Google Scholar] [CrossRef]
- Kim, S.W. An investigation on the direct and indirect effect of supply chain integration on firm performance. Int. J. Prod. Econ. 2009, 119, 328–346. [Google Scholar] [CrossRef]
- Yan, S.R.; Zheng, X.L.; Wang, Y.; Song, W.W.; Zhang, W.Y. A graph-based comprehensive reputation model: Exploiting the social context of opinions to enhance trust in social commerce. Inf. Sci. 2015, 318, 51–72. [Google Scholar] [CrossRef]
- Chen, K.; Xu, R.; Fang, H. Information Disclosure Model Under Supply Chain Competition with Asymmetric Demand Disruption. Asia Pac. J. Oper. Res. 2016, 33, 156–172. [Google Scholar] [CrossRef]
- Halinen, A.; Törnroos, J.-Å.; Elo, M. Network process analysis: An event-based approach to study business network dynamics. Ind. Mark. Manag. 2013, 42, 1213–1222. [Google Scholar] [CrossRef]
- Konovalenko, I.; Ludwig, A. Event processing in supply chain management—The status quo and research outlook. Comput. Ind. 2019, 105, 229–249. [Google Scholar] [CrossRef]
- Chang, Y.-H. Adopting co-evolution and constraint-satisfaction concept on genetic algorithms to solve supply chain network design problems. Expert Syst. Appl. 2010, 37, 6919–6930. [Google Scholar] [CrossRef]
- Hong, J.; Diabat, A.; Panicker, V.V.; Rajagopalan, S. A two-stage supply chain problem with fixed costs: An ant colony optimization approach. Int. J. Prod. Econ. 2018, 204, 214–226. [Google Scholar] [CrossRef]
- Sinha, A.K.; Aditya, H.K.; Tiwari, M.K.; Chan, F.T.S. Agent oriented petroleum supply chain coordination: Co-evolutionary Particle Swarm Optimization based approach. Expert Syst. Appl. 2011, 38, 6132–6145. [Google Scholar] [CrossRef]
- Altiparmak, F.; Gen, M.; Lin, L.; Paksoy, T. A genetic algorithm approach for multi-objective optimization of supply chain networks. Comput. Ind. Eng. 2006, 51, 196–215. [Google Scholar] [CrossRef]
- Kuo, R.J.; Han, Y.S. A hybrid of genetic algorithm and particle swarm optimization for solving bi-level linear programming problem—A case study on supply chain model. Appl. Math. Model. 2011, 35, 3905–3917. [Google Scholar] [CrossRef]
- Che, Z.H. A particle swarm optimization algorithm for solving unbalanced supply chain planning problems. Appl. Soft Comput. 2012, 12, 1279–1287. [Google Scholar] [CrossRef]
- Li, H.; He, H.; Wen, Y. Dynamic particle swarm optimization and K-means clustering algorithm for image segmentation. Optik 2015, 126, 4817–4822. [Google Scholar] [CrossRef]
- Mulani, K.; Talukdar, P.; Das, A.; Alagirusamy, R. Performance analysis and feasibility study of ant colony optimization, particle swarm optimization and cuckoo search algorithms for inverse heat transfer problems. Int. J. Heat Mass Transf. 2015, 89, 359–378. [Google Scholar] [CrossRef]
- Mandloi, M.; Bhatia, V. A low-complexity hybrid algorithm based on particle swarm and ant colony optimization for large-MIMO detection. Expert Syst. Appl. 2016, 50, 66–74. [Google Scholar] [CrossRef]
- Du, T.C.; Lai, V.S.; Cheung, W.; Cui, X. Willingness to share information in a supply chain: A partnership-data-process perspective. Inf. Manag. 2012, 49, 89–98. [Google Scholar] [CrossRef]
- Money, K.; Hillenbrand, C.; Day, M.; Magnan, G.M. Exploring reputation of B2B partnerships: Extending the study of reputation from the perception of single firms to the perception of inter-firm partnerships. Ind. Mark. Manag. 2010, 39, 761–768. [Google Scholar] [CrossRef]
- Lostakova, H.; Pecinova, Z. The Role of Partnership and Flexibility in Strengthening Customer Relationships in the B2B Market. Procedia Soc. Behav. Sci. 2014, 150, 563–575. [Google Scholar] [CrossRef]
- Eksoz, C.; Mansouri, S.A.; Bourlakis, M.; Önkal, D. Judgmental adjustments through supply integration for strategic partnerships in food chains. Omega 2018, 87, 20–33. [Google Scholar] [CrossRef]
- Elliott, S. Collaborative Advantage: Winning Through Extended Enterprise Supplier Networks: Jeffrey, H. Dyer; Oxford University Press, 2000. 209 + xii pages $27.50. J. Prod. Innov. Manag. 2001, 18, 352. [Google Scholar] [CrossRef]
- Shafique, M.; Rashid, A.; Bajwa, I.; Kazmi, R.; Khurshid, M.; Tahir, W. Effect of IoT Capabilities and Energy Consumption behavior on Green Supply Chain Integration. Appl. Sci. 2018, 8, 2481. [Google Scholar] [CrossRef]
- Kumar, V.; Chibuzo, E.N.; Garza-Reyes, J.A.; Kumari, A.; Rocha-Lona, L.; Lopez-Torres, G.C. The Impact of Supply Chain Integration on Performance: Evidence from the UK Food Sector ☆. Procedia Manuf. 2017, 11, 814–821. [Google Scholar] [CrossRef]
- Hwang, Y.-D.; Lin, Y.-C.; Lyu, J. The performance evaluation of SCOR sourcing process—The case study of Taiwan’s TFT-LCD industry. Int. J. Prod. Econ. 2008, 115, 411–423. [Google Scholar] [CrossRef]
- Luan, J.; Yao, Z.; Zhao, F.; Song, X. A novel method to solve supplier selection problem: Hybrid algorithm of genetic algorithm and ant colony optimization. Math. Comput. Simul. 2019, 156, 294–309. [Google Scholar] [CrossRef]
- Hou, Y.; Xiong, Y.; Wang, X.; Liang, X. The effects of a trust mechanism on a dynamic supply chain network. Expert Syst. Appl. 2014, 41, 3060–3068. [Google Scholar] [CrossRef]
- Cai, Y.; Xie, H.; Lau, R.Y.K.; Li, Q.; Wong, T.-L.; Wang, F.L. Temporal event searches based on event maps and relationships. Appl. Soft Comput. 2019, 105750. [Google Scholar] [CrossRef]
- Al-Areqi, S.; Görges, D.; Liu, S. Event-based networked control and scheduling codesign with guaranteed performance. Automatica 2015, 57, 128–134. [Google Scholar] [CrossRef]
- Fonfara, K.; Ratajczak-Mrozek, M.; Leszczyński, G. Change in business relationships and networks: Concepts and business reality. Ind. Mark. Manag. 2018, 70, 1–4. [Google Scholar] [CrossRef]
- Nisar, T.M.; Prabhakar, G. What factors determine e-satisfaction and consumer spending in e-commerce retailing? J. Retail. Consum. Serv. 2017, 39, 135–144. [Google Scholar] [CrossRef]
- Michalski, M.; Montes, J.L.; Narasimhan, R. Relational asymmetry, trust, and innovation in supply chain management: A non-linear approach. Int. J. Logist. Manag. 2019, 30, 303–328. [Google Scholar] [CrossRef]
- Tykhonov, D.; Jonker, C.; Meijer, S.; Verwaart, T. Agent-Based Simulation of the Trust and Tracing Game for Supply Chains and Networks. J. Artif. Soc. Soc. Simul. 2008, 11, 1–30. [Google Scholar]
- Barone, M.; Coscia, M. Birds of a feather scam together: Trustworthiness homophily in a business network. Soc. Netw. 2018, 54, 228–237. [Google Scholar] [CrossRef]
- Hou, Y.; Wang, X.; Wu, Y.J.; He, P. How does the trust affect the topology of supply chain network and its resilience? An agent-based approach. Transp. Res. Part E Logist. Transp. Rev. 2018, 116, 229–241. [Google Scholar] [CrossRef]
- Lima Junior, F.R.; Osiro, L.; Carpinetti, L.C.R. A comparison between Fuzzy AHP and Fuzzy TOPSIS methods to supplier selection. Appl. Soft Comput. 2014, 21, 194–209. [Google Scholar] [CrossRef]
- Predictive Analytics and Machine Learning in the Supply Chain. ThomasNet News 2018, 66.
- Feizabadi, J.; Shrivastava, A. Does AI-enabled demand forecasting improve supply chain efficiency? Supply Chain Manag. Rev. 2018, 22, 8–10. [Google Scholar]
- Wu, L.; Huang, G.; Fan, J.; Ma, X.; Zhou, H.; Zeng, W. Hybrid extreme learning machine with meta-heuristic algorithms for monthly pan evaporation prediction. Comput. Electron. Agric. 2019, 105115. [Google Scholar] [CrossRef]
- Kıran, M.S.; Gündüz, M.; Baykan, Ö.K. A novel hybrid algorithm based on particle swarm and ant colony optimization for finding the global minimum. Appl. Math. Comput. 2012, 219, 1515–1521. [Google Scholar] [CrossRef]
- Chen, Y.-W.; Wang, L.-C.; Wang, A.; Chen, T.-L. A particle swarm approach for optimizing a multi-stage closed loop supply chain for the solar cell industry. Robot. Comput. Integr. Manuf. 2017, 43, 111–123. [Google Scholar] [CrossRef]
- Engin, O.; Güçlü, A. A new hybrid ant colony optimization algorithm for solving the no-wait flow shop scheduling problems. Appl. Soft Comput. 2018, 72, 166–176. [Google Scholar] [CrossRef]
- Huang, C.-L.; Huang, W.-C.; Chang, H.-Y.; Yeh, Y.-C.; Tsai, C.-Y. Hybridization strategies for continuous ant colony optimization and particle swarm optimization applied to data clustering. Appl. Soft Comput. 2013, 13, 3864–3872. [Google Scholar] [CrossRef]
- Shelokar, P.S.; Siarry, P.; Jayaraman, V.K.; Kulkarni, B.D. Particle swarm and ant colony algorithms hybridized for improved continuous optimization. Appl. Math. Comput. 2007, 188, 129–142. [Google Scholar] [CrossRef]
- Kaveh, A.; Talatahari, S. A particle swarm ant colony optimization for truss structures with discrete variables. J. Constr. Steel Res. 2009, 65, 1558–1568. [Google Scholar] [CrossRef]
- Niu, S.H.; Ong, S.K.; Nee, A.Y.C. An enhanced ant colony optimiser for multi-attribute partner selection in virtual enterprises. Int. J. Prod. Res. 2012, 50, 2286–2303. [Google Scholar] [CrossRef]
- Bansal, J.C.; Singh, P.K.; Saraswat, M.; Verma, A.; Jadon, S.S.; Abraham, A. Inertia Weight strategies in Particle Swarm Optimization. In Proceedings of the 2011 Third World Congress on Nature and Biologically Inspired Computing, Salamanca, Spain, 19–21 October 2011; pp. 633–640. [Google Scholar]
© 2019 by the authors. Licensee MDPI, Basel, Switzerland. This article is an open access article distributed under the terms and conditions of the Creative Commons Attribution (CC BY) license (http://creativecommons.org/licenses/by/4.0/).