Article

Measurement of Structural Loads Using a Novel MEMS Extrinsic Fabry–Perot Strain Sensor

1
State Key Laboratory of Mechanics and Control of Mechanical Structures, Nanjing University of Aeronautics and Astronautics, Nanjing 210016, China
2
State Key Laboratory of Transducer Technology, Shanghai Institute of Microsystem and Information Technology, Chinese Academy of Sciences, Shanghai 200050, China
*
Author to whom correspondence should be addressed.
Appl. Sci. 2020, 10(1), 18; https://doi.org/10.3390/app10010018
Submission received: 7 November 2019 / Revised: 15 December 2019 / Accepted: 16 December 2019 / Published: 18 December 2019
(This article belongs to the Special Issue Biomedical Optics and Engineering)

Abstract

:
In this paper, microelectromechanical systems (MEMS) technology was used to fabricate a novel extrinsic fiber Fabry–Perot (EFFP) strain sensor; this fiber sensor is applied to measure load with higher precision for a small structure. The sensor cavity consists of two Fabry–Perot (FP) cavity mirrors that are processed by surface micromachining and then fused and spliced together by the silicon–glass anode bonding process. The initial cavity length can be strictly controlled, and the excellent parallelism of the two faces of the cavity results in a high interference fineness. Then, the anti-reflection coating process is applied to the sensor to improve the clarity of the interference signal with the cavity, with its wavelength working within the range of the C + L band. Next, the sensor placement is determined by the finite element software Nastran. Experimental results indicate that the sensor exhibits a good linear response (99.77%) to load changes and a high repeatability. Considering the strain transfer coefficient, the sensitivity for the tested structure load is as high as 35.6 pm/N. Due to the miniaturization, repeatability, and easy-to-batch production, the proposed sensor can be used as a reliable and practical force sensor.

1. Introduction

Fiber optic sensors are desirable in engineering measurement due to their advantages such as small size, anti-electromagnetic interference, high resolution, and reusability [1,2]. As a basic physical parameter, the strain can be successfully measured by sensors including the fiber Bragg grating [3,4], interferometric fiber-optic sensor [5,6,7] and distributed fiber sensor [8,9]. Among them, the Fabry–Perot (FP) sensors are an attractive choice, owing to their compact structure, and especially their advantages in terms of sensitivity and high-temperature resistance [10,11,12]. Previous studies have proposed FP force sensors; the theory of the axial contact force sensor reported by [13] corroborated that the wavelength of interference dip will have a shift as the applied axial force increases. In [14], Arata et al. implemented a new fiber-optical force sensor as a modular sensor used in surgery.
The sensitivity of the FP sensor depends on the dimensions and shape of the microcavity, including the spheroidal cavity [15], hollow tube [16], and microbubble [17]. Domingues et al. proposed an intrinsic cost-effective FP sensor by splicing two optical fibers previously destroyed by the catastrophic fuse effect [18]. The sensor was embedded into a polymer casing with a maximum sensitivity of 59.39 ± 1.7 pm/kPa. Liu et al. proposed an integrated optical fiber Fabry–Perot interferometer (FPI) sensor, which was composed of an in-fiber microcavity and a tiny segment of single-mode fiber (SMF). The sensor performed for a temperature and pressure double parameter measurement with a sensitivity of 10.8 pm/°C and 4.1587 nm/MPa, respectively [19]. Microstructured optical fibers (MOFs) have been used as more effective sensors in recent years: Wang et al. achieved strain measurement based on a photonic crystal fiber (PCF) with an embedded coupler, which was fabricated by use of a femtosecond (fs)-laser-assisted selective infiltration method, resulting in a high strain sensitivity of −22 pm/uε [20]. However, its temperature measurement range is too narrow, which severely limits its practical applications.
On this basis, the bubble structure has developed from a simple air bubble to the “fiber in capillary”. Liu et al. [21] reported a strain force sensor based on a fiber inline Fabry–Perot microcavity plugged by cantilever taper L1, and the hollow tube length L2; the strain force sensitivity can be improved by reducing the sidewall thickness. However, it has an ultra-thin sidewall that sacrifices the mechanical strength. Liu et al. [22] proposed a new ultra-thin crescent-shaped FP cavity by multimode optical fiber with higher sensitivity than conventional elliptical or D-shaped sensors. However, all these methods involve various complicated steps, expensive photonic crystal fibers (PCFs) [23], or other special optical fibers.
Much research has been carried out to overcome these shortcomings, and various kinds of new technologies are presented to fabricate FPIs. Liu et al. [24] designed a gas-cavity fiber Fabry–Perot interference strain sensor by using arc discharge technology and invading liquid to make microbubbles. Jiang et al. [25] used a femtosecond laser processing and phase masking method to write a Type II fiber grating around the miniature fiber Fabry–Perot interferometer to measure the strain and high temperature, simultaneously. Moreover, the combination of FP fiber sensors with microelectromechanical systems (MEMS) technology can provide a new solution for the miniaturization of an optical fiber sensing systems [26]. The fabrication and preliminary testing of a new MEMS pressure sensor is described in [27], while the entire MEMS structure is fabricated directly on the optical fiber. Pang et al. proposed an FP sensor based on MEMS technology, which consists of a 45° polished optical fiber and silicon thin film to form an air chamber that can simultaneously measure pressure and temperature [28]. However, the above-mentioned FP cavity is fabricated in the face of the fiber or the fiber itself, which cannot ensure high smoothness, and it is difficult to increase the optical reflectivity of the surface by optical coating; thus, it is not easy to obtain a more stable interference spectrum of the interference cavity.
In this study, a high sensitivity extrinsic fiber FP (EFFP) strain sensor based on MEMS technology is proposed. The surfaces of the cavity with good parallelism can effectively solve the issues that the flatness of the existing two surfaces is poor and that the FP cavity length cannot be accurately controlled. Thus, the interference fineness is high. The sensor is applied to achieve high-precision measurement of a load for a small tested structure. During the test process, the influence of temperature to the FP sensor is decoupled according to the difference in temperature sensitivity between FBG and FP sensors. Next, the finite element software Nastran is used to analyze the strain distribution of the tested structures under axial force, which provides a judgment for sensor placement. Finally, the experimental setup is described to confirm the sensor linearity to the axial force of the tested structure and ensure repeatability. This novel strain sensor has high accuracy, linearity, stability, and repeatability, and it is easy to realize miniaturization and mass production. Therefore, it can be used as a distributed strain sensor or a stable force sensor with potential industrial applications in the case of weak strain.

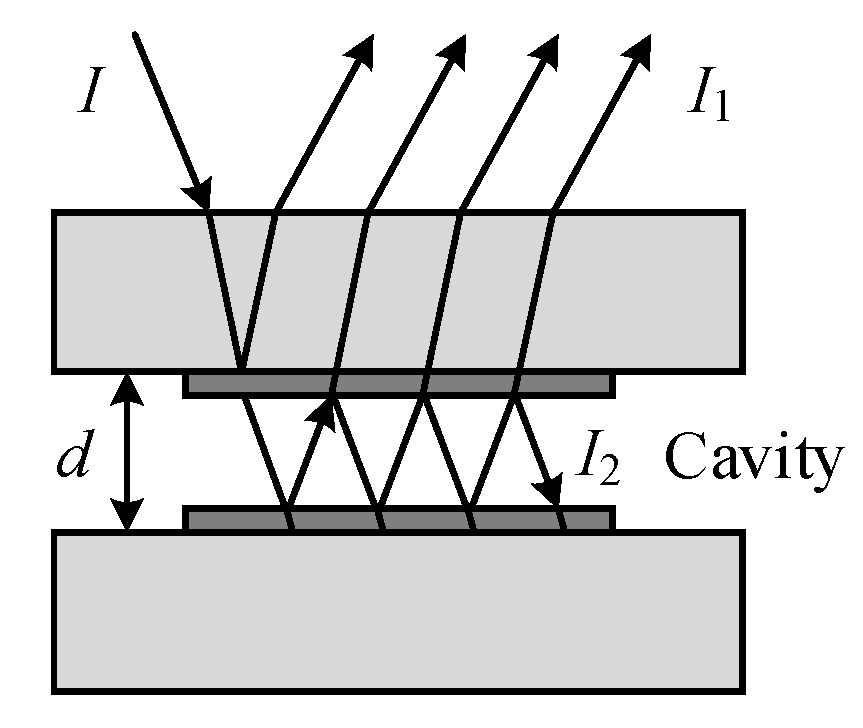
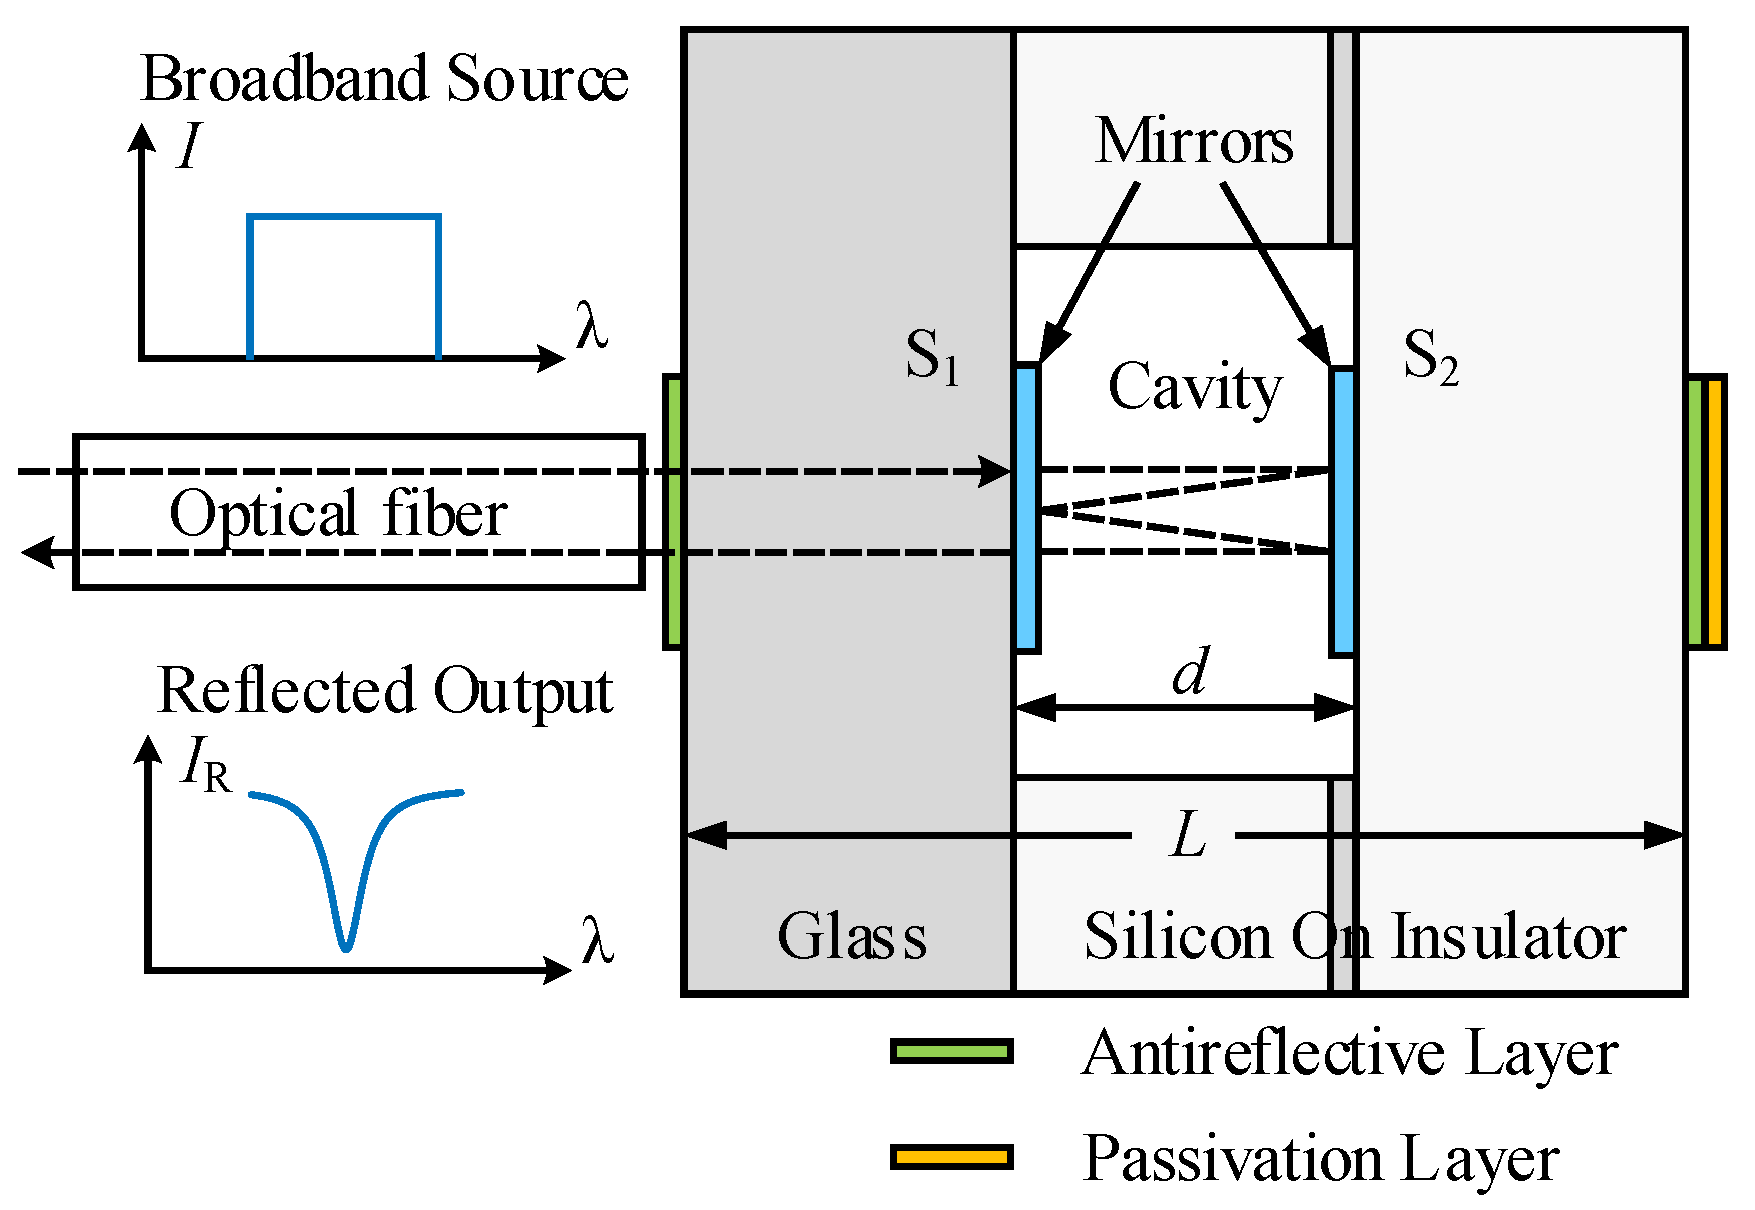
2. Principle of Operating

The interference device comprises two mutually parallel planes of high reflectivity, the distance between the two planes being d. As illustrated in Figure 1, when the incident light beam of the external broadband light source is traveling along the fiber core of the optical fiber, multiple reflections are transmitted between the two surfaces of the cavity to form an interference fringe and return to the optical fiber. Based on the theory of FPI, the light intensity of the interference signal is given by [22,29]
I ( λ ) = I 1 ( λ ) + I 2 ( λ ) + I 1 ( λ ) I 2 ( λ ) cos ϕ
where I1(λ) and I2(λ) are the intensities reflected by the two cavity surfaces, and λ is the wavelength of the incident light. The phase difference between the two reflected lights due to the optical path shift is ϕ
ϕ = 2 π λ 2 n d cos θ + φ
where n is the refractive index (RI) of the cavity medium; d is the length of the air cavity; and θ is the angle of incidence, assuming that θ = 0. φ is the initial phase of the interference; when light passes through different mediums, it represents the phase shift introduced by the material, which can be ignored.
Assuming that the two sheets have the same amplitude reflectivity (r1 = r2 = r) and that the plane has no absorption and no loss, the intensity of the transmitted light interference IT and the intensity of the reflected light interference IR are [29], respectively,
I R I = K sin 2 ( ϕ / 2 ) 1 + K sin 2 ( ϕ / 2 ) ,   I T I = 1 1 + K sin 2 ( ϕ / 2 )
where the coefficient of finesse K is given by K = 4 R / ( 1 R ) 2 and reflectance R is given R = | r | 2 .
Free spectral range (FSR) is defined as the wavelength difference with no overlap between continuous interference fringes, and the FSR of the interference fringes of the cavity can be written as
λ F S R = λ 2 2 n d .
The full width of the reflectivity curve at half of the maximum intensity is called the full width half maximum, λ F W H M , which is defined as
λ F W H M λ ( 1 R ) n π R .
Then, the reflectivity fringe finesse F R is defined as the ratio of the free spectral range over λ F W H M , which is defined as
F R = λ F S R λ F W H M π R ( 1 R ) .
When the interference order satisfies M = 2m + 1, m is an integer and the intensity fringe dip appears at the interference spectrum wavelength [14,22].
λ m = 4 n d M
The cavity is an air gap, n = 1. The relationship of cavity length Δ d caused by the axial force and the wavelength shift Δ λ m is as shown in the following equation:
Δ λ m = 4 Δ d 2 m + 1 .

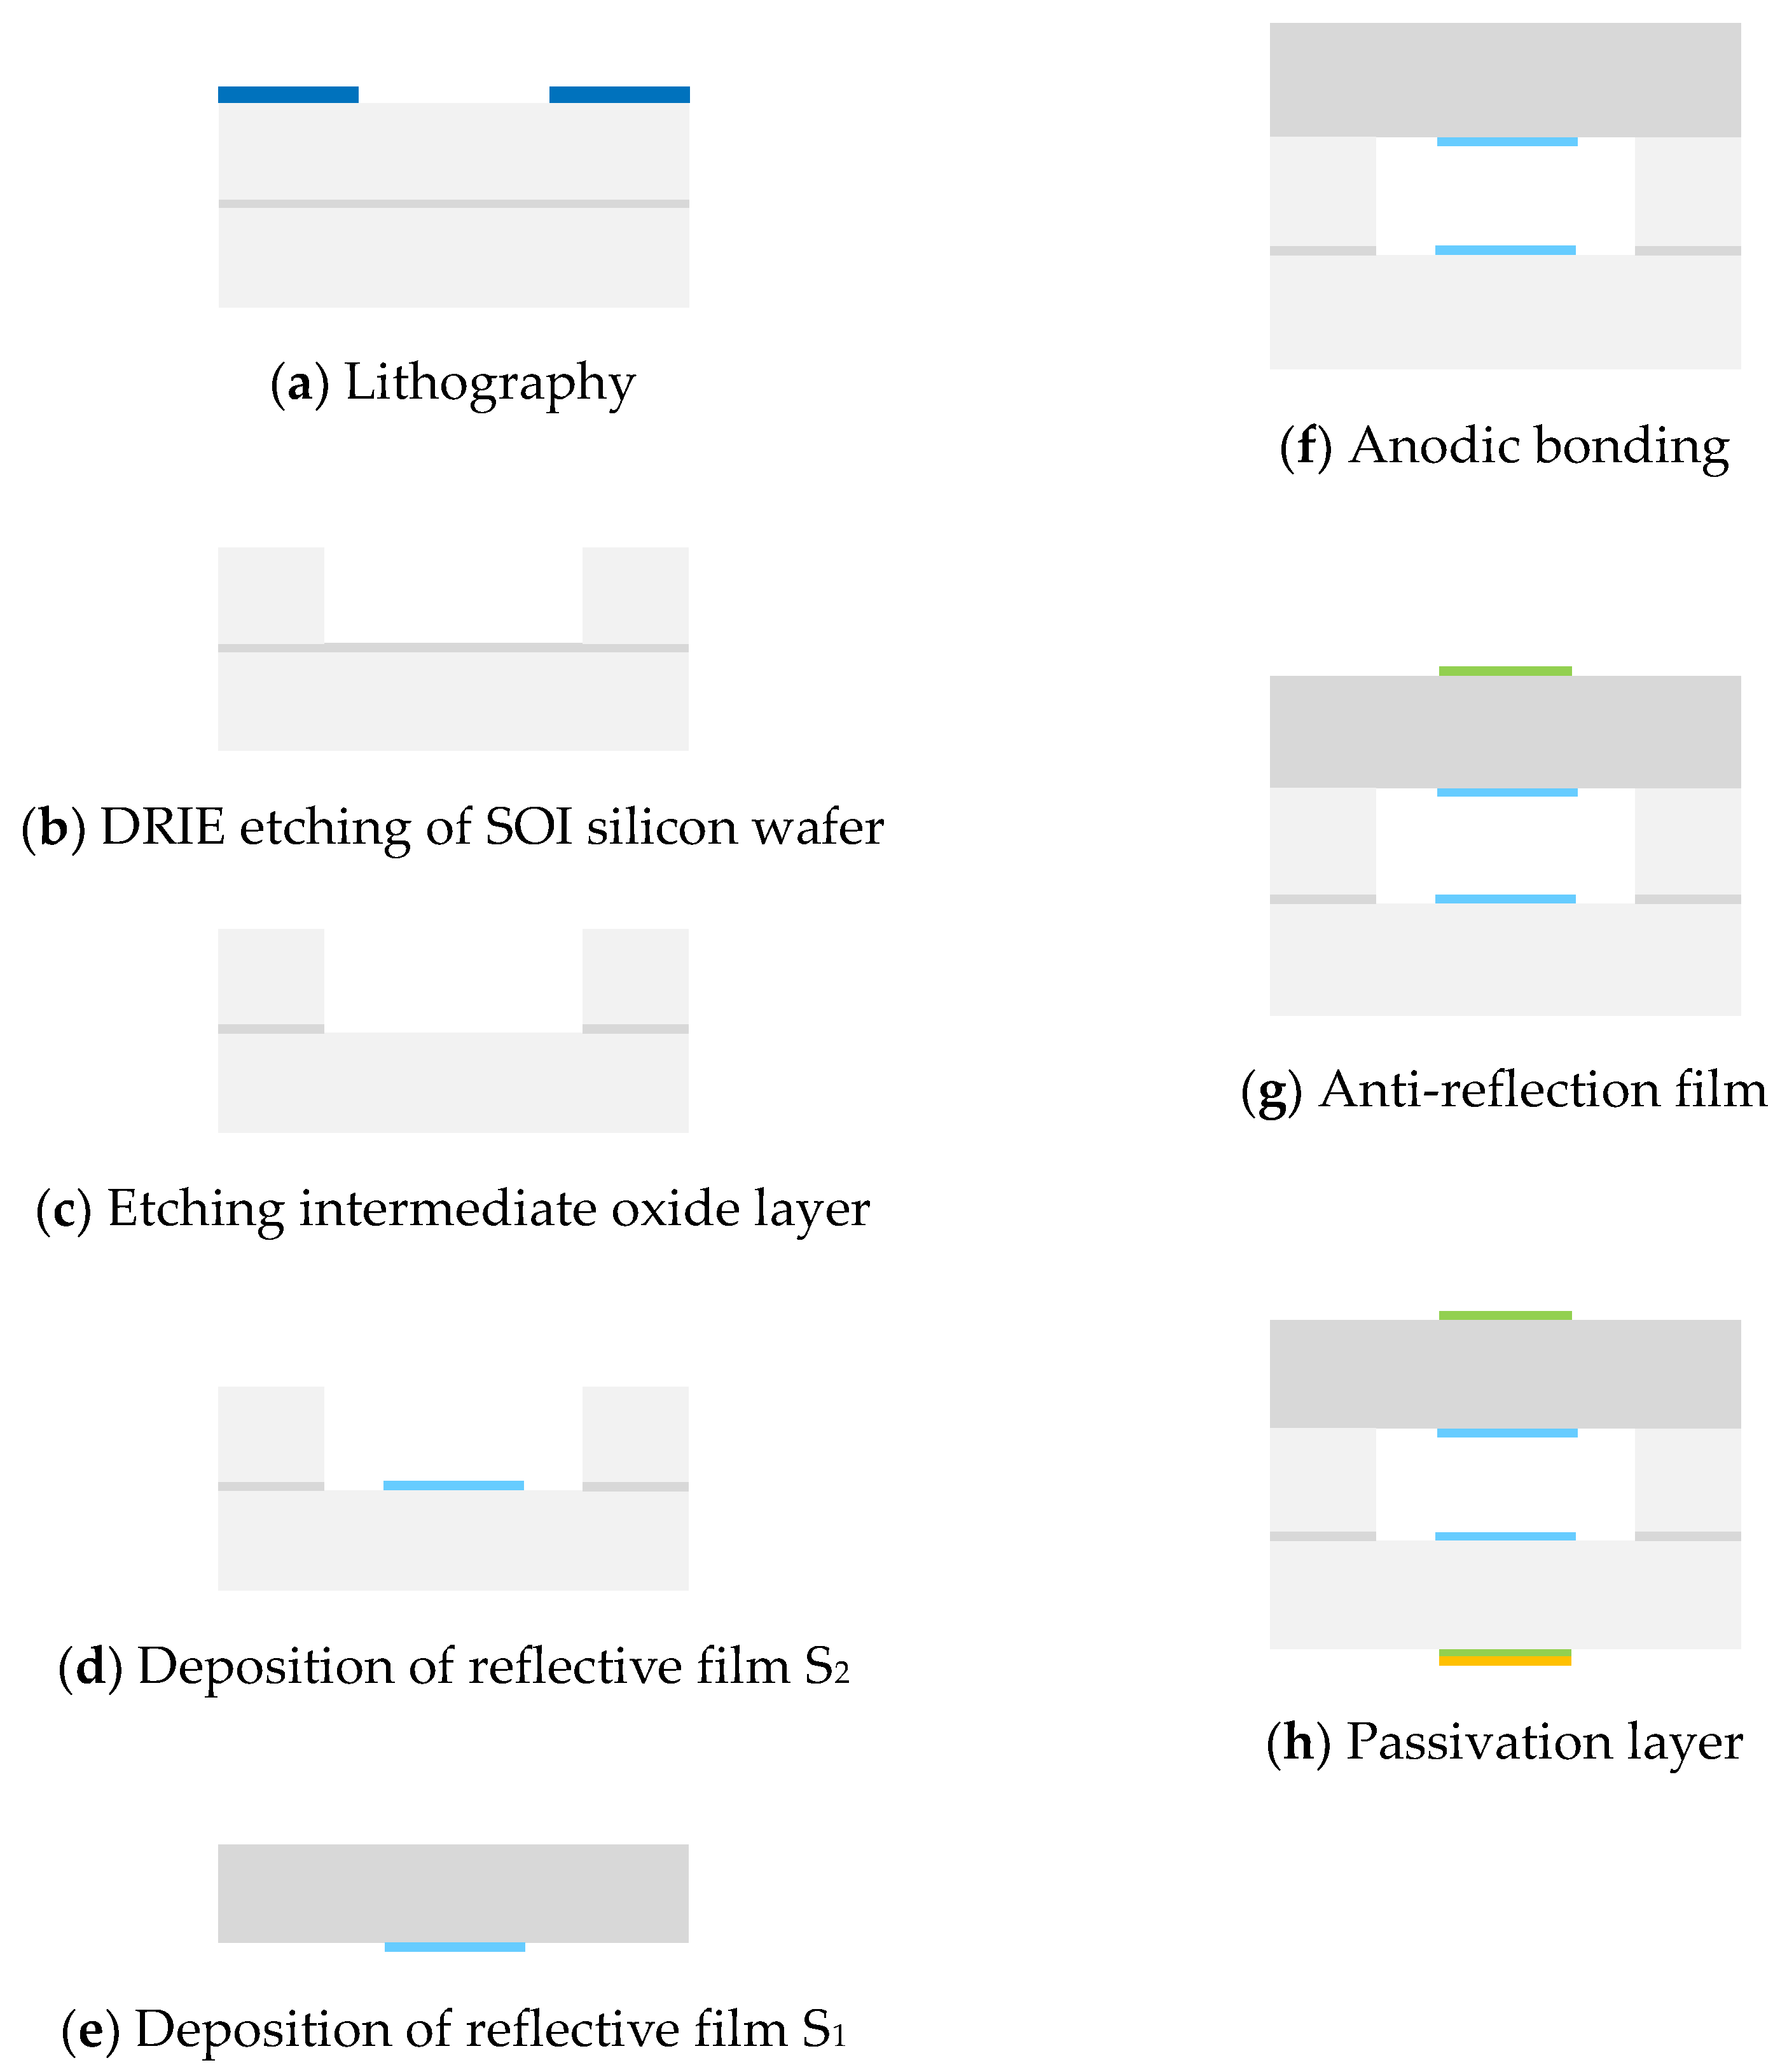
3. Sensor Fabrication

Figure 2 depicts the schematic diagram of configuration of the extrinsic fiber FP strain sensor in this paper, which is mainly developed through an FP optical interference cavity, fiber collimator support, and fiber collimator. The cavity is composed of two high reflectivity parallel planes that are made by MEMS microprocessing technologies. One plane, S1, is the high reflection film on the right face of the fixed glass, and the other plane, S2, is the left side of the bottom layer of silicon of the SOI (silicon-on-insulator wafers) strain beam. The strain beam is bonded on the fixed glass by the silicon–glass anode bonding. Then, an anti-reflection coating is deposited on the face of the fixed glass that is not bonded, and an anti-reflection layer and a passivation layer are deposited on the other surface of the SOI strain beam to reduce the reflected light and weaken the error signal. When the coherent beam is incident into the optical interference cavity along the collimated beam expanding fiber, the incident light beam is reflected multiple times between the S1 and S2 planes to form multiple-beam interference, and it returns to the collimated beam, expanding the fiber along the original path. The interference output signal is related to the length of the microcavity between the S1 and S2 planes.
The manufacturing process of wafers is illustrated in Figure 3. (1) The first step is to carry out the SOI wafer used as the silicon strain beam with a buried silicon dioxide layer, in which lithography was performed on the top side of the silicon wafer (Figure 3a). (2) Then, the SOI wafer is etched via deep reactive ion etching (DRIE) until the buried silicon dioxide layer emerged as shown in Figure 3b to form a cylindrical hole. (3) The intermediate oxide layer exposed in wafer is removed by wet etching or dry etching to obtain a hole on the intermediate oxide layer (Figure 3c). (4) A high reflective film S2 patterned by lift-off method is deposited on the silicon wafer by physical vapor deposition (Figure 3d). (5) The same technique is used to deposit another high reflection film S1 (Figure 3e) on the top of the fixed glass, and the high reflection film image processing is completed. (6) The SOI silicon wafers obtained in steps (1)–(4) are bonded to the glass obtained in step (5) by silicon–glass anode bonding (Figure 3f). (7) The anti-reflection film is deposited on the top face of the bonded glass; an anti-reflection coating and a passivation layer are successively deposited on the lower face of the silicon strain beam, and the anti-reflection coating and the passivation layer are all patterned by lift-off method (Figure 3g,h). Finally, the strain-sensitive probe is fabricated, an optical fiber is then bonded with the sensor chip to form the fiber-optical F-P sensor, as depicted in Figure 3.
The measuring gauge length of the packaged sensor is L. It will increase or decrease when the sensor is subjected to external strain, which will result in variation of the length of the microcavity between the two planes. Furthermore, the optical signal intensity, wavelength, or phase corresponding to the cavity length will also shift. By using demodulation technology [30], the spectral change of light is converted into a digital signal that can be recorded by a computer, and the sensor can accurately measure the external physical quantities through precision calibration. According to the principle of elasticity, the measured strain [31] can be calculated as
ε = Δ d L .
The variation of the sensor cavity length ∆d is obtained by measuring the reflected output spectrum. Then, substituting Equation (9) into Equation (5), the wavelength shift due to strain change is given by
Δ λ = 4 Δ d 2 m + 1 = 4 L ε 2 m + 1 .
Under different positive and negative strain conditions, the simulated reflection spectrum of the EFFP sensor is shown in Figure 4.
The sensor measurement range and measurement accuracy can be designed by adjusting the thickness of the MEMS optical reflective micromirrors (silicon) diaphragm. The cavity length of the FP is 31.2 um, and the reflectivity fringe finesse FR = 10. Considering that the bandwidth of the light source in the signal demodulation device is limited to 80 nm (the wavelength range of a flattened broadband source is usually C + L, while the bandwidth in the experiment is 1510–1590 nm), at least one interference level can be found to satisfy the strain detection requirement (the strain corresponding to the load of the tested structure); that is, the wavelength variation range is within the detection band. Thus, using Equations (8) and (10), it is well known that the integer m should satisfy the following formula:
λ 2 m + 1 + 4 L ε max 2 m + 1 80 nm ( 1510 nm ~ 1590 nm )
In fact, since the sensor is connected to the structure through the welding layer, the stretching or compression of the tested structure results in the transfer of strain from the structure to the sensor. Therefore, there is a strain transfer coefficient between the strain measured by the sensor and the actual strain of the tested structure, which is determined by the welding layer. After the sensor is bonded to the tested structure, the strain transfer coefficient is constant, and it can be defined by the following formula [32]:
η = ε ε s
where ε s represents the strain of the tested structure.
The area and elastic modulus of the structure are A and Es, respectively. With the basic small deformation assumption of material mechanics [31], the relationship between the strain of sensor and applied load of the tested structure is
ε s = F E s A .
For a fiber Bragg grating (FBG) sensor, the elastic deformation with axial force and the photoelastic effect of the optical fiber are the main factors for its strain sensitivity. Meanwhile, for temperature sensitivity, both the thermo-optical effect and the thermal expansion effect of the material have to be considered. Its wavelength shift with strain and temperature changes can be written as Equation (14) [33]. The interference fringes of the EFFP sensor also shift with strain and temperature variation. Due to the thermal expansion effect of the cavity material, a linear relationship between the optical path difference and temperature variation can be obtained. The equation can be written as
Δ λ B = K 11 Δ ε + K 12 Δ T Δ λ F P = K 21 Δ ε + K 22 Δ T
where K11 and K12 represent the temperature and strain sensitivity coefficients of FBG, respectively; and K21 and K22 are expressed as the sensitivity coefficients of temperature and strain for the EFFP sensor, respectively.
The influences of temperature and strain on the fiber Bragg grating and the EFFP sensor are independent. Assuming that the FBG is only affected by temperature, the temperature coefficient is 10.3 pm/°C, with the wavelength of the FBG being 1539.97 nm. The temperature calibration coefficient of the EFFP sensor is 15 pm/°C. Therefore, the strain measurement data from the EFFP sensor can be obtained from the above equations with the temperature decoupling.

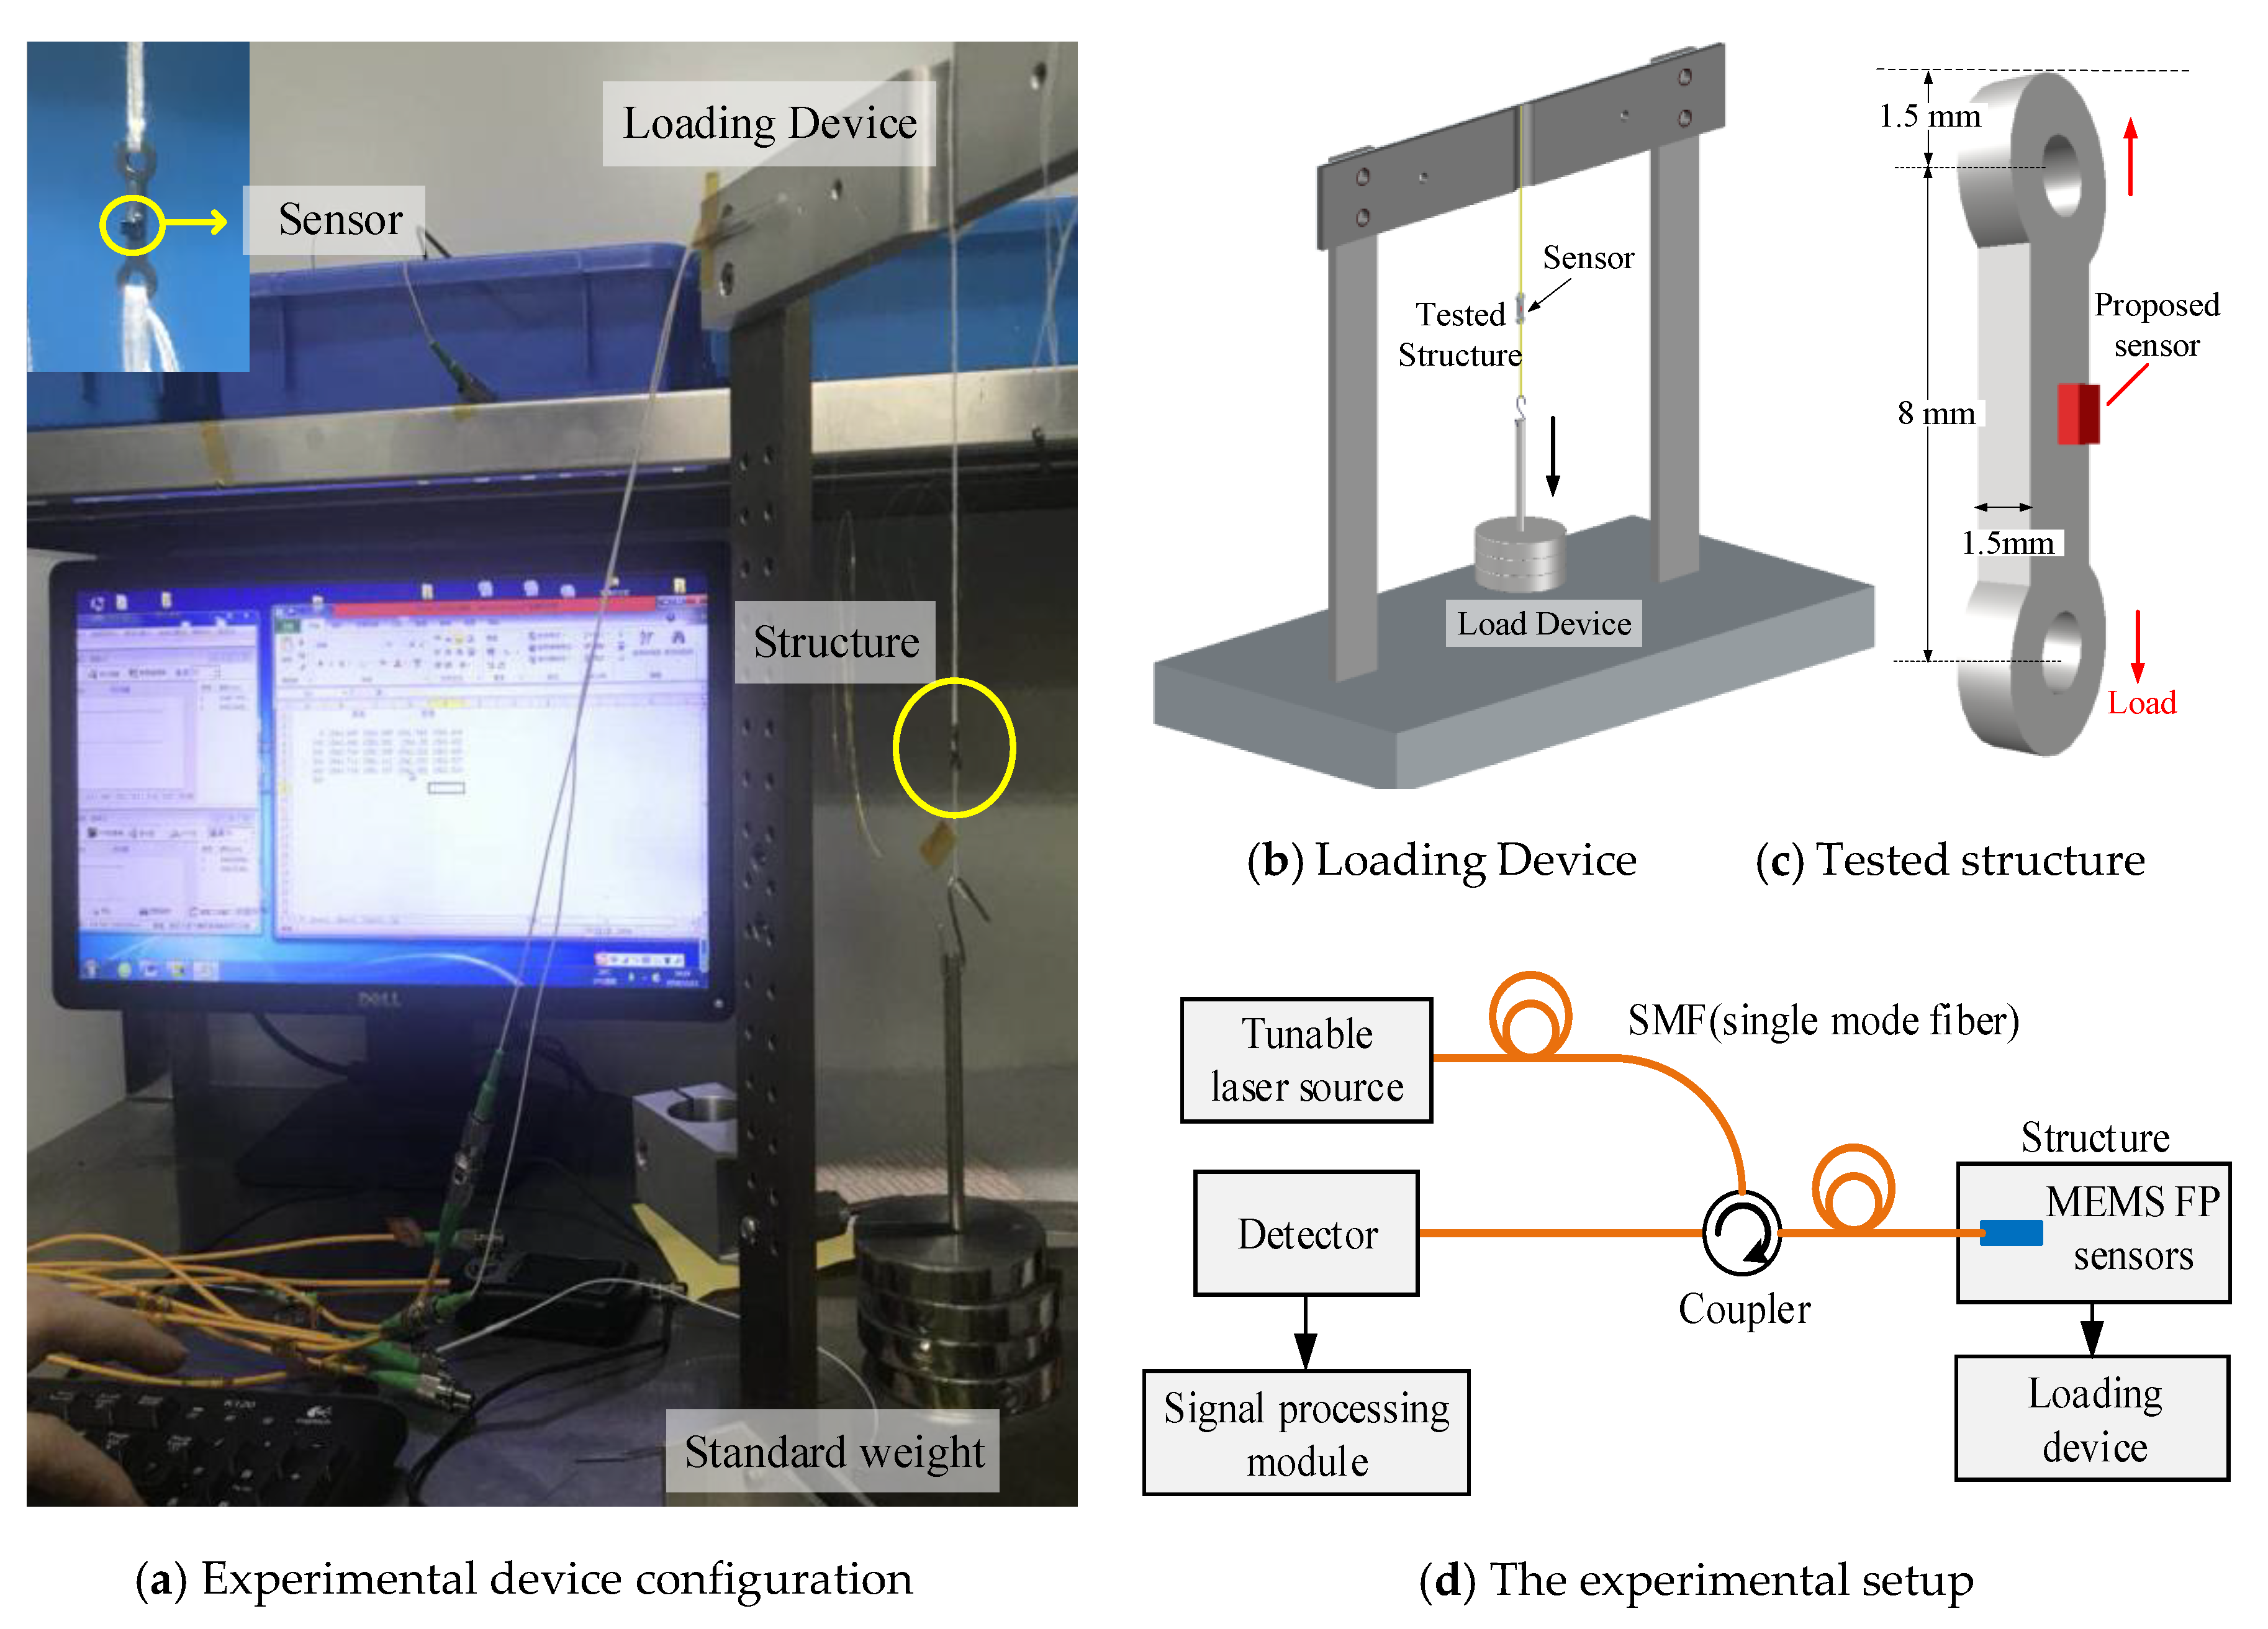
4. Experimental Setup and Discussion

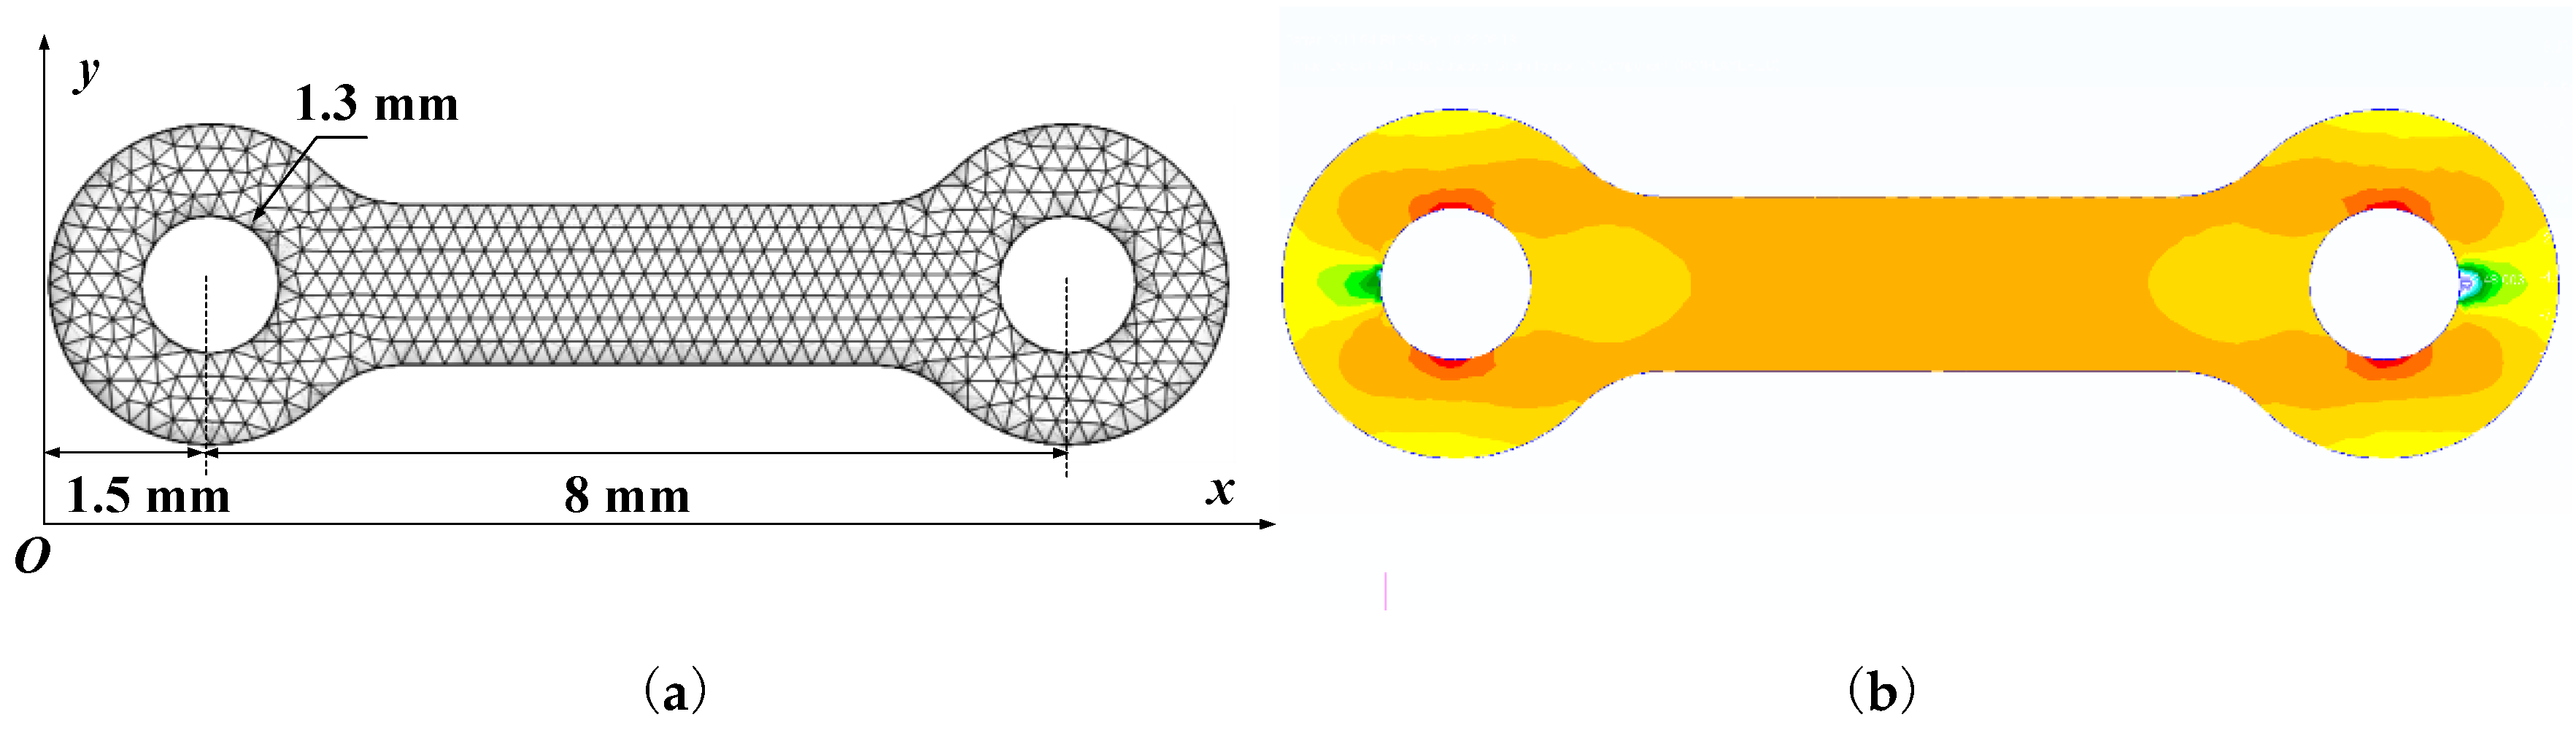
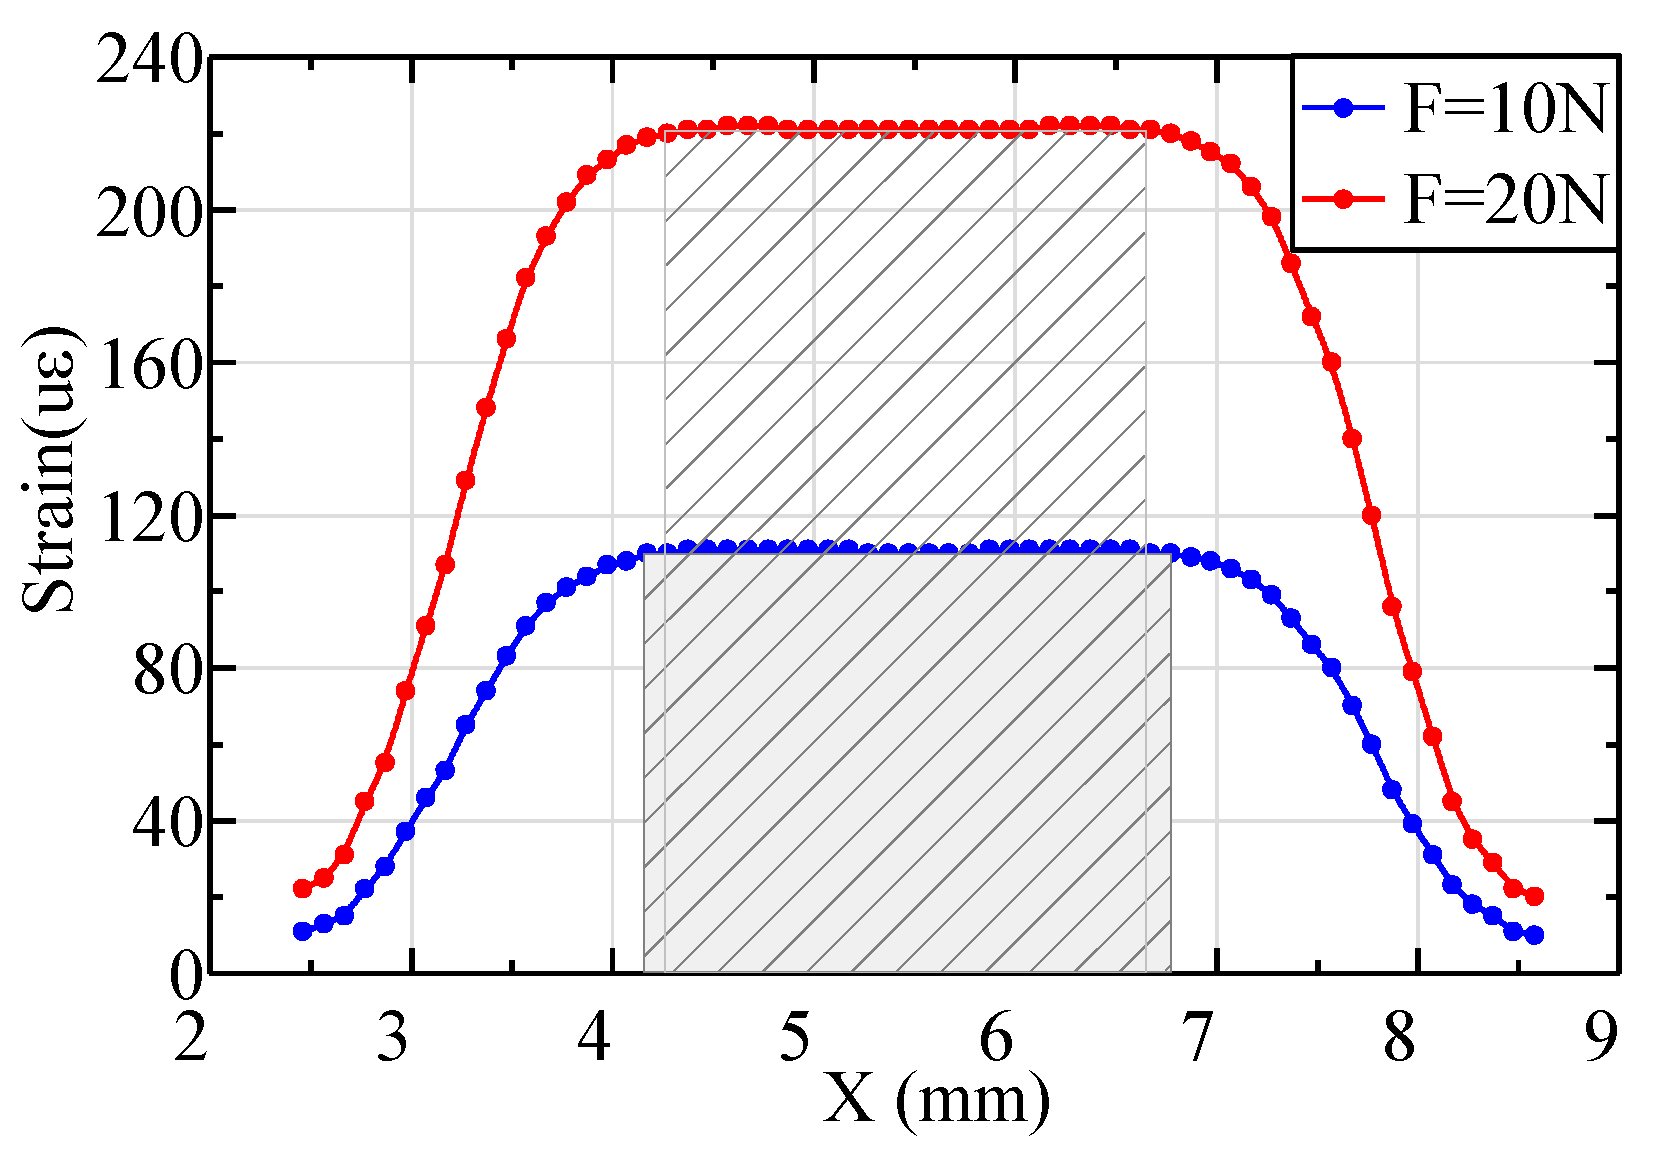
4.1. Sensor Placement

The material of the small tested structure is titanium alloy, and its properties are shown in Table 1. Finite element simulation should be carried out on the structure under different loading conditions to determine the optimal placement position of the sensor. The total length of the structure is 11 mm, and the distance between the two holes of the structure is 8 mm. The external static force range of the small tested structure is 0–10 N, while the maximum transient-state force is 20 N. Due to the small size of the structure, it is necessary to consider the concentrated stress caused by structural through-holes. The geometry characteristics and strain distribution are shown in Figure 5.
As shown in Figure 6, the finite element analysis results can be obtained as follows. (1) When the external load applied on the structure is 10 N, the sensor should located at the position of the structure between 4.173 mm and 6.873 mm in the X axial direction. (2) When the external load applied on the structure increases to 20 N, the axial coordinate range of the uniform strain field is 4.272–6.773 mm. The larger the load, the smaller the range of the uniform strain field.

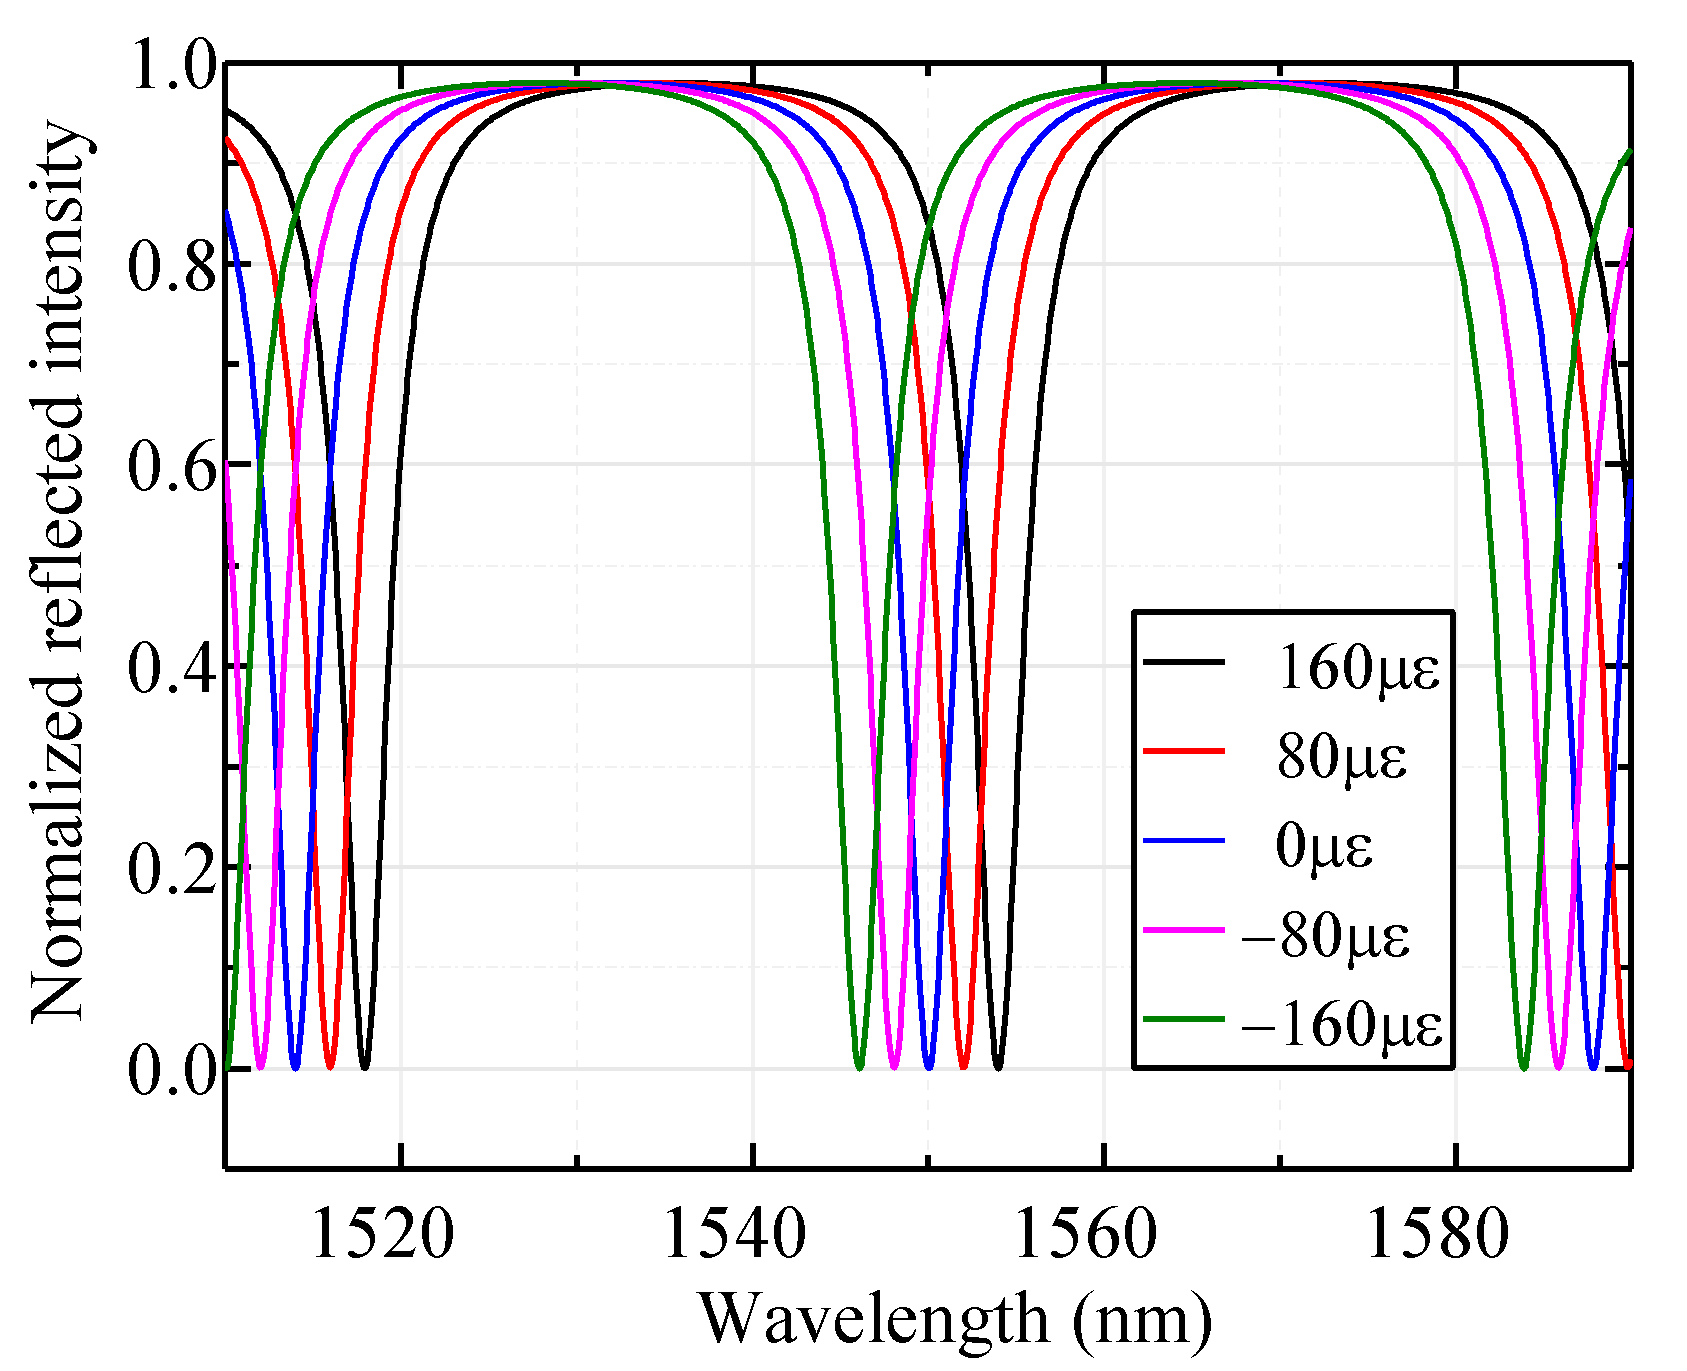
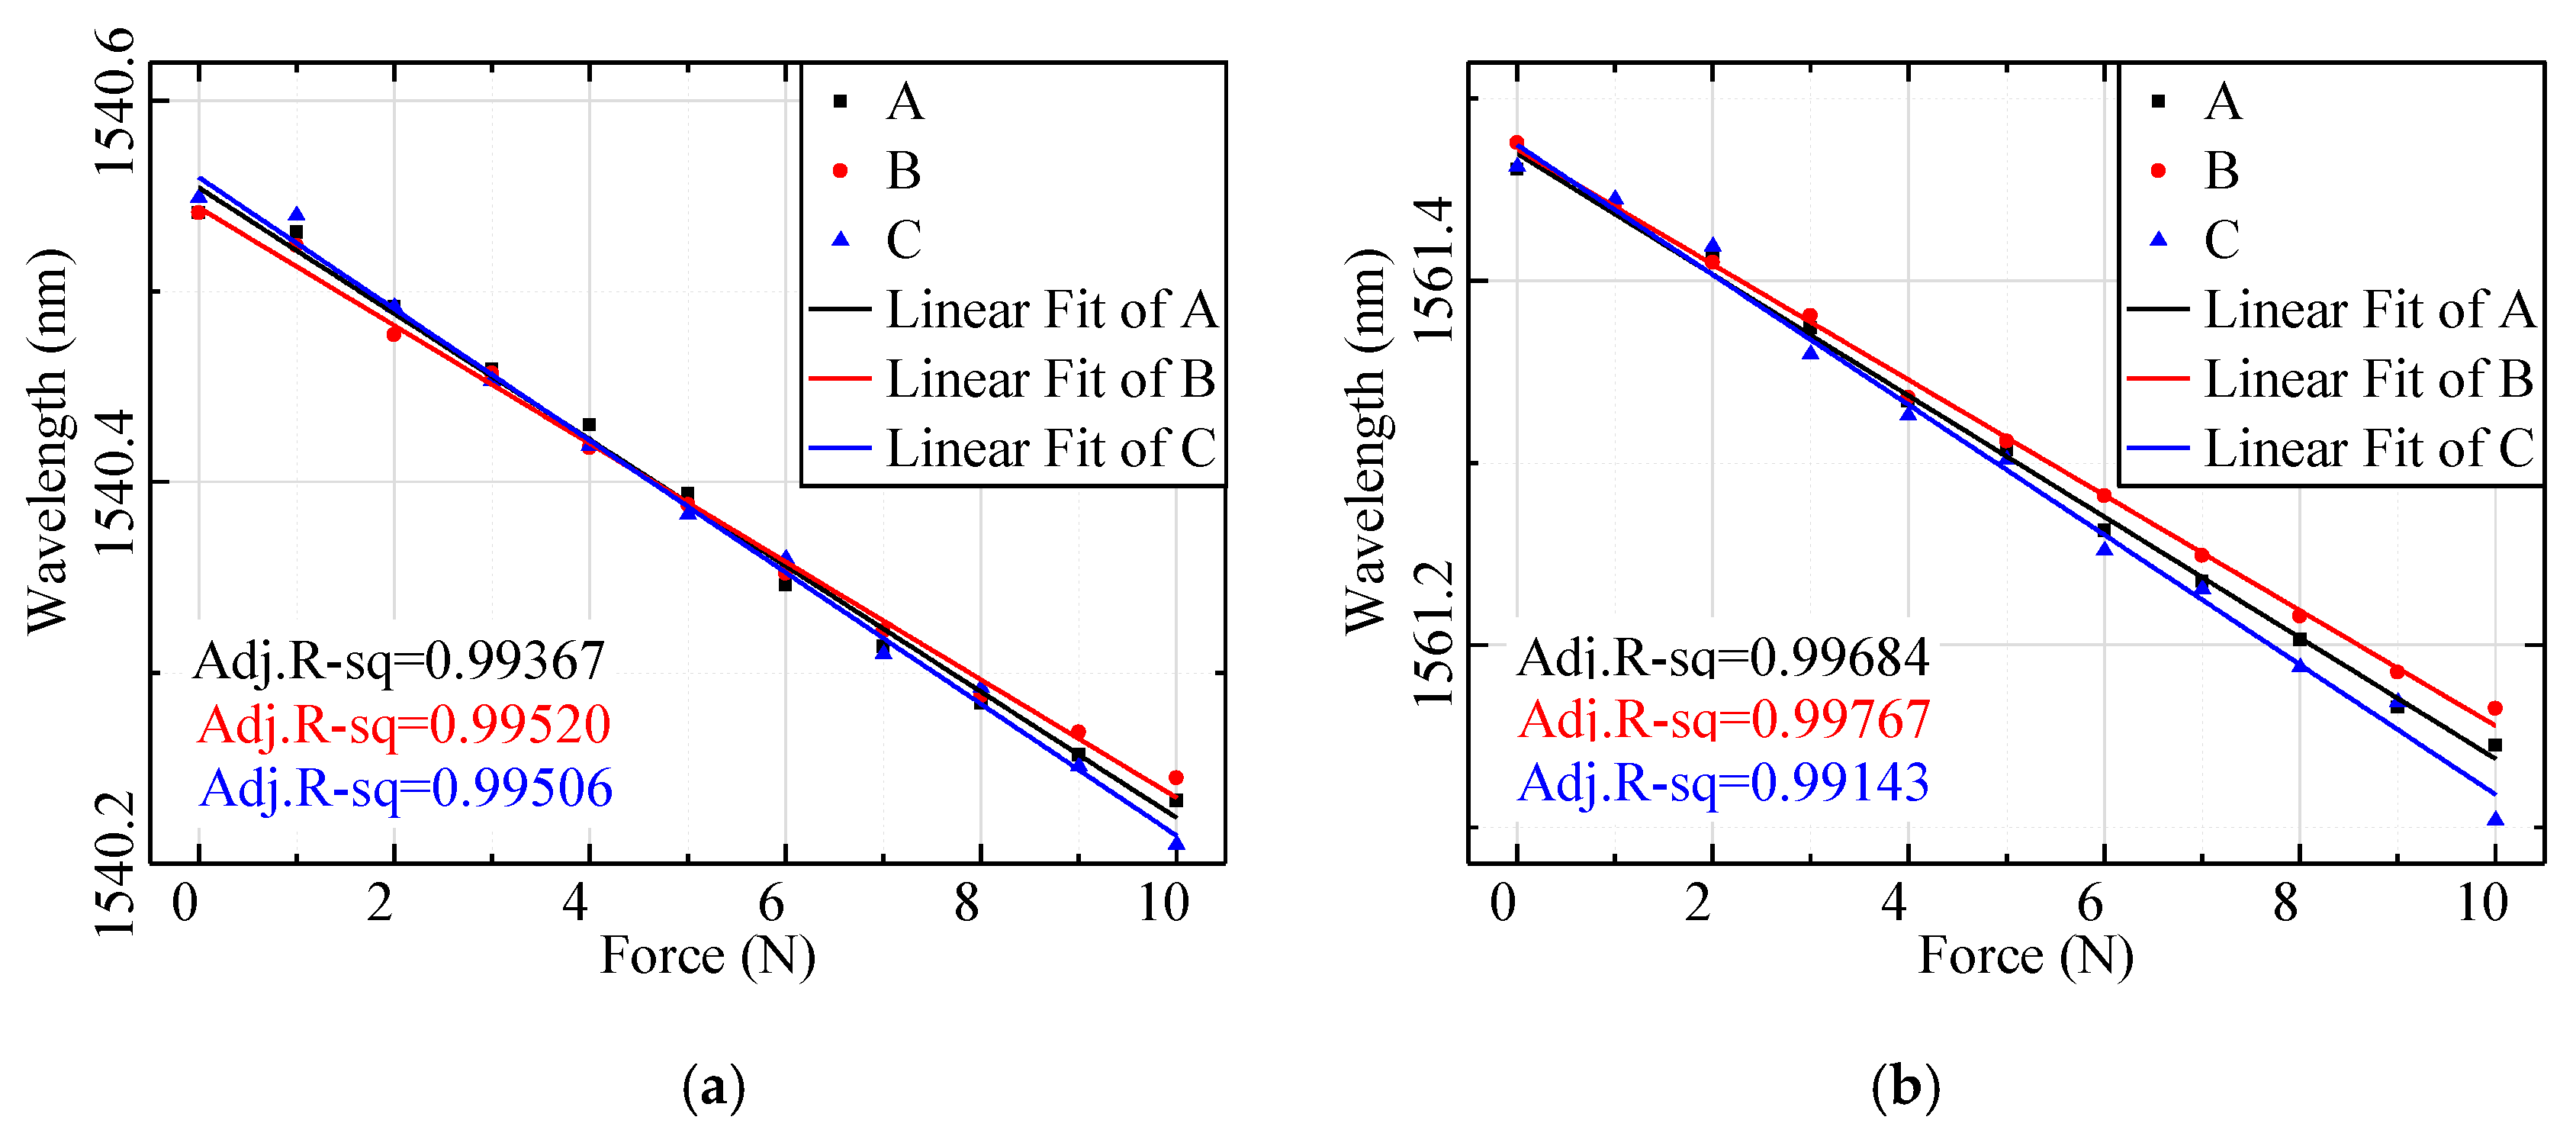
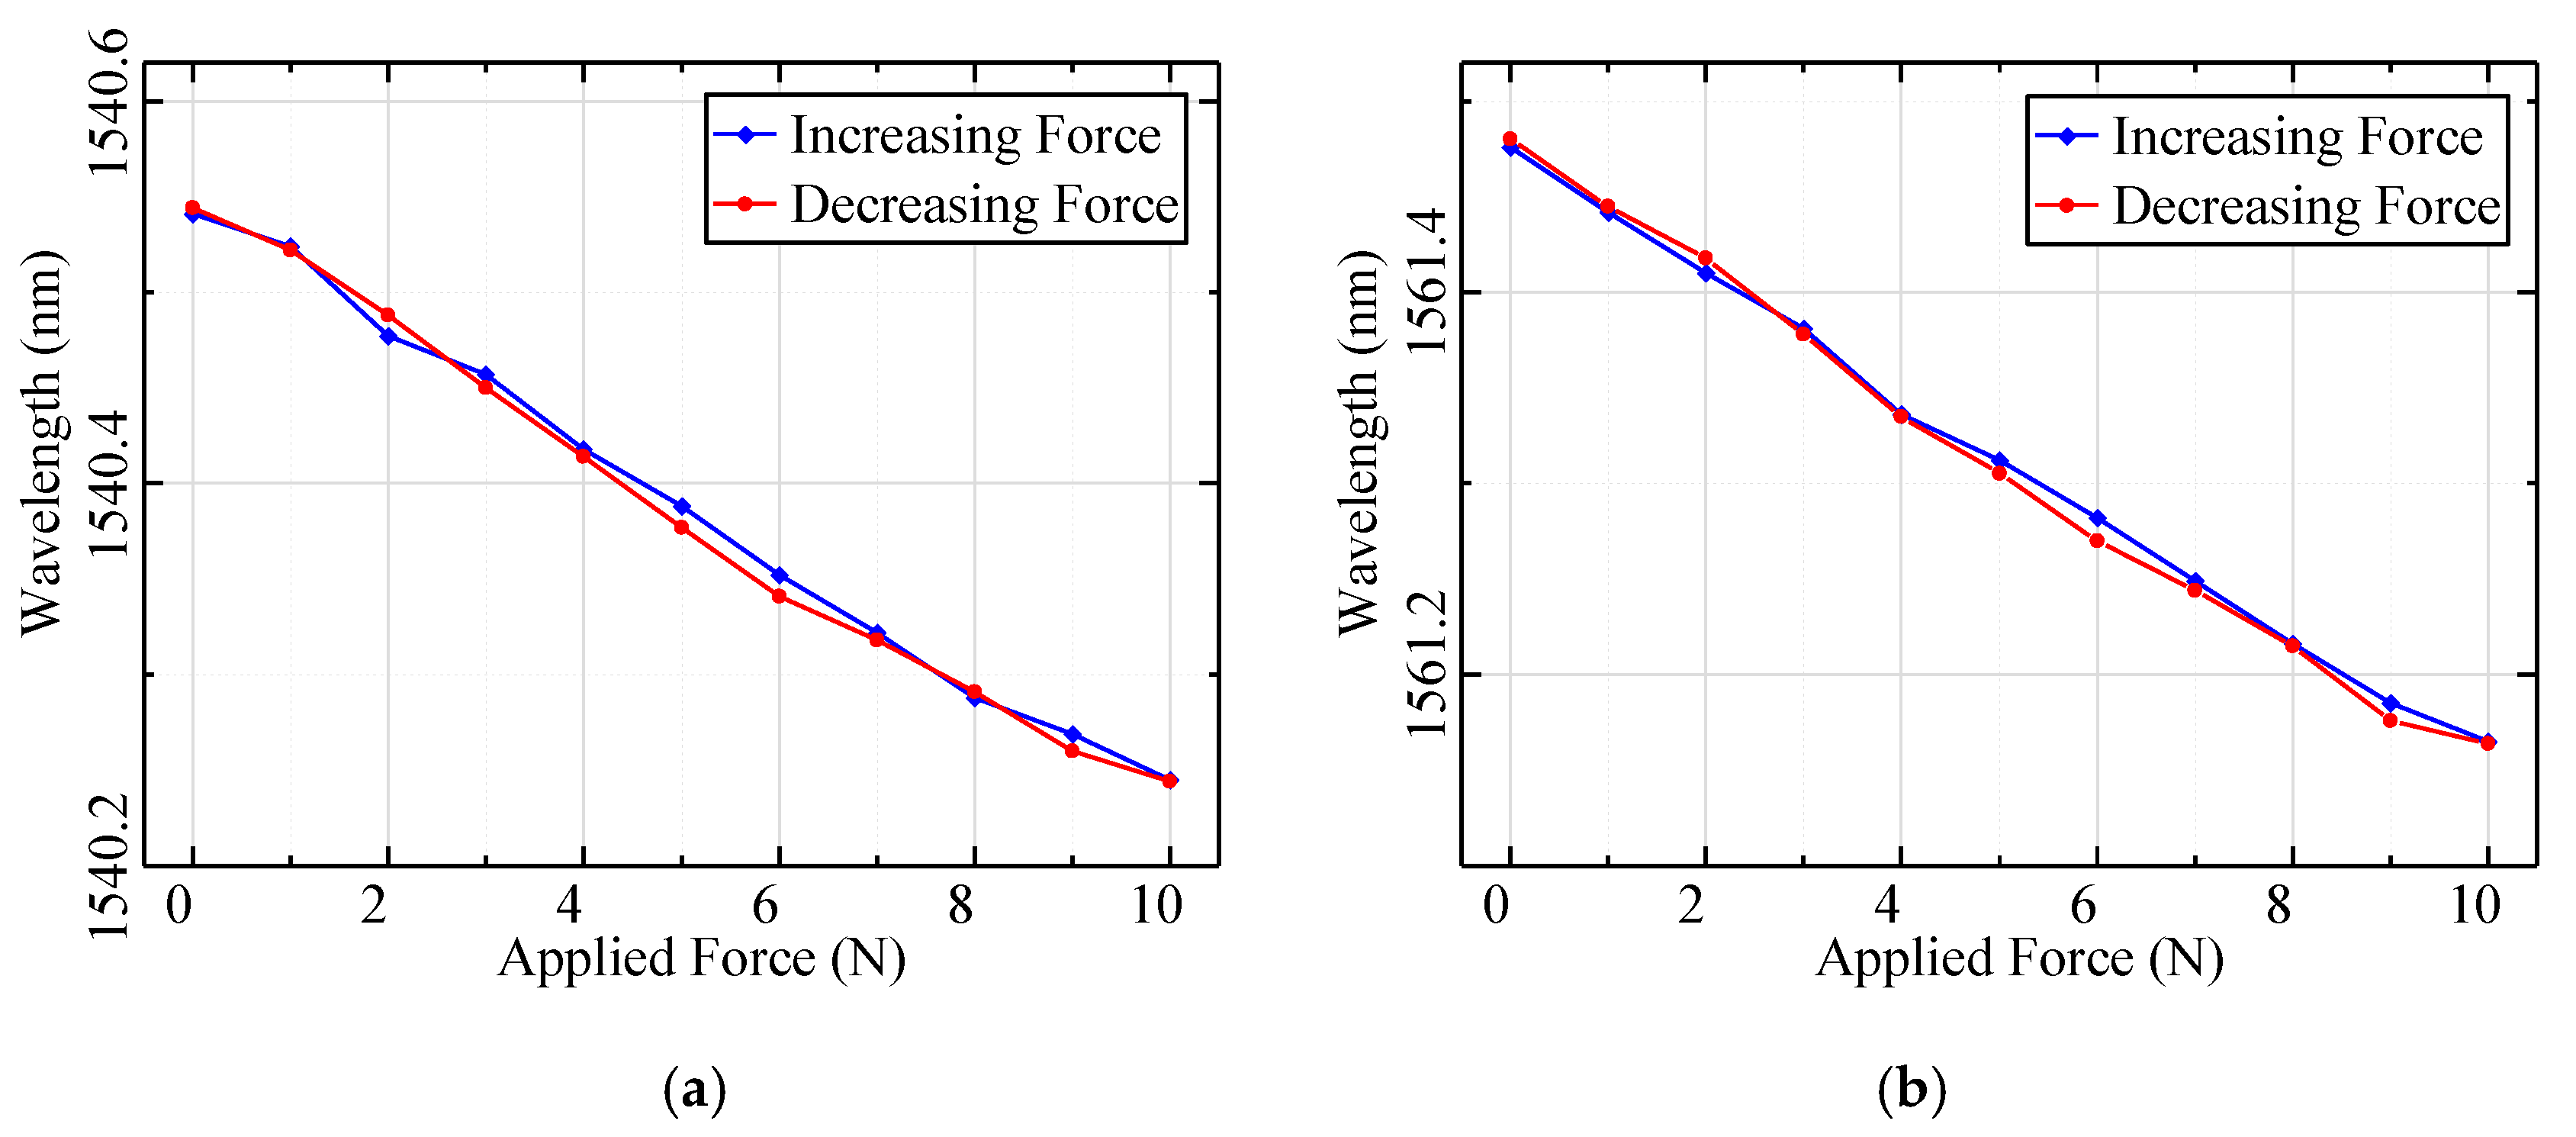
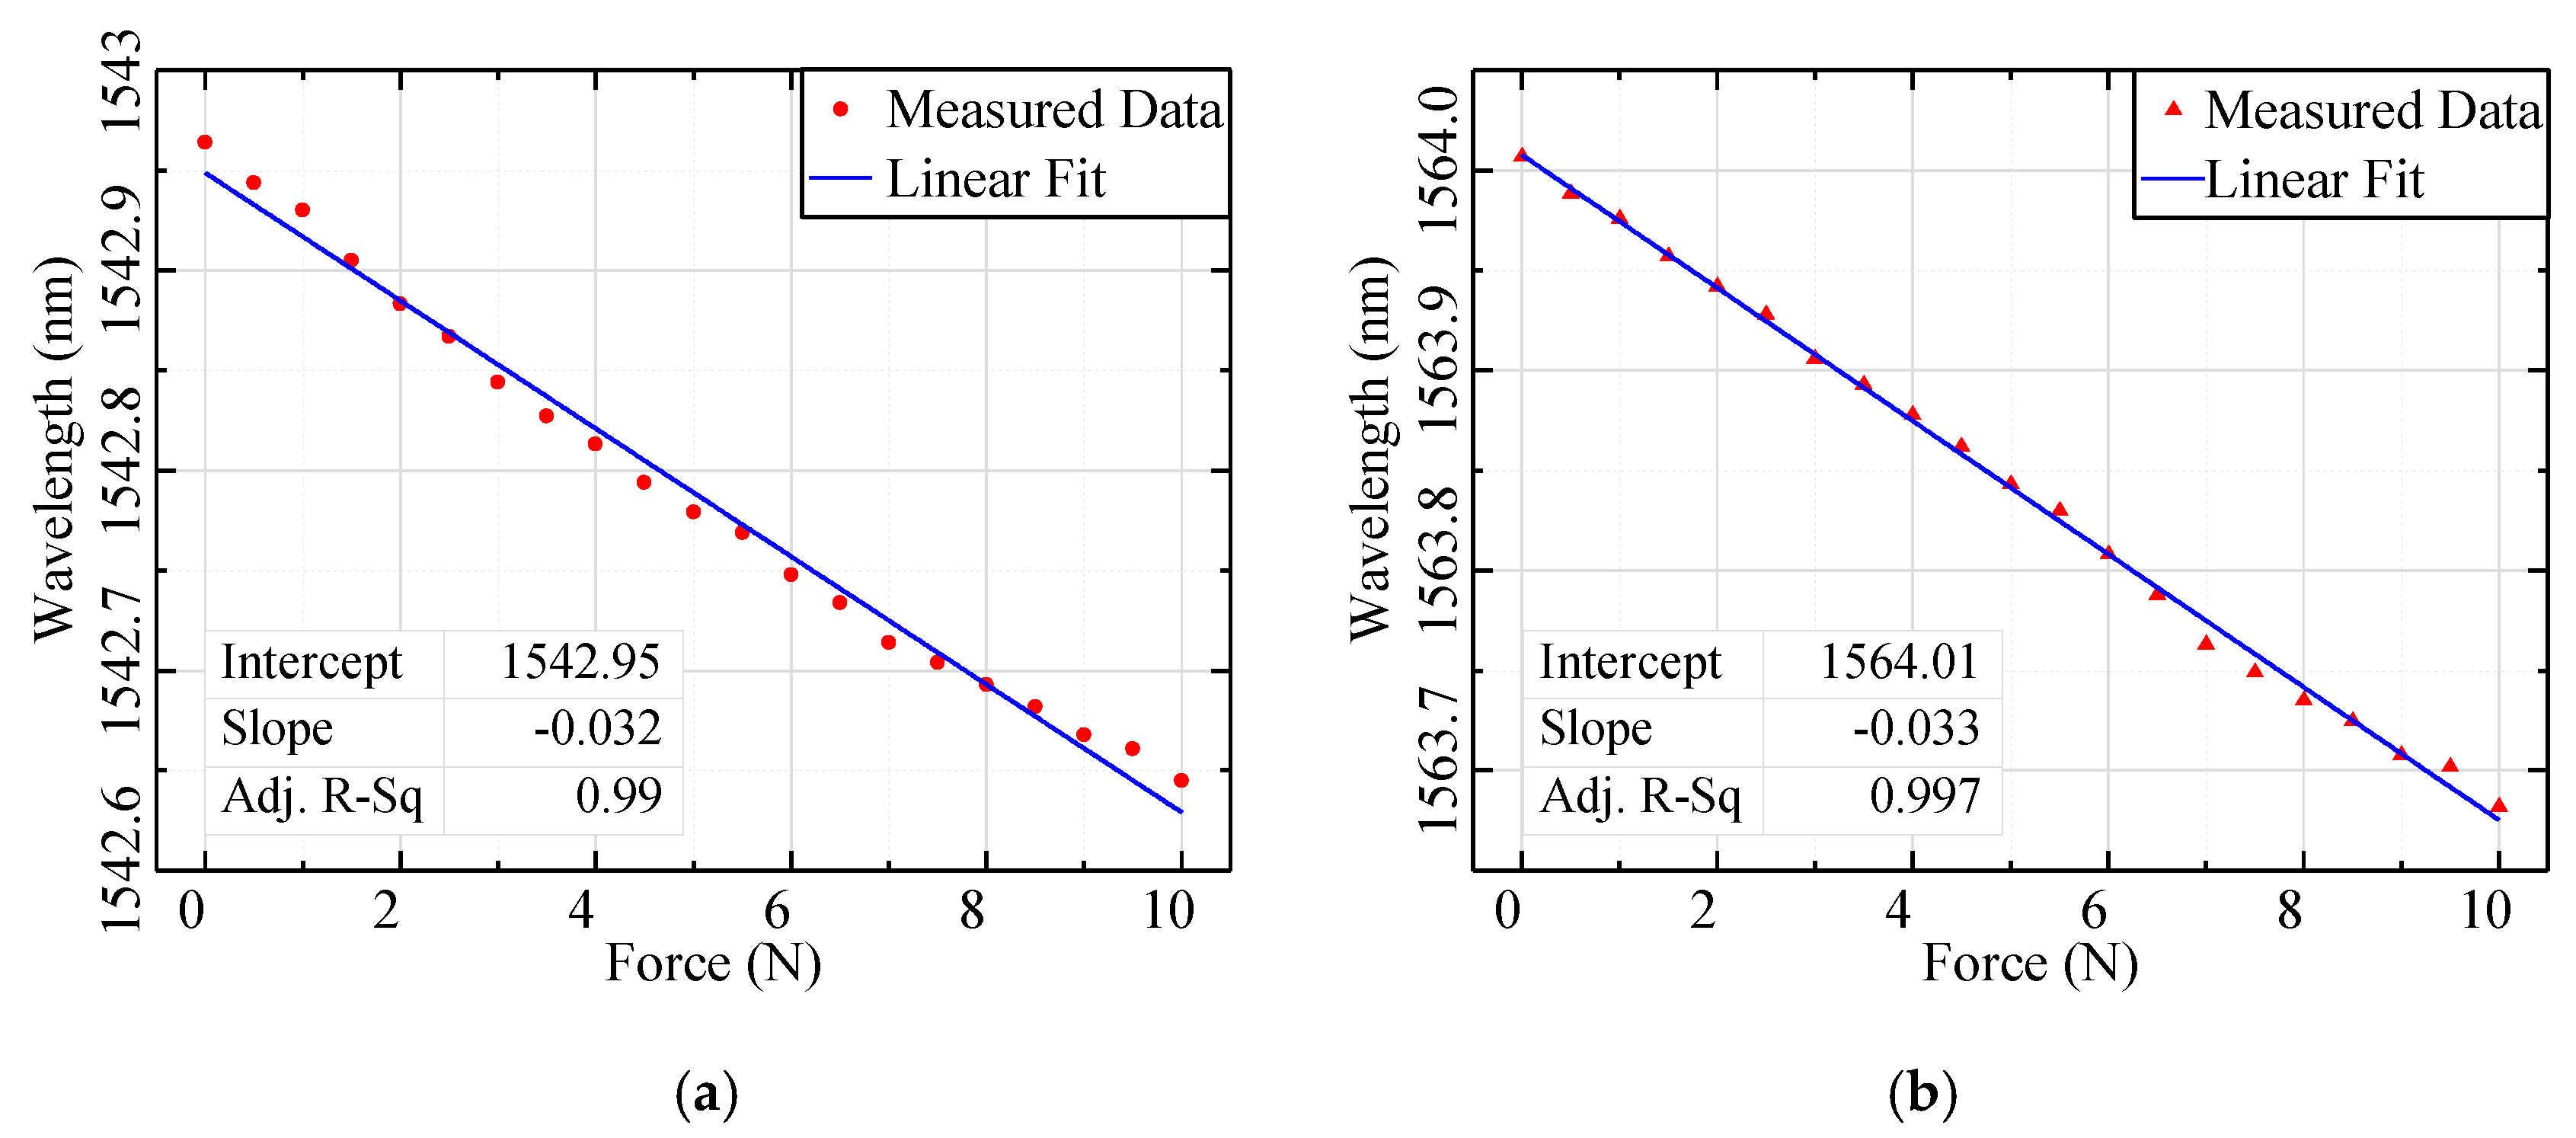
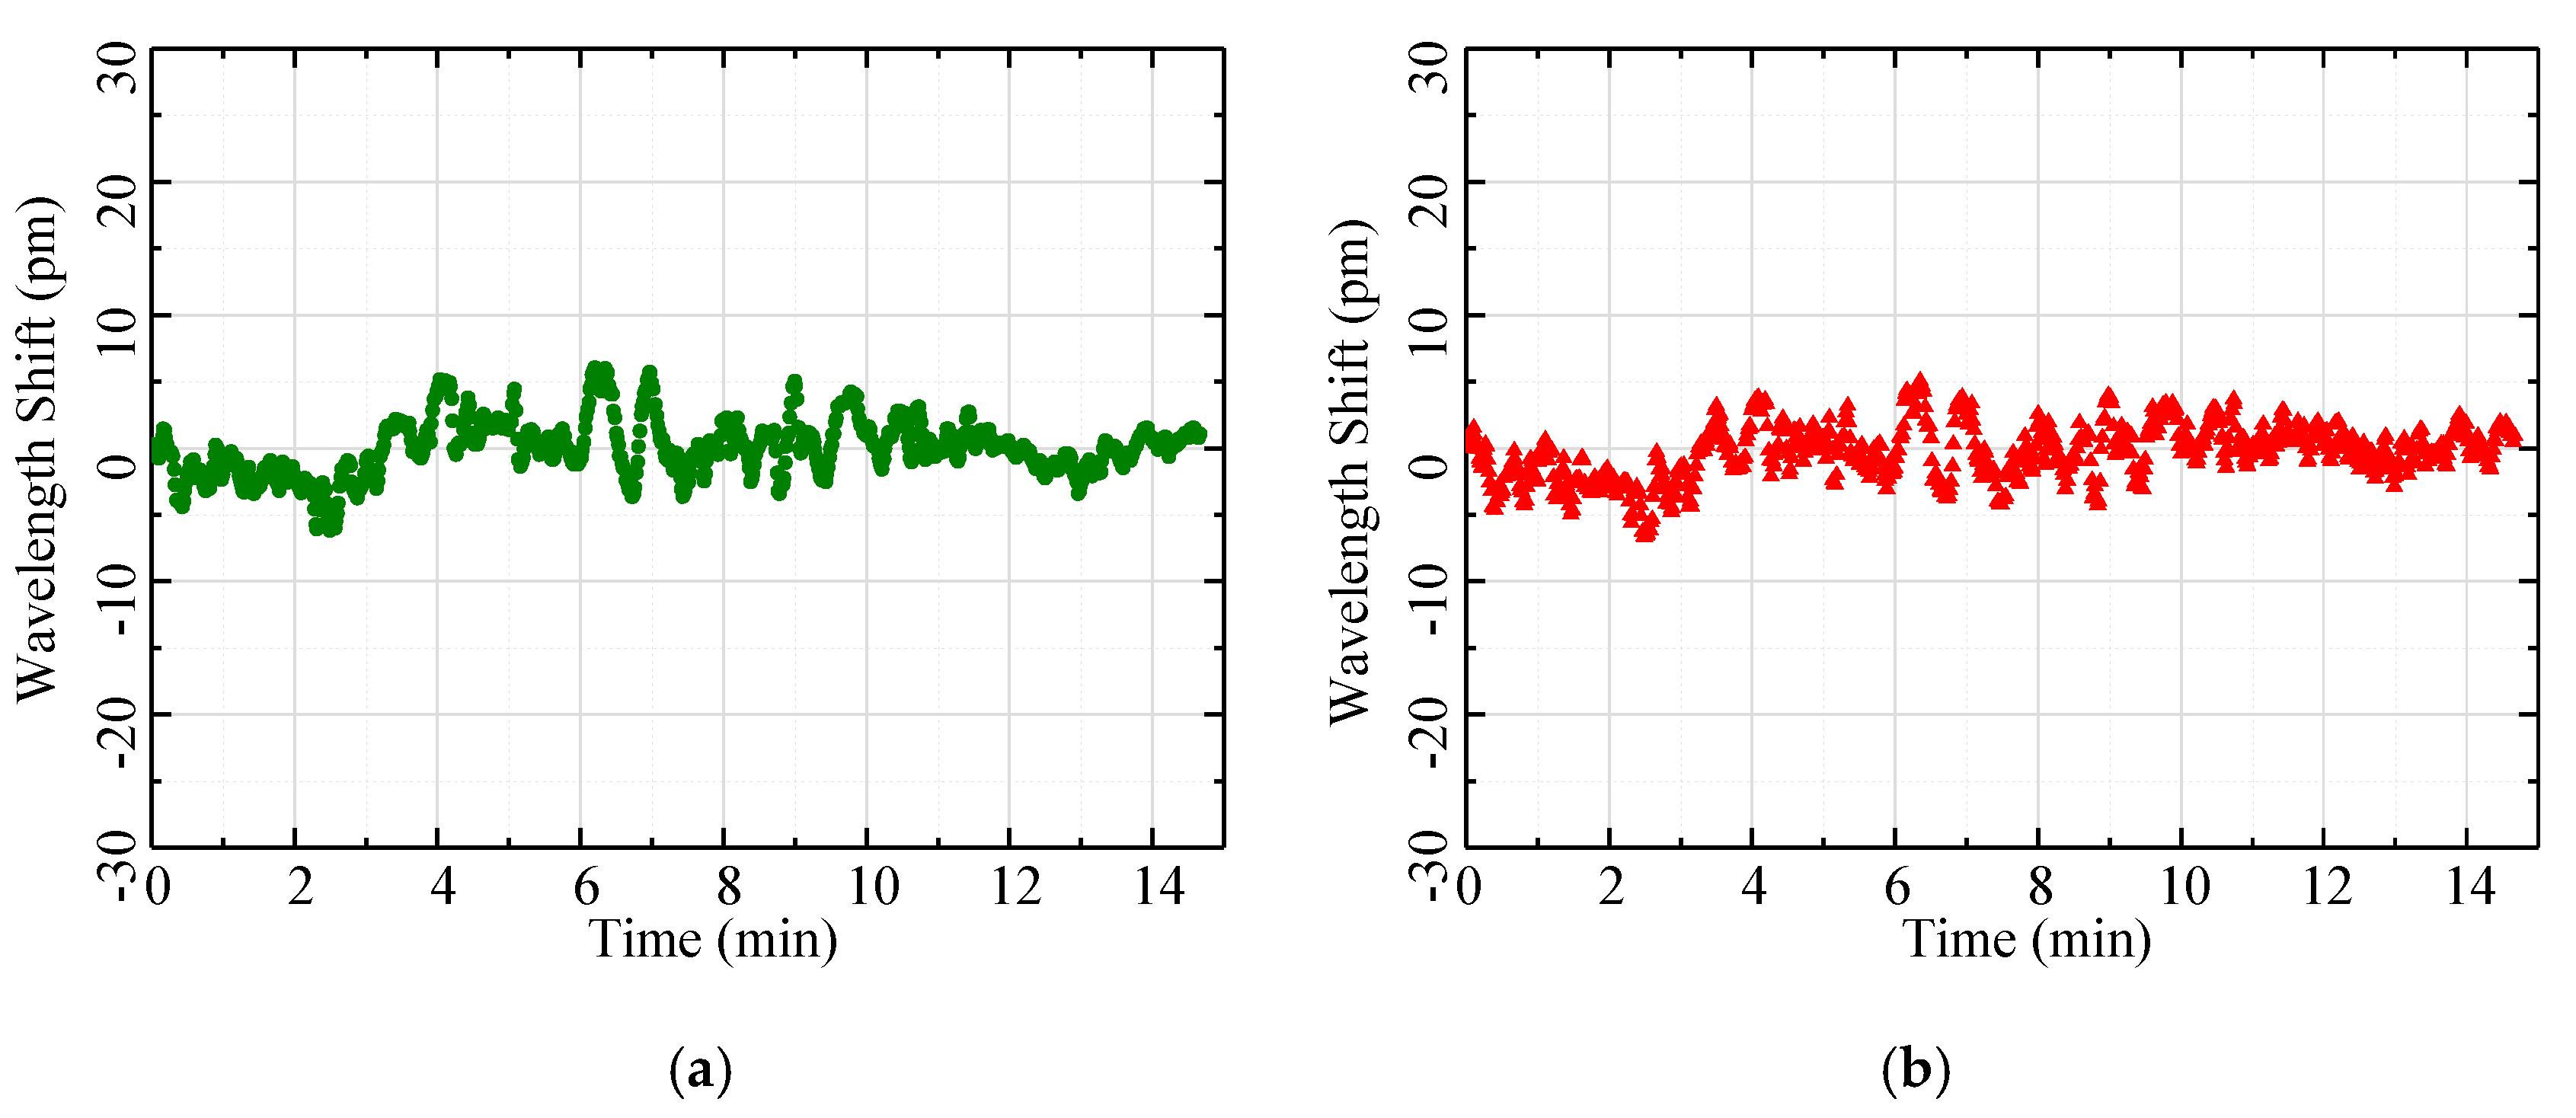
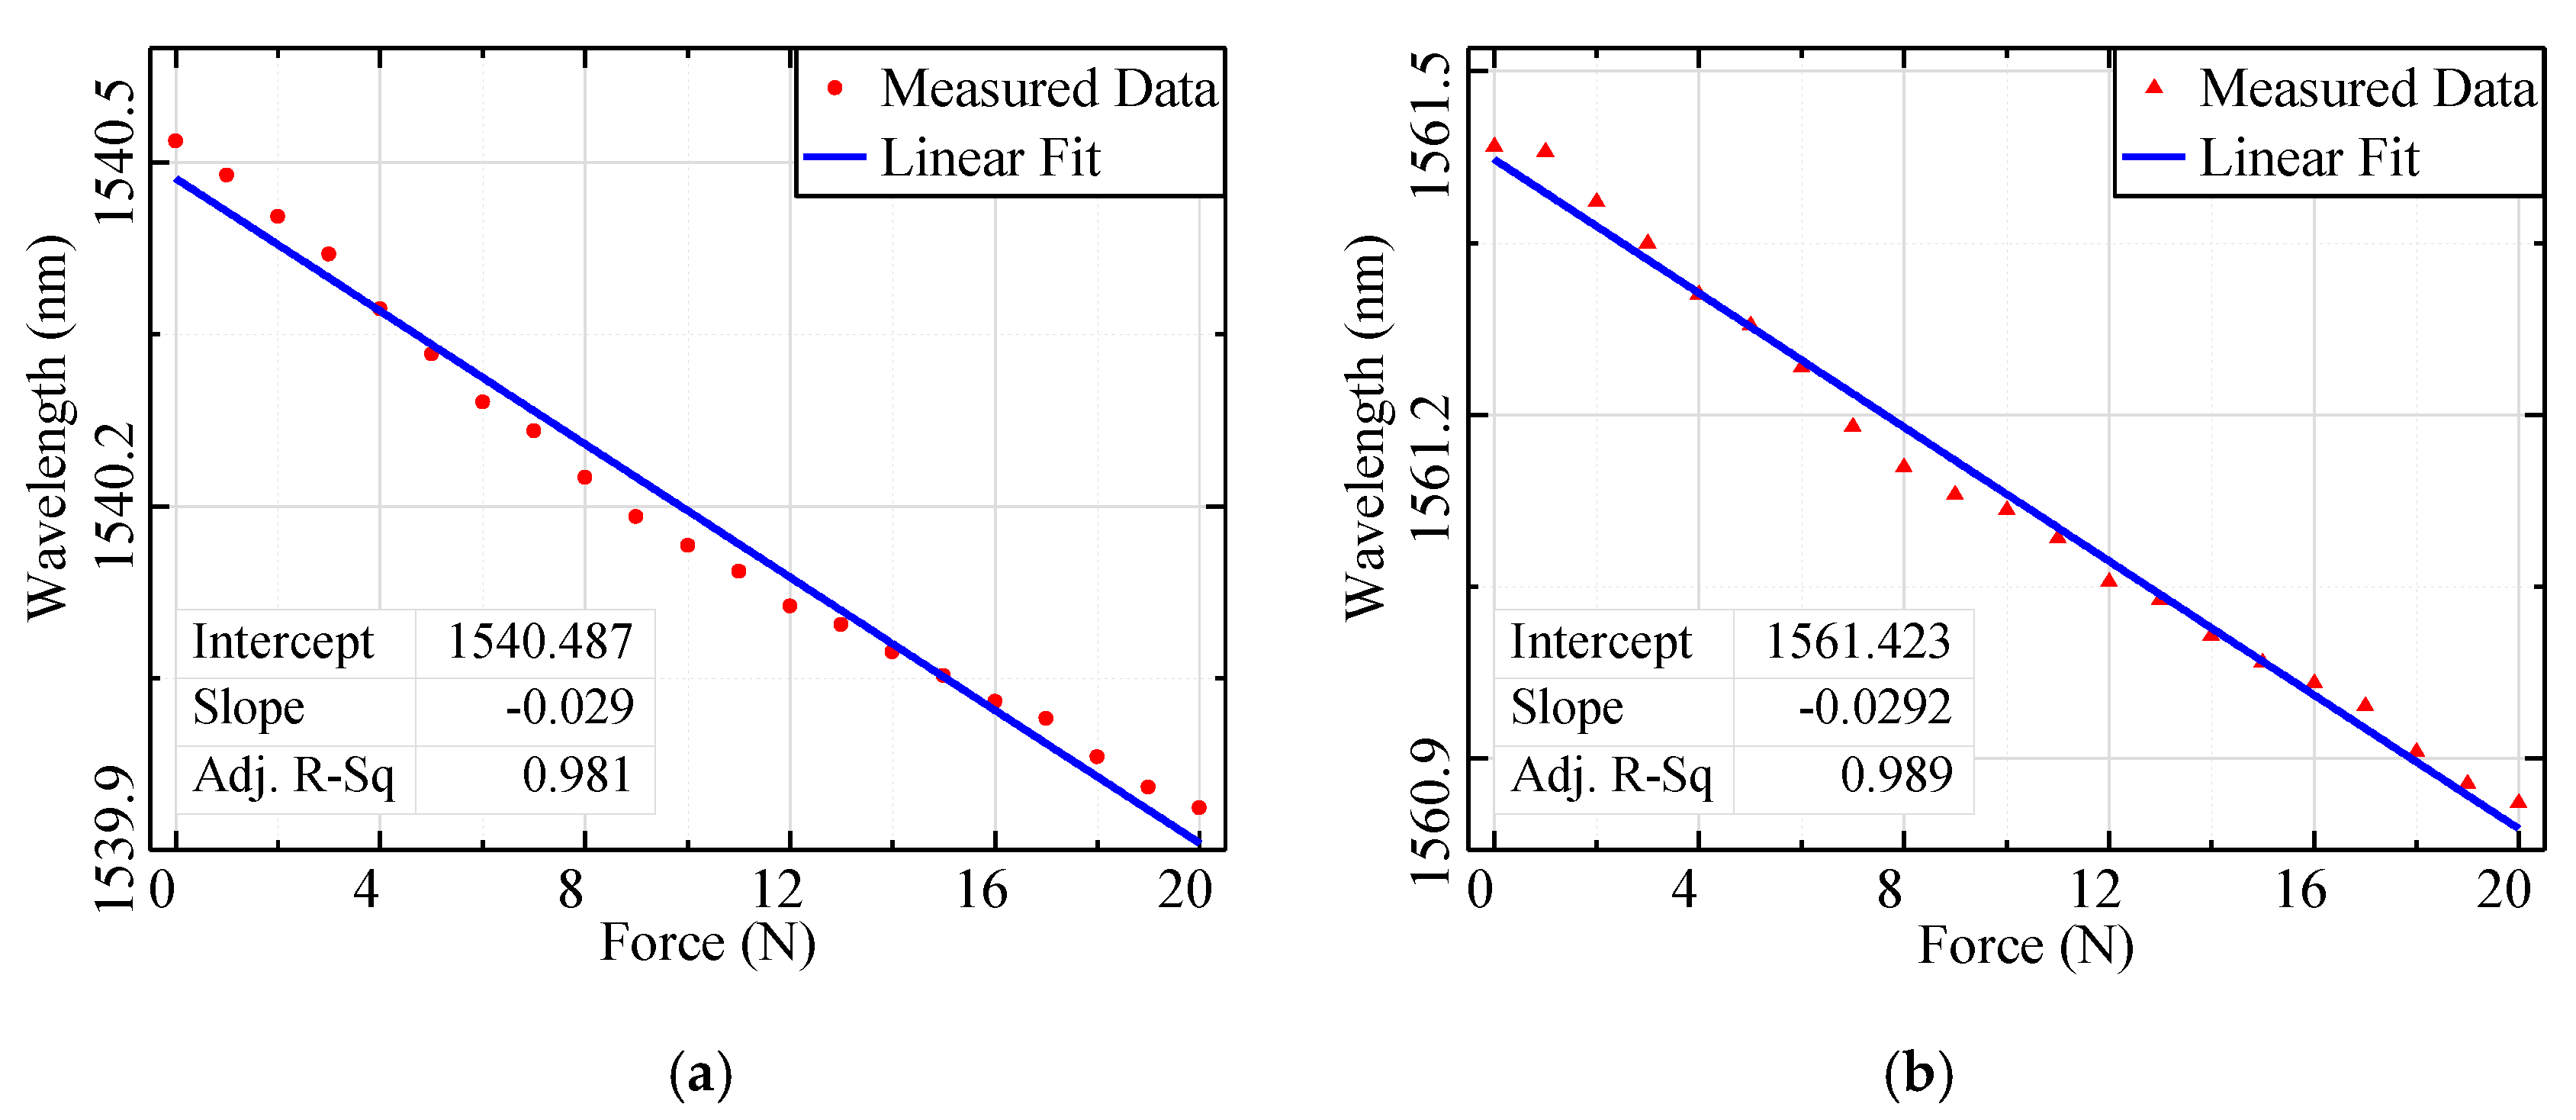
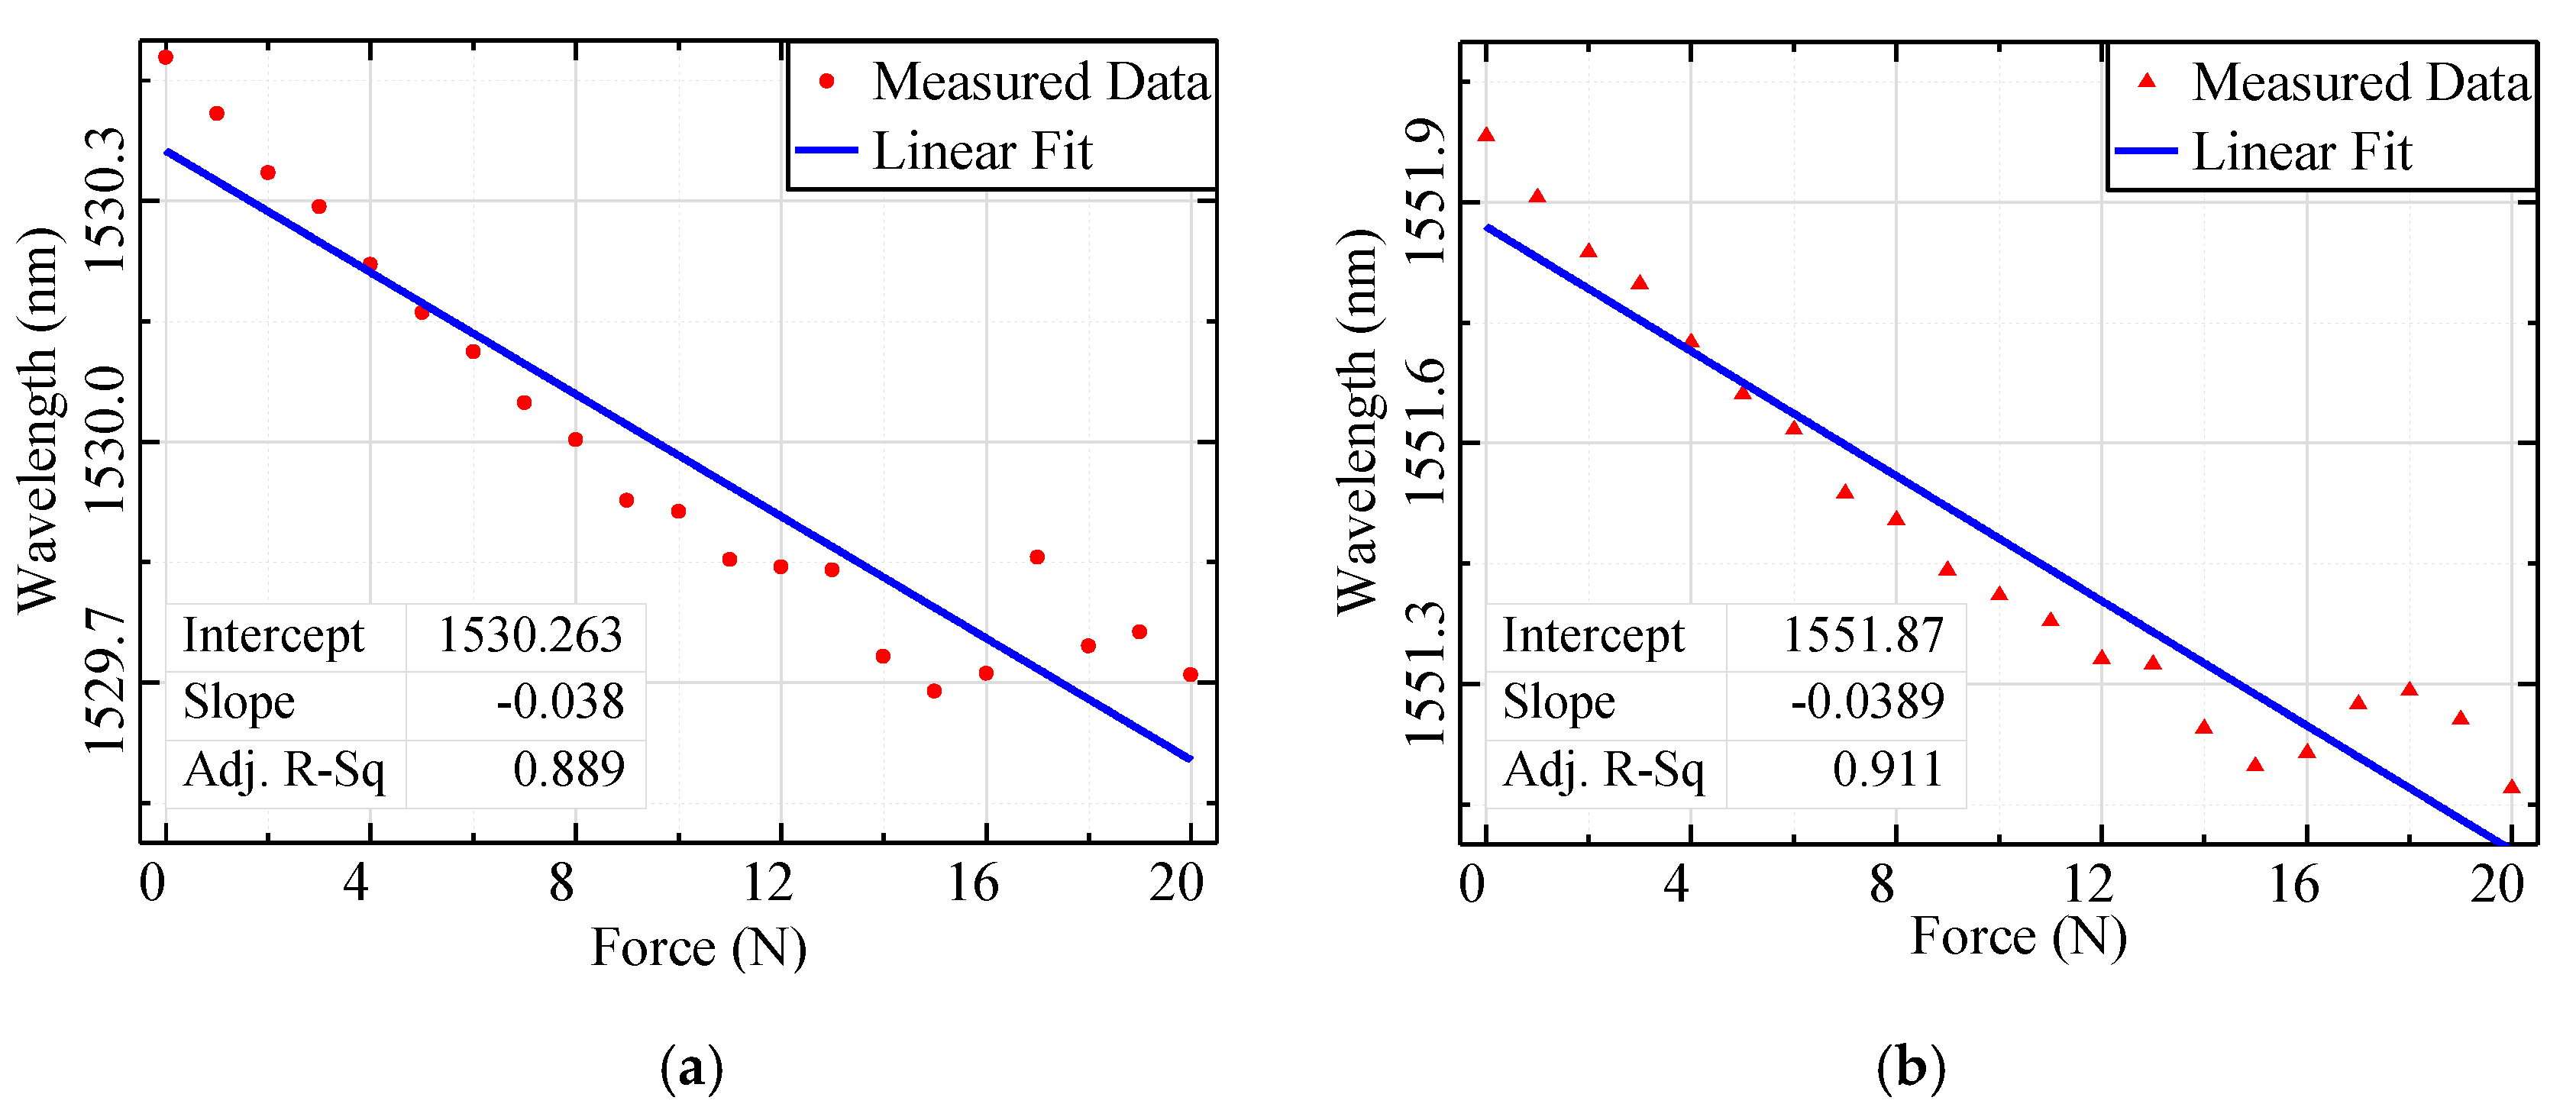
4.2. Measurement and Results

The experimental setup included a demodulator (tunable laser source, detector, data acquisition, processing system, and coupler), loading device (fixed bracket, standard weight), and computer, as demonstrated in Figure 7. The wavelength range of the tunable laser source is 1510–1590 nm. By demodulating the reflected signal, the proposed sensor can output two channels of the wavelength signal, which can be taken as the measurement results to analyze. The wavelength resolution of the demodulator is 0.1 pm, with a wavelength measurement accuracy of up to ±1 pm. Firstly, the sensor was fixed to the tested structure by welding; then, the two sensor signals were connected to the demodulator through the fiber jumper. Secondly, in order to avoid the temperature influence, an FBG sensor with a wavelength of 1539.97 nm was used to decouple the temperature. It was placed in a stainless steel tube with an internal diameter of 0.3 mm to ensure that it was only affected by the external environment (room temperature 25 °C). Next, an axial force was applied to the structure by the loading device, and the constant loading state was maintained for about 2 min to ensure the accuracy of measurement data. Finally, five different loading cases were set to test the linearity, sensitivity, repeatability, stability, and hysteresis of the load measurement, as displayed in Table 2.
The applied axial force changed from 0 N to 10 N, and the measurement was repeated three times to obtain the accuracy, linearity, and repeatability for the load measurement. It can be seen from Figure 8 that with an increase of the load, the interference signal of the cavity moves in the shortwave direction. The test data show that the wavelength shift of the sensor exhibits a linear relationship with the axial force. Figure 8a,b represent the test results and fitting curves obtained from three measurements of sensor signal 1 and sensor signal 2, respectively. It can be seen from the results that the strain sensing characteristics of the sensor have good linearity. The measured linearity (adjusted r-squared—Adj. R-Sq) for sensor signal 1 was 0.99367, 0.9952, and 0.99506; and for sensor signal 2, the measured linearity was 0.99684, 0.99767, and 0.99143. The sensitivity for sensor signal 1 was 33.0 pm/N, 31.0 pm/N, and 34.5 pm/N; and for sensor signal 2, it was 33.2 pm/N, 32.0 pm/N, and 35.6 pm/N. Considering the strain transfer efficiency, the measurement sensitivity of the EFFP sensor for axial force is higher than that for the fiber Bragg grating sensor. The measurements results of the three different measurements are very similar, showing that the repeatability and accuracy of the sensor are high.
According to these outputs, the ‘loading’ and ‘unloading’ curves provide different values of the sensor output values versus the same value of the applied force. The loading/unloading hysteresis for the sensor was also characterized in an experiment by measuring the wavelength corresponding to cyclic force change, and the result is shown in Figure 9. The blue line measured from low to high force represents the increasing process, and the red line measured in the opposite direction represents the decreasing process. The major contribution of hysteresis may come from the welding layer used to bond the sensor and structure. The maximum hysteresis error of sensor single 1 and sensor single 2 was 4.00% and 3.67%, respectively, which was observed under 2 N and 6 N. It should be noted that since the tested structure has a microdynamic response for mechanical swing owing to the small size, the real hysteresis error is relatively lower. Thus, these results indicate favorable reliability of the sensor [34], and that the hysteresis of the sensor is lower.
When loading to 10 N by the stepwise loading method with a 0.5 N increment, the measurement sensitivity under this load configuration for sensor signal 1 and sensor signal 2 was measured as 33.0 pm/N and 32.0 pm/N, and the linearity of each sensor was 0.99006 and 0.99742, respectively. The linearity and accuracy of the sensor are also excellent when the tested structure is subjected to a small increment load, as shown in Figure 10.
The constant load of 5 N was loaded onto the structural member to test the stability. The central wavelength data of the sensor was recorded per 1 s, and the total data collection time was 15 min. The test results are shown in Figure 11. For sensor signal 1, the maximum wavelength drift was 12.21 pm, while for signal 2, it was 11.79 pm. The measurement drift is believed to be due to the following reasons. One reason is due to the sensor itself, which generates a systematic shift. The other reason is that as the tested structure has light weight, the variation caused by swing needs to be considered. These results indicate that the stability of the sensor is good.
The sensors with different placement were tested to compare the axial force measurement linearity of these two situations. The sensors were fixed on the bottom (7.0 mm) and center (5.5 mm) position of the tested structure. The loading range was set to 0–20 N (maximum instantaneous load), and the signal of the sensor was collected once at each 1 N increment to test the linearity of the sensor with different positions. It can be seen from Figure 12 and Figure 13 that the linearity and precision of the sensors placed at different positions are different. For comparison, the test curve displayed in Figure 11 shows the measurement results when the sensor was placed in the center position, while Figure 12 depicts the results when the sensor was placed at the bottom of the structure. The fitting linearity of the different sensor placement obtained was 0.899 and 0.911 for the center position, and 0.981and 0.989 for the bottom position. Therefore, when the measured structure is subjected to the same external load, the sensor at the center point has better linearity, because it is located within the uniform strain field of the structure. When the sensor is used to test the structural load, it is necessary to consider the placement of the sensor.

5. Conclusions

In this work, the extrinsic FP strain sensor was fabricated by MEMS technology, and it was applied to the load measurement for a small structure. Before the experiment, the sensor should be confirmed as being located within the uniform strain field. Experimental results show the sensor has a good linearity for the applied load (adjusted r-squared), with results of 0.99367, 0.9952, 0.99506, 0.99684, 0.99767, and 0.99143. The proposed sensor also exhibited a good hysteresis feature, and the sensor signal remained stable when a constant load was applied onto the structure for a period of time. In addition, based on the consideration of the strain transfer coefficient, the load measurement accuracy of the small structure can reach 35.6 pm/N. In summary, compared with the fiber Bragg grating sensor, the sensor has higher repeatability and sensitivity. It can be concluded that this novel sensor with a high parallelism and good consistency cavity can easily achieve miniaturization and mass production, so it can be used as a distribution stability force sensor, and has potential application value in weak strain occasions.

Author Contributions

Y.B. designed the experiment and wrote the manuscript; J.Z. and J.H. gave some suggestions for an improved method; S.Z. performed the experiment; Z.C. and D.L. helped edit the manuscript. All authors have read and agreed to the published version of the manuscript.

Funding

This research was supported by the fund of Aeronautics Science (Grant No. 20170252004), Shanghai Academy of Spaceflight Technology (Grant No. SAST2018-015), Jiangsu province key research and development plan industry foresight and generic key technology competition project (BE2018047).

Acknowledgments

The author would like to thank the support from Shanghai Baiantek Sensing Technology CO., LTD Company.

Conflicts of Interest

The authors declare no conflict of interest.

References

  1. Di Sante, R. Fiber Optic Sensors for Structural Health Monitoring of Aircraft Composite Structures: Recent Advances and Applications. Sensors 2015, 15, 18666–18713. [Google Scholar] [CrossRef] [PubMed]
  2. Ramakrishnan, M.; Rajan, G.; Semenova, Y.; Farrell, G. Overview of Fiber Optic Sensor Technologies for Strain/Temperature Sensing Applications in Composite Materials. Sensors 2016, 16, 99. [Google Scholar] [CrossRef] [PubMed] [Green Version]
  3. Pena, F.; Strutner, S.M.; Richards, W.L.; Piazza, A.; Parker, A.R. Evaluation of Embedded FBGs in Composite Overwrapped Pressure Vessels for Strain based Structural Health Monitoring. In Proceedings of the Industrial and Commercial Applications of Smart Structures Technologies 2014, San Diego, CA, USA, 10 March 2014. [Google Scholar]
  4. Geng, T.; Li, J.; Yang, W.; An, M.; Zeng, H.; Yang, F.; Cui, Z.; Yuan, L. Simultaneous measurement of temperature and strain using a long-period fiber grating with a micro-taper. Opt. Rev. 2016, 23, 657–661. [Google Scholar] [CrossRef]
  5. Lee, B.H.; Kim, Y.H.; Park, K.S.; Eom, J.B.; Kim, M.J.; Rho, B.S.; Choi, H.Y. Interferometric Fiber Optic Sensors. Sensors 2012, 12, 2467–2486. [Google Scholar] [CrossRef] [PubMed] [Green Version]
  6. Her, S.-C.; Yang, C.-M. Dynamic Strain Measured by Mach-Zehnder Interferometric Optical Fiber Sensors. Sensors 2012, 12, 3314–3326. [Google Scholar] [CrossRef]
  7. Xiao, S.; Wu, B.; Dong, Y.; Xiao, H.; Yao, S.; Jian, S. Strain and Temperature Discrimination using Two sections of PMF in Sagnac interferometer. Opt. Laser Technol. 2019, 113, 394–398. [Google Scholar] [CrossRef]
  8. Templeton, E.H.; Davis, M.A.; Pedrazzani, J.R.; Ohanian, O.J. Distributed High Temperature Measurement for Monitoring Bleed Air Lines and other Aircraft Structures. In Proceedings of the AIAA Information Systems-AIAA Infotech @ Aerospace, Grapevine, TX, USA, 9–13 January 2017. [Google Scholar]
  9. Forbes, B.; Vlachopoulos, N.; Hyett, A.J. The application of distributed optical strain sensing to measure the strain distribution of ground support members. Facets 2018, 3, 195–226. [Google Scholar] [CrossRef] [Green Version]
  10. Lu, Z.; Cao, Y.; Wang, G.; Ran, Y.; Feng, X.; Guan, B.O. High-Resolution Displacement Sensor Based on a Chirped Fabry–Pérot Interferometer Inscribed on a Tapered Microfiber. Appl. Sci. 2019, 9, 403. [Google Scholar] [CrossRef] [Green Version]
  11. Zhang, T.; Liu, Y.; Yang, D.; Wang, Y.; Fu, H.; Jia, Z.; Gao, H. Constructed fiber-optic FPI-based multi-parameters sensor for simultaneous measurement of pressure and temperature, refractive index and temperature. Opt. Fiber Technol. 2019, 49, 64–70. [Google Scholar] [CrossRef]
  12. Li, H.; Deng, H.; Zheng, G.; Shan, M.; Zhong, Z.; Liu, B. Reviews on corrugated diaphragms in miniature fiber-optic pressure sensors. Appl. Sci. 2019, 9, 2241. [Google Scholar] [CrossRef] [Green Version]
  13. Zhao, Y.; Xia, F.; Chen, M.; Tong, R.; Peng, Y. Optical fiber axial contact force sensor based on bubble-expanded Fabry–Pérot interferometer. Sens. Actuators A Phys. 2018, 272, 318–324. [Google Scholar] [CrossRef]
  14. Arata, J.; Nitta, T.; Nakatsuka, T.; Kawabata, T.; Matsunaga, T.; Haga, Y.; Harada, K.; Mitsuishi, M. Optic Force Sensor for a Surgical Device Using a Fabry-Perot Interferometer. Appl. Sci. 2019, 9, 3454. [Google Scholar] [CrossRef] [Green Version]
  15. Favero, F.C.; Araujo, L.; Bouwmans, G.; Finazzi, V.; Villatoro, J.; Pruneri, V. Spheroidal Fabry-Perot microcavities in optical fibers for high-sensitivity sensing. Opt. Express 2012, 20, 7112–7118. [Google Scholar] [CrossRef] [PubMed]
  16. Frazão, O.; Aref, S.H.; Baptista, J.M.; Santos, J.L.; Latifi, H.; Farahi, F.; Kobelke, J.; Schuster, K. Fabry-pérot cavity based on a suspended-core fiber for strain and temperature measurement. IEEE Photonics Technol. Lett. 2009, 21, 1229–1231. [Google Scholar] [CrossRef]
  17. Yan, L.; Gui, Z.; Wang, G.; An, Y.; Gu, J.; Zhang, M.; Liu, X.; Wang, Z.; Wang, G.; Jia, P. A micro bubble structure based fabry–perot optical fiber strain sensor with high sensitivity and low-cost characteristics. Sensors 2017, 17, 555. [Google Scholar] [CrossRef] [Green Version]
  18. Domingues, M.F.; Rodriguez, C.A.; Martins, J.; Tavares, C.; Marques, C.; Alberto, N.; André, P.; Antunes, P. Cost-effective optical fiber pressure sensor based on intrinsic Fabry-Perot interferometric micro-cavities. Opt. Fiber Technol. 2018, 42, 56–62. [Google Scholar] [CrossRef]
  19. Liu, Y.; Zhang, T.; Wang, Y.; Yang, D.; Liu, X.; Fu, H.; Jia, Z. Simultaneous measurement of gas pressure and temperature with integrated optical fiber FPI sensor based on in-fiber micro-cavity and fiber-tip. Opt. Fiber Technol. 2018, 46, 77–82. [Google Scholar] [CrossRef]
  20. Wang, Y.; Liao, C.R.; Wang, D.N. Embedded coupler based on selectively infiltrated photonic crystal fiber for strain measurement. Opt. Lett. 2012, 37, 4747–4749. [Google Scholar] [CrossRef] [Green Version]
  21. Liu, Y.; Lang, C.; Wei, X.; Qu, S. Strain force sensor with ultra-high sensitivity based on fiber inline Fabry-Perot micro-cavity plugged by cantilever taper. Opt. Express 2017, 25, 7797–7806. [Google Scholar] [CrossRef]
  22. Liu, Y.; Wang, D.N.; Chen, W.P. Crescent shaped Fabry-Perot fiber cavity for ultra-sensitive strain measurement. Sci. Rep. 2016, 6, 1–9. [Google Scholar] [CrossRef]
  23. Liu, H.; Liu, B. High-Sensitivity Fabry-Pérot Strain Senor Based on Fusion Splicing Photonic Crystal Fiber and Single Mode Fiber. In Proceedings of the 2018 11th International Symposium on Communication Systems, Networks & Digital Signal Processing (CSNDSP), Budapest, Hungary, 18–20 July 2018; pp. 1–4. [Google Scholar]
  24. Liu, S.; Wang, Y.; Liao, C.; Wang, G.; Li, Z.; Wang, Q.; Zhou, J. High-sensitivity strain sensor based on in-fiber improved Fabry-Perot interferometer. Opt. Lett. 2014, 39, 2121–2124. [Google Scholar] [CrossRef] [PubMed] [Green Version]
  25. Jiang, Y.; Yang, D.; Yuan, Y.; Xu, J.; Li, D.; Zhao, J. Strain and high-temperature discrimination using a Type II fiber Bragg grating and a miniature fiber Fabry-Perot interferometer. Appl. Opt. 2016, 55, 6341–6345. [Google Scholar] [CrossRef] [PubMed]
  26. Ge, Y.; Cai, K.; Wang, T.; Zhang, J. MEMS pressure sensor based on optical Fabry-Perot interference. Optik 2018, 165, 35–40. [Google Scholar] [CrossRef]
  27. Abeysinghe, D.C.; Dasgupta, S.; Boyd, J.T.; Jackson, H.E. A novel MEMS pressure sensor fabricated on an optical fiber. IEEE Photonics Technol. Lett. 2001, 13, 993–995. [Google Scholar] [CrossRef]
  28. Pang, C.; Bae, H.; Gupta, A.; Bryden, K.; Yu, M. MEMS Fabry-Perot sensor interrogated by optical system-on-a-chip for simultaneous pressure and temperature sensing. Opt. Express 2013, 21, 21829. [Google Scholar] [CrossRef]
  29. Eugene, H. Interference. In Optics, 5th ed.; Murchana, B., Vikash, T., Trudy, K., Vikram, K., Eds.; Pearson Education: Edinburgh Gate, UK, 2017; pp. 436–441. [Google Scholar]
  30. Set, S.Y.; Jablonski, M.K.; Hsu, K.; Goh, C.S.; Kikuchi, K. Rapid amplitude and group-delay measurement system based on intra-cavity-modulated swept-lasers. IEEE Trans. Instrum. Meas. 2004, 53, 192–196. [Google Scholar] [CrossRef]
  31. Beer, F.P.; Johnston, E.R., Jr.; Dewolf, J.T.; Mazurek, D.F. Stress and Strain—Axial Loading. In Mechanics of Materials, 6th ed.; McGraw-Hill: New York, NY, USA, 2012; pp. 56, 67. [Google Scholar]
  32. Moradi, M. Strain Transfer Analysis of Surface-Bonded MEMS Strain Sensors. IEEE Sens. J. 2013, 13, 637–643. [Google Scholar] [CrossRef]
  33. Fang, Z.; Chin, K.K.; Qu, R.; Cai, H. Fiber grating and related devices. In Fundamentals of Optical Fiber Sensors; John Wiley & Sons: Hoboken, NJ, USA, 2012; pp. 249–250. [Google Scholar]
  34. Agidew, T.F.; Secco, E.L.; Maereg, A.T.; Reid, D.; Nagar, A.K. Fiber Optic-Based Force Sensor for Bio-Mimetic Robotic Finger. In Proceedings of the IEEE SENSORS, Glasgow, UK, 29 October–1 November 2017. [Google Scholar]
Figure 1. Schematic diagram of multi-beam interferometer.
Applsci 10 00018 g001
Figure 2. Schematic of miniaturization of the extrinsic fiber Fabry–Perot (EFFP) strain sensor.
Applsci 10 00018 g002
Figure 3. Manufacturing process of the extrinsic fiber Fabry–Perot probe. (a) Lithography. (b) Deep reactive ion etching (DRIE) etching of silicon-on-insulator (SOI) silicon wafer. (c) Etching intermediate oxide layer. (d) Deposition of reflective film S2. (e) Deposition of reflective film S1. (f) Anodic bonding. (g) Anti-reflection film. (h) Passivation layer.
Applsci 10 00018 g003
Figure 4. Reflection spectrum of the extrinsic fiber Fabry–Perot (EFFP) sensor with different strains.
Applsci 10 00018 g004
Figure 5. Geometry characteristics and strain distribution of tested structure. (a) Schematic of the geometry of the tested structure. (b) The strain distribution of the structure subjected to 20 N load.
Applsci 10 00018 g005
Figure 6. Structural strain distribution under external load.
Applsci 10 00018 g006
Figure 7. The diagram of the experimental system. The proposed sensor was attached by welding a layer to the small structure. The load was applied by the load device. (a) Experimental device configuration. (b) Loading device. (c) Tested structure. (d) The experimental setup.
Applsci 10 00018 g007
Figure 8. The static force (1.0 N increments) response and fitting curves of the Fabry–Perot (FP) sensor in three measurements, Case 1. (a) The curve of sensor signal 1. (b) The curve of sensor signal 2.
Applsci 10 00018 g008
Figure 9. Sensor hysteresis curve of a structure under loading (blue line) and unloading (red line), Case 1. (a) The curve of sensor signal 1. (b) The curve of sensor signal 2.
Applsci 10 00018 g009
Figure 10. The static force (0.5 N increments) response and fitting curve of the sensor, Case 2. (a) The measuring curve of sensor signal 1. (b) The measuring curve of sensor signal 2.
Applsci 10 00018 g010
Figure 11. Static stability test, Case 3. (a) The measuring curve of sensor signal 1. (b) The measuring curve of sensor signal 2.
Applsci 10 00018 g011
Figure 12. Measurement and fitting curve with center location, Case 4. (a) The curve of sensor signal 1. (b) The curve of sensor signal 2.
Applsci 10 00018 g012
Figure 13. Measurement and fitting curve with bottom location, Case 5. (a) The curve of sensor signal 1. (b) The curve of sensor signal 2.
Applsci 10 00018 g013
Table 1. Structural material properties.
Materials Physical ParameterSymbolValueUnit
Young’s modulus of the structure E s 107GPa
Poisson’s ratio of the structure ν s 0.34
Density of the structure ρ T i 4.62g/cm3
Length of the structure L s 11mm
Width of the structure W s 1.5mm
Thickness of the structure T S 0.55mm
Table 2. Description of the test (all cases).
CaseMinimum (N)Maximum (N)Increment (N)Sensor Location
10101Center (5.5 mm)
20100.5Center (5.5 mm)
355-Center (5.5 mm)
40201Center (5.5 mm)
50201Bottom (7.0 mm)

