Article

Histogram Based Clustering for Nonlinear Compensation in Long Reach Coherent Passive Optical Networks

by
Ivan Aldaya
1,*,
Elias Giacoumidis
2,
Geraldo de Oliveira
1,
Jinlong Wei
3,
Julián Leonel Pita
4,
Jorge Diego Marconi
5,
Eric Alberto Mello Fagotto
6,
Liam Barry
2 and
Marcelo Luis Francisco Abbade
1
1
Campus of São João da Boa Vista, State University of São Paulo, São João da Boa Vista 13876-750, Brazil
2
Radio and Optical Communications Lab, Dublin City University, Dublin D09, Ireland
3
European Research Center, Huawei Technologies Duesseldorf GmbH, 40549 Munich, Germany
4
School of Electrical Engineering, State university of Campinas, Campinas 13083-852, Brazil
5
Engineering, Modeling and Applied Sociology Center, Universidade Federal do ABC, São Paulo 09210-580, Brazil
6
School of Electrical Engineering, Pontifical Catholic University of Campinas, Campinas 13087-571, Brazil
*
Author to whom correspondence should be addressed.
Appl. Sci. 2020, 10(1), 152; https://doi.org/10.3390/app10010152
Submission received: 6 September 2019 / Revised: 22 November 2019 / Accepted: 5 December 2019 / Published: 23 December 2019
(This article belongs to the Special Issue Optics for AI and AI for Optics)

Abstract

:
In order to meet the increasing capacity requirements, network operators are extending their optical infrastructure closer to the end-user while making more efficient use of the resources. In this context, long reach passive optical networks (LR-PONs) are attracting increasing attention.Coherent LR-PONs based on high speed digital signal processors represent a high potential alternative because, alongside with the inherent mixing gain and the possibility of amplitude and phase diversity formats, they pave the way to compensate linear impairments in a more efficient way than in traditional direct detection systems. The performance of coherent LR-PONs is then limited by the combined effect of noise and nonlinear distortion. The noise is particularly critical in single channel systems where, in addition to the the elevated fibre loss, the splitting losses should be considered. In such systems, Kerr induced self-phase modulation emerges as the main limitation to the maximum capacity. In this work, we propose a novel clustering algorithm, denominated histogram based clustering (HBC), that employs the spatial density of the points of a 2D histogram to identify the borders of high density areas to classify nonlinearly distorted noisy constellations. Simulation results reveal that for a 100 km long LR-PON with a 1:64 splitting ratio, at optimum power levels, HBC presents a Q-factor 0.57 dB higher than maximum likelihood and 0.21 dB higher than k-means. In terms of nonlinear tolerance, at a BER of 2×10 3 , our method achieves a gain of ∼2.5 dB and ∼1.25 dB over maximum likelihood and k-means, respectively. Numerical results also show that the proposed method can operate over blocks as small as 2500 symbols.

1. Introduction

The popularization of mobile multimedia applications and cloud computing, in combination with the emergence of the Internet of Things, is forcing telecommunications operators to increase the data capacity they can offer continuously. In this scenario, optical fibre infrastructures are progressively being extended, making them arriving closer to the end-user [1,2]. Among the different alternatives, passive optical networks (PONs) have been extensively employed due to their low cost [3,4,5,6]. Given the lack of amplification, however, fibre loss usually limits the bandwidth length product of these systems, especially when dispersion is compensated by predistortion techniques [7]. In order to extend the range of PON networks and, consequently, enable the resource concentration and cost reduction, two main approaches are commonly considered. On the one hand is the use of active splitting nodes that compensate the combined loss of fibre transmission and splitting [3,4]. This approach, nevertheless, makes the distribution network architecture more complicated and hinders its maintenance, particularly in long reach (LR) PONs where the splitting node may be far from urbanized areas. On the other hand, the advent of high speed digital signal processors (DSPs) has enabled the implementation of cost efficient digital coherent receivers [6], which dramatically changed the way about which high capacity links are thought. This inflexion point is not only due to the mixing gain they offer, but also because they permit simultaneous phase and amplitude modulation and open the possibility to compensate system impairments in a completely new and efficient way [8].
With linear impairments such as dispersion, phase noise, polarization fluctuation, and polarization-mode dispersion elegantly compensated in the baseband electrical domain, the interplay between nonlinear distortion and noise emerges as the main capacity limitation [9]. In single channel systems where the transmitted signal is broadcast to several users, the received power is reduced compared to wavelength division multiplexed (WDM) systems where demultiplexers are used and, consequently, the impact of the receiver noise is more critical. In regards to nonlinear distortion, the Kerr effect is widely claimed as the dominant nonlinear effect in digital coherent systems [10,11]. It is well known that the Kerr effect further leads to self-phase modulation (SPM), cross-phase modulation (XPM), and four wave mixing (FWM) processes [12]. In the case of multi-wavelength PON systems, it is expected that XPM and FWM will be the main nonlinear degradation mechanisms, but for those systems operating with a single channel, the nonlinear distortion is solely governed by SPM. SPM is particularly harmful in modulation formats with non-uniform amplitude, for instance 16 quadrature amplitude modulation (16-QAM) [13]. Since SPM causes a phase rotation that is proportional to the power of the symbol ( ϕ N L γ P L e f f , where γ is the nonlinear coefficient, P is the symbol power, and L e f f is the effective fibre length), for moderate and elevated launch optical power levels, the constellation points with higher amplitude suffer a larger phase rotation than those with lower amplitude, leading to a characteristic spiral-like shape constellation [14]. This rotation, nevertheless, cannot be completely corrected by a simple nonlinear phase rotation because, even in a low dispersion regime, and the interplay of SPM and chromatic dispersion leads to more complex distortion. This complex distortion can be understood by noting that the pulse broadening caused by the chromatic distortion leads to word dependent behaviour through intersymbol interference (ISI). Even if ISI can be efficiently compensated in the baseband domain by DSP processing, the different superposed pulses are nonlinearly mixed through SPM. In addition, the interaction between the linear and nonlinear impairments varies as the signal propagates through the fibre. Thus, in the initial part of the fibre, the Kerr effect is significant, whereas the effect of the ISI created by the chromatic dispersion can be neglected. At the end of the fibre, on the other hand, the accumulated dispersion is high, leading to a significant ISI, but given the high transmission loss, the Kerr effect is reduced. Both scenarios can be modelled relatively easily, the initial part by a memoryless nonlinear phase rotation and the last part of the link by a linear time invariant system. The intermediate part of the link, however, should consider the interaction between the two effects, and therefore, it is complicated to model analytically.
Several nonlinear mitigation techniques have been proposed in recent years to overcome this issue. Optical techniques, for instance mid-span nonlinear compensation [15], lack flexibility and require a careful design of the distribution network, which is not possible in PON networks. In these networks, electrical compensation techniques are preferable for their higher flexibility and adaptability. Unfortunately, simple deterministic approaches based on non-uniform phase rotation cannot efficiently compensate signal distortion as they neglect the effect of chromatic dispersion and the subsequent ISI. More complex techniques, such as digital back-propagation (DBP) [16,17] and inverse Volterra series transfer function (IVSTF) based nonlinear equalization [18,19], were then studied to invert the dynamic nonlinear time invariant behaviour of the fibre link. These techniques are capable of mitigating the effect of the interplay between dispersion and nonlinear distortion, but suffer from a prohibitively high computational cost, making real-time operation if not unfeasible, at least extremely challenging and power consuming. In this scenario, machine learning emerges as a high potential set of tools to analyse and process complex systems where analytical modelling is unfeasible or the computational cost to solve it is excessively high [20]. Thus, several groups have proposed different machine learning based approaches to overcome the degrading effect of nonlinear distortion in fibre communication systems [21,22,23,24]. In [25,26,27], artificial neural networks were employed, whereas in [28] and in [29,30], support vector machines (SVMs) were proposed. These approaches present a good nonlinear compensation performance, but are all supervised and, consequently, require the transmission of a training sequence that reduces the effective data throughput. Unsupervised machine learning, for instance clustering, on the other hand, does not require any training sequence, but learns from the received dataset. Among the proposed clustering algorithms, k-means is by far the most popular due to its simplicity, its convergence speed, and robustness [31,32,33,34]. In k-means, however, each cluster is represented by a centroid, and the decision regions are limited by straight boundaries, which may not be optimal for constellations strongly affected by SPM. In order to find decision regions adapted to arbitrarily shaped clusters, other clustering algorithms have been proposed: In [35], clustering based on affinity propagation was reported. Density based spatial clustering of applications with noise (DBSCAN) has also been applied successfully to improve the performance of systems affected by the combined effect of noise and nonlinear distortion [36]. In [37], classification based on expectation maximization was successfully employed to combat the effect of nonlinear phase noise. These algorithms, however, suffer from heavy computational cost, and their performance strongly depends on the tuning parameters. In DBSCAN, for example, it is necessary to set the values of the parameters ϵ and k m i n that correspond to the radius of the area and the minimum number of points in this area, respectively.
In this paper, we present a novel clustering algorithm denominated histogram based clustering (HBC) that partially mitigates the effect of nonlinear phase noise caused by SPM. The proposed approach is a density based clustering algorithm that assigns to a received symbol the class of the closest high point-density region. This is different from other clustering algorithms as k-means, which neglects any density information, or expectation maximization, which estimates the point distribution as a mixture of Gaussian distributions. Compared to the main density based clustering algorithm, DBSCAN, it does not require the setting of ϵ and k m i n ; it is able to find the best point density value automatically to have the desired number of clusters. In addition, the adopted solution is not iterative and leads to deterministic complexity. The rest of the paper is organized as follows: Section 2 explains the proposed clustering algorithm. In Section 3, the simulation setup is described, while in Section 4, the results of applying HBC to an LR-PON network are presented and discussed, paying attention not only to its performance, but also to the required block size. Section 4, finally, concludes the paper.

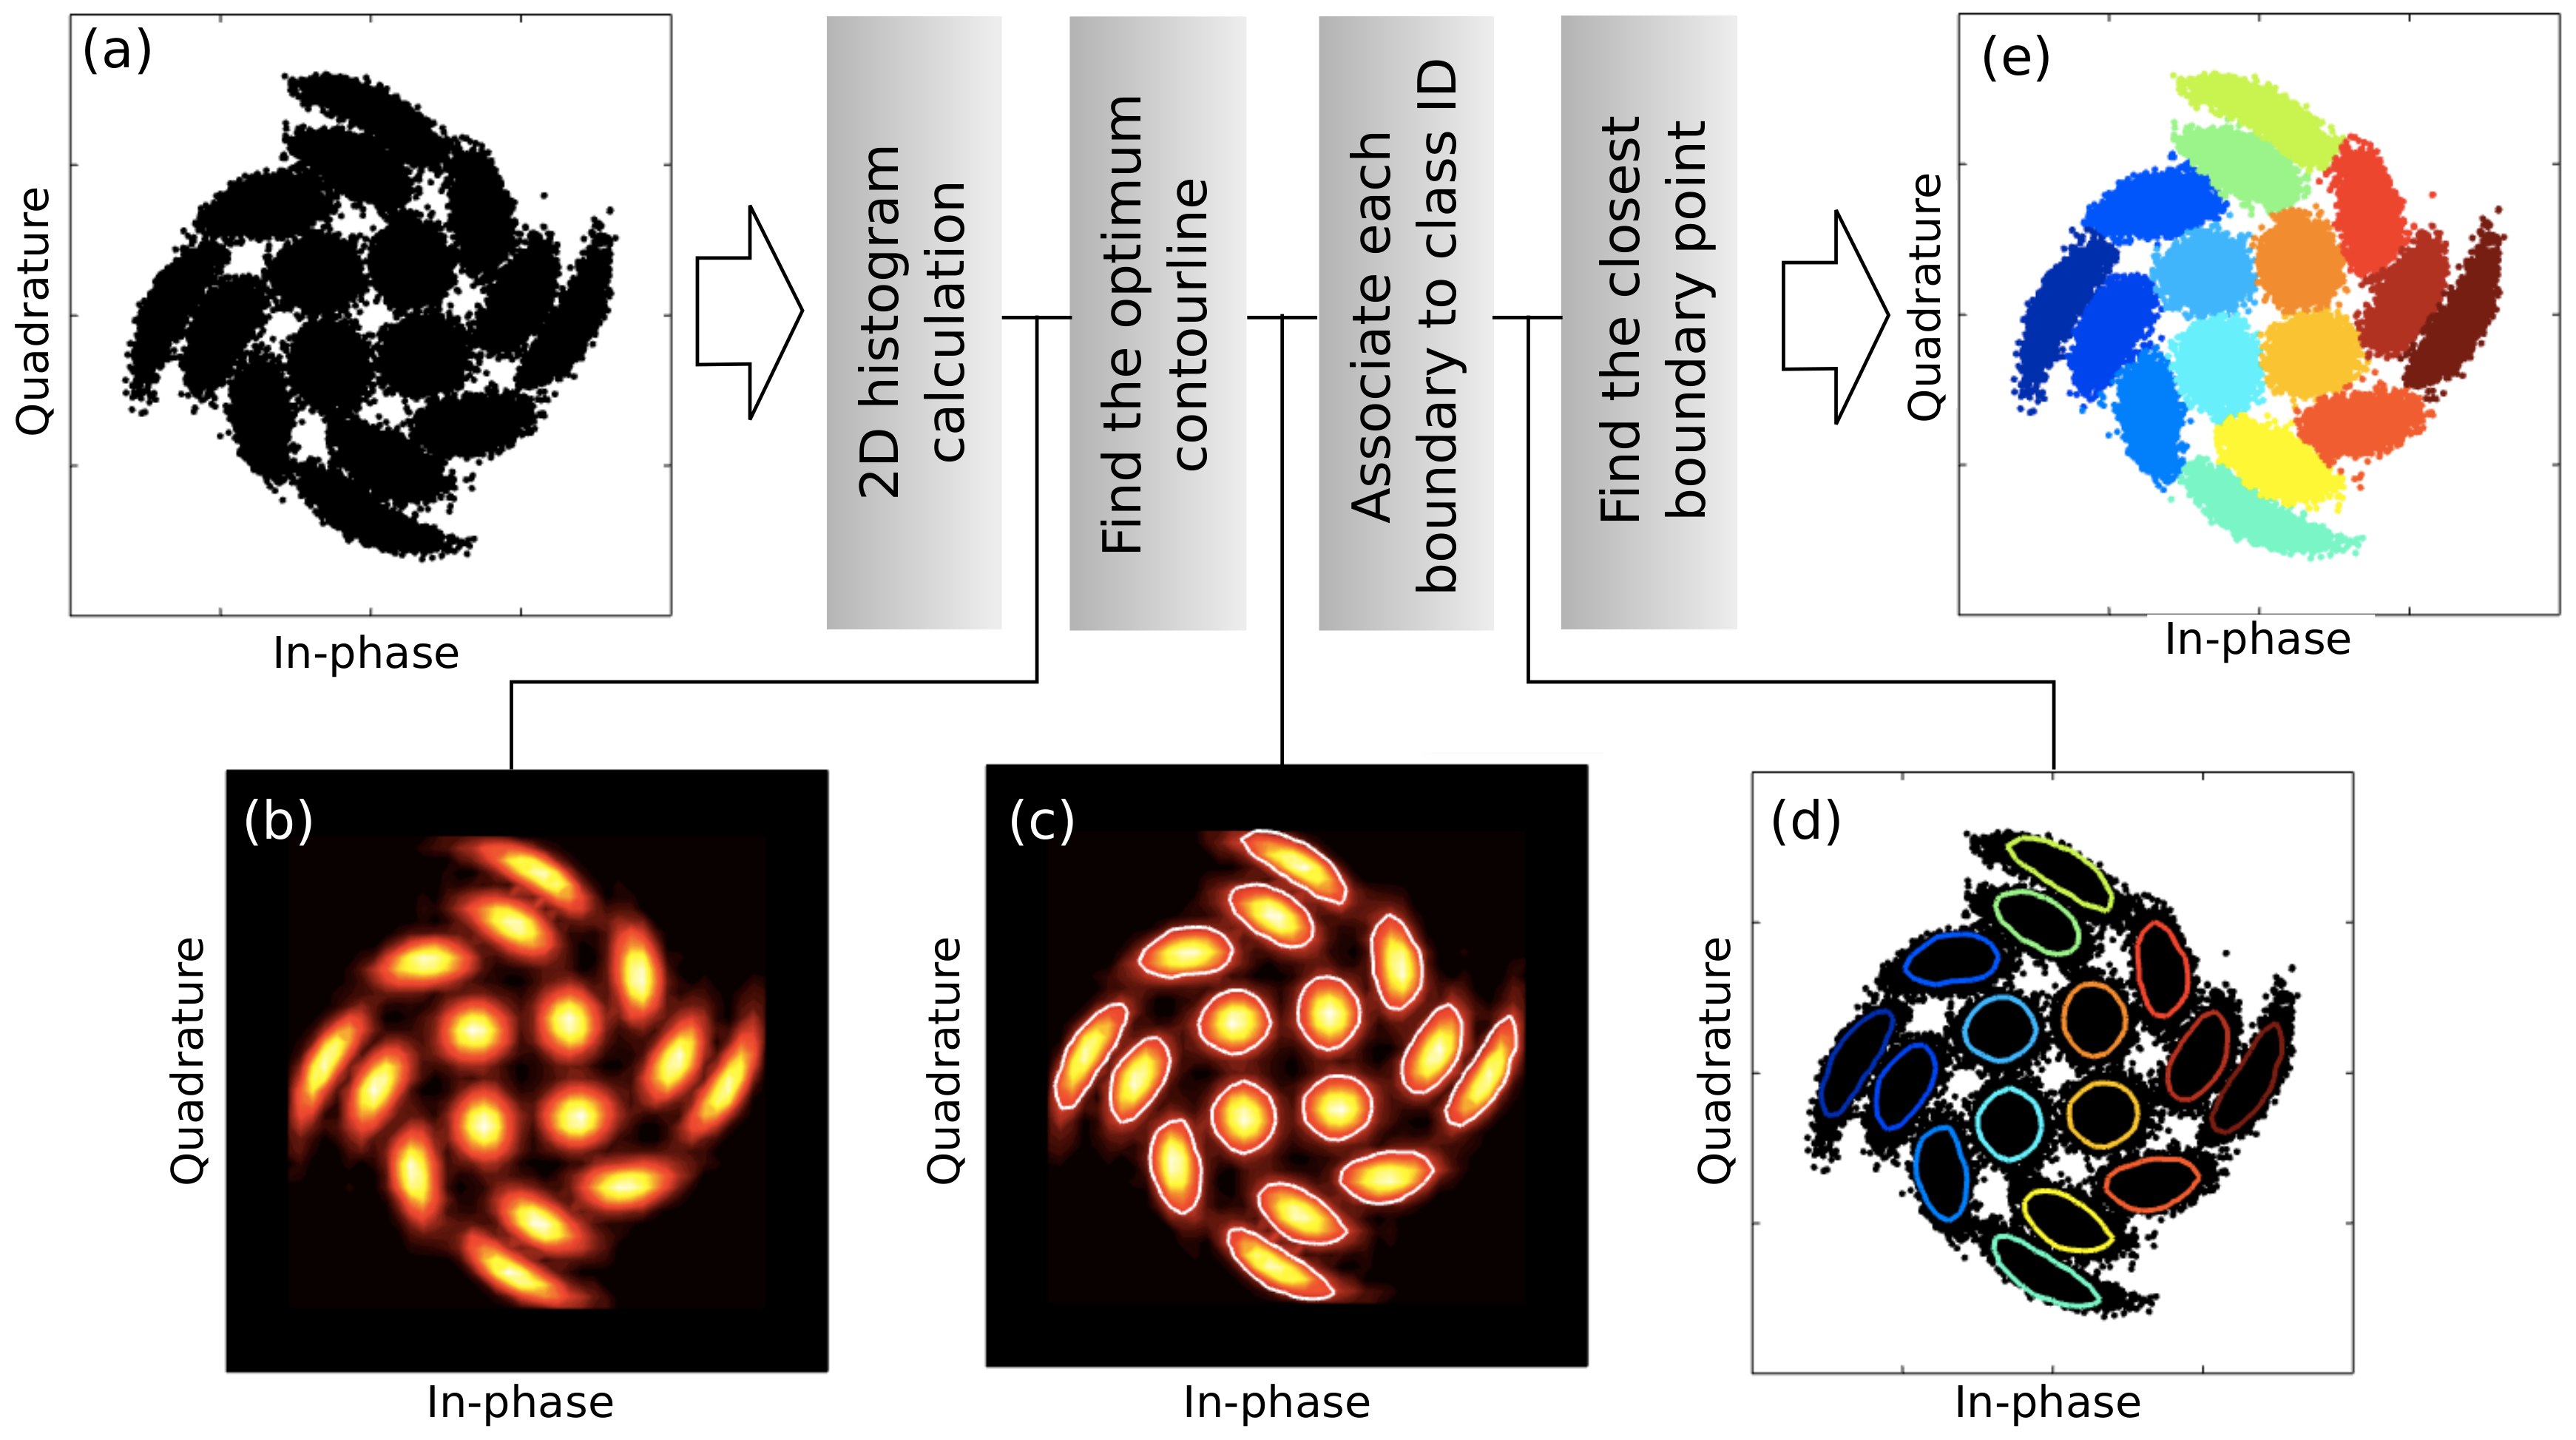
2. Histogram Based Clustering

Figure 1 shows the flow diagram of the proposed HBC algorithm. For the sake of illustration, we employed 10,000 16-QAM symbols that were obtained by applying an amplitude dependent nonlinear phase rotation ( Δ φ [ n ] = 3 A 2 [ n ] , where A [ n ] is the amplitude of the symbol) and including complex additive noise with a signal-to-noise ratio (SNR) of 20 dB. It is worth noting that this simple model was employed only for demonstration purposes because by neglecting the intersymbol interference, the model did not accurately represent the system. In the next section, we will describe the model used to consider simultaneously nonlinear and linear effects that result in more complex symbol distributions. The resultant constellation is shown in Figure 1a. The histogram of the unlabelled symbols was calculated, in this case, using 40 bins in the in-phase and quadrature directions, resulting in the contour plot presented in Figure 1b, where the 16 clusters can be clearly identified. Once the histogram was calculated, the lowest value contour line led to the desired number of clusters, 16 in the case of 16-QAM. The value of this contour line represents the optimal point density. A lower point density does not allow the correct recovery of all the clusters, while a larger value results in a too conservative criterion that leads to poorer performance, as the decision regions are not well matched to the data. This optimal density searching mechanism is, indeed, one of the main advantages over other density based clustering algorithms, such as DBSCAN. In fact, DBSCAN is intended for data clustering where the number of clusters is a priori unknown and the minimum density of clusters is fixed through the values of ϵ and k m i n . This was not our case, where the number of clusters was known and the minimum density was dependent on the distortion and, therefore, also on the launch power level. The determined cluster borders are superimposed on the histogram in Figure 1c, showing that, especially the constellation points with stronger distortion, those in the periphery, the boundaries of the different clusters were closer to each other. After finding the cluster boundaries, each cluster was identified by the points that formed its boundary instead of a centroid as in k-means. Figure 1d shows the boundaries of the different clusters on top of the received constellation, where it can be clearly seen that the obtained cluster boundaries encompassed most of the points of their respective clusters. Once the boundary points for each cluster were found, the distance from each received symbol to them was calculated, and the class of the boundary point with the shortest distance was assigned to the symbol. The classified constellation is shown in Figure 1e.
In a systematic way, the proposed HBC algorithm consisted of the following four steps:
  • Calculation of the 2D histogram of the in-phase and quadrature components of the N S received distorted symbols.
  • Find the lowest contour line in the histogram that results in M isolated islands, M being the number of clusters to be identified.
  • Assign a class ID to the values of the boundary for each island.
  • For each received symbol, find the closest boundary point and associate it with its class ID.
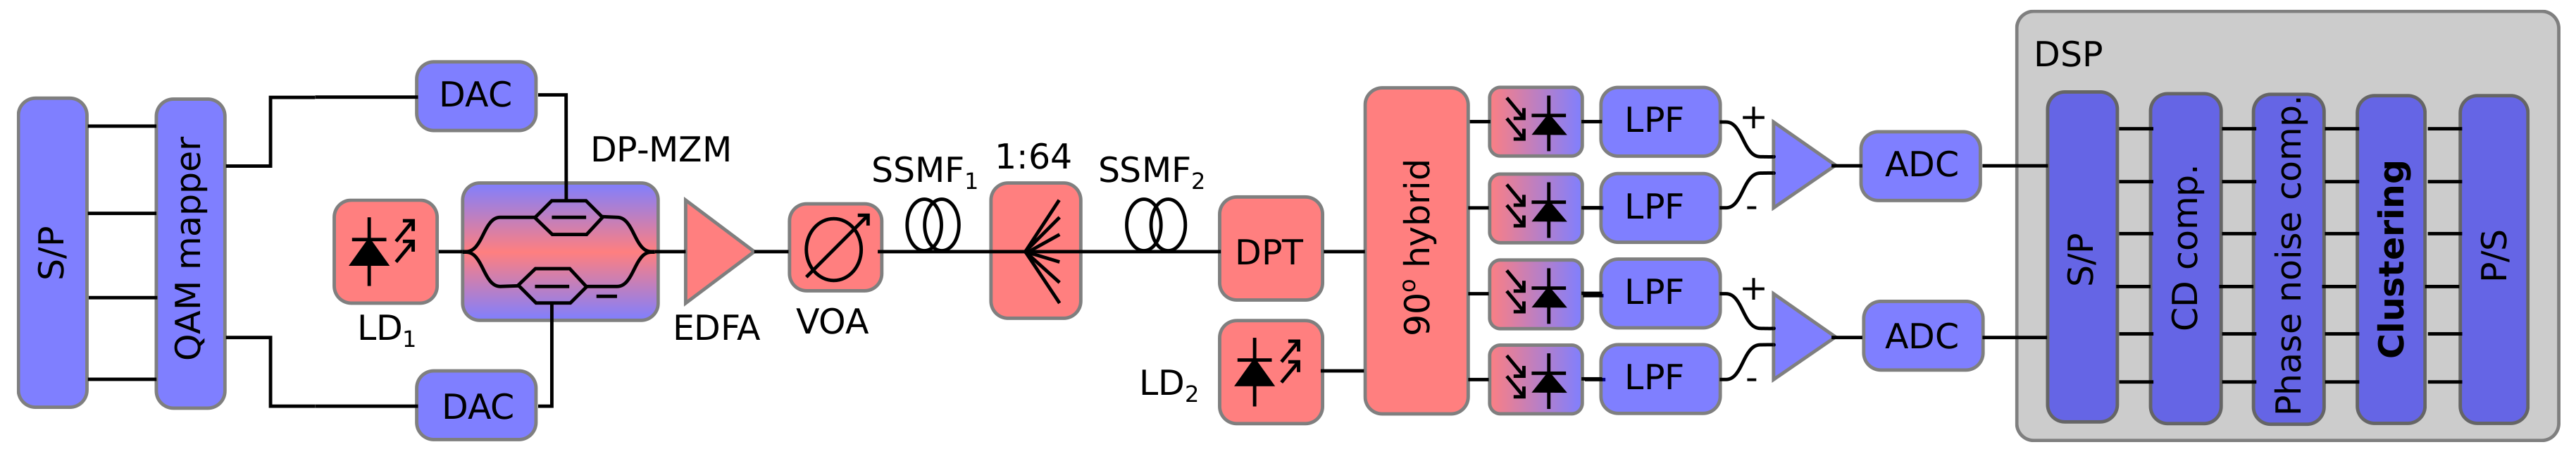
3. Simulation Setup

The performance of the proposed HBC algorithm was assessed employing the simulation setup presented in Figure 2, where the electrical modulation and demodulation tasks were implemented in MATLAB, while the conversion between the electrical and optical domain, as well as the transmission through the passive distribution network were carried out in VPI Transmission Maker.
On the transmitter side, a 1 mW power continuous wave (CW) laser diode (LD 1 ) operating at 1550 nm was externally modulated using a dual parallel Mach–Zehnder modulator (DP-MZM) driven by the in-phase and quadrature components of a 56 Gbps 16-QAM signal filtered by a fourth order Bessel filter with a bandwidth of 10.5 GHz. The modulated optical signal was then amplified by an erbium doped fibre amplifier (EDFA), and a variable optical attenuator was used to vary the launch optical power between 2 and 12 mW. Since the output power of the EDFA was fixed, the noise amplified spontaneous emission (ASE) noise added by the amplifier remained constant. Furthermore, given the relatively low gain of the amplifier, the signal-ASE beating at the output of the receiver was negligible compared to the receiver noise.
The distribution network was simulated using a first span of standard single mode fibre (SSMF) that had a length of 80 km, a one-to-64 splitter (emulated by an 18 dB attenuator), and a second SSMF span with a 20 km length.
The coherent receiver was formed by an optical front-end where the state of polarization of the received signal was first controlled using a dynamic polarization tracker (DPT), which made the signal polarization match that of the local oscillator. The signal was then combined in a 90 -hybrid network with a 1 mW power CW laser (LD _ 2 ). The combined signals were photodetected and filtered before being differentially amplified. Analogue-to-digital conversion (ADC) was emulated by downsampling the signal to four samples per symbol, after which frequency domain chromatic dispersion (CD) compensation was performed. Afterwards, the synchronization of the signal was performed by the cross-correlation maximization method using an alternated synchronization sequence of 64 symbols. In order to reduce the overhead, this synchronization sequence was also employed for amplitude scaling and initial phase synchronization. After CD mitigation, synchronization, and scaling, the signal underwent a second downsampling process in order to get a single sample per symbol. Phase noise correction was performed by blind phase search operating on 32 symbol blocks [38]. In our simulations, we did not consider polarization mode dispersion (PMD) because, in contrast to CD, it does not significantly interact with nonlinear distortion and could be satisfactorily compensated in variable envelope modulations using, for example, the multiple modulus algorithm (MMA) [39]. The distorted constellations were then processed using the proposed HBC algorithm. For comparison purposes, we also present results considering maximum likelihood, as well as k-means, which are considered as benchmarks for linear and clustered detection, respectively.
Regarding the performance metric, we adopted the bit error rate (BER), which taking into account the lack of Gaussianity of the constellation point distribution, had to be estimated by error counting. In addition, we calculated the equivalent Q-factor derived from the BER according to: Q = 2 · e r f c 1 ( 2 B E R ) , where e r f c 1 denotes the inverse complementary error function.
Table 1 lists the most important simulation parameters.

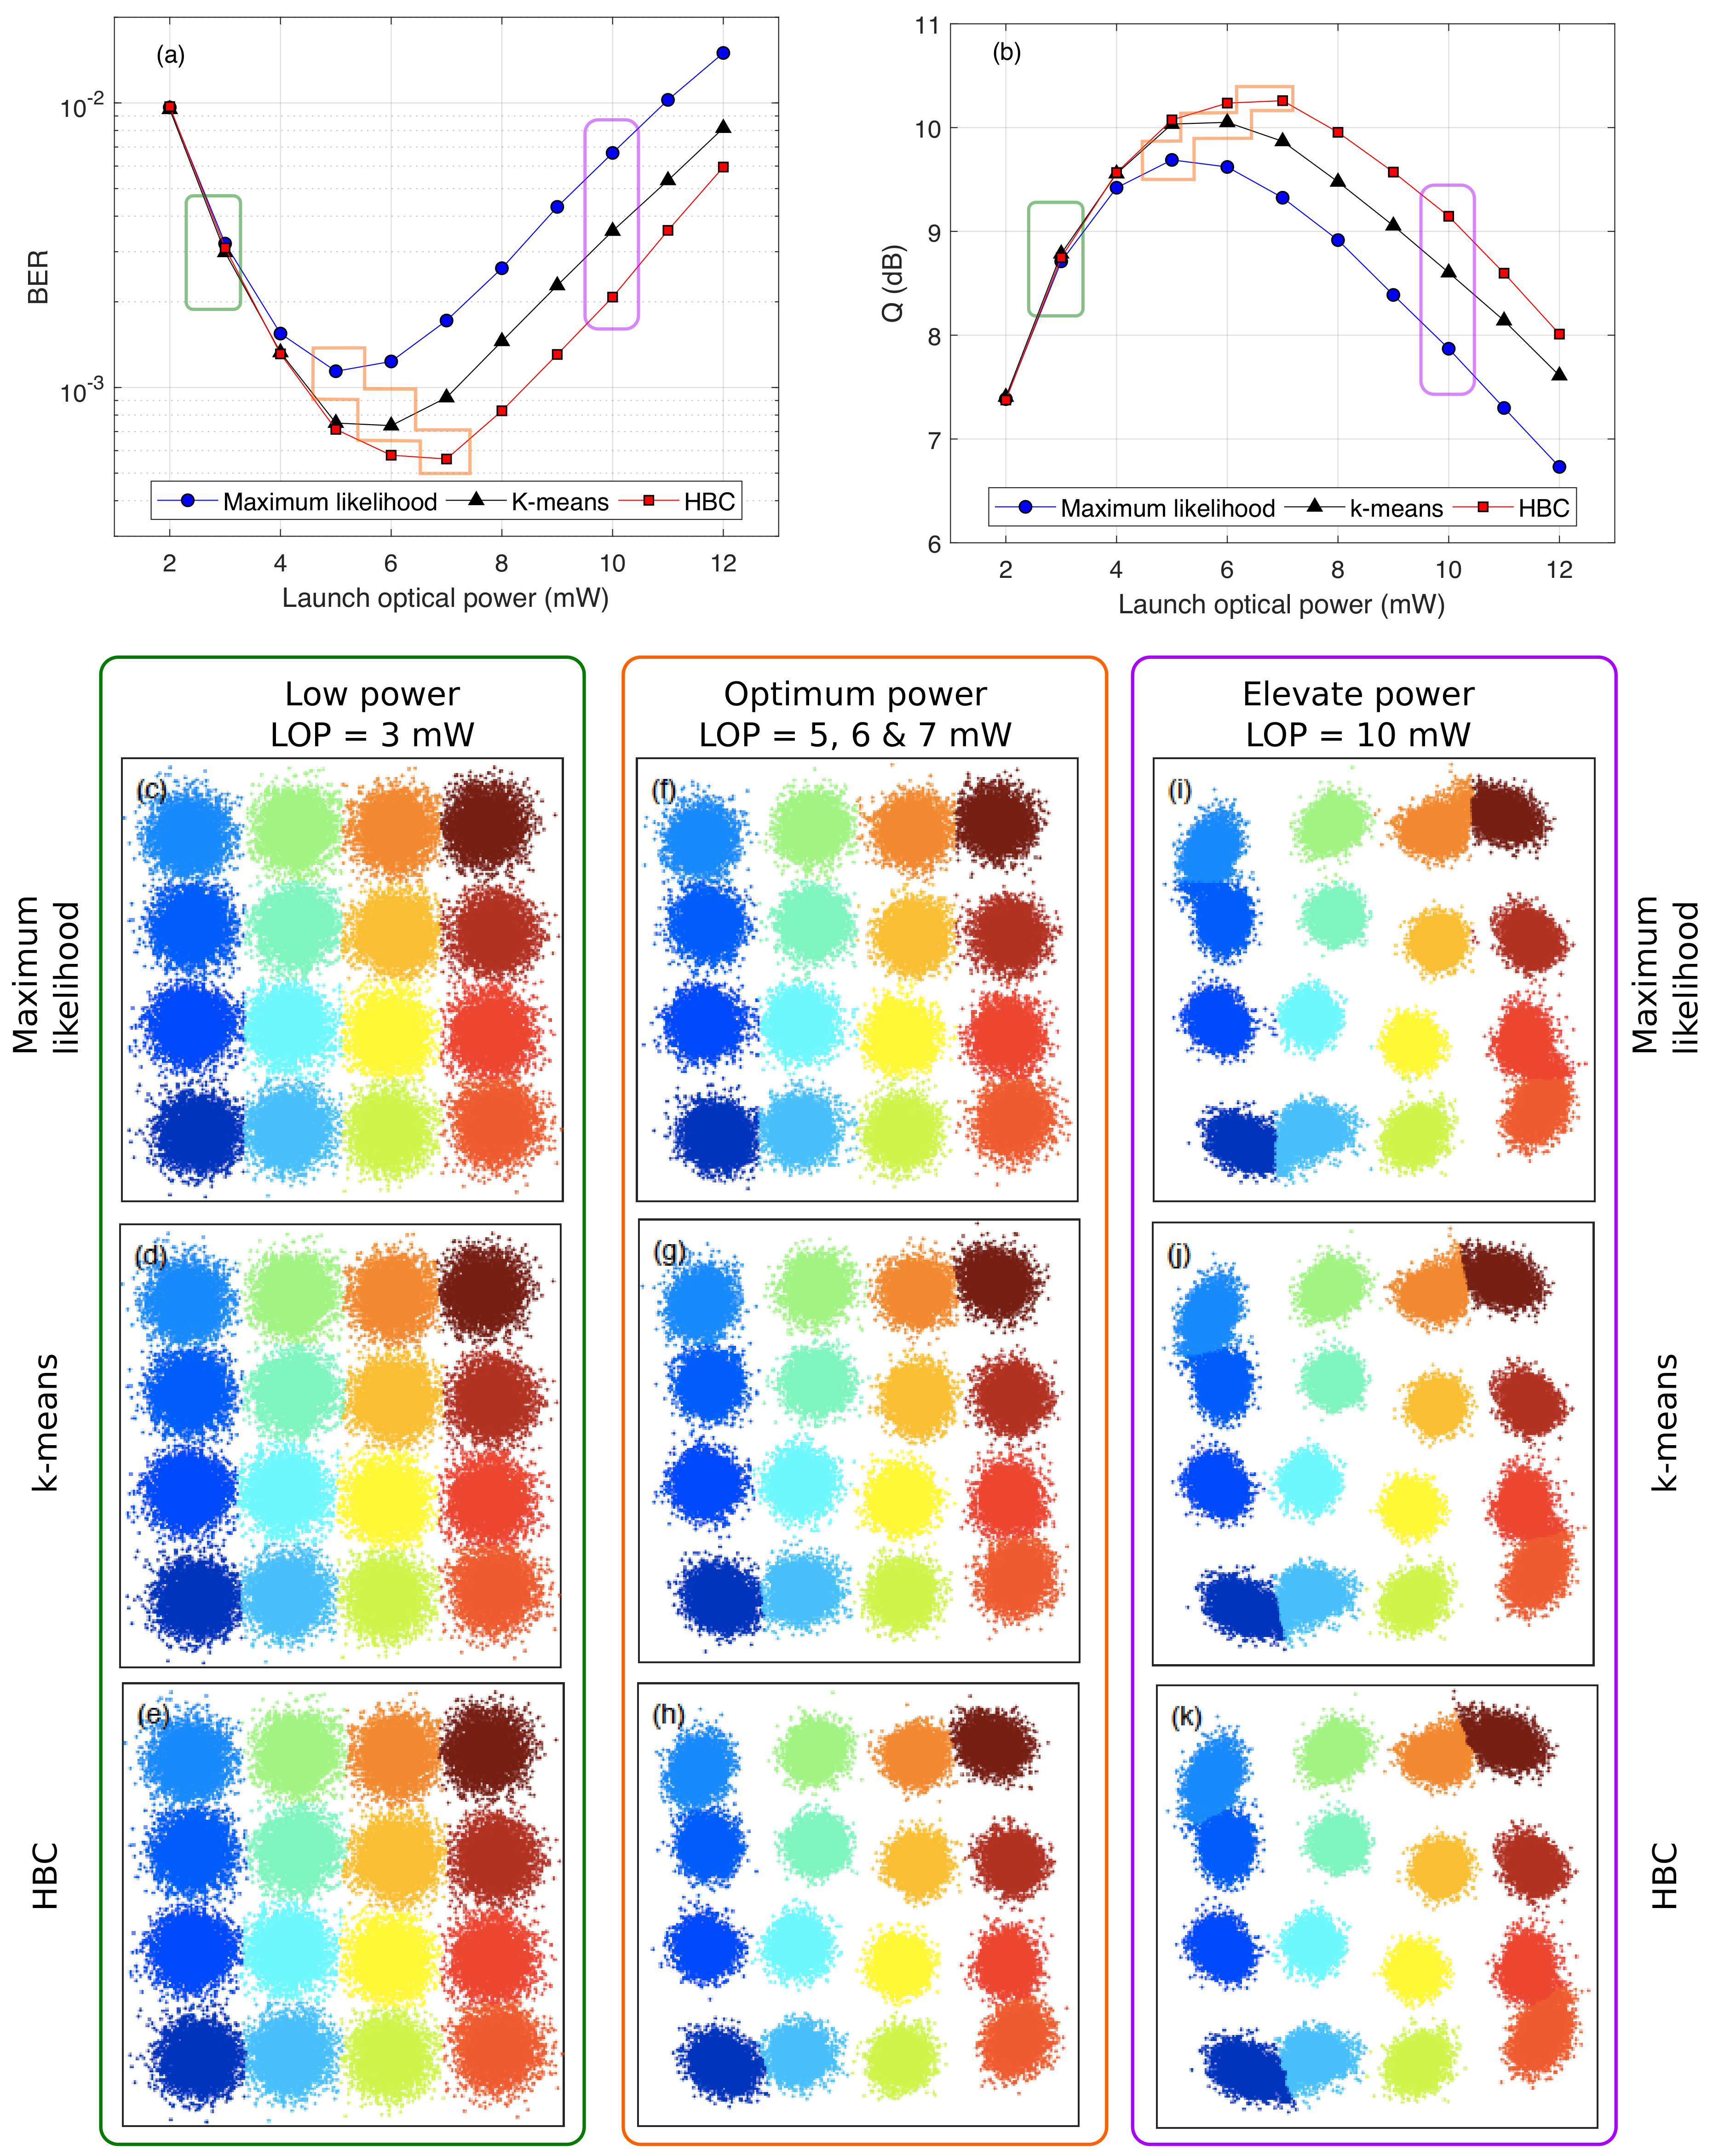
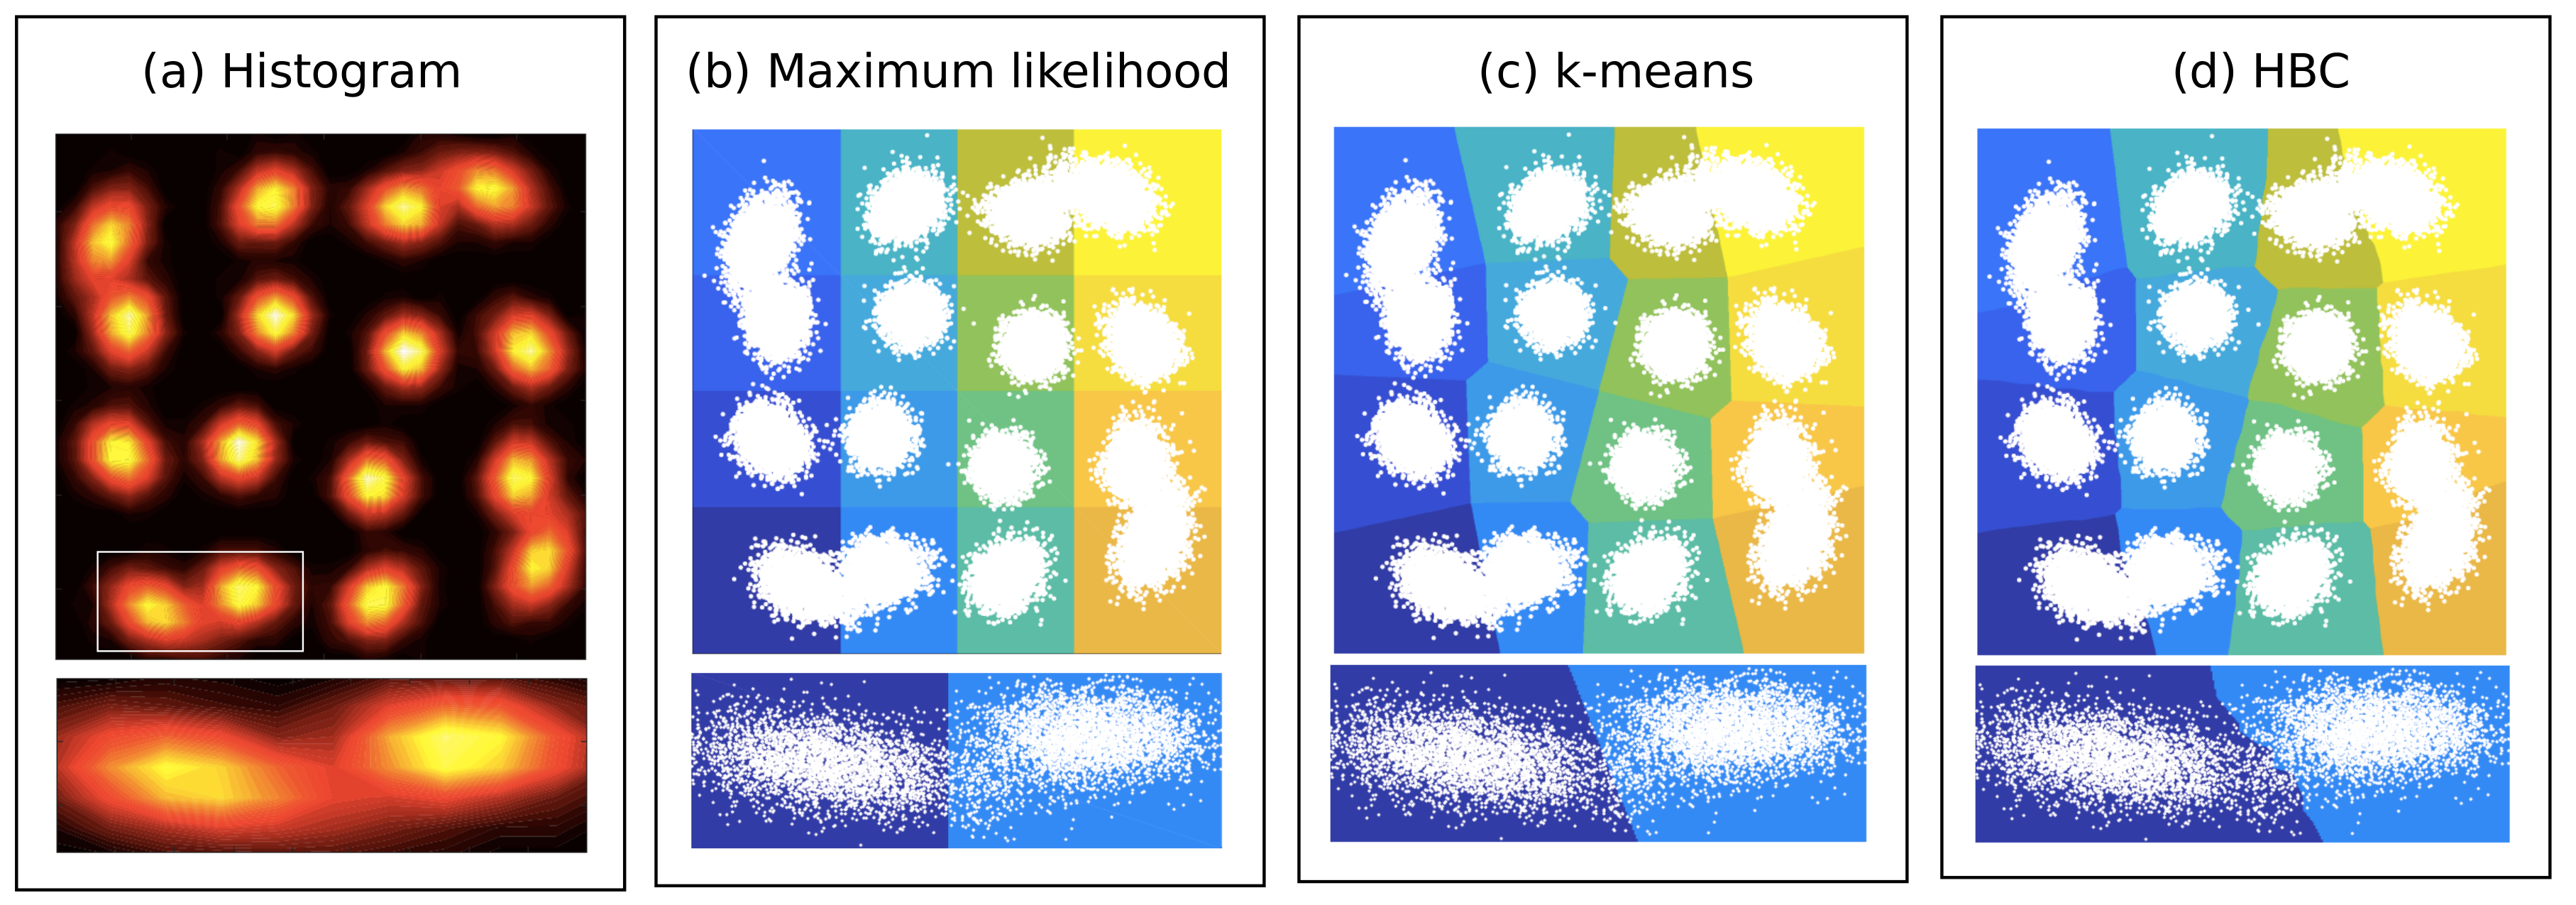
4. Results and Discussion

4.1. Performance Analysis

In order to analyse the performance of the proposed HBC algorithm, in Figure 3a,b, we show the BER and the corresponding Q-factor at launch optical powers ranging from 2 to 12 mW for the three different approaches: maximum likelihood detection, clustering using k-means, and the novel HBC algorithm. At low power levels, the performance of all three techniques improved (BER reduced and Q-factor increased) as the launch optical power was increased, which made sense since the additive noise of the photodetectors was dominant.
For high power levels, on the other hand, Kerr induced SPM was the main physical impairment, and consequently, increasing power led to higher BER and a lower Q-factor. Comparing the performance of maximum likelihood with k-means and HBC, it was clear that all of them converged for a low power level, while the latter two presented improved performances for high power levels. This was an indicator that k-means and HBC were indeed compensating nonlinear distortion and not any linear impairment such as residual phase noise or chromatic dispersion. These two clustering algorithms, however, showed different performances, for both medium and high power levels. It can be clearly observed that HBC outperformed k-means for launch optical powers above 5 mW, revealing that HBC could mitigate nonlinear distortion more efficiently than the traditional k-means clustering. As a result, the best achievable BER was reduced from 1.1 × 10 3 when using maximum likelihood and 0.8 × 10 3 when employing k-means to 0.6 × 10 3 in the case of HBC (orange polygon of Figure 3a). Regarding the Q-factor, numerical results showed an improvement of 0.53 dB with respect to the optimum performance of maximum likelihood and 0.23 dB when contrasted with the optimum of k-means (orange polygon of Figure 3b). The Q-factor enhancement was higher if, instead of comparing optimum performances, we looked at a fixed power level in the nonlinear regime. Thus, for 10 mW, HBC outperformed k-means by 0.51 dB and maximum likelihood by 1.22 dB (purple polygon of Figure 3b). Additionally, the optimum launch optical power where the trade-off between noise and SPM was held shifted towards a higher power level, from 5 mW in maximum likelihood to 6 and 7 mW for k-means and HBC, respectively.
A better understanding of the performance enhancement can be achieved by analysing the classified constellations (after undergoing maximum likelihood, k-means, or HBC) for different power levels. In particular, Figure 3c–e represents the classified constellations when using maximum likelihood, k-means, or HBC, respectively, for a launch optical power of 3 mW (green rectangle). Figure 3f–h shows the constellation for the optimum power levels, that is 5 mW for maximum likelihood, 6 mW for k-means, and 7 mW for HBC (orange polygon). The constellation degradation and classification for a relatively large power level, 10 mW, can be observed in Figure 3i–k (purple rectangle). Looking at the point dispersion for different power levels, e.g., 3, 5, and 10 mW, shown in the upper row, it can be seen that whereas for a low power level, the constellation shape remained, as the launch power increased, SPM distorted the constellation leading to non-rectangular constellations. The inner symbols seemed to be rotated clockwise, in contrast to the symbols in the periphery that were rotated counter-clockwise. In fact, all the symbols were rotated counter-clockwise by the Kerr effect, but the phase noise compensation stage in the DSP inverted the average rotation, resulting in some points (those with smaller rotation corresponding to lower power) being rotated in the opposite direction. Another feature to be noted is that the noise variance at low power levels looked higher than for moderate power levels, but since the main noise mechanisms were the thermal and shot noises of the photodetectors, the noise level was virtually the same for the three power levels. This is typical in power limited coherent systems because the optical power arriving at the photodetectors is mainly that of the local oscillator laser. The apparently lower noise was then a consequence of the higher signal power and of the power normalization performed before clustering was carried out. Comparing the performance of maximum likelihood, k-means, and HBC, the reader can observe that for low power levels, the classifications obtained by the three methods were essentially identical, which agreed with the fact that same BER and Q-factor values were yielded. This made sense because, in the absence of non linear distortion, maximum likelihood was the optimum detection scheme [40]. As the power level increased, so did the SNR, but SPM led to the aforementioned symbol rotation. Is in this case, the rectangular decision regions of maximum likelihood were not optimum any more, and clustering with non-rectangular boundaries fit the distorted data better. At even higher power levels, SPM led to more complicated cluster sizes where decision regions with linear boundaries, as those obtained using k-means, may result in sub-optimal classification.
The differences between the resultant decision regions using maximum likelihood, k-means, and HBC can be better observed in Figure 4, where to make the contrast more clear, data for a launch optical power of 10 mW were employed. First of all, we show the histogram of the received constellation in Figure 4a to demonstrate how the distortion especially affected the symbols with higher amplitude. A detailed view of two of the constellation points that were critically affected by SPM (identified by a white rectangle) can be seen under the constellation plot. As can be observed, the two clusters presented a complex shape, and therefore, an intricate border was necessary to classify them. Figure 4b shows the constellation of the received data superimposed on the decision regions calculated using maximum likelihood. As expected, the rectangular grid led to multiple constellation point to invade adjacent regions even for low power symbols. The zoom-in figure clearly reveals that the decision boundary was not optimal for the symbol distribution. When employing k-means clustering, more sophisticated regions were calculated, as shown in Figure 4c, and the low power constellation points were then correctly classified. For symbols in the constellation periphery, the straight boundaries of k-means, however, were not optimal. This point can be appreciated in the zoom-in. Finally, if we applied HBC, we obtained the decision regions represented in Figure 4d. At first glance, the decision regions were similar to those using k-means. For low power symbols, where SPM did not significantly affect the shape, but caused only a rotation (this can be corroborated in the histogram of Figure 4a), the boundaries were still straight lines. For higher power symbols, in contrast, the boundaries found by HBC were not straight lines any more. We can see a clear example of the curved boundaries in the detailed view, appreciating that the curved line matched better the cluster boundary expected from the histogram.

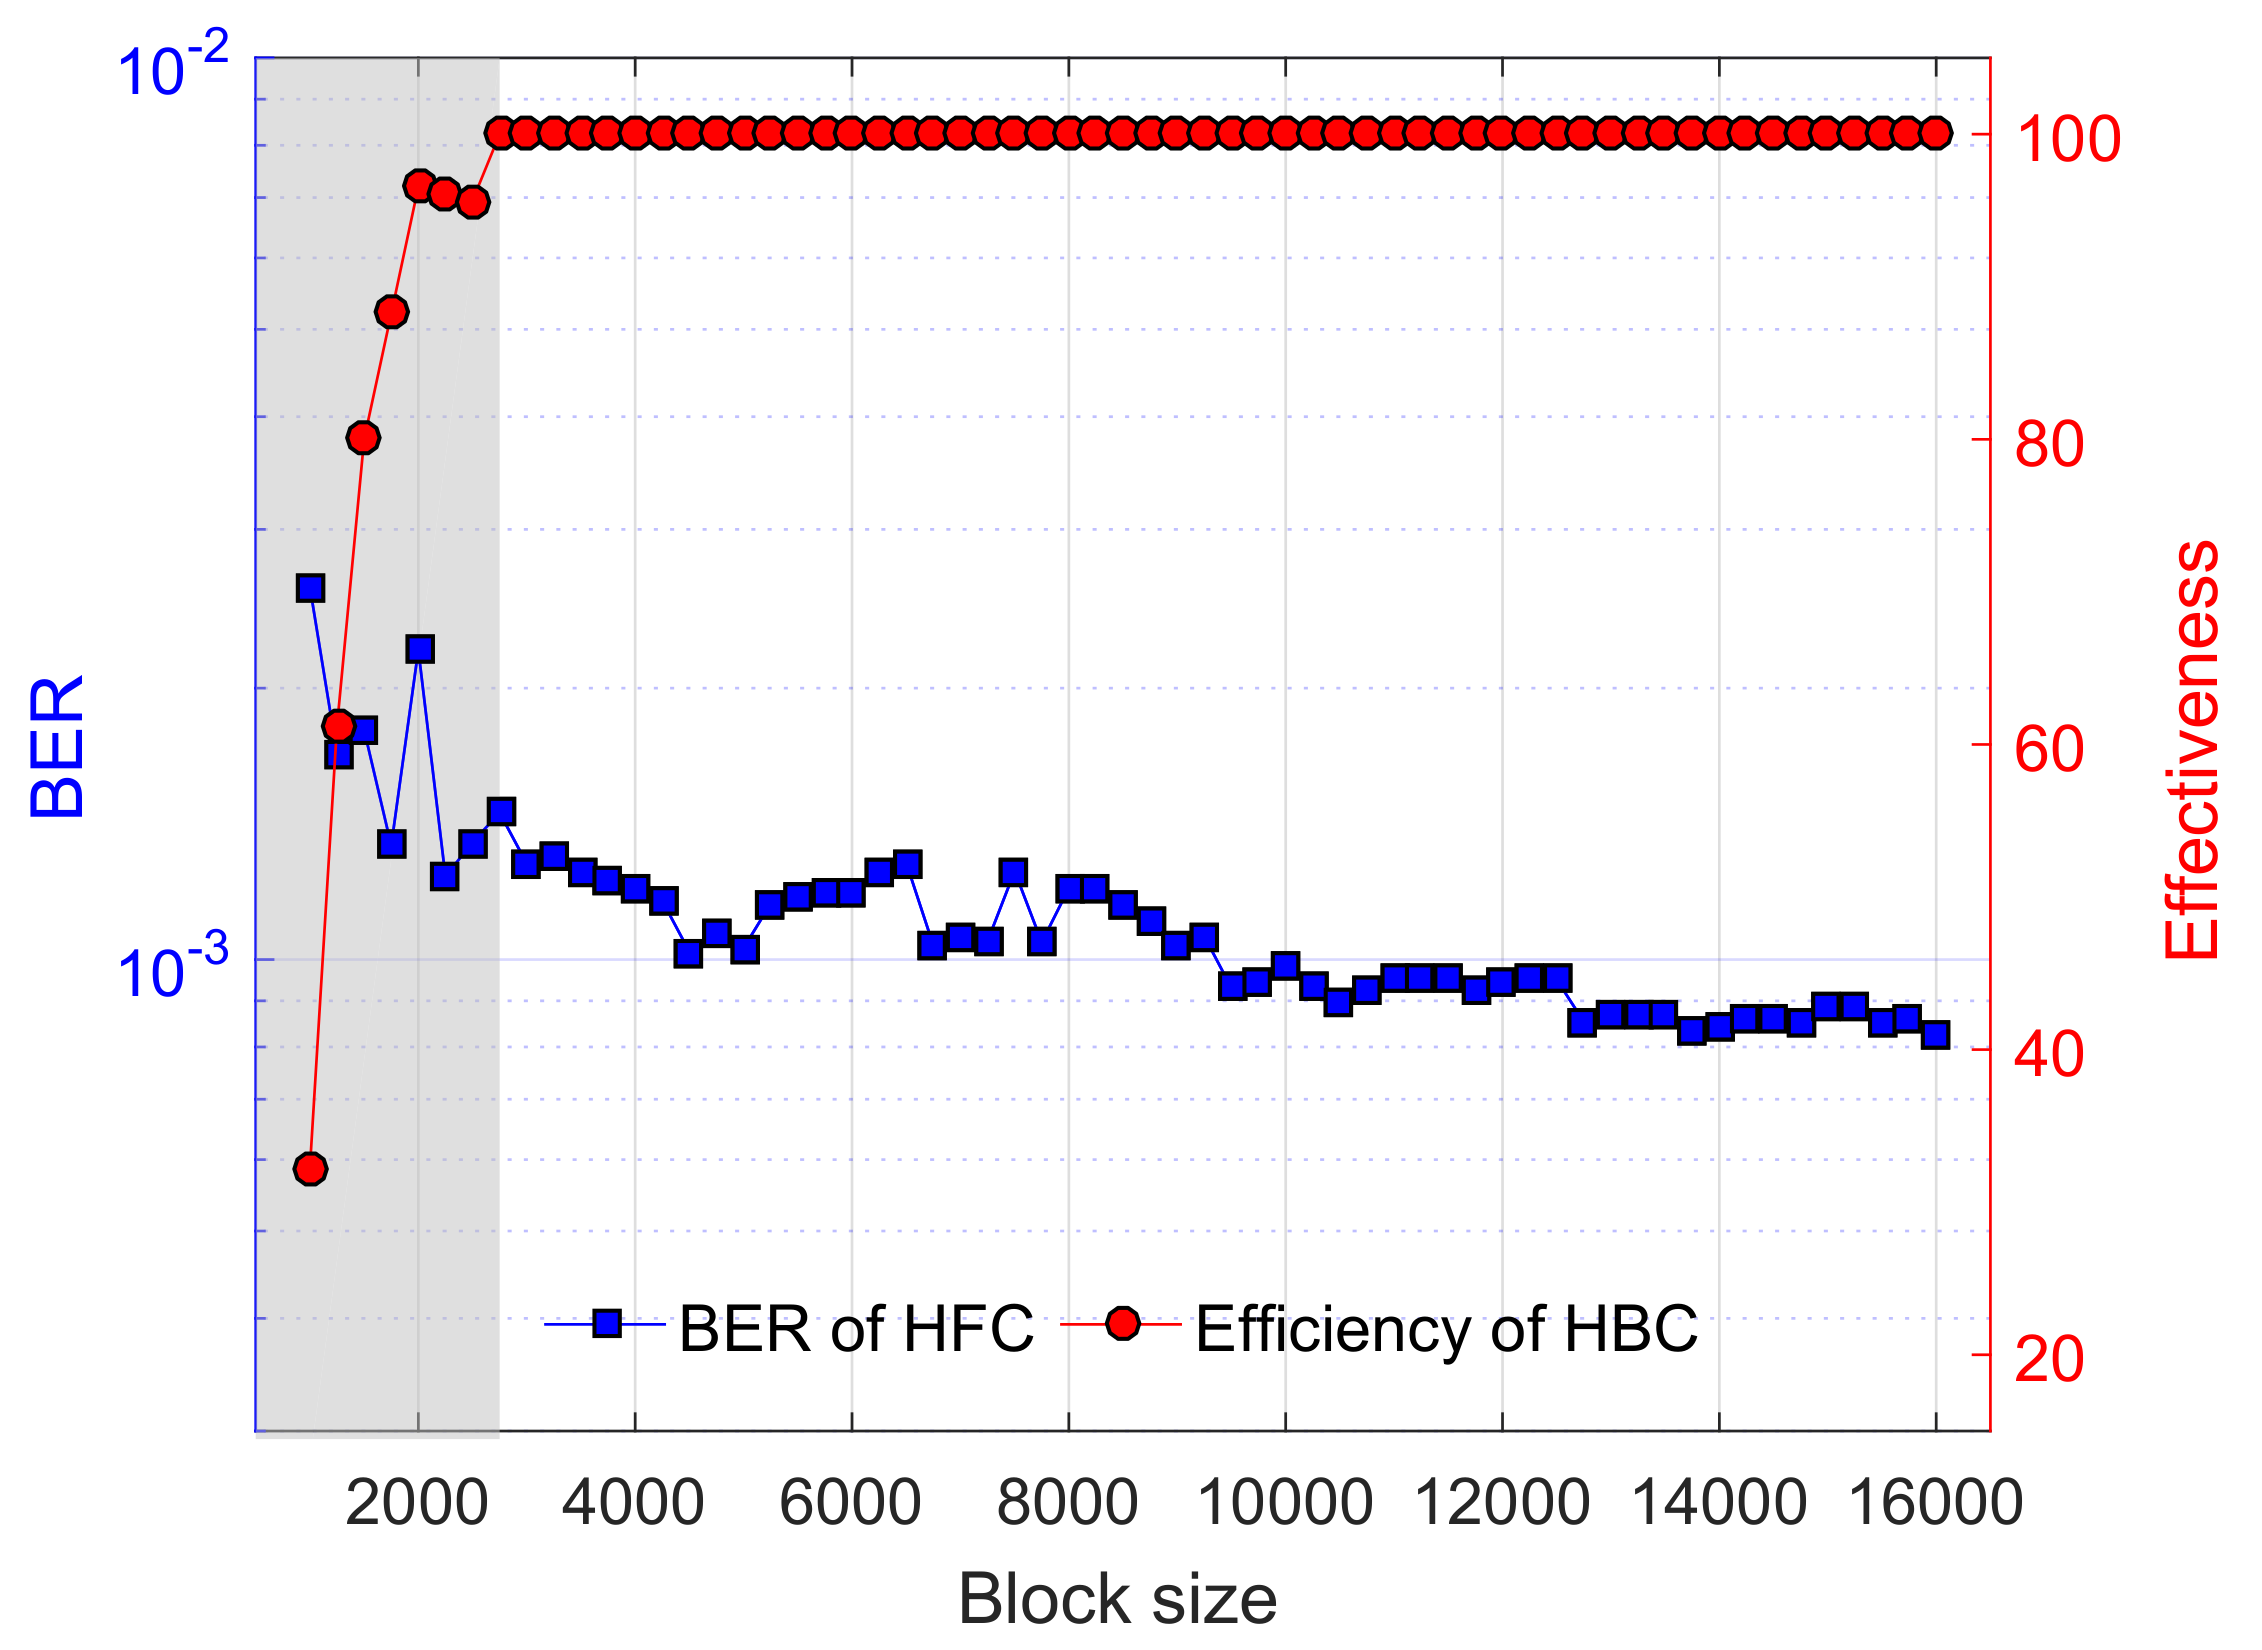
4.2. Block Size and Complexity Analysis

The proposed HBC algorithm, as already mentioned, can be regarded as a non-iterative density based clustering algorithm. The fact of not requiring iteration was of particular importance for real-time operation since, in principle, it implies a fixed processing time. The performance of the algorithm, however, depended on the block size employed to estimate the histogram. To evaluate the minimum block size requirement, Figure 5 shows the BER in terms of the block size. As can be seen after a short erratic initial stage, the BER decreased, getting a relatively stable value for block sizes longer than 13,000. The evaluation of the performance for small block sizes was especially difficult because of the high variance consequence of the stochastic nature of the method. We observed that the variance of the BER reduced as the block size increased, as was expected for unbiased statistics. For this reason, to achieve a trade-off between accuracy and processing time, the data shown in Figure 5 were obtained by averaging results for a variable number of runs, up to 100 for 1000 symbol block size and five for 16,000 symbol blocks. In fact, we perceived that when applying HBC for short block sizes, for certain sets of data, the algorithm did not converge to a reasonable partition. In order to quantify this effect, for each block size, we counted the number of runs that failed, and we calculated the efficiency as the percentage of runs that led to an acceptable classification. This region of forbidden block size that, according to Figure 5, spanned up to 2250, should then be avoided to get an acceptable performance. In fact, for applications requiring low latency, we can choose the minimum size of 2250, whereas when latency is not so critical, a higher number of symbols can be employed.
Another important point to discuss is the complexity of the proposed algorithm. In order to evaluate it, we can split the algorithm into two main steps: on the one hand, a first stage when the 2D histogram was built and the high density points were found and, on the other hand, the stage when each point was associated with a certain cluster. The histogram can be built in different ways, so it was expected to be machine dependent. A possible solution was, for instance, to find the indexes of the bins for each symbol and, then, update the value of the corresponding bin. That is, assuming that we had N b bins and that the maximum and the minimum of the histogram were M and m, the indexes corresponding to the kth complex symbol s [ k ] = s i [ k ] + j · s q [ k ] were:
i n d i [ k ] = N b + 1 M m · s i [ k ] m   and   i n d q [ k ] = N b + 1 M m · s q [ k ] m .
Once the indexes were found, the count of the bin indicated by i n d i and i n d q , n c o u n t k 1 was updated. Hence:
n c o u n t k ( i n d i , i n d q ) = n c o u n t k 1 ( i n d i , i n d q ) + 1 .
Therefore, in this first stage, the processing of each symbol required five floating-point operations (two to calculate i n d i , two to calculate i n d q , and another one to update the bin count). In order to build the histogram of a block of N s y m symbols, the total number of FLOPs was then 5 · N s y m , and in conclusion, its complexity was O ( N s y m ) . The finding of the high density points required the sorting of the values of all bins, that is the sorting of N b 2 points. Sorting algorithms, such as block based or binary tree, present a complexity of O ( N b 2 log N b 2 ) . Therefore, the complexity will depend on the number of symbols and employed bins. In our case, we employed 100,000 symbols and 40 bins, and as a consequence, the histogram building process was the dominant term. The complexity of the second stage, that is finding the closest high density point to a given symbol, depends on the number of high density points. Furthermore, this number will vary depending on the shape of the clusters. In particular, the noisier the clusters are, the larger the areas of relative high density and the number of points with high density are. If we assume that we have a set of S h d of N h d points of high density, then for each symbol, we need to calculate N h d distances (indeed, it is possible to calculate the square of the distance):
D = d 2 [ k ] = ( s i [ k ] u i [ m ] ) 2 + ( s q [ k ] u q [ m ] ) 2 ,   where   u [ m ] = u i [ m ] + j · u q [ m ] S h d .
This distance required five real valued operations, as we needed to calculate 2 subtractions, 2 multiplications, and 1 addition. The complexity of this stage was then O ( N s · N h d ) , which was higher than that of k-means, where the number of distances to be calculated corresponded to the number of clusters. However, it should be noted that this comparison only considered the distance calculation and not the number of operation to find the centroids. The complexity of HBC was also higher than that of simple nonlinear rotation, which was as small as two real valued operations.

4.3. Discussion

In this paper, we tested the proposed HBC algorithm in a single channel coherent LR-PON, where the transmitted signal was distorted by the combination of SPM and the noise added by the receiver. As can be appreciated in the constellations of Figure 3c–k, the obtained symbols showed the characteristic spiral-like constellations that were prone to be clustered. The high distribution losses, which included the fibre and the splitting losses, however, made the constellations to have noise and the cluster borders to appear blurred. This was not the case of WDM systems, where the lack of splitters leads to higher received power and the subsequent reduction of the receiver noise impact. Indeed, for the configuration considered in this work, the launch optical power had to be increased well above the optimum power in order for the XPM and FWM to cause a distortion comparable to the excess splitting loss. In regards to dual polarization operation, the proposed algorithm could be modified to account for both polarizations simultaneously. This dimensionality increase, however, would lead to more complicated processing.
The proposed algorithm aimed to compensate the distortion in simple LR-PON systems without requiring high computational cost and a training sequence. In this sense, HBC can be considered as a trade-off between performance and complexity. Indeed, we can note that HBC outperformed the nonlinear phase rotation at the cost of higher complexity and latency. On the other hand, HBC presented a slightly worse tolerance to nonlinear distortion than other more sophisticated algorithms (for example, 2.5 dB of HBC vs. 3 dB of EM [37]), but without requiring initialization and the iterative process.
Another point to be considered is the employed filters, in our simulations fourth order Bessel filters. These filters emulate the bandwidth limitation of both the transmitter electronics and PD response and remove part of the out-of-band noise. It is envisaged that the adoption of more sophisticated filters, Nyquist filtering in particular, could improve the performance, as they increase the SNR, thus making the clusters easier to discriminate.

5. Conclusions

In this paper, we proposed a novel clustering algorithm based on histograms, which we denominated histogram based clustering. The algorithm successfully compensated the distortion caused by Kerr mediated SPM in coherent LR-PONs with a transmission distance of 100 km and a splitting ratio of 64. The numerical results obtained using VPI Transmission Maker-MATLAB co-simulation showed that HBC improved the Q-factor with respect to maximum likelihood and k-means clustering by 0.53 dB and 0.23 dB, respectively. We also showed that the proposed algorithm could operate on blocks of 2500 symbols, but that optimum performance was obtained for blocks of 12,000 symbols.

Author Contributions

Conceptualization, I.A., E.G., and M.L.F.A.; methodology, I.A. and E.G.; software, I.A. and G.d.O.; validation, I.A. and M.L.F.A; formal analysis, J.W., J.L.P., J.D.M., and E.A.M.F.; resources, I.A., E.G., L.B., and M.L.F.A.; writing–original draft preparation, I.A., J.L.P. and E.A.M.F.; writing–review and editing, I.A., E.G., G.d.O., J.W., J.L.P., J.D.M., E.A.M.F., L.B., and M.L.F.A; visualization, I.A., E.G., G.d.O., J.W., J.L.P., J.D.M., E.A.M.F., L.B., and M.L.F.A; supervision, I.A. and M.L.F.A.; project administration, I.A.; funding acquisition, I.A., E.G., L.B., and M.L.F.A. All authors have read and agreed to the published version of the manuscript.

Funding

This research was funded by the National Council for Scientific and Technological Development (CNPQ) of Brazil, the EU Horizon 2020 Research and Innovation Programme through the Marie Sklodowska-Curie under Grant 713567, the Science Foundation of Ireland, and the European Regional Development Fund under Grant 13/RC/2077.

Conflicts of Interest

The authors declare no conflict of interest.

Abbreviations

The following abbreviations are used in this manuscript:
PONPassive optical network
LRLong reach
DSPDigital signal processor
SPMSelf-phase modulation
XPMCross-phase modulation
FWMFour wave mixing
QAMQuadrature amplitude modulation
DBPDigital back-propagation
IVSTFInverse Volterra series transfer function
SVMSupport vector machine
DBSCANDensity based spatial clustering of applications with noise
HBCHistogram based clustering
LDLaser diode
CWContinuous-wave
DP-MZMDual parallel Mach–Zehnder modulator
EDFAErbium doped fibre amplifier
ASEAmplified spontaneous emission
DACDigital to analogue converter
SSMFStandard single mode fibre
DPTDynamic polarization tracker
ADCAnalogue-to-digital converter
BERBit error rate
SNRSignal-to-noise ratio

References

  1. Nesset, D. PON roadmap. IEEE/OSA J. Opt. Commun. Netw. 2017, 9, A71–A76. [Google Scholar] [CrossRef]
  2. Effenberger, F.J. Industrial trends and roadmap of access. J. Lightwave Technol. 2017, 35, 1142–1146. [Google Scholar] [CrossRef]
  3. Hsu, D.Z.; Wei, C.C.; Chen, H.Y.; Chen, J.; Yuang, M.C.; Lin, S.H.; Li, W.Y. 21 Gb/s after 100 km OFDM long reach PON transmission using a cost-effective electro-absorption modulator. Opt. Express 2010, 18, 27758–27763. [Google Scholar] [CrossRef] [PubMed]
  4. Chen, M.; He, J.; Chen, L. Real-time optical OFDM long reach PON system over 100 km SSMF using a directly modulated DFB laser. J. Opt. Commun. Netw. 2014, 6, 18–25. [Google Scholar] [CrossRef]
  5. Lavery, D.; Ionescu, M.; Makovejs, S.; Torrengo, E.; Savory, S.J. A long reach ultra-dense 10 Gbit/s WDM-PON using a digital coherent receiver. Opt. Express 2010, 18, 25855–25860. [Google Scholar] [CrossRef] [PubMed]
  6. Lavery, D.; Maher, R.; Millar, D.S.; Thomsen, B.C.; Bayvel, P.; Savory, S.J. Digital coherent receivers for long reach optical access networks. J. Lightwave Technol. 2013, 31, 609–620. [Google Scholar] [CrossRef]
  7. Liu, X.; Effenberger, F. ONU-dependent dispersion pre-compensation at OLT for high speed wide-coverage PON. In Proceedings of the 2015 IEEE Global Communications Conference (GLOBECOM), San Diego, CA, USA, 6–10 December 2015; pp. 1–5. [Google Scholar]
  8. Kikuchi, K. Fundamentals of coherent optical fibre communications. J. Lightwave Technol. 2016, 34, 157–179. [Google Scholar] [CrossRef]
  9. Kikuchi, K.; Tsukamoto, S. Evaluation of sensitivity of the digital coherent receiver. J. Lightwave Technol. 2008, 26, 1817–1822. [Google Scholar] [CrossRef]
  10. Ip, E.M.; Kahn, J.M. Fibre impairment compensation using coherent detection and digital signal processing. J. Lightwave Technol. 2009, 28, 502–519. [Google Scholar] [CrossRef]
  11. Vacondio, F.; Rival, O.; Simonneau, C.; Grellier, E.; Bononi, A.; Lorcy, L.; Antona, J.C.; Bigo, S. On nonlinear distortions of highly dispersive optical coherent systems. Opt. Express 2012, 20, 1022–1032. [Google Scholar] [CrossRef]
  12. Agrawal, G.P. Nonlinear fibre optics. In Nonlinear Science at the Dawn of the 21st Century; Springer: Berlin, Germany, 2000; pp. 195–211. [Google Scholar]
  13. Gordon, J.P.; Mollenauer, L.F. Phase noise in photonic communications systems using linear amplifiers. Opt. Lett. 1990, 15, 1351–1353. [Google Scholar] [CrossRef] [PubMed]
  14. Lau, A.P.T.; Kahn, J.M. Signal design and detection in presence of nonlinear phase noise. J. Lightwave Technol. 2007, 25, 3008–3016. [Google Scholar] [CrossRef]
  15. Da Ros, F.; Sackey, I.; Elschner, R.; Richter, T.; Meuer, C.; Nölle, M.; Jazayerifar, M.; Petermann, K.; Peucheret, C.; Schubert, C. Kerr nonlinearity compensation in a 5× 28-GBd PDM 16-QAM WDM system using fibre based optical phase conjugation. In Proceedings of the 2014 The European Conference on Optical Communication (ECOC), Cannes, France, 21–25 September 2014; pp. 1–3. [Google Scholar]
  16. Ip, E.; Kahn, J.M. Compensation of dispersion and nonlinear impairments using digital backpropagation. J. Lightwave Technol. 2008, 26, 3416–3425. [Google Scholar] [CrossRef]
  17. Millar, D.S.; Makovejs, S.; Behrens, C.; Hellerbrand, S.; Killey, R.I.; Bayvel, P.; Savory, S.J. Mitigation of fibre nonlinearity using a digital coherent receiver. IEEE J. Sel. Top. Quantum Electron. 2010, 16, 1217–1226. [Google Scholar] [CrossRef]
  18. Pan, J.; Cheng, C.H. Nonlinear electrical predistortion and equalization for the coherent optical communication system. J. Lightwave Technol. 2011, 29, 2785–2789. [Google Scholar] [CrossRef]
  19. Giacoumidis, E.; Aldaya, I.; Jarajreh, M.A.; Tsokanos, A.; Le, S.T.; Farjady, F.; Jaouën, Y.; Ellis, A.D.; Doran, N.J. Volterra based reconfigurable nonlinear equalizer for coherent OFDM. IEEE Photonics Technol. Lett. 2014, 26, 1383–1386. [Google Scholar] [CrossRef]
  20. Alpaydin, E. Introduction to Machine Learning; MIT Press: Cambridge, MA, USA, 2009. [Google Scholar]
  21. Zibar, D.; Piels, M.; Jones, R.; Schäeffer, C.G. Machine learning techniques in optical communication. J. Lightwave Technol. 2015, 34, 1442–1452. [Google Scholar] [CrossRef] [Green Version]
  22. Giacoumidis, E.; Lin, Y.; Wei, J.; Aldaya, I.; Tsokanos, A.; Barry, L. Harnessing machine learning for fibre-induced nonlinearity mitigation in long-haul coherent optical OFDM. Future Internet 2019, 11, 2. [Google Scholar] [CrossRef] [Green Version]
  23. Khan, F.N.; Lu, C.; Lau, A.P.T. Machine learning methods for optical communication systems. In Signal Processing in Photonic Communications; Optical Society of America: Washington, DC, USA, 2017; p. SpW2F-3. [Google Scholar]
  24. Mata, J.; De Miguel, I.; Duran, R.J.; Merayo, N.; Singh, S.K.; Jukan, A.; Chamania, M. Artificial intelligence (AI) methods in optical networks: A comprehensive survey. Opt. Switch. Netw. 2018, 28, 43–57. [Google Scholar] [CrossRef]
  25. Ahmad, S.T.; Kumar, K.P. Radial basis function neural network nonlinear equalizer for 16-QAM coherent optical OFDM. IEEE Photonics Technol. Lett. 2016, 28, 2507–2510. [Google Scholar] [CrossRef]
  26. Chen, E.; Tao, R.; Zhao, X. Channel equalization for OFDM system based on the BP neural network. In Proceedings of the 2006 8th international Conference on Signal Processing, Guilin, China, 16–20 November 2006; Volume 3. [Google Scholar]
  27. Jarajreh, M.A.; Giacoumidis, E.; Aldaya, I.; Le, S.T.; Tsokanos, A.; Ghassemlooy, Z.; Doran, N.J. Artificial neural network nonlinear equalizer for coherent optical OFDM. IEEE Photonics Technol. Lett. 2014, 27, 387–390. [Google Scholar] [CrossRef]
  28. Nguyen, T.; Mhatli, S.; Giacoumidis, E.; Van Compernolle, L.; Wuilpart, M.; Mégret, P. Fibre nonlinearity equalizer based on support vector classification for coherent optical OFDM. IEEE Photonics J. 2016, 8, 1–9. [Google Scholar] [CrossRef]
  29. Wang, D.; Zhang, M.; Li, Z.; Cui, Y.; Liu, J.; Yang, Y.; Wang, H. Nonlinear decision boundary created by a machine learning based classifier to mitigate nonlinear phase noise. In Proceedings of the 2015 European Conference on Optical Communication (ECOC), Valencia, Spain, 27 September–1 October 2015; pp. 1–3. [Google Scholar]
  30. Giacoumidis, E.; Mhatli, S.; Nguyen, T.; Le, S.; Aldaya, I.; McCarthy, M.; Eggleton, B. Kerr-induced nonlinearity reduction in coherent optical OFDM by low complexity support vector machine regression based equalization. In Proceedings of the 2016 Optical Fibre Communications Conference and Exhibition (OFC), Anaheim, CA, USA, 20–24 March 2016; pp. 1–3. [Google Scholar]
  31. Zhang, J.; Chen, W.; Gao, M.; Shen, G. K-means-clustering based fibre nonlinearity equalization techniques for 64-QAM coherent optical communication system. Opt. Express 2017, 25, 27570–27580. [Google Scholar] [CrossRef] [PubMed]
  32. Li, M.; Yu, S.; Yang, J.; Chen, Z.; Han, Y.; Gu, W. Nonparameter nonlinear phase noise mitigation by using M-ary support vector machine for coherent optical systems. IEEE Photonics J. 2013, 5, 7800312. [Google Scholar] [CrossRef]
  33. Boada, R.; Borkowski, R.; Monroy, I.T. Clustering algorithms for Stokes space modulation format recognition. Opt. Express 2015, 23, 15521–15531. [Google Scholar] [CrossRef] [Green Version]
  34. Pakala, L.; Schmauss, B. Non-linear mitigation using carrier phase estimation and K-means clustering. In Proceedings of the Photonic Networks; 16. ITG Symposium, Leipzig, Germany, 7–8 May 2015; pp. 1–3. [Google Scholar]
  35. Giacoumidis, E.; Aldaya, I.; Wei, J.; Sanchez, C.; Mrabet, H.; Barry, L.P. Affinity propagation clustering for blind nonlinearity compensation in coherent optical OFDM. Proceedings of CLEO: Science and Innovations, San Jose, CA, USA, 15–17 May 2018; p. STh1C-5. [Google Scholar]
  36. Giacoumidis, E.; Lin, Y.; Barry, L.P. Fibre Nonlinear Compensation Using Machine Learning Clustering. In Proceedings of the 56th ICREIT conference, London, UK, 18–19 January 2019; pp. 1–4. [Google Scholar]
  37. Zibar, D.; Winther, O.; Franceschi, N.; Borkowski, R.; Caballero, A.; Arlunno, V.; Schmidt, M.N.; Gonzales, N.G.; Mao, B.; Ye, Y.; et al. Nonlinear impairment compensation using expectation maximization for dispersion managed and unmanaged PDM 16-QAM transmission. Opt. Express 2012, 20, B181–B196. [Google Scholar] [CrossRef] [Green Version]
  38. Pfau, T.; Hoffmann, S.; Noé, R. Hardware-efficient coherent digital receiver concept with feedforward carrier recovery for M-QAM constellations. J. Lightwave Technol. 2009, 27, 989–999. [Google Scholar] [CrossRef]
  39. Yang, J.; Werner, J.J.; Dumont, G.A. The multimodulus blind equalization and its generalized algorithms. IEEE J. Sel. Areas Commun. 2002, 20, 997–1015. [Google Scholar] [CrossRef]
  40. Lathi, B.P. Modern Digital and Analogue Communication Systems; Oxford University Press, Inc.: Oxford, UK, 1998. [Google Scholar]
Figure 1. Flow diagram of the proposed clustering algorithm. (a) Distorted input 16-QAM constellation. (b) Calculated 2D histogram. (c) Optimum boundaries superimposed on the 2D histogram. (d) Boundaries for each cluster on top of the received distorted constellation. (e) Classified constellation.
Applsci 10 00152 g001
Figure 2. Block diagram of the simulated coherent LR-PON system. S/P: serial-to-parallel conversion. DAC: digital-to-analogue converter. LD: laser diode. DP-MZM: dual parallel Mach–Zehnder modulator. EDFA: erbium doped fibre amplifier. VOA: variable optical attenuator. SSMF: standard single mode fibre. DPT: Dynamic polarization tracker. LPF: low pass filter. ADC: analogue-to-digital converter.
Applsci 10 00152 g002
Figure 3. Performance of the proposed. HBC compared to that of maximum likelihood and k-means in terms of (a) BER and (b) effective Q-factor derived from BER. (c,d,e) Classified constellations using maximum likelihood, k-means, and HBC, respectively, for a launch optical power of 3 mW. Classified constellations at optimum launch optical powers for the different detection schemes: (f) 5 mW for maximum likelihood, (g) 6 mW for k-means, and (h) 7 mW for HBC. (i,j,k) Classified constellations at elevated launched optical power (10 mW) for maximum likelihood detection, k-means, and HBC, respectively.
Applsci 10 00152 g003
Figure 4. Analysis of the decision regions (data are for a launch optical power of 10 mW). (a) Histogram of the received constellation. (b) Rectangular shaped decision regions obtained using maximum likelihood. (c) Linear decision regions after k-means clustering and (d) after HBC. In (bd), the received constellations are superimposed on the decision regions. In addition, for all cases, we included a detailed section of the lower left constellation, corresponding to the white rectangle in (a).
Applsci 10 00152 g004
Figure 5. BER in terms of the processed block size alongside with the efficiency of HBC for a power level of 7 mW at which optimum performance is achieved for HBC. For comparison purposes, the BER obtained using maximum likelihood is also included.
Applsci 10 00152 g005
Table 1. Parameters used in the simulation.
System Parameters
Laser linewidth0.5 MHzFibre lengths (L 1 ,L 2 )80 km, 0–20 km
Laser power1 mWFibre attenuation0.2 dB
MZM insertion loss6 dBFibre chromatic dispersion16 ps/nm/km
Amplifier gain20 dBFibre PMD3.16 fs / km
Amplifier noise figure4 dBNonlinear coefficient ( γ )1.3·W 1 ·km 1
Attenuator20 dBFibre effective area80 μ m 2
PD thermal noise density10 pA/ H z Electrical filter bandwidth10.5 GHz
PD responsivity1 W/AElectrical RX filter order4
Signal parameters
Modulation format16-QAMNo. of synchronization symbols64
Electrical TX filter4th-order BesselBit rate56 Gbps
Simulation parameters
Number of simulated symbols16,384Sampling rate 8.96 × 10 11 s−1

