Abstract
In this study, we predicted the structural behavior of a track-bridge and a bridge based on the expected increases in future train speeds by modeling the Yeongjong Bridge (a part of the Incheon International Airport Expressway in Korea). To verify the train’s safe operation, we performed a three-dimensional (3D) numerical analysis using full-scale bridge modeling. The rail-girder interaction force generated at one end of the direct fixation track of Yeongjong Bridge during train operations was evaluated by taking field measurements of the vertical displacements of the rail and girder at the center and end of a track girder. We further compared our predictions with various field measurements to evaluate the dynamic behavior of the entire Yeongjong Bridge.
1. Introduction
The Yeongjong Bridge is a long-span railway with various bridge types and unusual track–bridge interaction systems. Therefore, experimental and analytical studies on track–bridge interactions are needed to evaluate train safety. Recently, several experimental and analytical studies on the dynamic behavior of track bridges have been conducted to ensure the safety of train operations. Gou et al. presented an experimental study on the dynamic effects of moving trains on a long-span railway consisting of continuous beam bridges [1]. Choi investigated the influence of the track support stiffness on the dynamic wheel–rail forces for a ballasted track [2].
In analytical studies, Olmos and Astiz evaluated the riding comfort and vehicle dynamic response of trains traveling over bridges, and developed an efficient, nonlinear dynamic interaction model of the train–track–bridge system [3]. Lou et al. based their study on the obvious differences in flexural rigidity between rails and bridges, and presented a rail–bridge coupling element using unequal lengths [4].
Ham et al. studied how to prevent the deformation of track-integrated systems to improve safety through numerical analysis [5]. Song et al. proposed a new finite element model for the three-dimensional finite element analysis of high-speed train–bridge interactions [6]. Wang et al. presented and established a numerical model to analyze the effects of car body vehicle model flexibility on the dynamic response of a train–bridge system [7]. Zhang et al. proposed a dynamic analysis model for a train–bridge interaction system [8].
In this paper, dynamic analyses, including field measurements taken on the Yeongjong Bridge track–bridge, are presented with respect to train speed.
The Yeongjong Bridge has a direct fixation track structure. Moreover, the structure supporting the rails is a simple beam structure consisting of steel plate girders. The rails fixed by the direct fixation rail fastening system on the upper surface of the simple beam upper flange are directly affected by the behavior of the track girders, which causes the level of displacement of the rail to be similar to that of the track girders. A plate spring type fastener and control packing are installed through adjustable pads, in which the general nut is modified as an anti-loosening nut. To ensure secure train operation on the Yeongjong Bridge, it is necessary to predict the behavior of the track and bridge structures under the increased train speeds expected in the future to reduce semi-high-speed combined line track damage [9]. A 3D numerical analysis was performed using a full-scale bridge model to evaluate the Yeongjong Bridge track–bridge structure. The results of this model were compared with field measurements, and the track–bridge dynamic behavior was evaluated according to anticipated increases in train speed.
2. Finite Element Analysis
2.1. Overview
The target section of the numerical analysis is the entire section of the Yeongjong Bridge (a suspension bridge) and the truss sections. These are shown in Figure 1.

Figure 1.
Overview of the Yeongjong Bridge. (a) Suspension bridge; (b) Truss sections.
The direct fixation rail fastening system applied to the Yeongjong Bridge is identical to the rail fastening system used in the connecting bridge for the Kansai International Airport in Japan [9]. A plate spring-type fastener and adjustment packing are applied as adjustable pads, and the general nut is modified as an anti-loosening nut [9]. Figure 1 shows the full view of the Yeongjong Bridge track on which the direct fixation rail fastening system is installed [9].
Central and side inspection roads are present on the left and right sides of the track (Figure 2a). These are not directly connected to the track girders, and thus, do not affect the train load. In addition, as shown in Figure 2b, the direct fixation track consists of 12.5 m long simple beam track girders continuously arranged to support the rails.
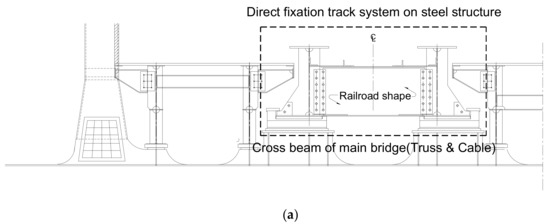

Figure 2.
Yeongjong Bridge direct fixation track structure cross section. (a) Front view; (b) Side View.
2.2. Modeling
The displacement of the structure imparted by the fixed load, and the initial tension of the suspension bridge, directly affect the stiffness of the suspension bridge. Therefore, before analyzing a live load, we conducted an initial equilibrium state analysis to match the geometric shape and tension of the cable with the design conditions.
We conducted a three dimensional (3D) numerical analysis using LUSAS 15.2 [10], a nonlinear, general-purpose finite element analysis program that includes cable elements. To ensure the consistency of the analysis, the structure was idealized based on the structural analysis.
Furthermore, to reflect the structural form of the Yeongjong Bridge direct fixation track structure to the greatest extent possible, the track girders and vertical stiffeners were composed of 3D shell elements: The rail, crossbeam and bracing were modeled as beam elements, and the rail pads were modeled as spring elements (Figure 3), and these models were based on the design drawings.
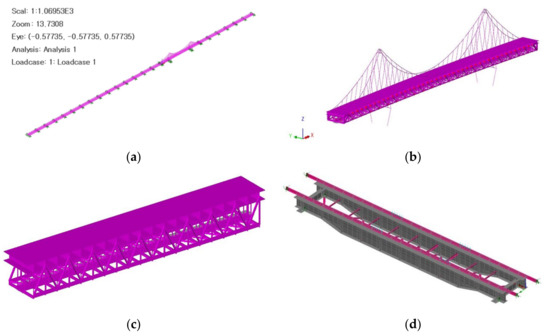
Figure 3.
Yeongjong Bridge and track modeling. (a) Full model; (b) Suspension bridge; (c) Truss bridge; (d) Yeongjong Bridge track girder model.
The section specifications used in the structural idealization process of the Yeongjong Bridge suspension bridge were calculated based on the completed drawings [8]. The suspension bridge superstructure comprises a truss structure and a box structure. Truss members were applied as a frame structure, and the box girder structure including the upper chord was applied to the structural model based on the original design concept.
In this study, the fixed loads applied on the suspension bridge were 530.824 kN/m for the center span, 539.513 kN/m for the sidewall and 509.975 kN/m for the truss bridge.
For the live vehicle load, DL24 loads were applied to eight lanes on the upper road and six lanes on the lower road. In the numerical analysis, by considering the vehicle load as a fixed load, only the influence of the increase in the Korean Train Express (KTX) railway vehicle load was analyzed.
For the train load, we attempted to reflect the eccentricity of the actual load of the KTX with reference to the railway bridge dynamic stability and dynamic design standard, and applied the load to a single line. The train speed was increased from 20 km/h to 200 km/h in increments of 20 km/h, and the effects on the bridge were analyzed. The actual operating train load was expressed as a time history function over each speed increment. Furthermore, a straight-line running load model of the moving load passing over the elements of the rail (divided into regular intervals) was applied in the analysis.
3. Field Measurements
In this study, to evaluate the rail–girder interaction force generated at the end of the Yeongjong Bridge direct fixation track during train operation, the vertical displacements of the rail and a girder were measured at the center and at the end of the track girder using the sensor linear variable differential transformers (LVDT) system shown in Figure 4. LVDTs (CDP-25M) have sensitivity of 500 × 10−6 /mm, a rated power of 6.25 mV/V ± 0.3% and a frequency response 7 Hz. Displacements are measured and recorded automatically by the computer-controlled data acquisition system.
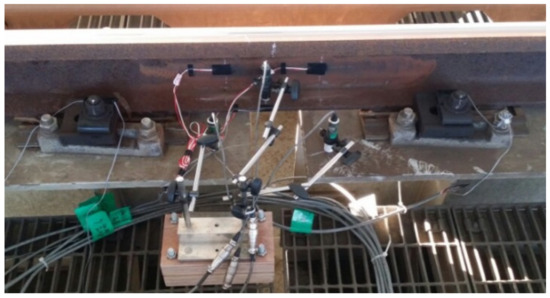
Figure 4.
Sensor installation.
4. Results and Discussions
Using the Yeongjong Bridge full-scale model, we attempted to identify the dynamic behavior of the rail and track girder system based on the KTX speed increase (up to 200 km/h). The validity of the full-scale model of the Yeongjong Bridge was verified through comparison with the measured values. The vertical deflection of the rail and girder is in the positive direction.
4.1. Rail and Girder Displacement
An example of the numerical analysis results and measurements of the vertical displacement of the rail and track girder are provided in Figure 5.
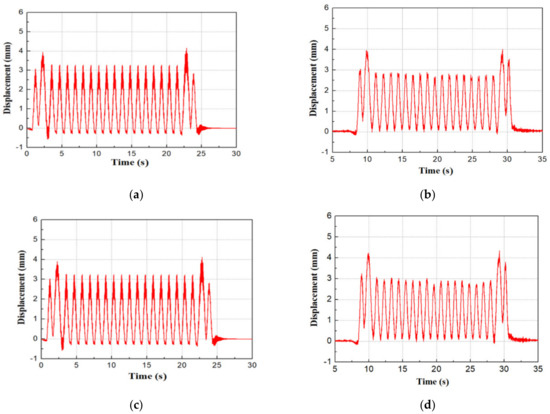
Figure 5.
Comparison of rail and track girder vertical displacements. (a) Rail vertical displacement (100 km/h, numerical analysis); (b) Rail vertical displacement (98 km/h, field measurement); (c) Track girder vertical displacement (100 km/h, numerical analysis); (d) Track girder vertical displacement (98 km/h, field measurement).
The vertical displacement analysis of the rail and track girder revealed errors between the displacements measured at a passing speed of approximately 98 km/h on the actual Yeongjong Bridge and the results obtained from the numerical analysis (100 km/h) of 3.6% and 4.8% for the rail and track girder displacements, respectively. These results indicate that the numerical analysis model predicts the displacement well, and is considered a valid model.
After verifying its validity, the full-scale model of the Yeongjong Bridge was used to calculate the rail and track girder vertical and horizontal displacements with increasing KTX speed (up to 200 km/h). As shown in Figure 6, the measured results of KTX were found to be closer to the finite element analysis results of KTX than the measured results of the airport railway express (AREX).
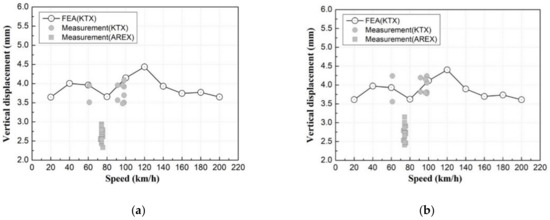
Figure 6.
Analytical results of vertical displacements of rail and track girder. (a) Rail vertical displacement; (b) Track girder vertical displacement.
According to the results obtained with increasing KTX speed, the vertical (Figure 6) and horizontal displacements of the rail and track girder were similar to those measured in the field for speeds below 100 km/h. Furthermore, the vertical displacement decreased as the speed approached 200 km/h. However, the horizontal displacements of the rail and track girder increased by approximately 1.5 times and two times, respectively. This occurs because of the influence of the hunting oscillation (swaying motion) when the train speed increased. However, this effect is marginal when compared to the lateral displacement standard of 4 mm. Therefore, we predict that the vertical and horizontal displacements of the rail and track girder will not be negatively affected by increases in train speed.
Twist (or cant) refers to an operational safety standard, whose reference value varies with train speed. The conventional method of expressing it (i.e., 3.0 mm/m (transverse direction)/3 m (longitudinal direction)) is somewhat confusing, and can result in misconceptions or errors. According to an SNCF-1 expert, the above expression implies the following: “The variation in cant measured on a 3 m scale should not exceed 3.0 mm (i.e., 1 mm/m).” However, this criterion should be modified according to speed as follows. In the French standard and in Korea’s bridge design manual (BRDM), it is stipulated that 0.4 mm/m should be considered for high-speed trains, depending on the actual train load [10,11].
In addition, the total change in cant (i.e., cant variation owing to load + existing cant variation owing to the track transition curve, etc.) should not exceed 2.5 mm/m (equivalent to a cant change of 7.5 mm/m on a 3 m track). The twist (the most important item to evaluate) exhibited a maximum deflection of 3.69 mm at the center of the girder and 2.60 mm at a distance of 3 m from the center; a variation of approximately 1.09 mm. Accordingly, the twist at a distance of 3 m was below the permissible reference value of 3.0 mm (Korean standard, 120 km/h < V ≤ 220 km/h). This indicates that there should be no safety concerns associated with twist in the bridge deck when the train speed is ≤200 km/h.
4.2. Acceleration
An example of the numerical analysis results and measurements for the vertical acceleration of the rails and track girders is provided in Figure 7.
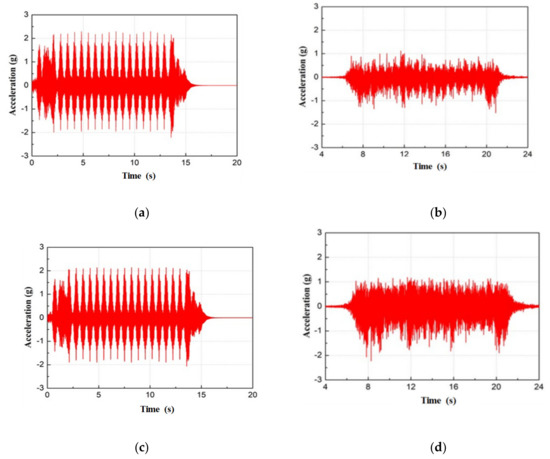
Figure 7.
Comparison of rail and track girder vertical accelerations (KTX). (a) Rail vertical acceleration (100 km/h, numerical analysis); (b) Rail vertical acceleration (98 km/h, field measurement); (c) Track girder vertical acceleration (100 km/h, numerical analysis); (d) Track girder vertical acceleration (98 km/h, field measurement).
The results of the vertical acceleration analyses of the rails and track girders revealed error ranges between the accelerations measured at a passing speed of approximately 98 km/h on the actual Yeongjong Bridge and the results calculated from the numerical analysis (100 km/h) of 3.36% and 4.2% for the rail and track girder accelerations, respectively. The results demonstrate the appropriateness of the numerical analysis model.
Using the full-scale model of the Yeongjong Bridge, the vertical and horizontal accelerations of the rail and track girder were calculated with increasing KTX speed (up to 200 km/h). The results are shown in Figure 8.
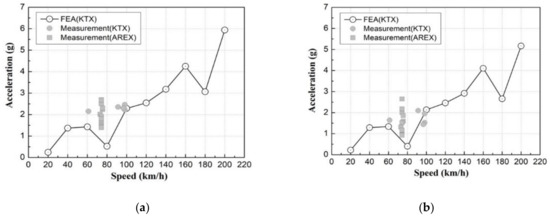
Figure 8.
Analytical results of vertical and horizontal accelerations of rail and track girder. (a) Rail vertical acceleration; (b) Track girder vertical acceleration.
According to the rail and track girder acceleration results, the predicted vertical accelerations of the rail and track girder were similar to those measured in the 20–98 km/h speed range. In addition, when the KTX speed increased to 200 km/m, both the rail vertical and horizontal accelerations increased by approximately 2.59 times, whereas the track girder vertical and horizontal accelerations increased by approximately 2.4 and 6.1 times, respectively.
4.3. Natural Frequency Analysis
We conducted a numerical analysis to investigate the natural frequency vibration modes with respect to the track girders. Figure 9 shows the mode-specific natural frequencies of the Yeongjong Bridge track girder system.
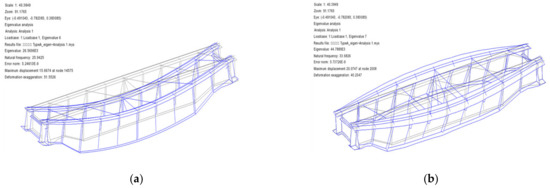
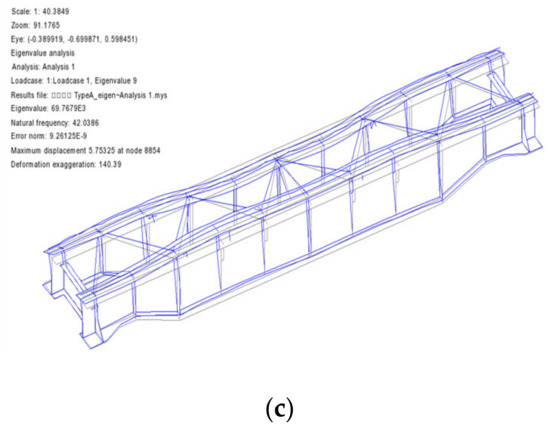
Figure 9.
Analysis of natural frequencies of track girders by mode. (a) 1st bending mode (25.94 Hz); (b) 1st torsional mode (33.68 Hz); (c) 2nd torsional mode (42.04 Hz).
We calculated the natural frequencies of the track girder system by using the free vibration waveform of the acceleration signal measured when a train was running on the Yeongjong Bridge direct fixation track. The results of the free vibration region (excluding the forced vibration region) of the calculated acceleration response were used to conduct a fast Fourier transform (FFT) analysis. The natural frequencies of the Yeongjong Bridge direct fixation track were then compared and analyzed.
Figure 10 shows an example of the results of the free vibration response analysis of the acceleration response of the track girders, and the measurement results of the natural frequency obtained through the FFT analysis of the free vibration region.
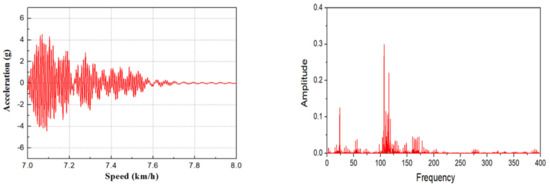
Figure 10.
Natural frequency calculation results for the track girder system.
Comparing the analysis results of the track girder natural frequency using the full-scale Yeongjong Bridge model to the measured natural frequency of 23.80 Hz during train operations, the former was moderately larger. The measured acceleration under train operation and the measured natural frequency calculation using this acceleration reflect the unsprung mass effect of the operating vehicle. The mass contribution level by the vehicle to the measured natural frequency increased, causing the measured natural frequency to be lower than the analytical value.
5. Prediction of Dynamic Behavior of Bridge
5.1. Natural Frequency
An eigenvalue analysis of the Yeongjong Bridge (truss bridge and suspension bridge) was performed through a numerical analysis. Figure 11 and Figure 12 show the mode shapes of the Yeongjong Bridge, and Table 1 summarizes the eigenvalues by mode.
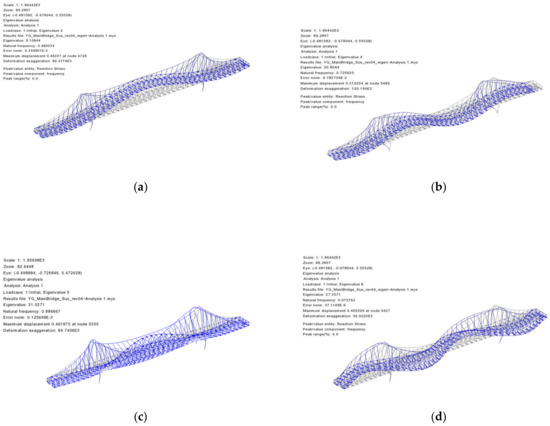
Figure 11.
Yeongjong Bridge suspension bridge mode shapes. (a) 1st bending mode (0.480 Hz); (b) 2nd bending mode (0.725 Hz); (c) 1st torsional mode (0.887 Hz); (d) 2nd torsional mode (0.973 Hz).
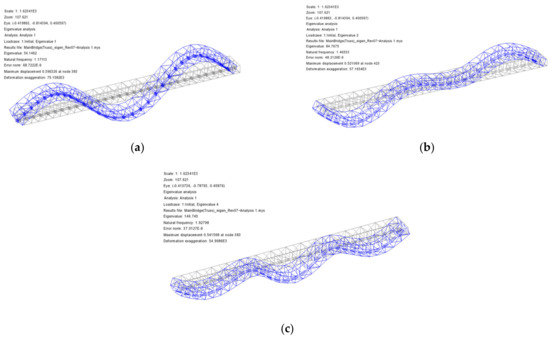
Figure 12.
Yeongjong Bridge truss bridge mode shape. (a) 1st bending mode (1.171 Hz); (b) 2nd bending mode (1.465 Hz); (c) 3rd bending mode (1.928 Hz).

Table 1.
Comparison of eigenvalue analysis results.
According to the results of the eigenvalue analysis shown in Table 1, in the main modes, eigenvalues similar to those of the completion data, initial diagnosis data, load test and precision safety diagnosis, were derived, demonstrating the appropriateness of the analytical model used in this study.
To examine stability with regard to resonance (critical speed), we performed calculations based on the natural frequency of the first bending mode of the structure. According to the examination of the resonance effect by bridge type, the natural frequency of the suspension bridge was 0.48 Hz. The critical speeds for KTX and AREX were 32.31 km/h and 23.85 km/h, respectively. For the truss bridge, the natural frequency was 1.17 Hz, and the critical speeds for KTX and AREX were 78.83 km/h and 58.18 km/h, respectively. Based on the evaluation of the bridge structure resonance effect, the critical speed of the suspension bridge and truss bridge calculated by reflecting the first bending mode natural frequency was less than 80 km/h. This indicates no influence of resonance when train speeds are above 150 km/h.
5.2. Dynamic Response
The bridge deck displacement and acceleration with increasing KTX speed (up to 200 km/h) were calculated. The results are shown in Figure 13.
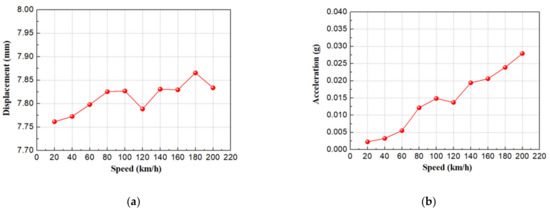
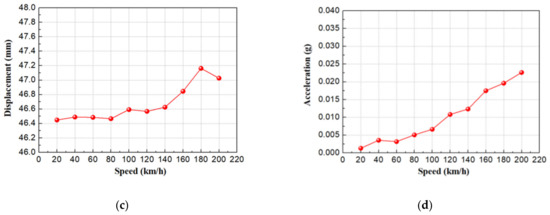
Figure 13.
Prediction of dynamic behavior of the bridge according to increasing train speed. (a) Bridge deck displacement (truss bridge); (b) Bridge deck acceleration (truss bridge); (c) Bridge deck displacement (suspension bridge); (d) Bridge deck acceleration (suspension bridge).
According to the predictions of the dynamic behavior of the bridge, the displacement and acceleration of the bridge deck will increase as speed increases. Regarding the bridge deck displacement, the response increased in both the truss bridge and the suspension bridge as the speed increased beyond 160 km/h. Moreover, the bridge deck acceleration increased for speeds beyond 120 km/h, although the level of increase was marginal.
5.3. Dynamic Wheel Load-Displacement
The dynamic wheel load and displacement acting on the all of the trains passing through the truss bridge and the suspension bridge are shown in Figure 14. As a result, the impact of the train type dynamic wheel load according to the bridge structure type was very little. (AREX: truss bridge (55–70 kN), suspension bridge (55–67 kN), AREX Express: truss bridge (54–67 kN), suspension bridge (50–58 kN), KTX: truss bridge (85–108 kN), suspension bridge (89–101 kN)).
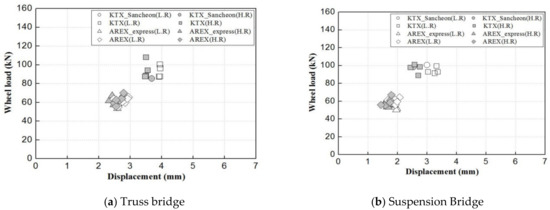
Figure 14.
Result of internal and external load-displacement according to train type.
6. Conclusions
To predict the behavior of the track and bridge structures of the Yeongjong Bridge (a section of an airport railway) with respect to preparing for future increases expected in train speeds, field measurements and numerical analyses were performed. The results were used as a basis for analyzing the dynamic track–bridge behavior according to increases in train speed (up to 200 km/h).
- (1)
- According to the analysis of track behavior based on increases in train speed, no structural problems were observed with regard to track structure stability (track displacement and acceleration) and train operation stability (track support stiffness, track impact factor, derailment coefficient, wheel load reduction, track gauge widening and track twist).
- (2)
- An examination of the resonance effect of the bridge structure revealed no resonance effect due to increases in train speed (up to 200 km/h). From the perspective of the Yeongjong Bridge structure, no problems related to increased deflection or acceleration caused by an increase in speed up to 150 km/h (which is the present target speed for future airport railways) were observed.
Author Contributions
Conceptualization, J.-S.C. and J.-Y.C.; investigation, K.-Y.L.; formal analysis, J.-S.C.; field test, J.-Y.C. and K.-Y.L., writing—original draft preparation, J.-Y.C. and S.-H.K.; writing—review and editing, S.-H.K. All authors have read and agreed to the published version of the manuscript.
Funding
This research received no external funding.
Conflicts of Interest
The authors declare no conflicts of interest.
References
- Gou, H.; Zhou, W.; Bao, Y.; Li, X.; Pu, Q. Experimental study on dynamic effects of a long-span railway continuous beam bridge. Appl. Sci. 2018, 8, 669. [Google Scholar] [CrossRef]
- Choi, J.Y. Influence of track support stiffness of ballasted track on dynamic wheel-rail forces. J. Transp. Eng. 2013, 139, 709–718. [Google Scholar] [CrossRef]
- Olmos, J.M.; Astiz, M.A. Analysis of the lateral dynamic response of high pier viaducts under high-speed train travel. Eng. Struct. 2013, 56, 1384–1401. [Google Scholar] [CrossRef]
- Lou, P.; Yu, Z.W.; Au, F.T.K. Rail-bridge coupling element of unequal lengths for analysing train-track-bridge interaction systems. Appl. Math. Model. 2012, 36, 1395–1414. [Google Scholar] [CrossRef]
- Ham, J.S.; Jong, S.; Hwang, W.S. A numerical study on application of the integrated track system for a magnetic railway. J. Korean Soc. Adv. Compos. Struct. 2015, 6, 40–45. [Google Scholar]
- Song, M.K.; Noh, H.C.; Choi, C.K. A new Three-dimensional finite element analysis model of high-speed train-bridge interaction. Eng. Struct. 2003, 25, 1611–1626. [Google Scholar] [CrossRef]
- Wang, K.; Xia, H.; Xu, M.; Guo, W. Dynamic analysis of train-bridge interaction system with flexible car-body. J. Mech. Sci. Technol. 2015, 29, 3571–3580. [Google Scholar] [CrossRef]
- Zhang, N.; Tian, Y.; Xia, H. A train-bridge dynamic interaction analysis method and its experimental validation. Engineering 2016, 2, 528–536. [Google Scholar] [CrossRef]
- Choi, J.Y.; Chung, J.S.; Kim, S.H. Experimental study on track-bridge interactions for direct fixation track on long-span railway bridge. Shock Vib. 2019, 2019, 1903752. [Google Scholar] [CrossRef]
- FEA. LUSAS/Standard User’s Manual. LUSAS Theory Manual, Version 15.2; FEA: London, UK, 2016. [Google Scholar]
- SYSTRA. Bridge Design Manual (BRDM); Korea High Speed Rail Construction Authority (KHRC): Daejeon, Korea, 1995. [Google Scholar]
© 2019 by the authors. Licensee MDPI, Basel, Switzerland. This article is an open access article distributed under the terms and conditions of the Creative Commons Attribution (CC BY) license (http://creativecommons.org/licenses/by/4.0/).