Article

Analysis of the Influence of High Peening Coverage on Almen Intensity and Residual Compressive Stress

1
School of Mechanics and Safety Engineering, Zhengzhou University, Zhengzhou 450001, China
2
Department of Mechanical Engineering, Chung-Ang University, Seoul 06974, Korea
*
Author to whom correspondence should be addressed.
Appl. Sci. 2020, 10(1), 105; https://doi.org/10.3390/app10010105
Submission received: 1 November 2019 / Revised: 17 December 2019 / Accepted: 18 December 2019 / Published: 21 December 2019

Abstract

:
The effectiveness of shot peening is mainly determined by the peening coverage. The peening coverage is required to be 100% for current technical standards of shot peening. With the increase of material strength, higher peening coverage is required in shot peening process. However, the influence of high peening coverage on Almen intensity and residual compressive stress is unclear, the difficulty mainly lies in the lack of quantitative description of peening coverage in finite element analysis. To analyze the influence of high peening coverage on Almen intensity and residual compressive stress, firstly an approximate quantitative description of peening coverage based on dent size, the distance of shots and shot numbers is proposed in this study. Based on this quantitative description of peening coverage, the arc height and residual stress of the Almen test are simulated with the finite element method. The simulation results of arc height and saturation curve agree well with that of the Almen test, by which the effectiveness of the quantitative description and FE simulation are proved. The further study indicates that in shot peening processes, the excessive peening coverage doesn’t improve Almen intensity and residual compressive stress.

1. Introduction

Shot peening is a mechanical surface treatment that induces a surface layer of residual compressive stress (RCS). In the shot peening process, the surface of metal parts such as gears, springs, or turbine blades is sprayed by numerous small round metal balls and RCS is generated on the surface. RCS embedded in the surface plays a role in preventing the occurrence of cracks so that the fatigue strength of the pinched parts is improved [1,2,3,4].
Engineers in charge of shot peening usually to conduct the Almen test before shot peening is carried out [5]. In this test, a thin strip (dimensions of 76.2 mm × 18.9 mm with three commercially available thicknesses: 0.79, 1.29, and 2.39 mm) is peened with the same peening conditions as the actual parts of a given time period. The thin strip is called the “Almen strip” in the test. The Almen strip then bents since RCS induced by the peening leads the Almen strip to deflect from the peening direction [6]. The ejection of the balls is called impact, the balls are called shots. The maximum value of deflection of the Almen strip is called the arc height. In the Almen test, with the impact time increasing, the peening coverage increases and the arc height saturates. The value of the arc height at saturation of Almen strip is referred to as “Almen intensity”.
In shot peening process, it is difficult to test the RCS. Therefore, Almen intensity has been used as the standard for shot peening, which determines the shot peening parameters. Guechichi et.al. [7] established a framework for predictive modeling of shot velocity. They found a relationship between Almen intensity and shot velocity. The effects of Almen intensity on microstructure and residual stress were investigated experimentally [8,9]. Ahmed et.al. [10] investigated the influence of the shot peening parameters on the hardness, residual stresses, and surface roughness. Jebahi et.al. [11] proposed a comprehensive methodology to simulate a real shot peening process with minimal computation effort. Atig et.al. [12] proposed a probabilistic methodology to evaluate the variability of the induced residual stress and Almen intensity of the shot peening parameters. Based beam bending principles, Divid et al. [13] quantify the relationship between the several parameters affecting measured Almen intensity. Cao et al. [14] proposed an analytic model to study the correlation of the Almen intensity with RCS, and compared the model-predictions with the measurements as a function of impact velocity, but a new problem was raised in assessing and interpreting the Almen intensity scale. Guagliano [15] performed a 3D finite element (FE) analysis to relate the Almen intensity with the terms of shot velocity, but didn’t present a relation between the Almen intensity and RCS. Bhuvaraghan et al. [16] improved FEM-based approach that simulates the actual process of Almen strip peening by employing randomly located shots impacting on a part of Almen strip and the inclusion of strain-rate dependent target material properties. Bhuvaraghan et al. [17] used the discrete element method in combination with the finite element method to obtain reasonably accurate predictions of the residual stresses and plastic strains. Hu et. al. [18] examined the influences of the dimension and shape on the residual stress with 3D random impact FE model. In general, there have not been deeper studies about the influence of peening coverage on Almen intensity and RCS recently due to a lack of quantitative description of peening coverage.
During the strip test or general shot peening test, numerous shots are arbitrarily bumped onto the Almen strip or specimen surface in a random sequence and random locations [19,20,21]. Therefore, the peening coverage is difficult to define in FE simulation of shot peening. Miao et al. [22] proposed a 3-D finite element model that consists of some identical shots impacting randomly an aluminum target at normal or oblique incidence angles. The random coordinate of each shot that satisfied 100% peening coverage was generated from a MATLAB program combined with ANSYS program Design Language. However, Miao et al.’s model, the minimum distance between all the existing shots was set to be 0.75 mm, which is arbitrary. The radius of all shots was 0.5 mm and the maximum number of shots used for simulation was 96. Hence, Miao et al.’s model might apply to a unit cell-based 3-D finite element analysis where an impact region to be discretized into a fine mesh is very small, e.g. 2 mm × 2 mm × 1 mm. Majzoobi et. al. [23] and Klemenz et. al. [24] extended Kubler et. al.’s [25] work by developing a process map for random impact locations generation ensuring that no two shots occupies the same space mathematically, and applied it to simulate the Almen strip response under random multiple impacts. A slice of the Almen strip subjected to random multiple impacts was modeled. The radius of the shot used as 0.1778 mm. However, the deflected profile of the Almen strip computed using the FE model with random impact locations was not compared with the measured profile. Mylonas and Labeas [26] proposed a methodology that minimizes a total number of shots, and hence makes it possible practically to simulate the multiple shot impacts, which have statistics characteristics. They showed that predetermined shot patterns (locations and sequence of the multiple shots) on a reference area of 1 mm2 could predict RCS distribution, surface roughness, and cold work by comparing the model-predictions with measurements. The previously mentioned methods demonstrate that the FE model based on randomly located impacts showed a new possibility to achieve a realistic model of shot peening. The relation of impact locations and sequence of shots has been investigated in these studies, which establishes the foundation for a quantitative description of peening coverage in this paper.
In all, the influence of high peening coverage on Almen intensity and RCS has not been studied in detail. The reason is that, in finite element analysis, it is difficult to describe the peening coverage quantitatively. In this study, the boundary conditions of the FE simulation of the Almen test were set up accord to reference [27]. By the definition of peening, peening coverage is the ratio of the area of the dents to the zone of the peening, a quantitative description of the peening coverage is proposed. The size of the peening zone is determined by the distance between two shots. After determining the size of the dent, the high peening coverage can be achieved by increasing the number of shots. This quantitative description peening coverages used to the simulation results of arc height and saturation curves are in accord with the Almen test results well. Therefore, the effectiveness of this quantitative description and FE simulation is proved. To analyze the influence of peening coverage on Almen intensity and residual compressive stress, further study is carried out. Through the discussion of the FE simulation and Almen test results, some new conclusions are obtained.

2. A Quantitative Description of the Peening Coverage

In this section, the peening coverage is described quantitatively by analyzing the effect of the distance between shots, dent size, and the number of shots on the peening coverage. Generally speaking, peening coverage is defined as the percentage of a surface area indented. For shot peening, the peening coverage is determined by three factors, (a) dent diameter, (b) the number of dents in each unit area of the peening surface, and (c) the time of peening. In this study, ‘cycle’ is used to describe the time of peening for FE simulation.
Before the peening coverage is described quantitatively, some assumptions should be put forward about locations and sequence of shots impact. Firstly, the locations and sequence of the multiple shots impacting is not generated randomly. Secondly, peening coverage depends on both dent size and the number of dents generated on Almen strip surface in the unit area, rather than the impact sequence. Thirdly, the locations of the multiple shots are defined in the same position and the shots impact one by one.
With assumptions above, the process of shots impacting is analyzed. Figure 1 shows the Schematic of dent size on Almen strip surface in 1-cycle, the second, fourth and fifth row of shots is omitted in Figure 1 for convenience. In Figure 1a, the shot balls are adjacent to each other in the row and impact Almen strip surface at the same time. The width of the shadow is defined as the size of each dent (Ds), and the distance between the center of the shots is defined as Cd. Figure 1b–d shows the process of dent expansion. In Figure 1d, peening coverage reaches 100%. This impact pattern, from the first to the sixth row of shots, is called one ‘impact cycle’. The overlap of the dents is inevitable in the peening process, however, with the reasonable distance between shots, there is little overlap when full peening coverage is reached. Therefore, higher peening coverage could be got by the repetition of this cycle.
With the analysis above, a quantitative description of peening coverage is proposed, and the peening coverage is computed by Equation (1).
R o = D s N l C d N l × 1 D s × 100 % ,
N l = a C d D s ,
where Ro is the peening coverage, Ds is dent size, Cd is the distance between the centers of shots; and Nl defined in Equation (2) characterizes the number of dents between the centers of the shot. As shown in Equation (2), the number of dents Nl is determined by Cd, Ds, and the coefficient of proportionality (a). The coefficient of proportionality can be determined by the overlapping dents of the shot impacts [28]. The dent size is related to the size of the ball and the impact velocity. The horizontal distance between the centers of shots (Cd) is twice the radius of the shots. The effectiveness of the quantitative description of peening coverage will be proved in Section 3.

3. Comparison of Finite Element Simulation of Almen Test and Almen Test

Based on the quantitative description of peening coverage (Equation (1)), the finite element simulation of the Almen test is carried out. Meanwhile, the Almen test is also carried out. By comparing the results of the finite element simulation and Almen test, the effectiveness of the quantitative description of peening coverage and the FE simulation are proved.

3.1. FE Simulation of Almen Test

The commercial finite element program, ABAQUS®, which is suitable for analyzing the non-linear elastic-plastic deformation of metals subjected to multi-collision shot peening is introduced in this section [29]. The explicit time integration scheme is employed to solve the equation of motion for the shot-strip system. The element type used for the Almen strip is CPE4R (plane strain element). The shot bolls are treated as rigid bodies as their hardness is much greater than that of the strip.

3.1.1. Boundary Conditions

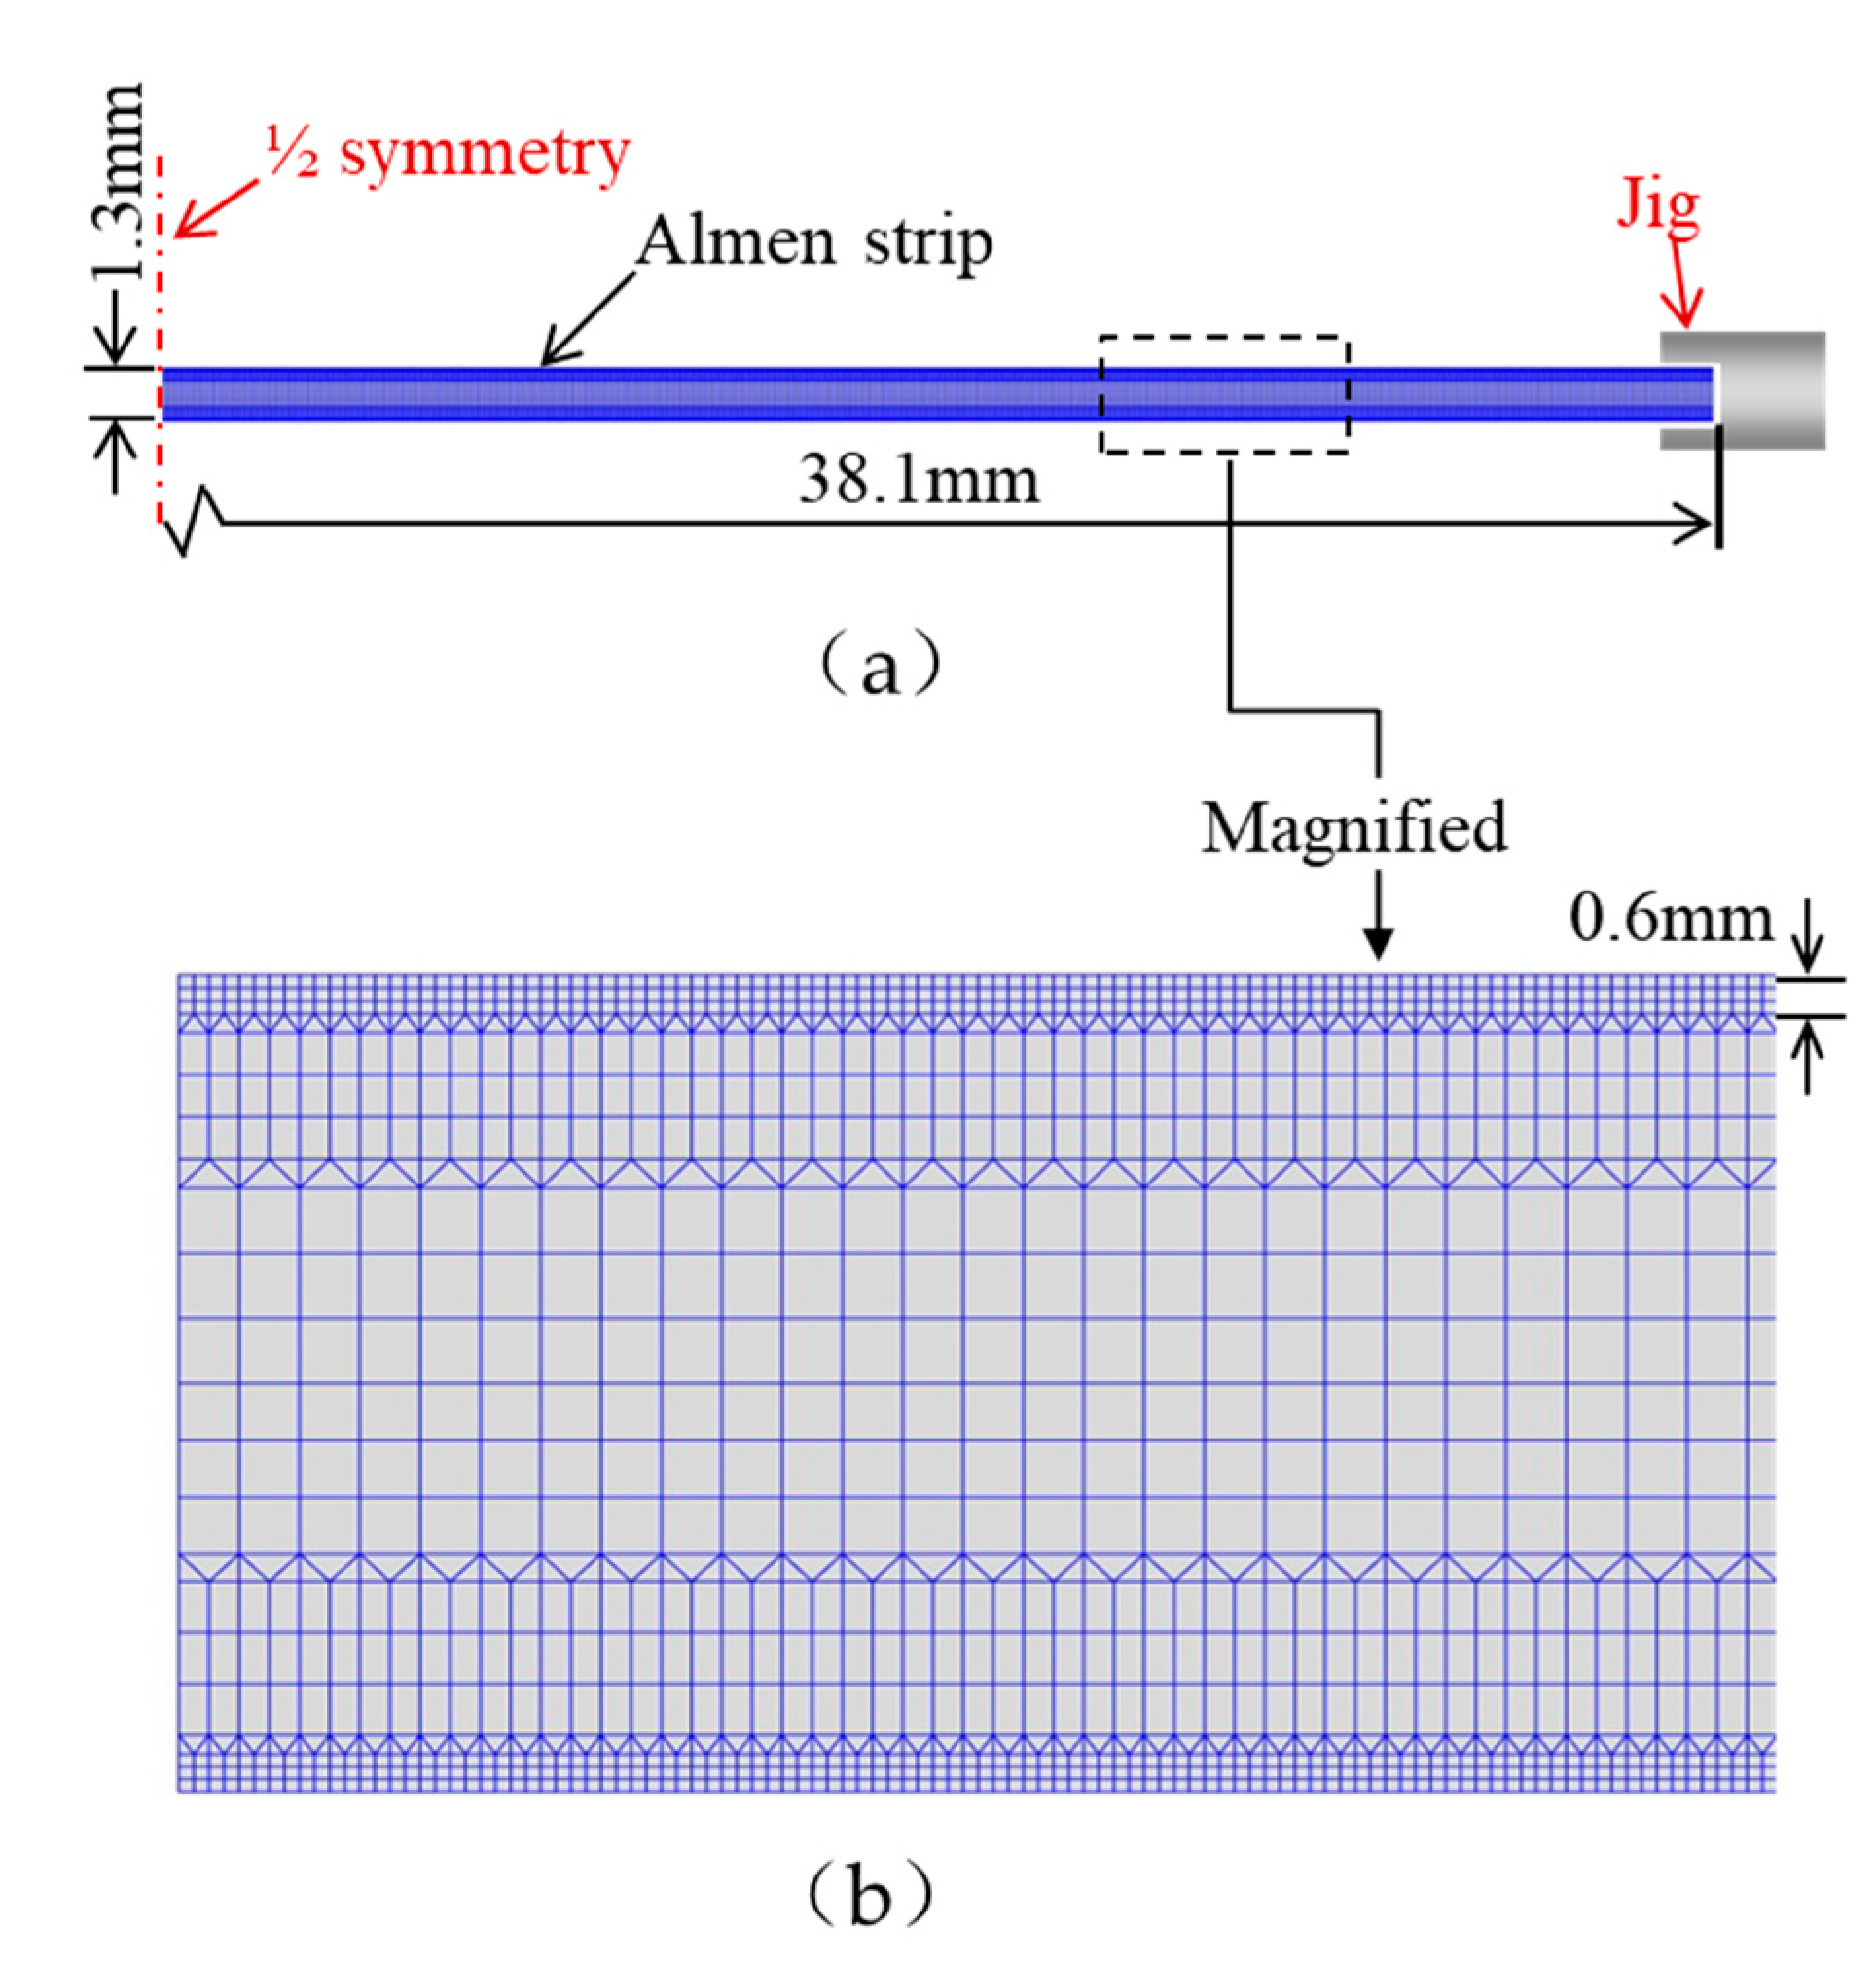
Figure 2 shows the initial mesh configuration and boundary conditions of the Almen strip when the modified strip holder [27] is employed, with which the boundary conditions can be greatly simplified. Traction free boundary condition is given to the surface of the Almen strip where shot balls are impacted, so is the opposite side of the Almen strip. U1 and U2 denote the displacement toward x-direction and y-direction, respectively. UR1, UR2, and UR3 stand for the rotation of the Almen strip on its x-direction and y-direction, and z-direction.
Enlarged meshes at a part are shown in Figure 2b. Since elastic-plastic deformation during shot peening remains in the thin layer of the Almen strip where shots are bombarding, the dense mesh is assigned in the thin layer zone and the coarse mesh is made in the middle zone of the Almen strip. Transition mesh is built between two zones.
During shot peening to avoid the stresses in the Almen strip oscillating around a mean value, the coefficient of material damping ξ = 0.5 is chosen [30]. The friction force of the relative motion of the shots and Almen strip surface is assumed to obey Coulomb’s law. Meo and Frija [31,32] reported that the effect of the Coulomb friction coefficient on the residual stress and plastic strain is insignificant if it is in the range of 0.1–0.5. Coulomb friction coefficient μ = 0.2 is used in this study. The temperature variation raised by impacting is neglected.

3.1.2. Material Model

In the previous studies [16,33,34,35], strain rate dependency of the Almen strip on the deformation behavior was assumed negligible even though high strain rates were engaged in the Almen strip during shot peening. However, the strain rate will have effects on the deformation profile, i.e. arc height, of the Almen strip. Hence constitutive equation which relates stress and strain to the current conditions of strain rate is necessary to describe the deformation behavior of the Almen strip under shot peening. In this study, the Johnson-Cook model is used for high strain rate deformation.
σ = [ A + B ( ε ¯ ) n ] [ 1 + C ln ( ε ¯ ˙ ε ¯ ˙ 0 ) ] [ 1 ( T T 0 T m T ) m ]
A, B, C, m and n are material constants to be determined from deformation tests. ε 0 ¯ ˙ and T0 are reference values of strain rate and temperature, respectively. ε ¯ ˙ and T is the strain rate and temperature, respectively. Tm is the melting temperature of the material.
The material parameters of the Johnson-Cook model used in this study were taken from the literature [16]. Figure 3 shows the strain rate dependent flow stress behavior of the Almen strip used in FE simulation.

3.1.3. Mesh Size

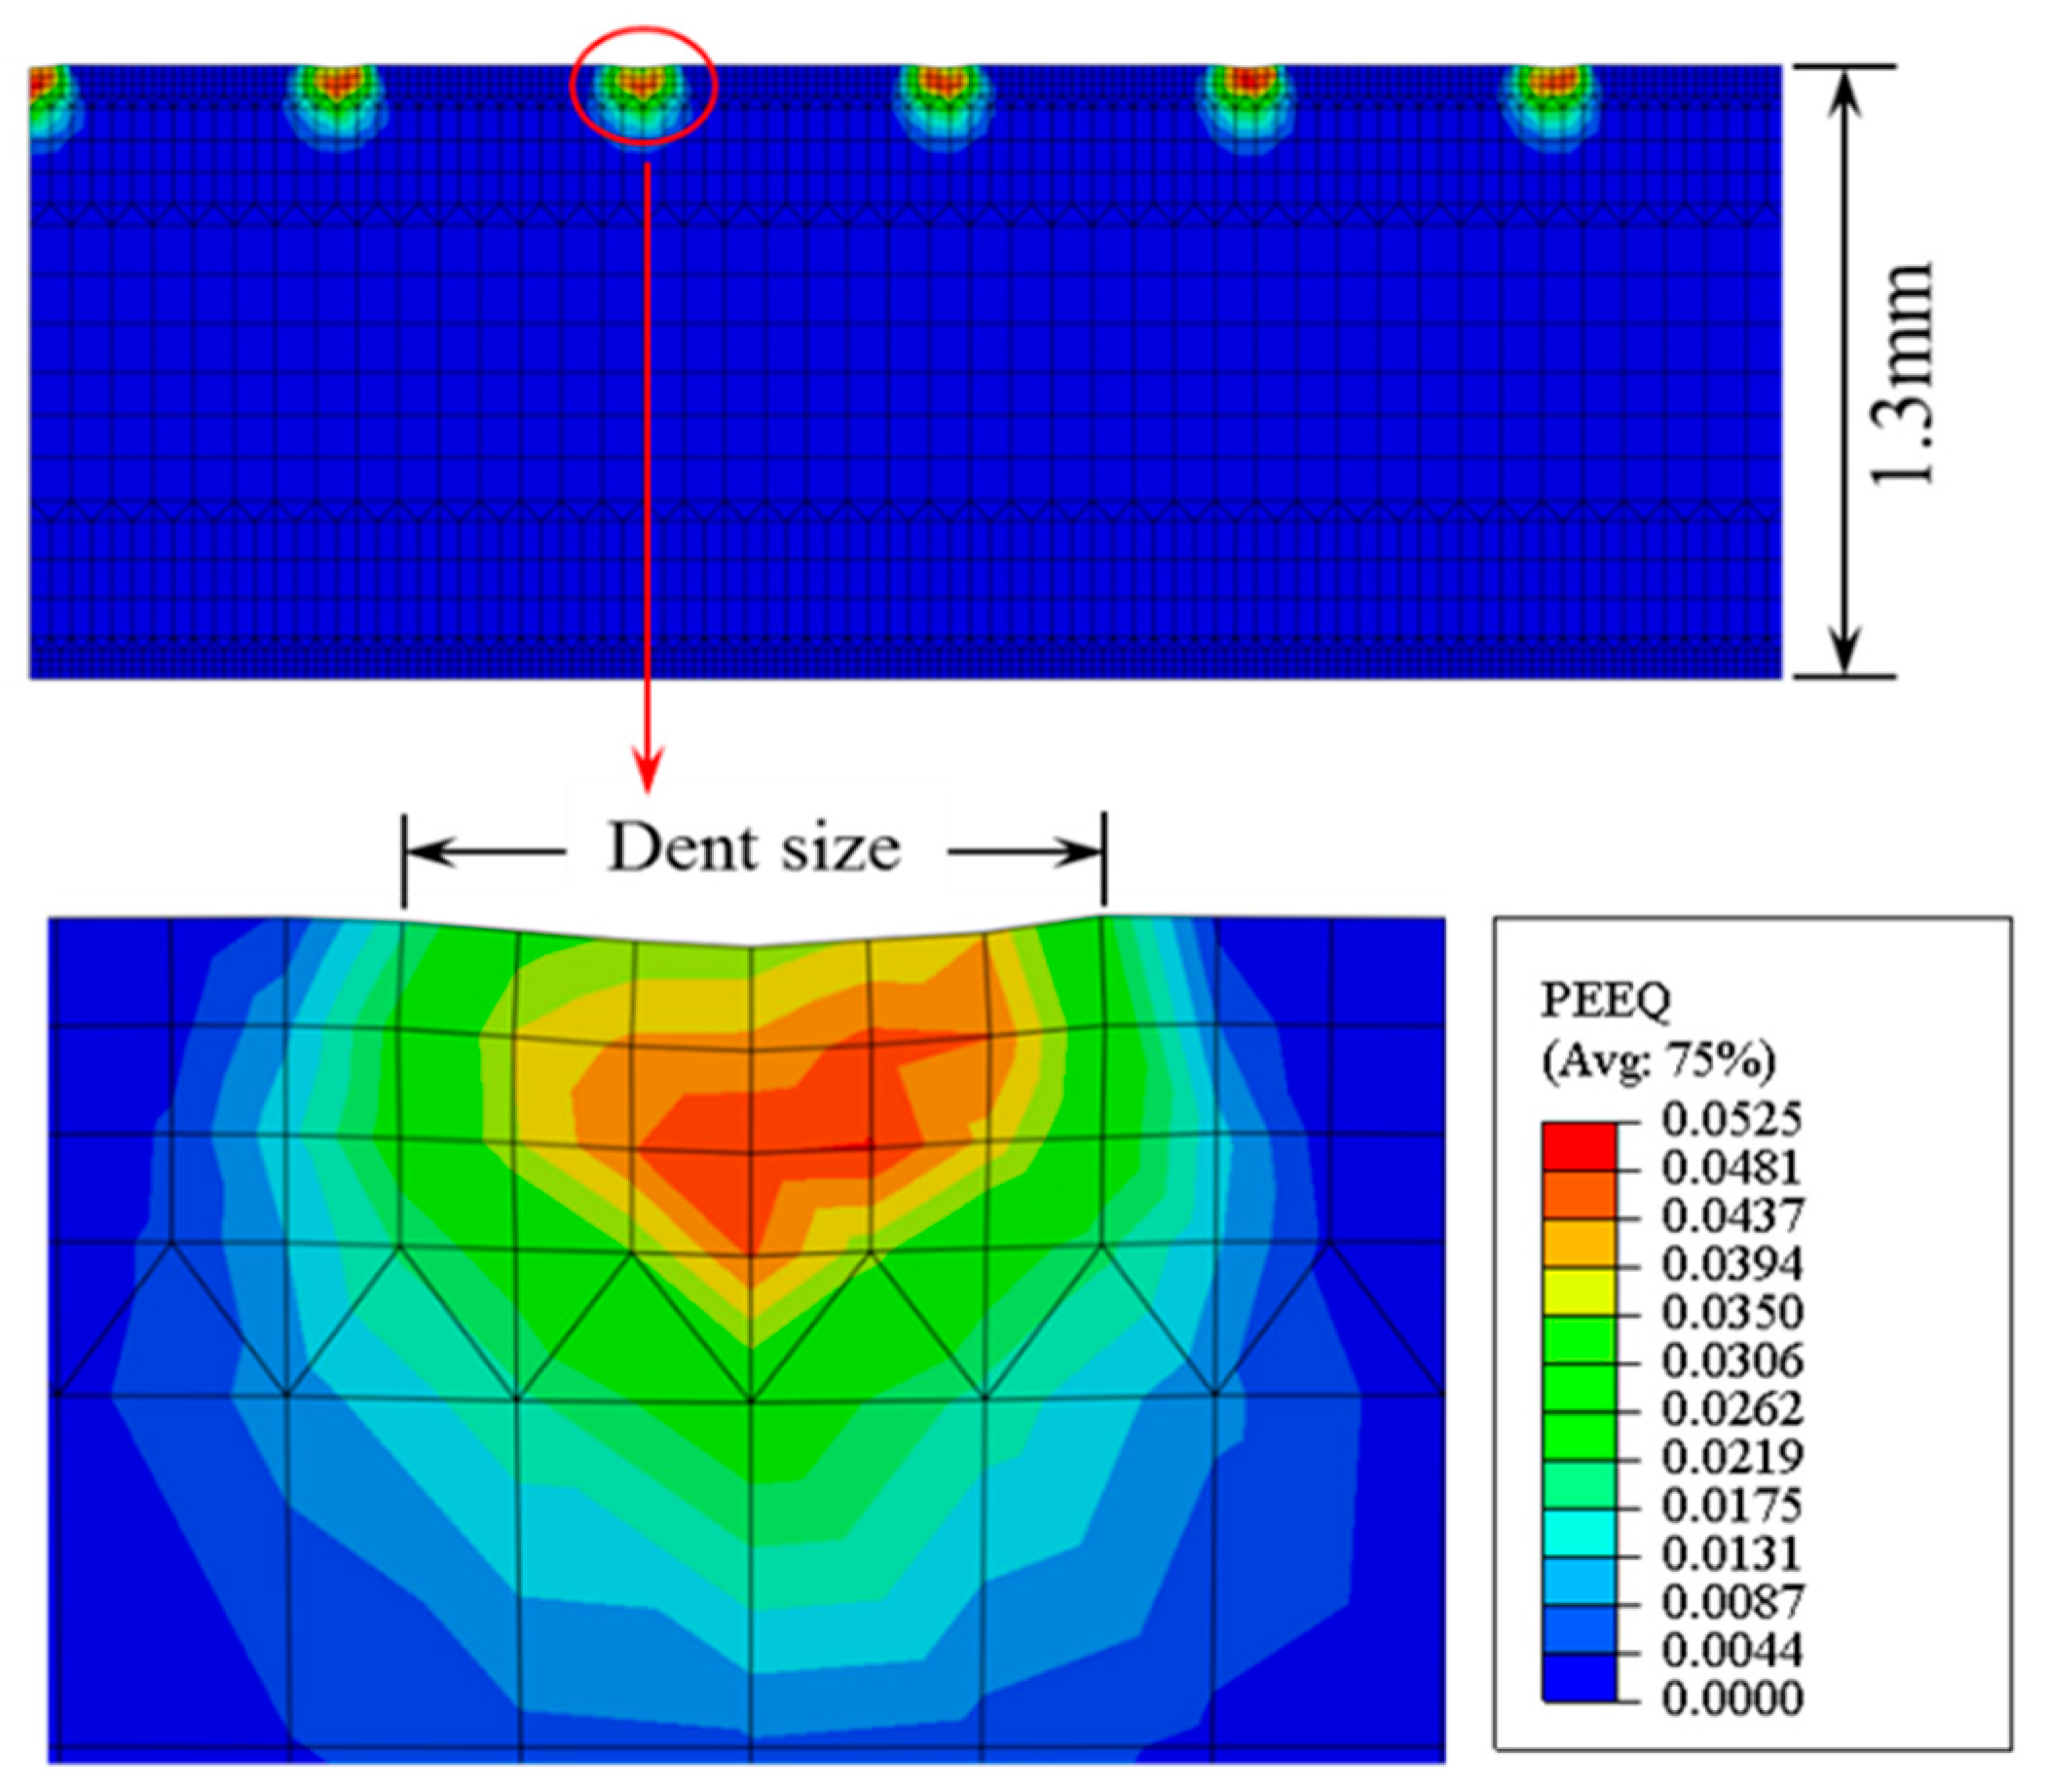
In finite element simulation of shot peening, the most challenging aspect is the evaluation of mesh size. In general, much finer elements have been preferred in the impacting area and coarser elements made in the area far from the impacting region. Since the size of the smallest element in explicit FE simulation determines run time, we cannot reduce thoughtlessly the element size. There are several studies [36,37,38] that assess the mesh size in FE simulation of the multiple impacts in terms of dimple (dent or indentation) diameter. The deformation of the mesh caused by the impact of shots is shown in Figure 4. The legend is the equivalent plastic strain (PEEQ) around the deformation area.
Zimmerman et al. [35] chose an element size equal to 1/15th of dimple diameter produced by a single shot impact. The dimple diameter indicates the magnitude of the concave surface due to the single shot impact. Klemenza et al. [24] selected the size of elements that equals 1/10th of dimple diameter. In the Bagherifard et al.’s [37] works, to predict the generation of a nanostructure surface layer of material, the element size in the impact zone was selected to be 1/20th of dimple diameter.
In this study, where 2-D multiple impacts simulation is performed, the size of elements in the impact zone is chosen to be 0.02 mm, which is about 1/6th of dimple diameter.

3.1.4. Impact Sequence and Position

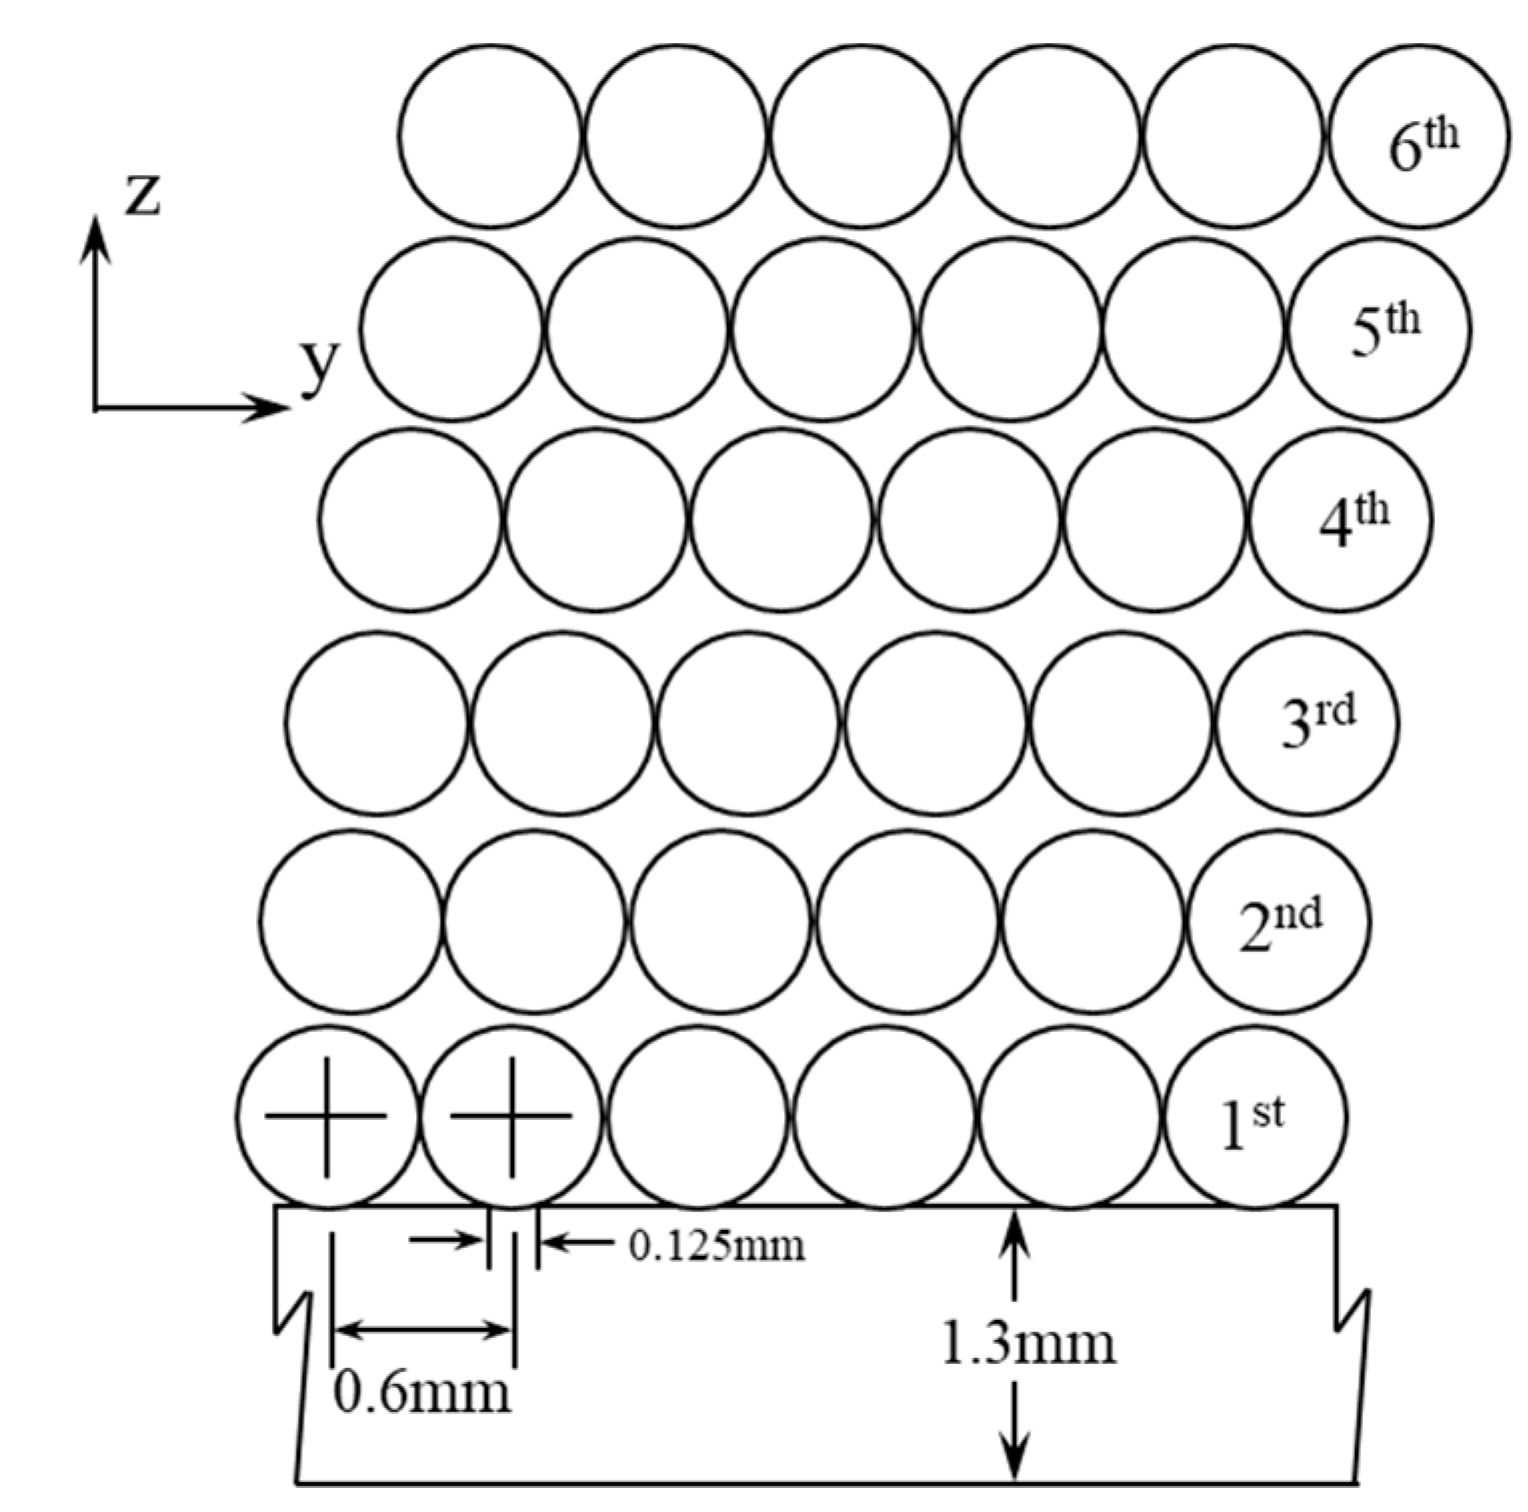
With the quantitative description of peening coverage, the impact sequence and position of shots for FE simulation could be determined. Figure 5 shows the schematic of the impact sequence and position in 1 impact cycle. The impact cycle is repeated to simulate 6 layers impacting irregularly on the Almen strip surface. In each layer, the distance between the two shots is 0.6 mm. To study the influence of high peening coverage on Almen intensity and RCS, higher peening coverage could be got by increasing the number of impact cycles. In the Almen strip test, impact velocity is 25, 30, and 35 m/s, respectively, dent size is 0.125, 0.14, and 0.16 mm in FE simulation.

3.2. Almen Test

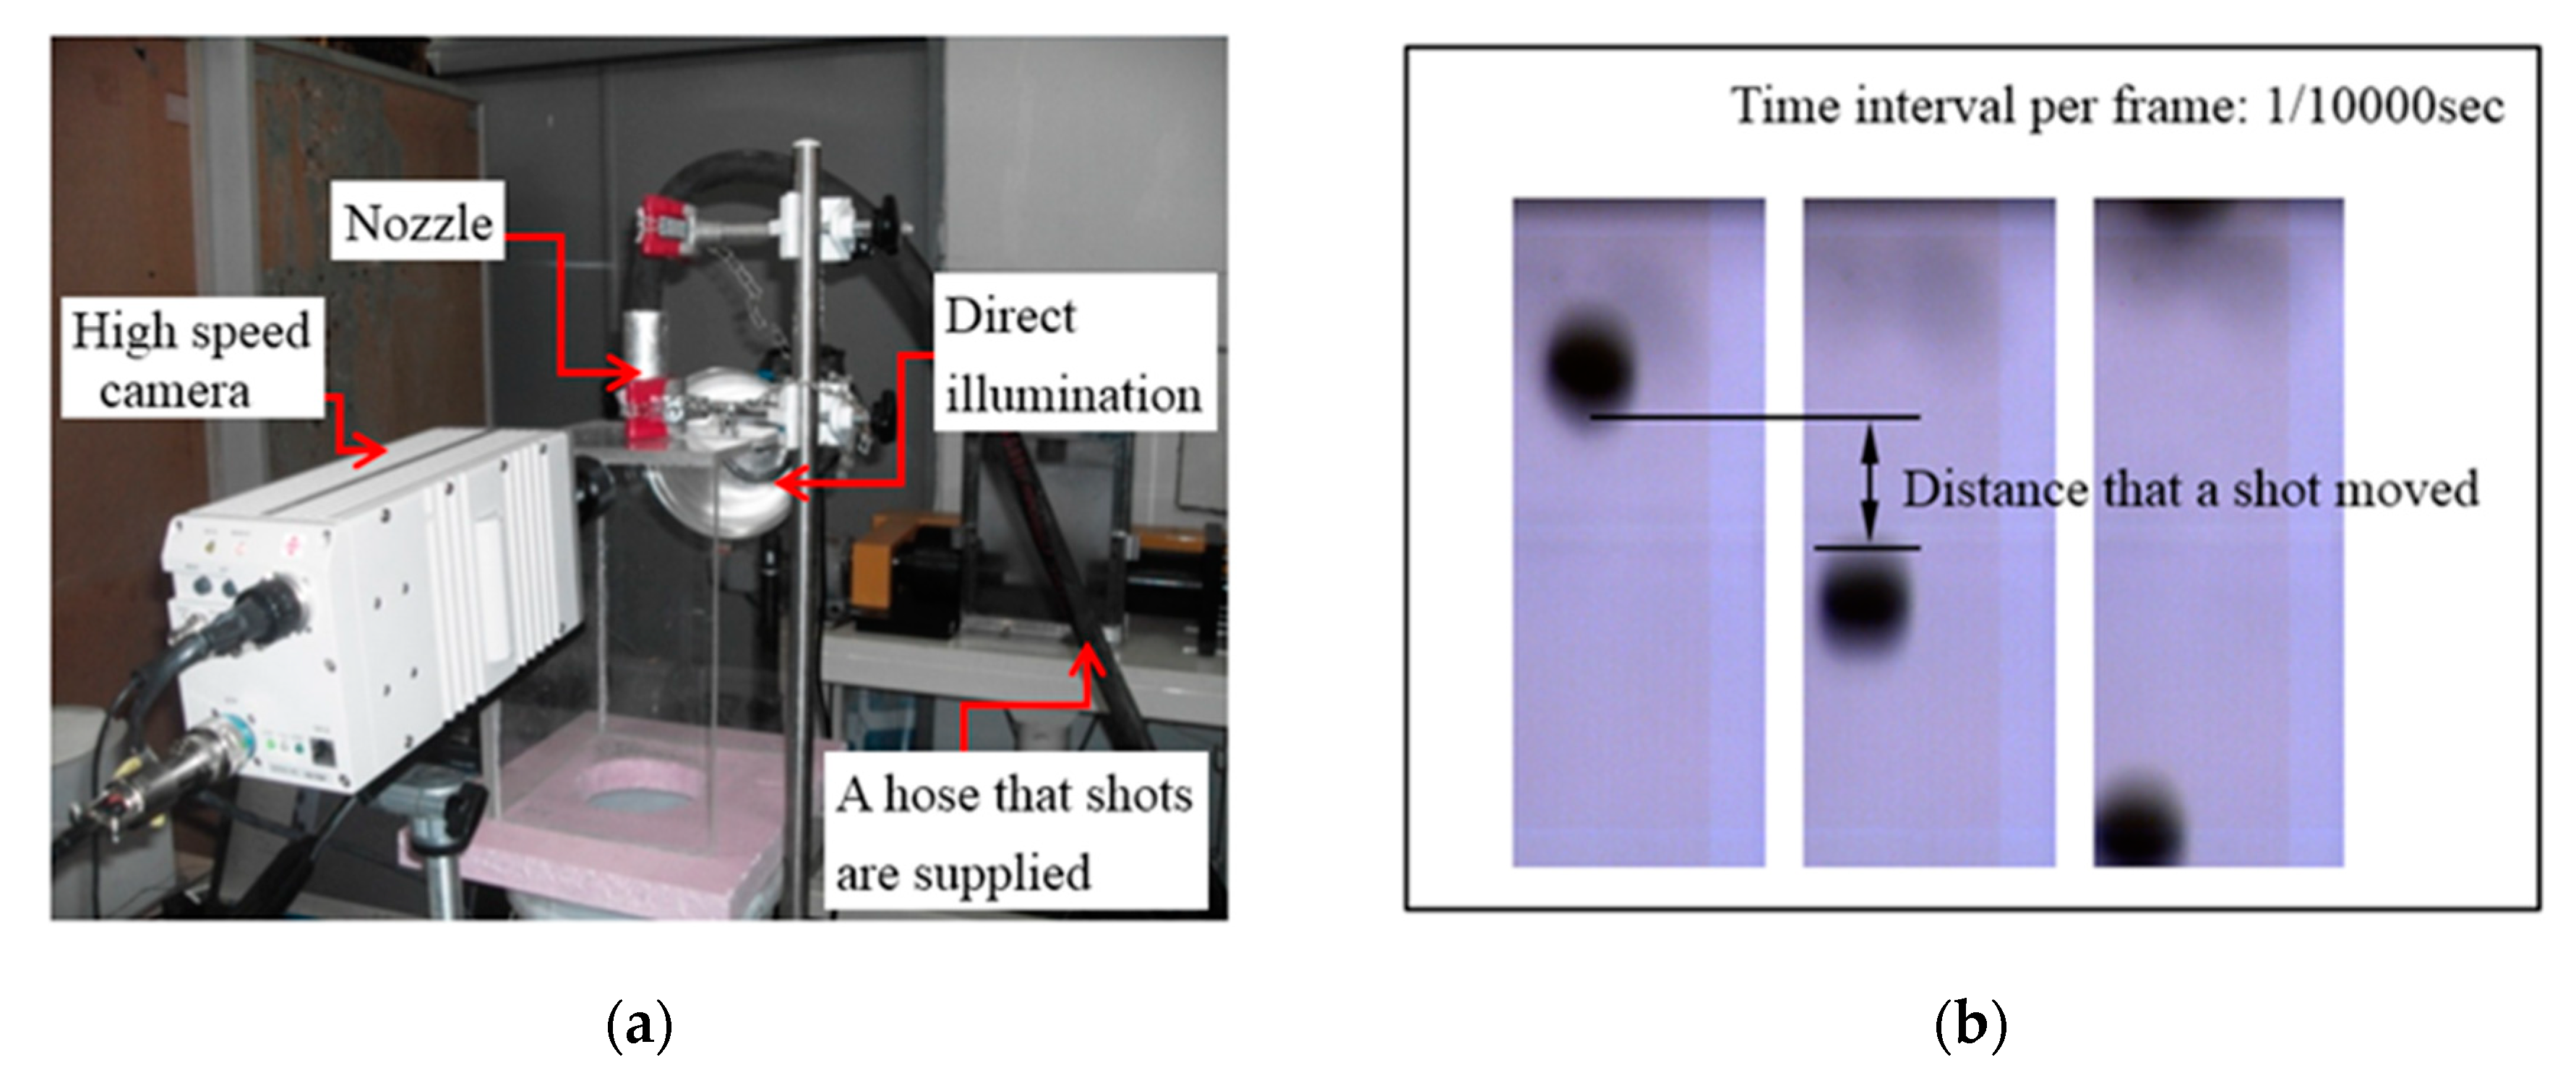
An air-compression type shot peening equipment is developed for this research. A cut wire round shot S230 (Diameter = 0.6 mm) is used for the shot materials in the Almen test. Mass flow rates of shots are approximately 2.5 kg/min. This equipment can propel shots with sizes up to 1/16 inch in diameter. The desired impact velocities are obtained by adjusting the air pressure and impact distance. A high-speed camera (Motion Xtra HG-LE, Redlake (USA)) is employed to measure the impact velocity (Figure 6). A number of frames used for measuring the impact velocity are 10,000 fps. When air pressure is 0.3, 0.5, 0.7 MPa, the impact velocity measured is 25, 30, and 35 m/s respectively. The distance from the nozzle to the surface of the Almen strip is 100 mm and the impact angle is 90°, which is typical for shot peening tests.
SAE 1070 type-A Almen strip has been used [39]. The dimensions of the Almen strips are 76.2 (±0.38 mm) in length, 18.9mm (±0.064 mm) in width and 1.3 mm (±0.025 mm) in thickness. The material propert is listed of SAE 1070 steel in Table 1.
In Almen test, the peening coverage of the Almen test is obtained by observation. Before peening, a penning area of the Almen strip surface is coated. After peening, the peened surfaces are observed with 10× to 30× magnification to verify the required level of peening coverage. Viewing the coating surfaces to determine the area of tracer removal, the all tracer of the Almen strip surface is removed at 5 s when the peening coverage reaches 100%. As the impact time is 10 s, the peening coverage is considered as 200%.

3.3. Comparison of Results of FE Simulation and Almen Test

The effectiveness of the quantitative description of peening coverage and the FE simulation is proved by comparing the Almen strip’s deflection profile of the Almen test and FE simulation.
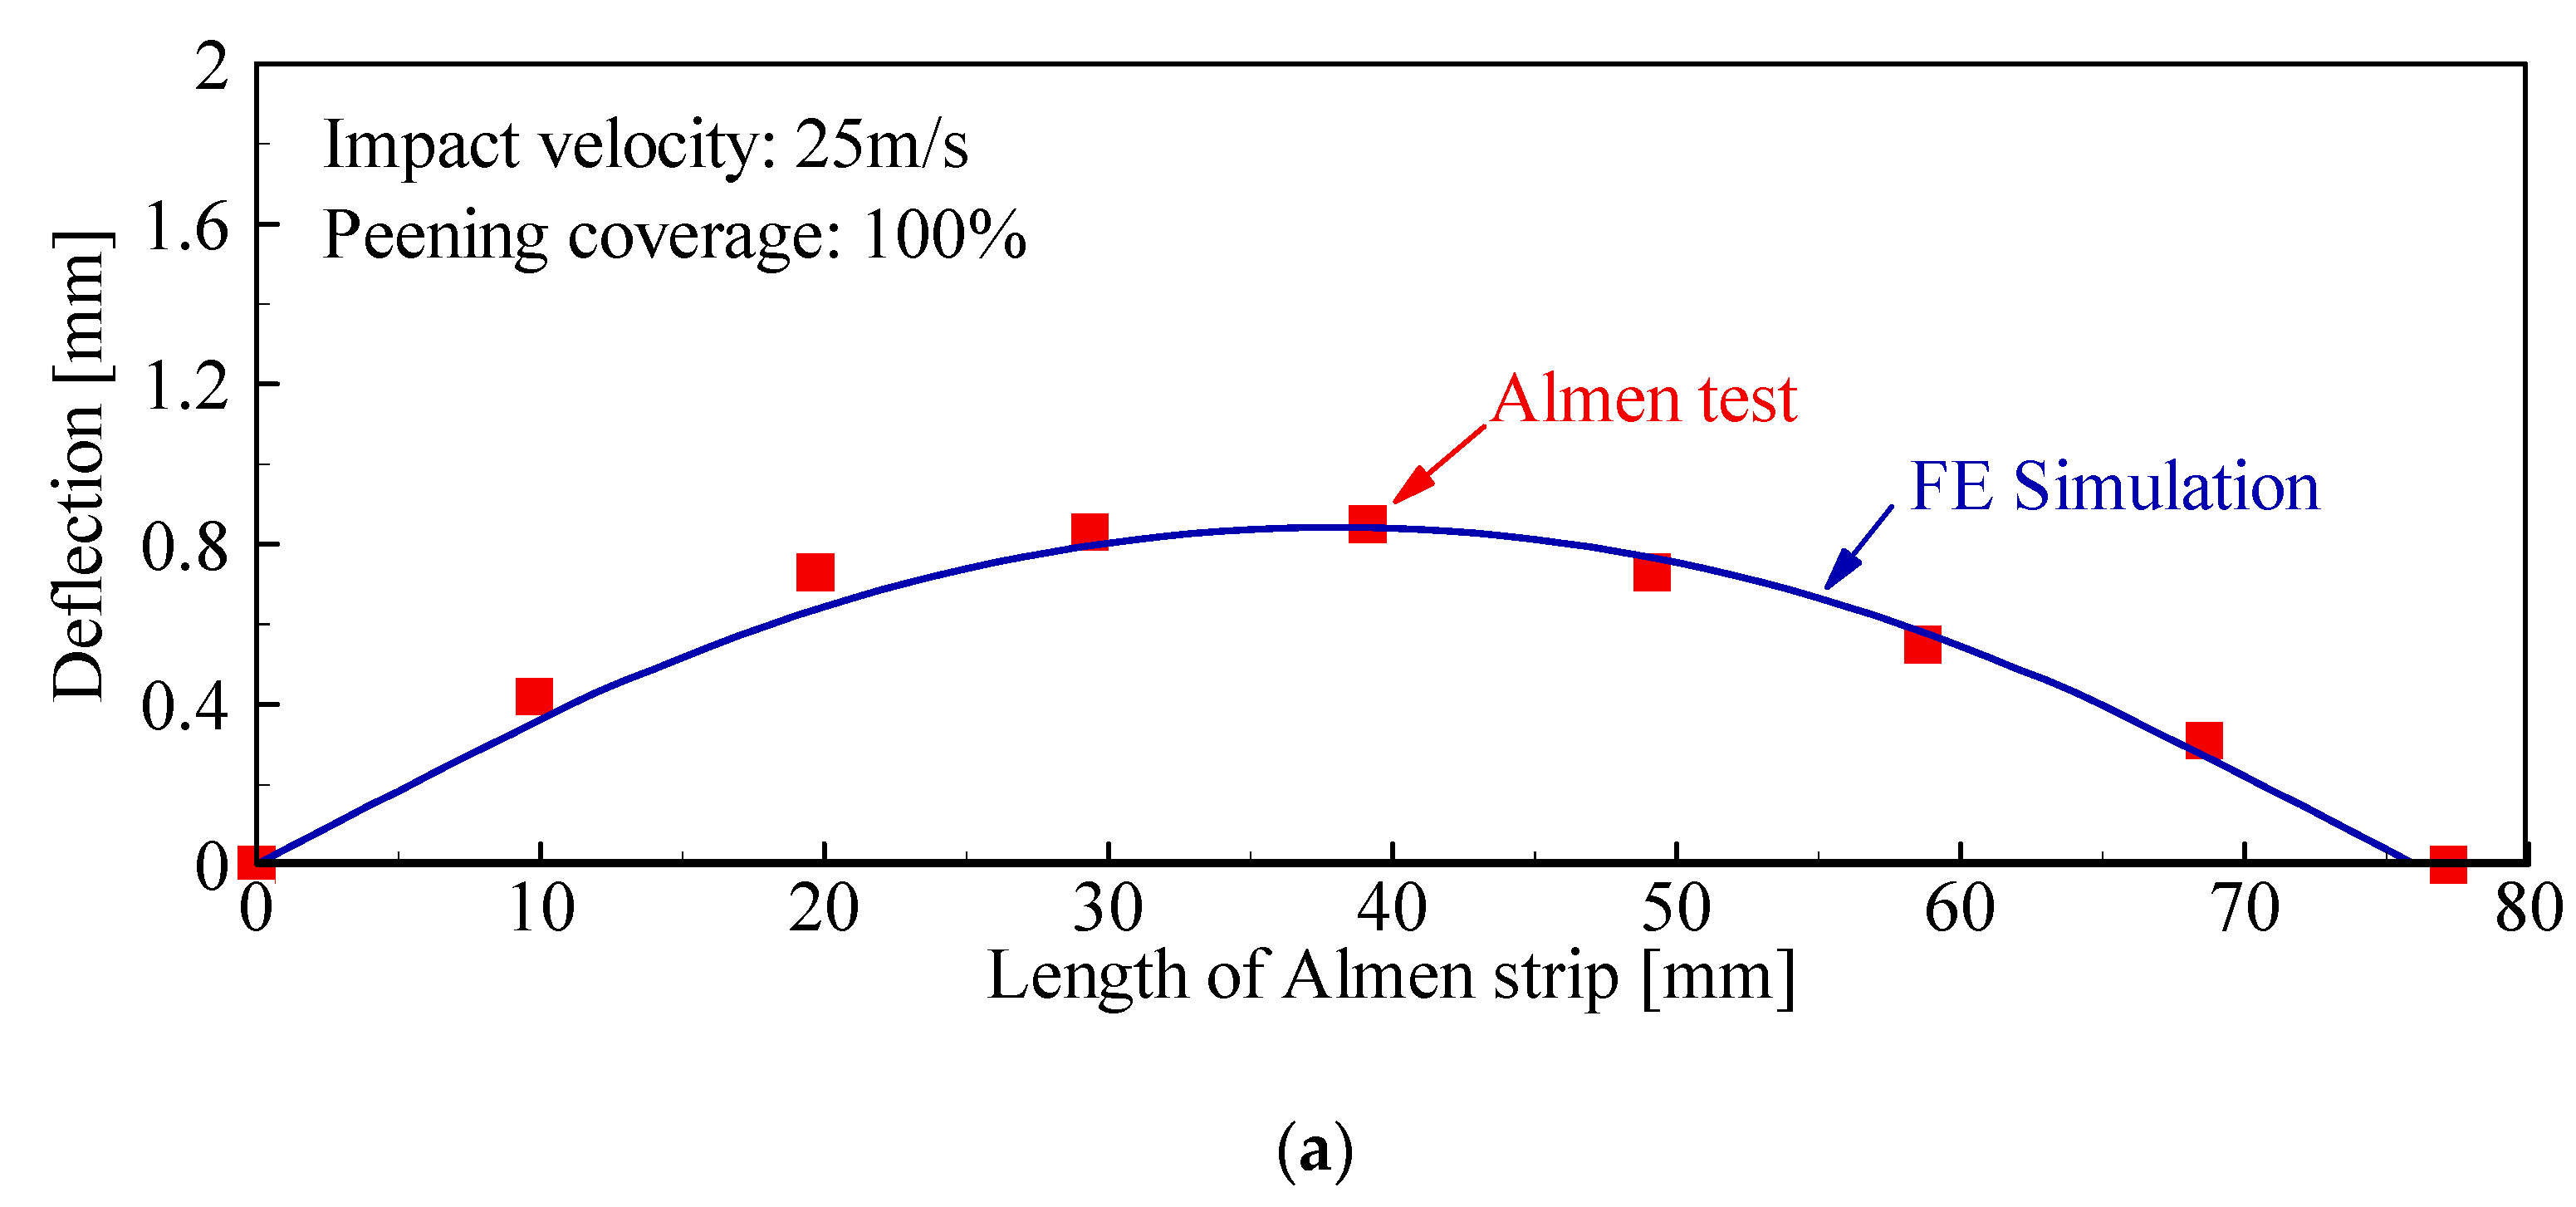
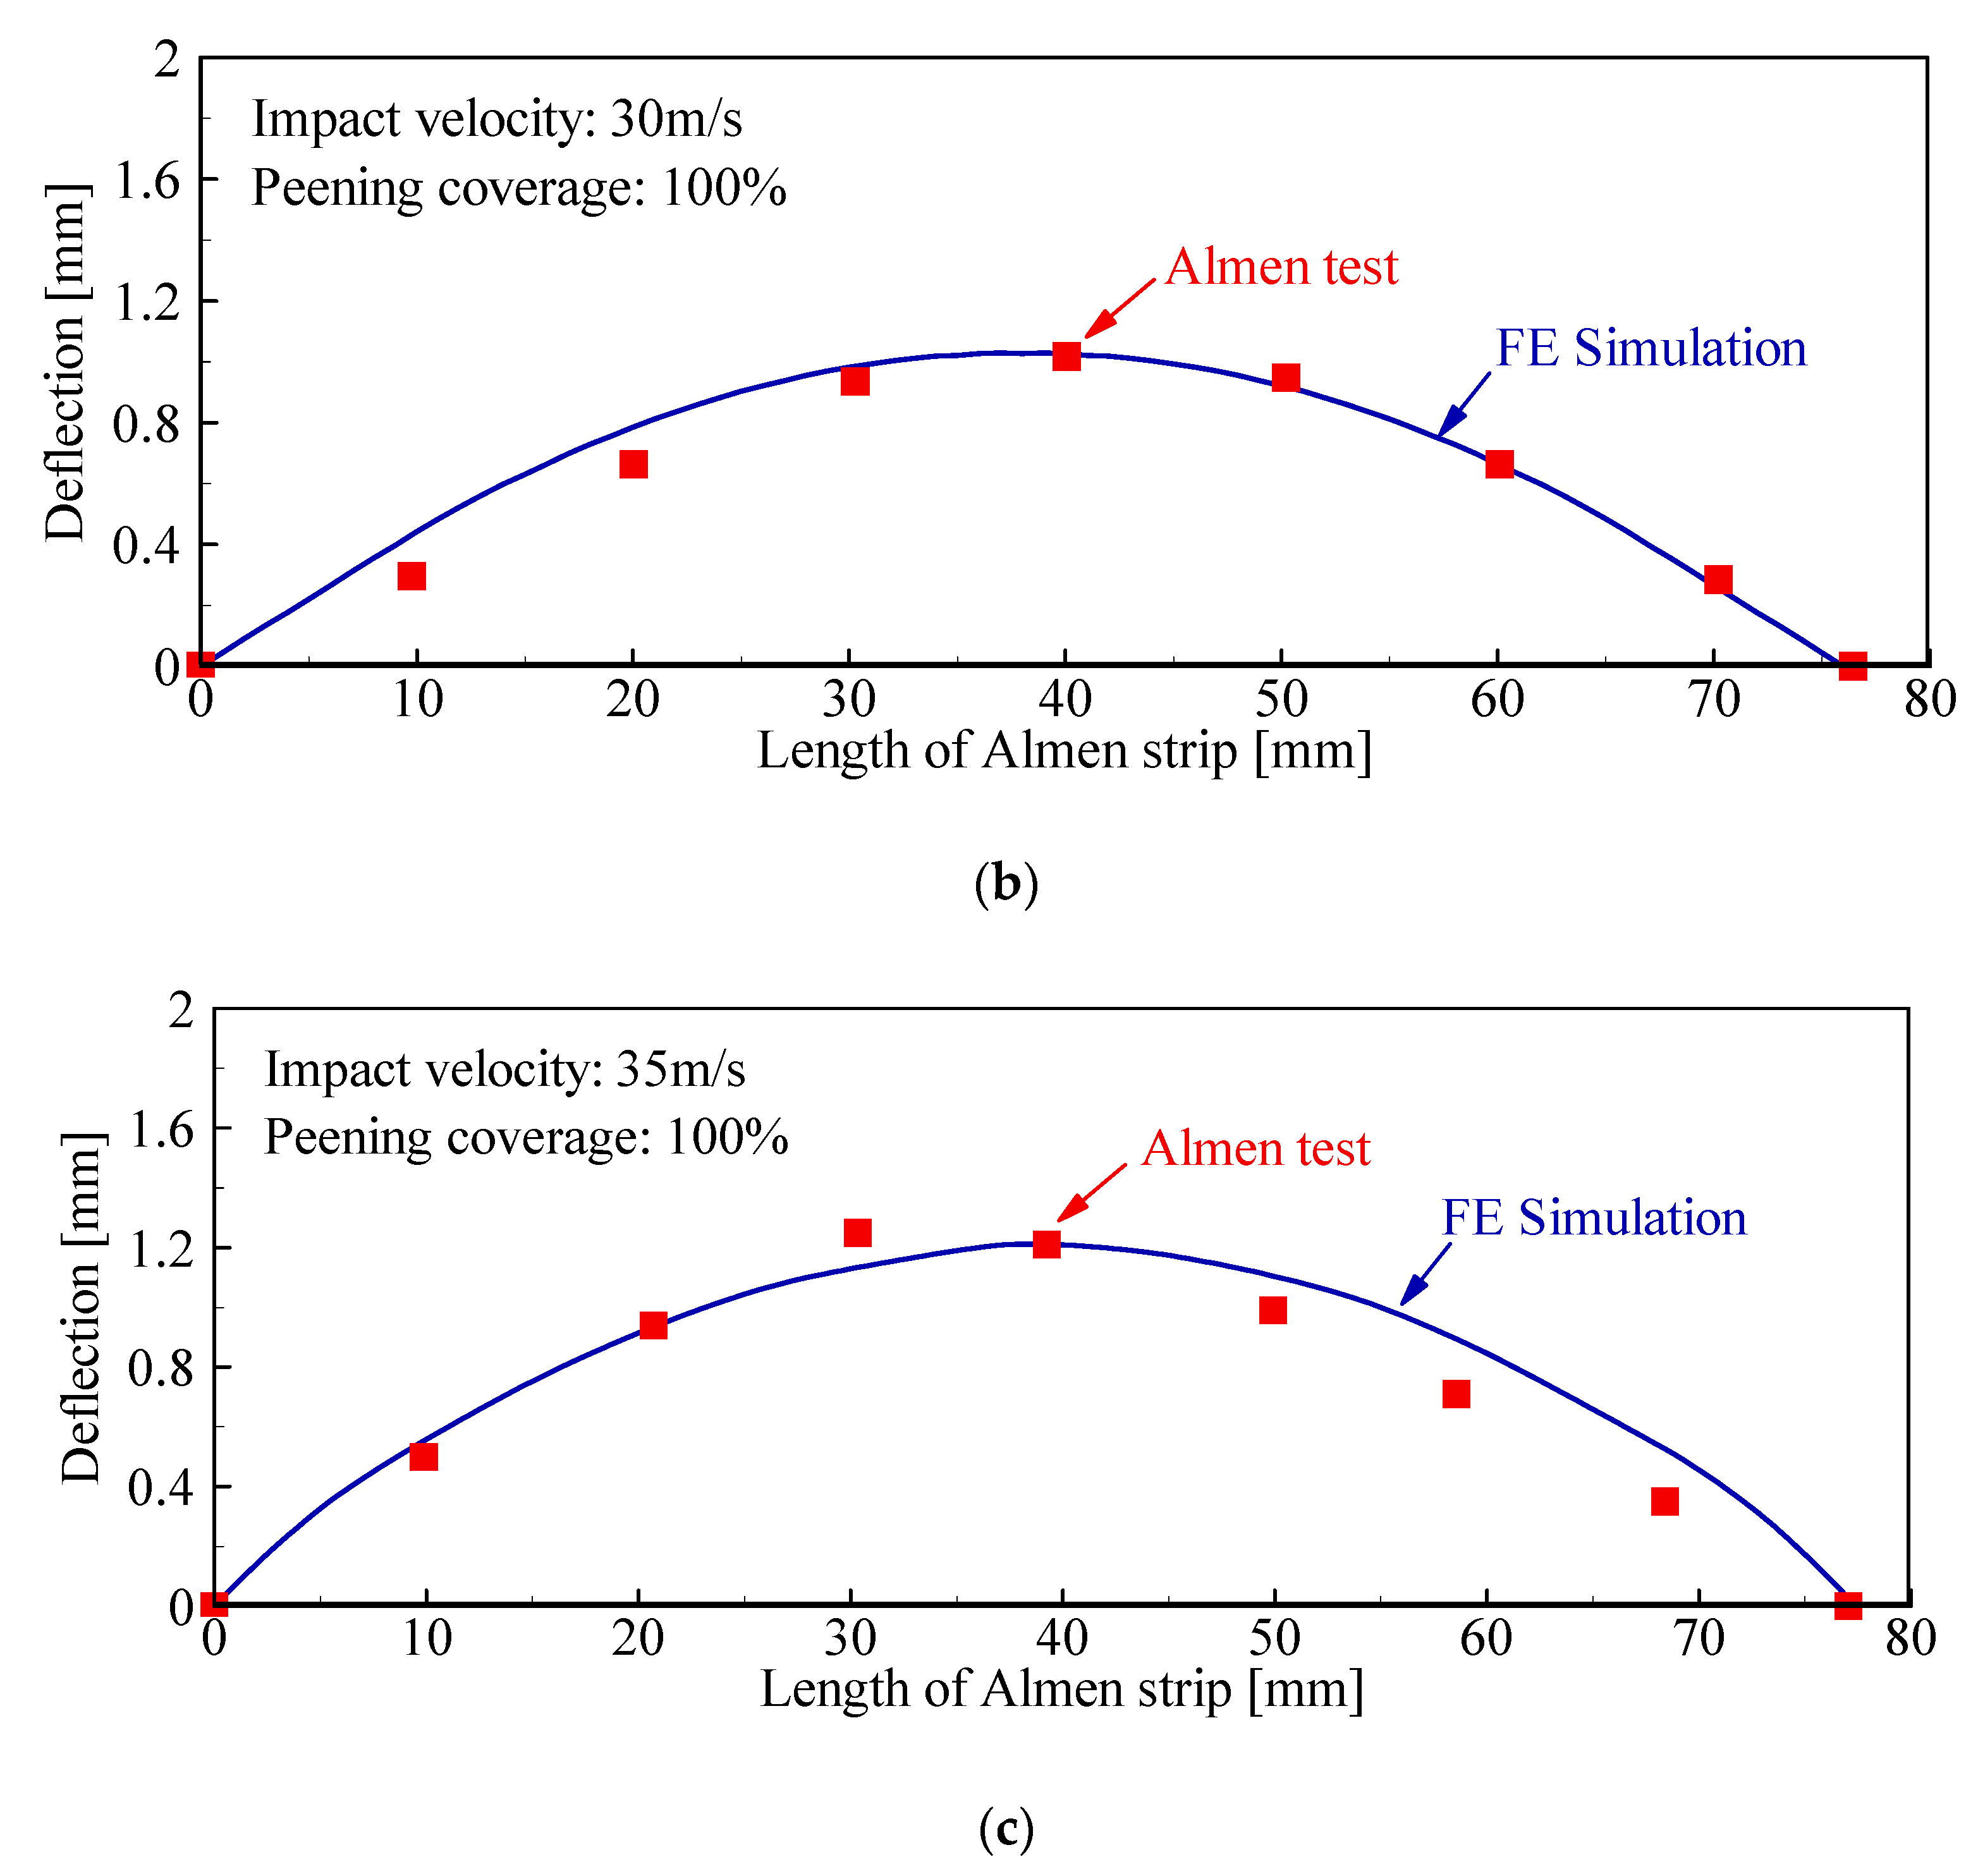
In the Almen test and FE simulation, the impact velocities are both 25, 30, and 35 m/s. In the Almen test, peening coverage reaches 100% when the impact time is 5 s, while in the FE simulation, the peening coverage is also 100%. The Almen strip deflection in the Almen test and FE simulation is shown in Figure 7.
In Figure 7, The red dot points mark the data of the Almen test, while the blue line represents the result of the FE simulation. The simulation results agree well with that of the Almen test. Only small deviation arises near the center of the Almen strip, which may be due to the measurement error of the Almen test. The accuracy of arc height is very high at the center of the Almen strip.
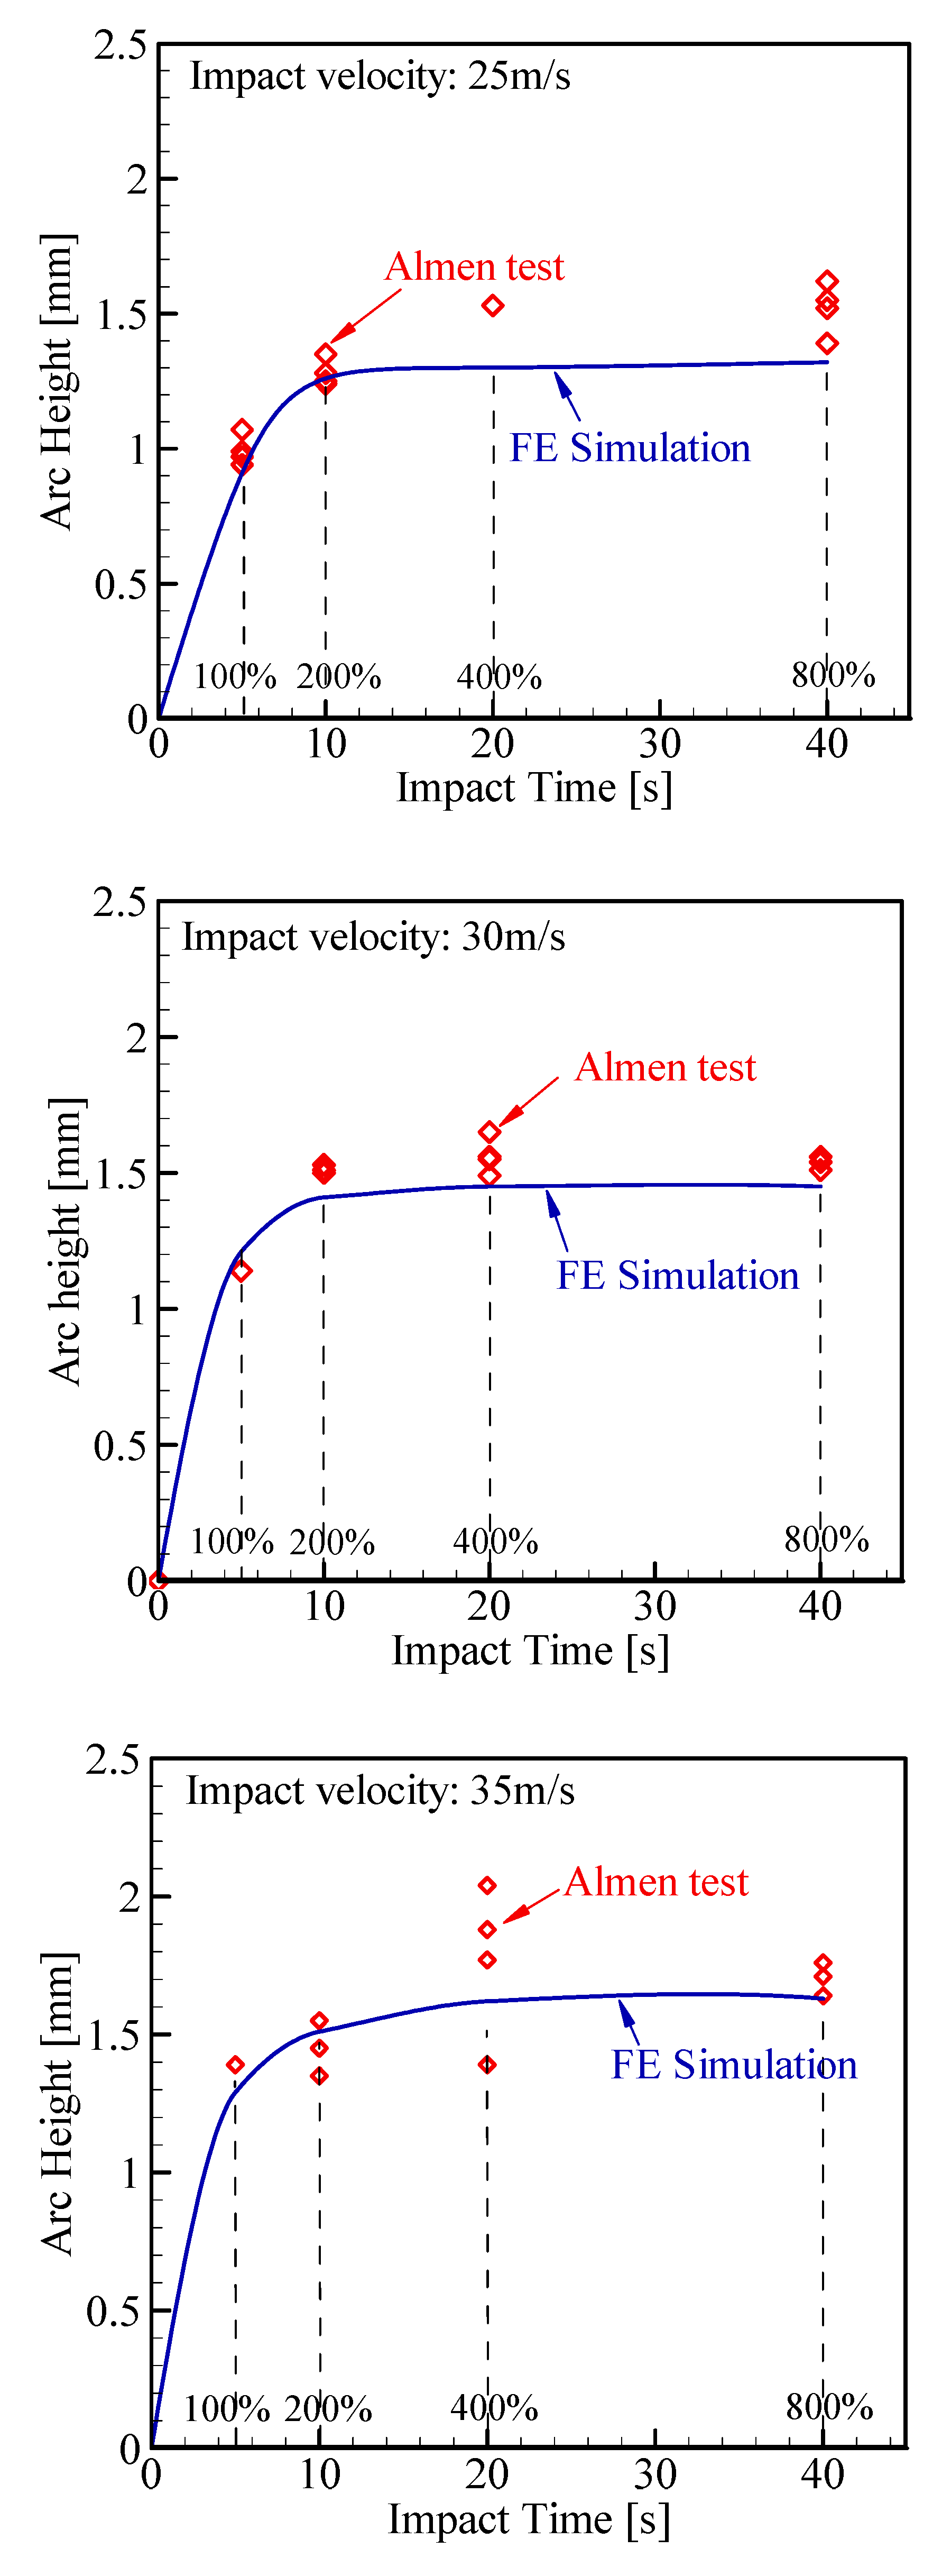
The arc height (maximum value of the deflection) of the Almen strip is measured in the Almen test with different impact velocity of 25, 30, and 35 m/s, and the same impact velocity is used in the FE simulation, respectively. In Almen test the impact time is 5,10,20 and 40 s, the corresponding peening coverage is 100%, 200%, 400%, 800% respectively. The saturation curve of arc height in the Almen test and FE simulation is shown in Figure 8.
In Figure 8, the red dot points mark the arc height in the Almen test, while the blue line represents the arc height in the FE simulation. With the increase of peening coverage, the arc height both increases and then gradually saturate in Almen test and FE simulation. At the impact velocity of 30 m/s, the results of the arc height of the Almen test agree with that of FE simulation best, while at the impact velocity of 25 and 35 m/s, the simulation results basically agree with the Almen test results.
In all, with different conditions, the results of the Almen test and FE simulation are in good agreement, which indicates that the quantitative description of peening coverage and the FE simulation is effective.

4. Analysis of the Influence of High Peening Coverage on Almen Intensity and RCS

4.1. Influence of High Peening Coverage on Almen Intensity

In this section, the influence of the high peening coverage on the Almen intensity with three different dent sizes is studied.
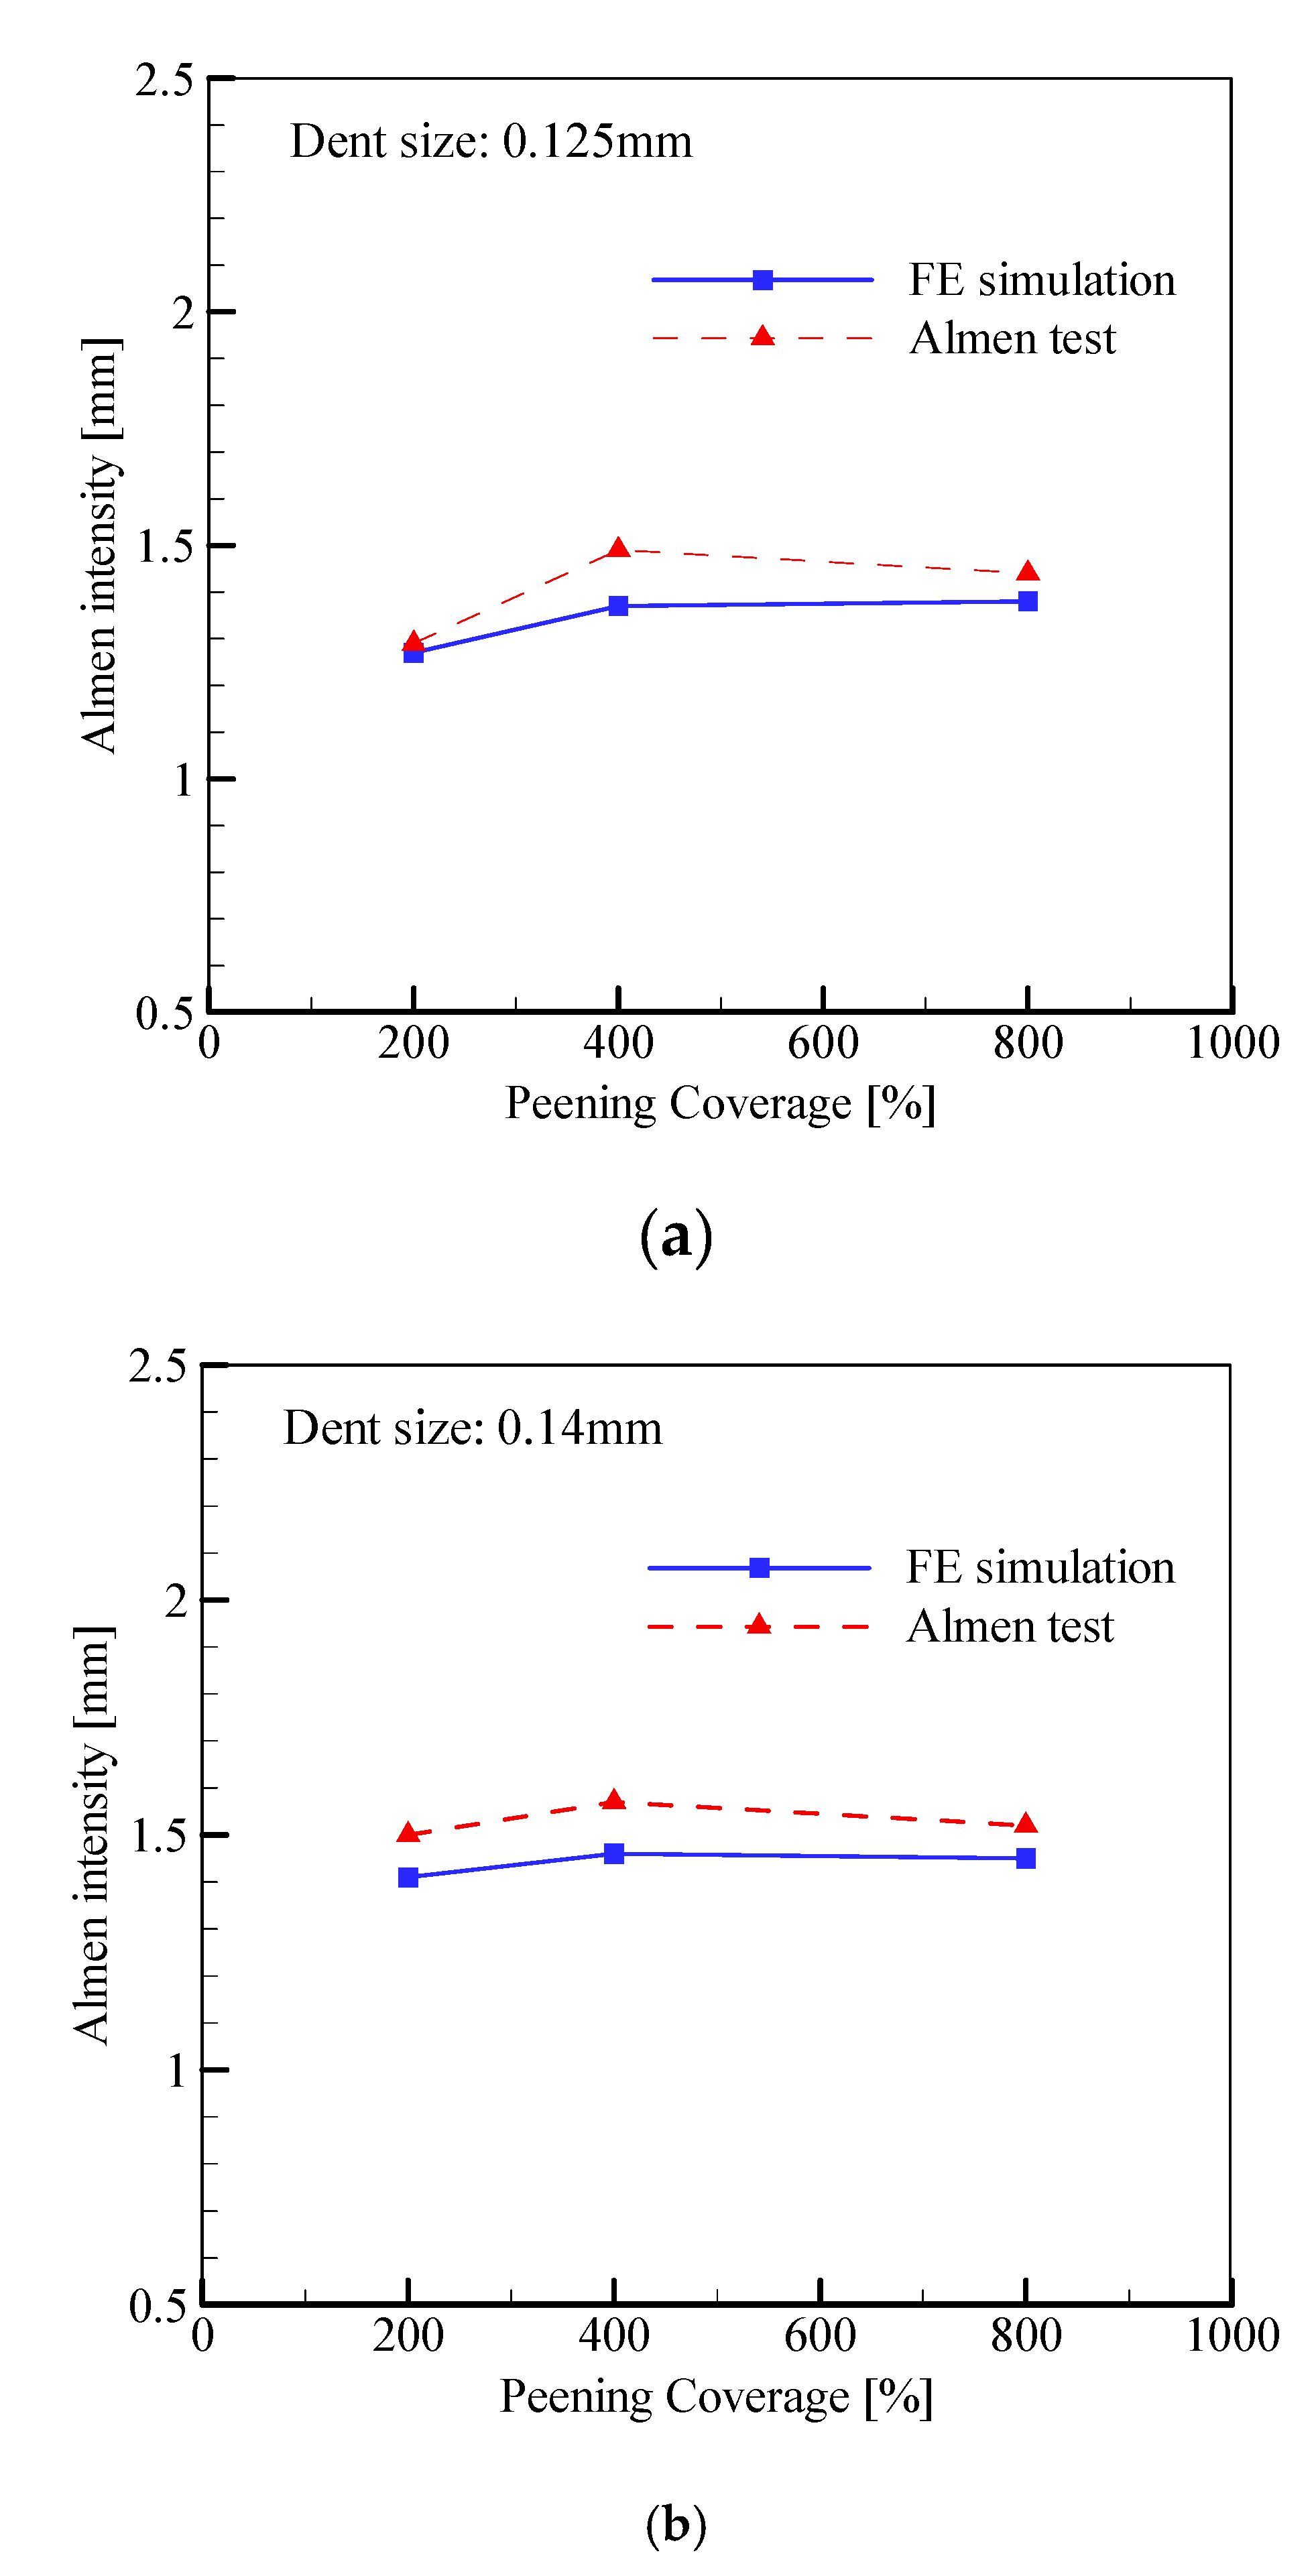
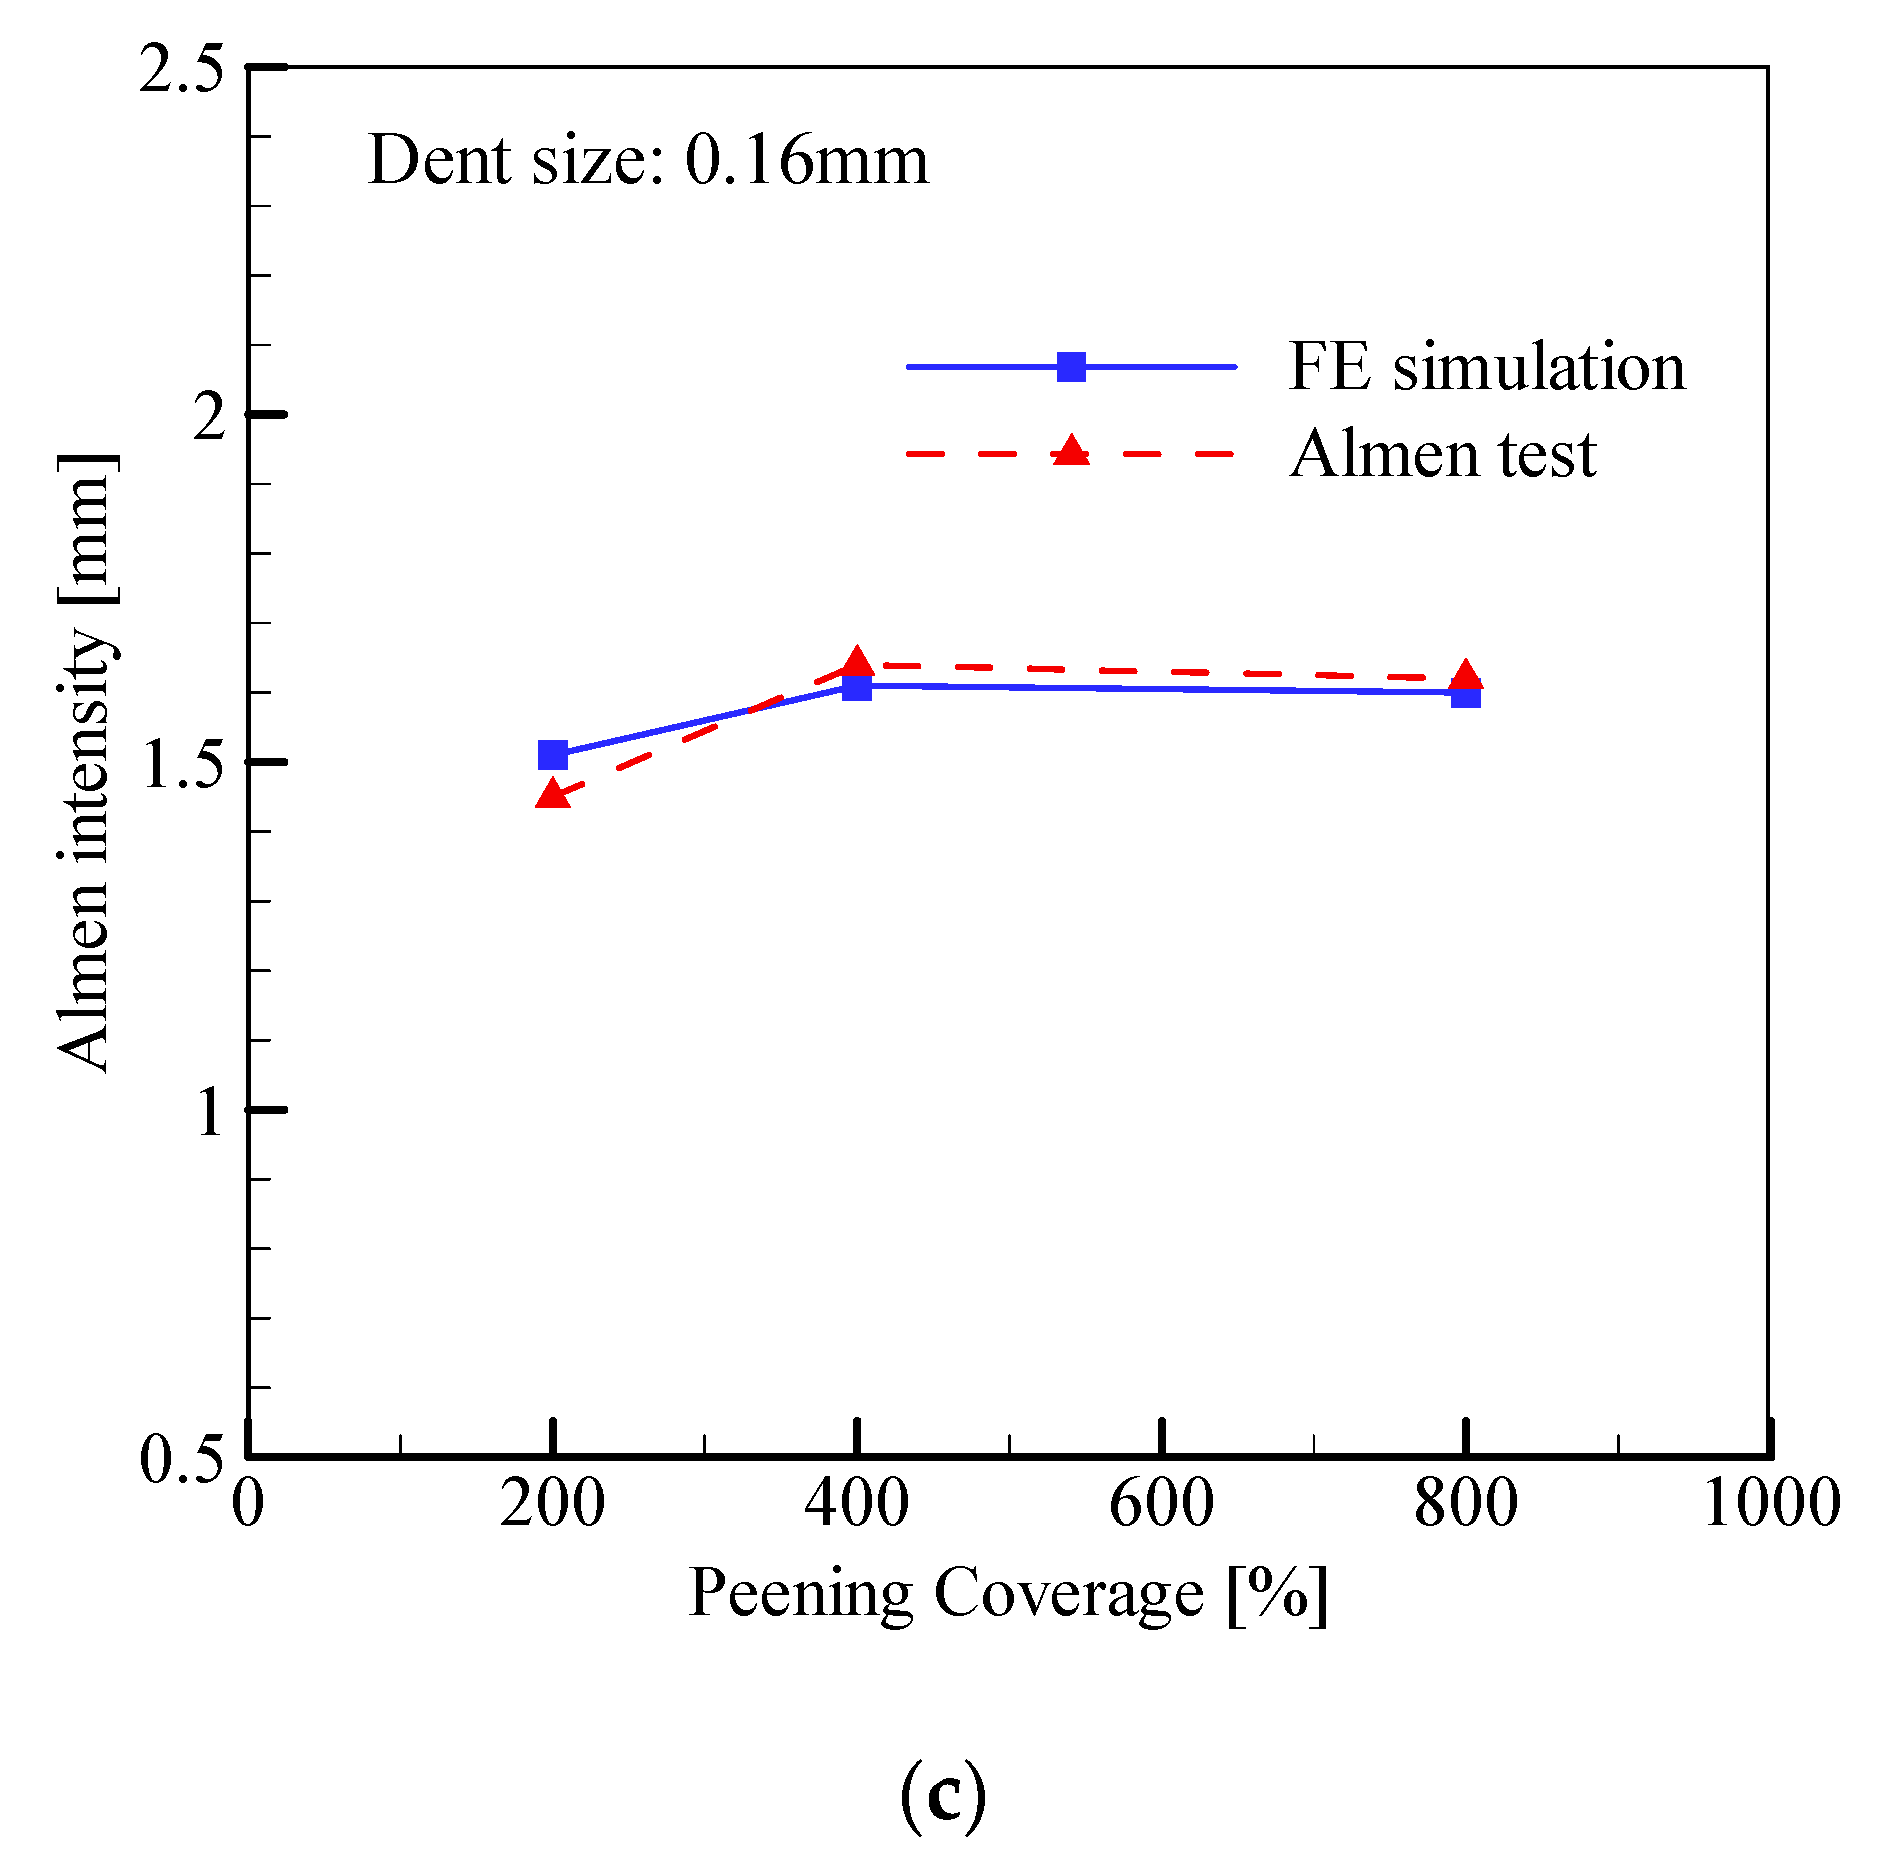
The peening coverage increases from 200% to 800%. The dent size of three cases is 0.125, 0.14, and 0.16 mm. With three dent sizes, the variation of the Almen intensity with the peening coverage is shown in Figure 9, respectively. Figure 9a shown the variation of the Almen intensity at 0.125mm of dent size. Figure 9b,c shows the dent size at 0.14 and 0.16mm, respectively.
From Figure 9, firstly, with dent size of 0.125, 0.14, and 0.16 mm, the FE simulation results agree well with that of the Almen test. Secondly, with dent size of 0.125, 0.14, and 0.16 mm, the Almen intensity all increases firstly and then decreases as the peening coverage increases, there is a maximum value of Almen intensity. In other words, it’s not that the higher the peening coverage, the higher the Almen intensity, which is an important reference for the shot peening process in industry. The reason for the decrease of the Almen intensity with the peening coverage increasing might be the residual stress relaxation of the Almen strip surface.

4.2. Influence of High Peening Coverage on RCS

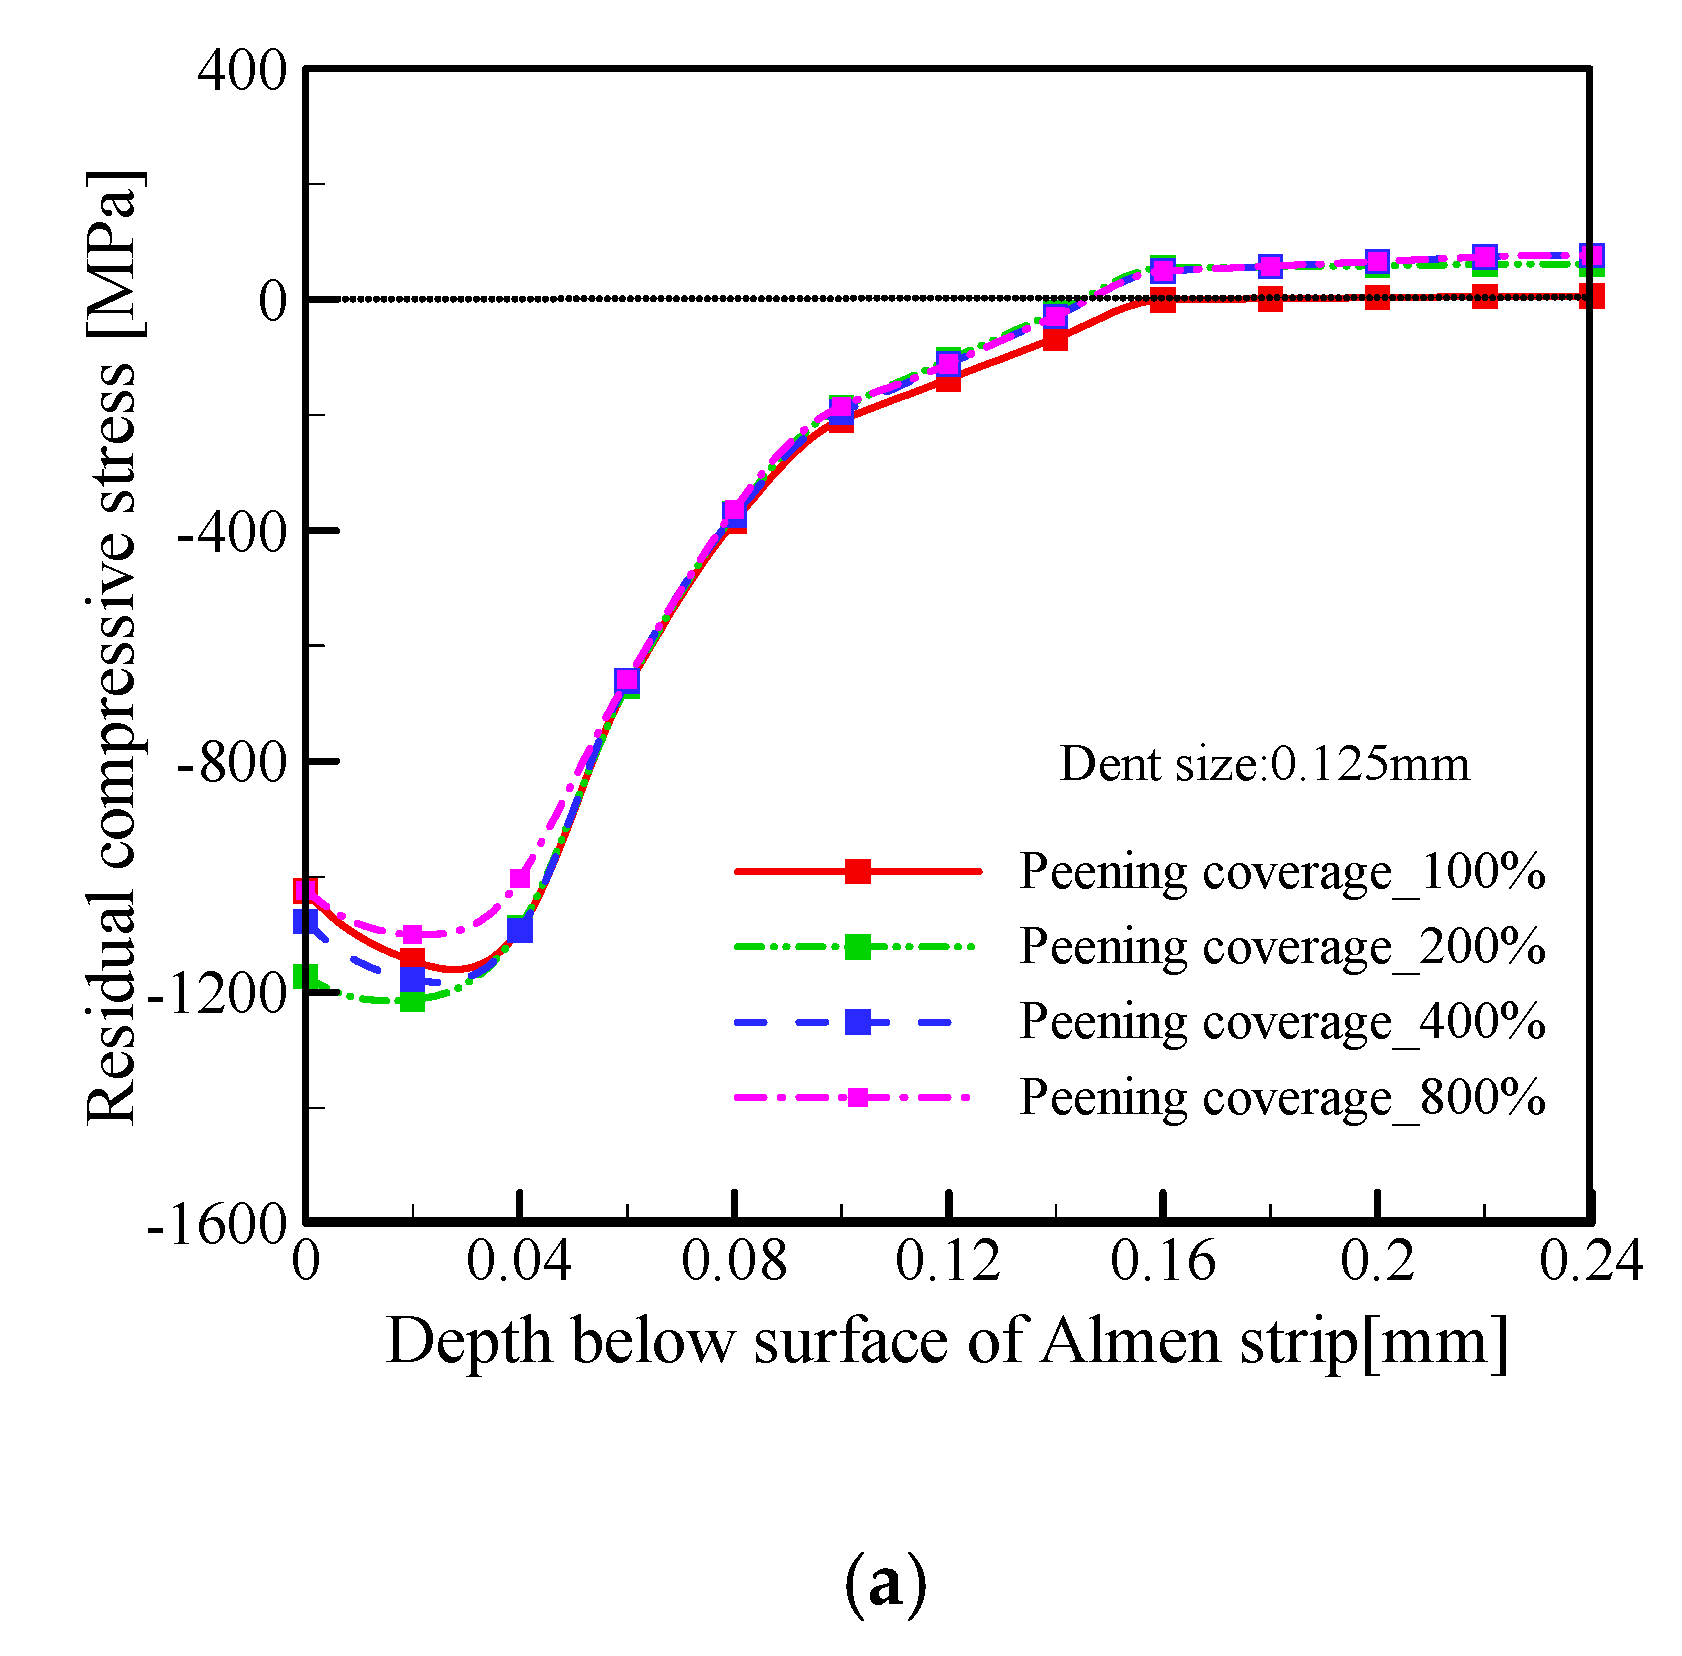
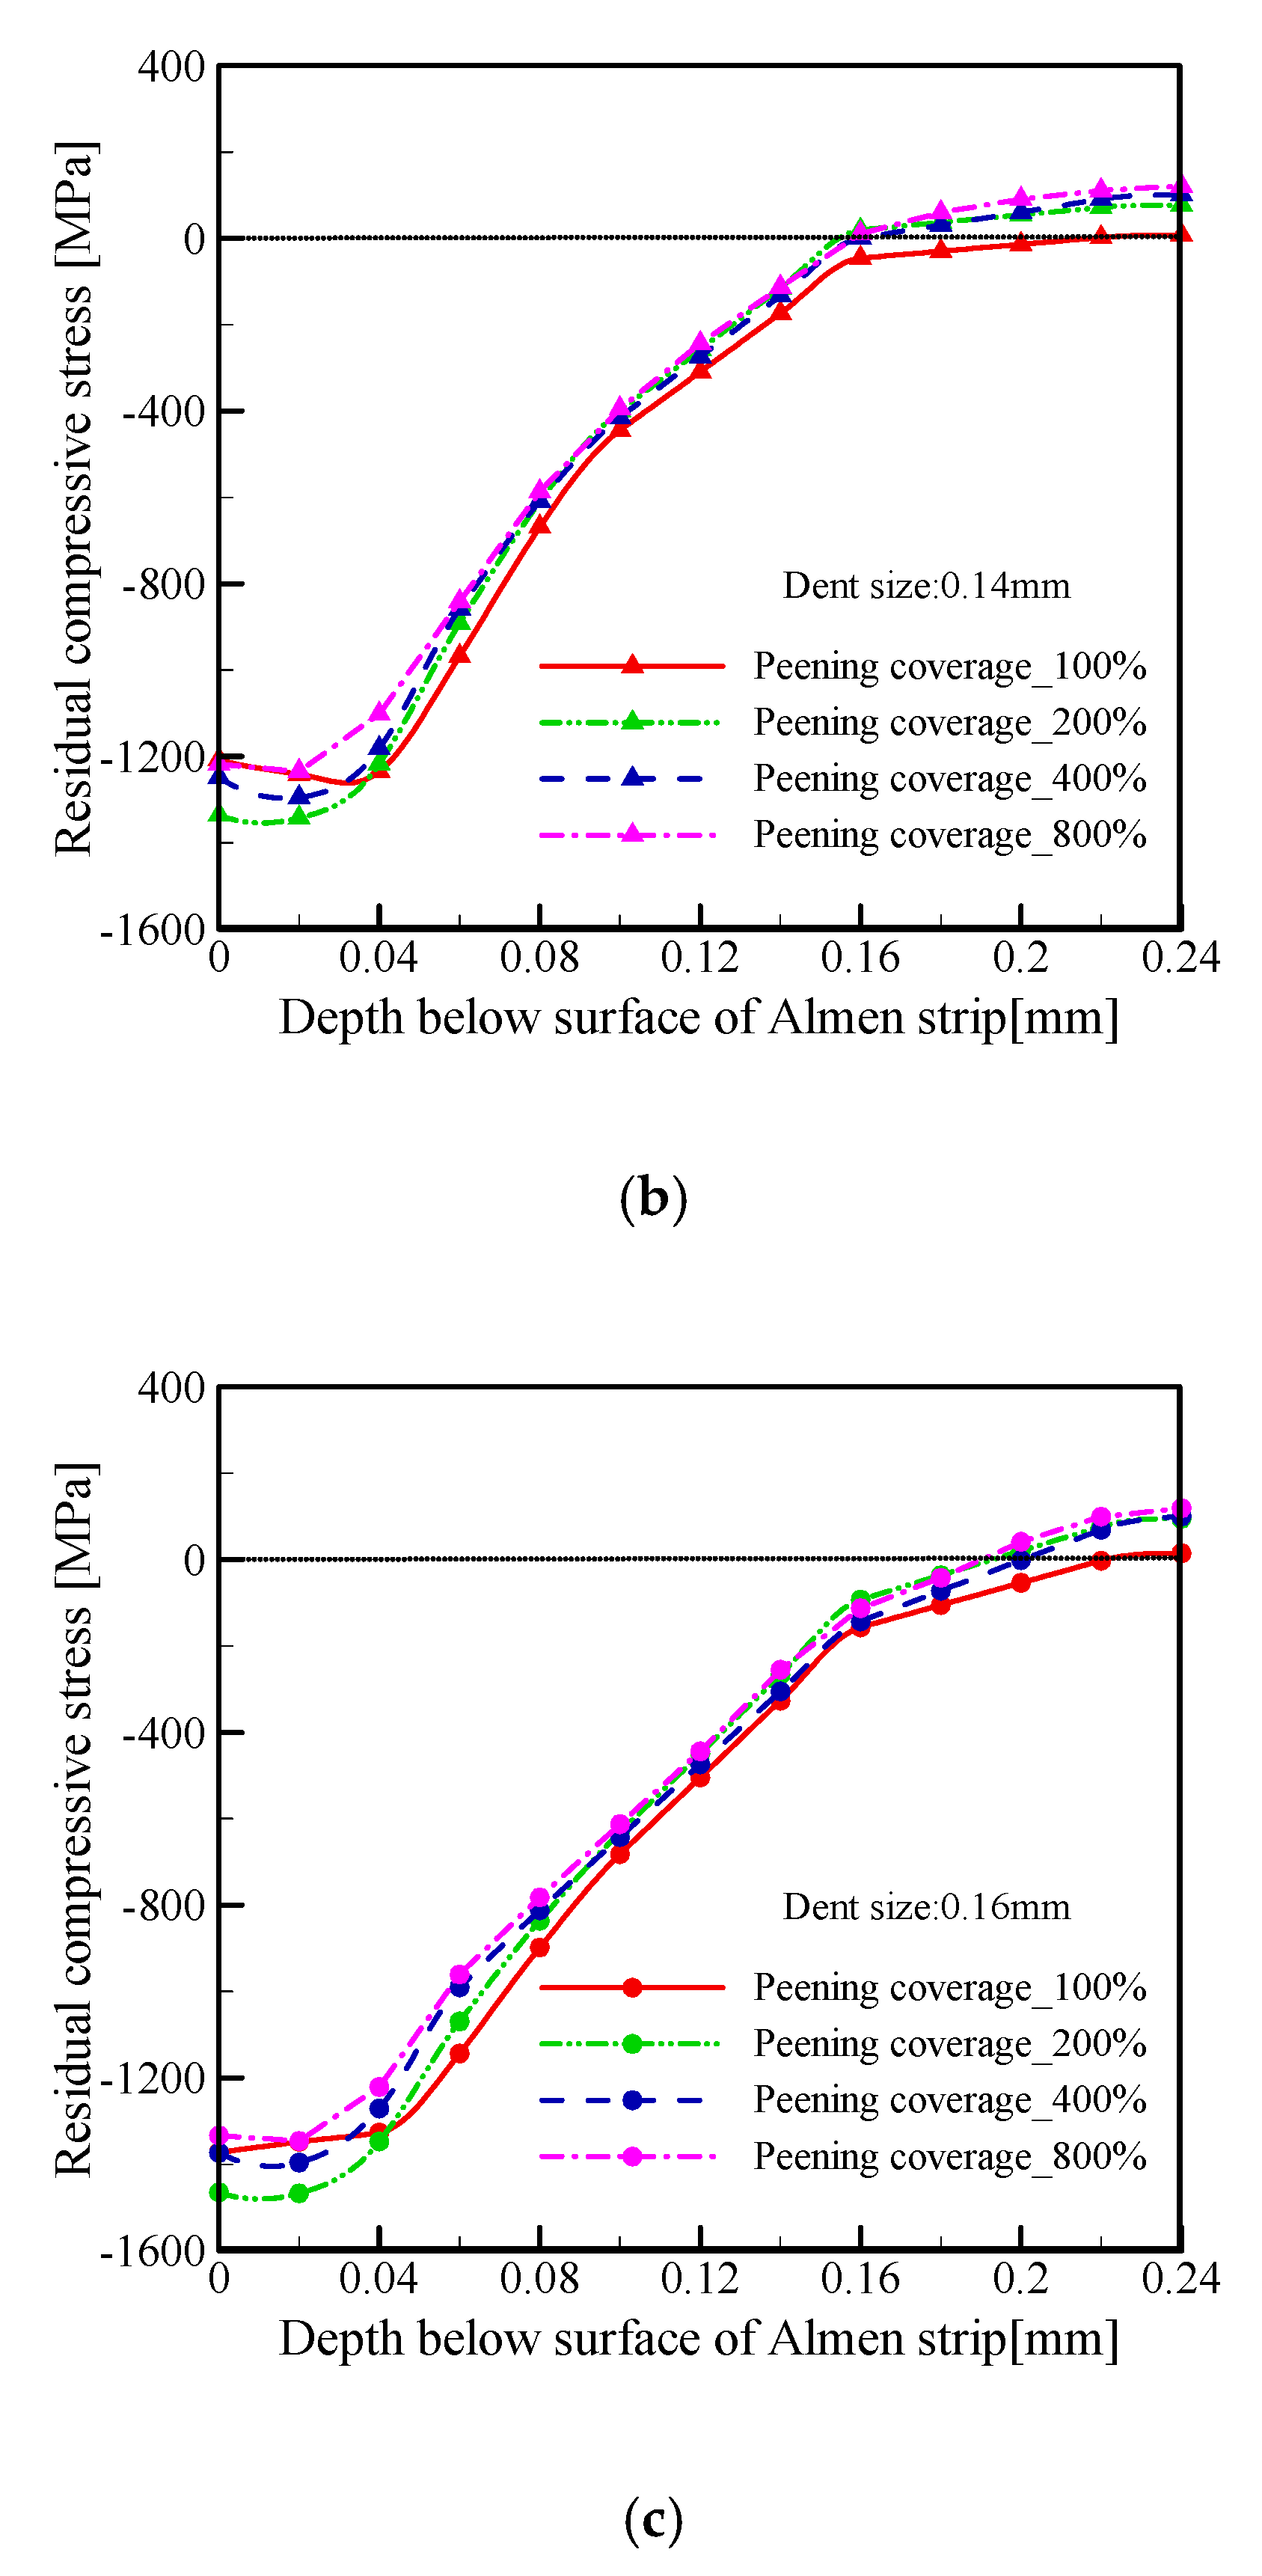
In this section, as the RCS at different depth is difficult to obtain in the Almen test, the distribution of residual compressive stress (RCS) at different depth with the increase of peening coverage is analyzed in FE simulation. Negative value of the RCS represents compression.
The peening coverage is 100%, 200%, 400% and 800%. The dent size of three cases is 0.125, 0.14, and 0.16 mm. With three dent sizes, the distribution of the RCS at different depth is shown in Figure 10 respectively. Figure 10a shown distribution of the RCS at 0.125mm of dent size. Figure 10b,c shows the dent size at 0.14 and 0.16mm, respectively.
From Figure 10, firstly, with dent size of 0.125, 0.14, and 0.16 mm, the absolute value of RCS firstly increases and then decreases with the depth increasing, there is a maximum absolute value of RCS around the depth of 0.02 mm. Secondly, with dent size of 0.125, 0.14, and 0.16 mm, at certain depth, the absolute value of RCS does not always increase with the peening coverage increasing.
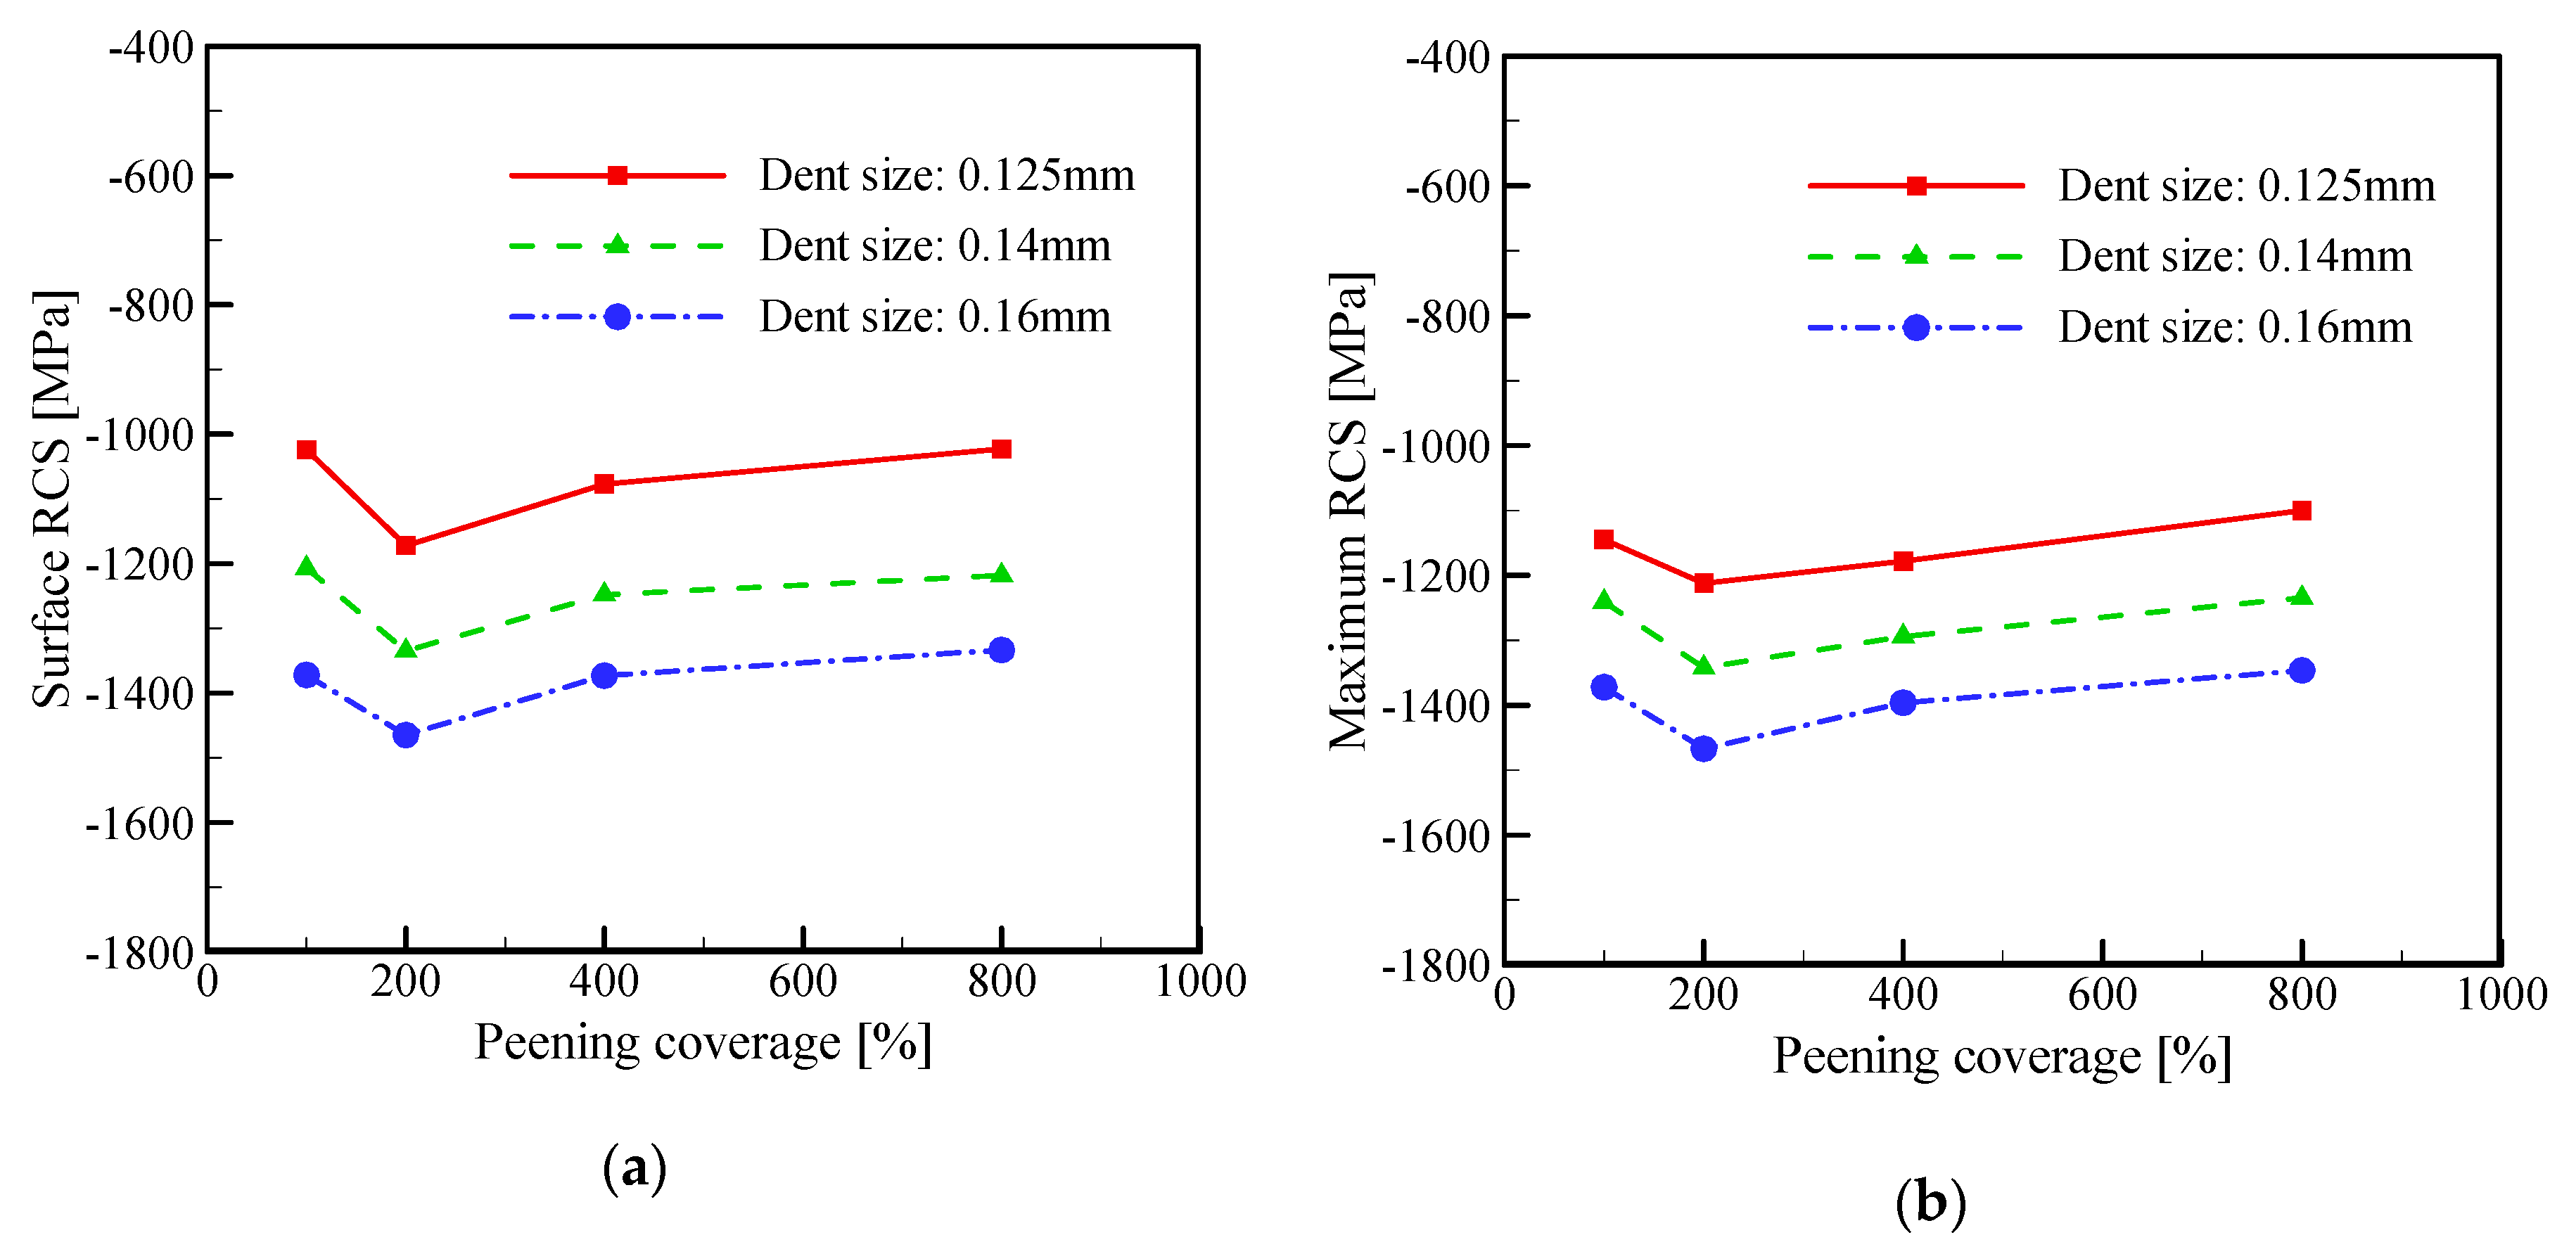
With dent size of 0.125, 0.14, and 0.16 mm, a more detailed analysis of peening coverage and RCS is shown in Figure 11. Surface RCS is the RCS of the Almen strip surface, while the maximum RCS is the minimum value of RCS at different depth as the value of RCS is negative. Figure 11a shows the relation of the surface RCS and the peening coverage, while Figure 11b shows the relation of the maximum RCS and the peening coverage.
From Figure 11, firstly, with dent size of 0.125, 0.14, and 0.16 mm, the absolute value of surface RCS and maximum RCS all increase firstly and then decrease as the peening coverage increases, there is a maximum absolute value of surface RCS and maximum RCS. Secondly, with certain peening coverage, the absolute value of surface RCS and maximum RCS increases as dent size increases.

5. Conclusions

To determine the influence of high peening coverage on Almen intensity and RCS, a quantitative description of the peening coverage has been developed in this paper firstly. Based on the quantitative description, the finite element simulation of the Almen test and Almen test are carried out. The following conclusions can be drawn:
  • With the same peening coverage, arc height of FE simulation and Almen test agrees well, which indicates that the quantitative description of peening coverage and the FE simulation is effective.
  • With dent size of 0.125, 0.14, and 0.16 mm, the Almen intensity all increases firstly and then decreases with the peening coverage increasing, there is a maximum value of Almen intensity, which is very important for shot peening process.
  • With dent size of 0.125, 0.14, and 0.16 mm, there is a maximum absolute value of surface RCS and maximum RCS with the peening coverage increasing. With certain peening coverage, the surface RCS and maximum RCS increases as dent size increases.
Before this study, it is difficult to predicate the influence of high peening coverage on the Almen intensity and RCS well. This study can supply an effective method to solve this problem.

Author Contributions

Z.Y. conceived the paper. Z.Y., Y.L. and S.H. wrote the paper and clarified the key methods and results. W.J. helped in the F.E. simulation. Z.Y., S.H. and J.Z. edited the manuscript. All authors have read and agreed to the published version of the manuscript.

Funding

The authors are grateful to the support by National Key R&D Program of China [Grants No. 2016YFE0125600] and the National Natural Science Foundation of China [Grants No. 51405452].

Conflicts of Interest

The authors declare no conflict of interest.

References

  1. Dimakos, K.; Mariotto, A.; Giacosa, F. Optimization of the fatigue resistance of nitinol stents through shot peening. Procedia Struct. Integr. 2016, 2, 1522–1529. [Google Scholar] [CrossRef] [Green Version]
  2. Gholami, M.; Altenberger, I.; Kuhn, H.A.; Wollmann, M.; Wagner, L. Effects of shot peening on the fatigue performance of ultrafine-grained CuNi3Si1Mg. Surf. Eng. 2017, 33, 706–714. [Google Scholar] [CrossRef]
  3. Segurado, E.; Belzunce, F.J.; Pariente, I.F. Effects of low intensity shot peening treatments applied with different types of shots on the fatigue performance of a high-strength steel. Surf. Coat. Technol. 2018, 340, 25–35. [Google Scholar] [CrossRef]
  4. Ferreira, N.; Antunes, P.; Ferreira, J.; Costa, J.; Capela, C. Effects of Shot-Peening and Stress Ratio on the Fatigue Crack Propagation of AL 7475-T7351 Specimens. Appl. Sci. 2018, 8, 375. [Google Scholar] [CrossRef] [Green Version]
  5. John, O.A.; Royal, O.M. Shot Blasting Test. U.S. Patent Office No. 440,987, 25 February 1944. [Google Scholar]
  6. Miao, H.Y.; Larose, S.; Perron, C.; Lévesque, M. An analytical approach to relate shot peening parameters to Almen intensity. Surf. Coat. Technol. 2010, 205, 2055–2066. [Google Scholar] [CrossRef]
  7. Guechichi, H.; Castex, L.; Benkhettab, M. An analytical model to relate shot peening Almen intensity to shot velocity. Mech. Based Des. Struct. 2013, 41, 79–99. [Google Scholar] [CrossRef]
  8. Unal, O.; Varol, R. Almen intensity effect on microstructure and mechanical properties of low carbon steel subjected to severe shot peening. Appl. Surf. Sci. 2014, 290, 40–47. [Google Scholar] [CrossRef]
  9. Unal, O. Optimization of shot peening parameters by response surface methodology. Surf. Coat. Technol. 2016, 305, 99–109. [Google Scholar] [CrossRef]
  10. Ahmed, A.A.; Mhaede, M.; Basha, M.; Wollmann, M.; Wagner, L. The effect of shot peening parameters and hydroxyapatite coating on surface properties and corrosion behavior of medical grade AISI 316L stainless steel. Surf. Coat. Technol. 2015, 280, 347–358. [Google Scholar] [CrossRef]
  11. Jebahi, M.; Gakwaya, A.; Lévesque, J.; Mechri, O.; Ba, K. Robust methodology to simulate real shot peening process using discrete-continuum coupling method. Int. J. Mech. Sci. 2016, 107, 21–33. [Google Scholar] [CrossRef] [Green Version]
  12. Atig, A.; Sghaier, R.B.; Seddik, R.; Fathallah, R. Probabilistic methodology for predicting the dispersionof residual stresses and Almen intensity considering shot peening process uncertainties. Int. J. Adv. Manuf. Tech. 2018, 94, 2125–2136. [Google Scholar] [CrossRef]
  13. David, K. Quantification of Shot Peening Intensity Rating. Shot Peener Mag. 2015, 32, 26–34. [Google Scholar]
  14. Cao, W.; Fathallah, R.; Castex, L. Correlation of Almen arc height with residual stresses in shot peening process. Mater. Sci. Technol. 1995, 11, 967–973. [Google Scholar] [CrossRef]
  15. Guagliano, M. Relating Almen intensity to residual stresses induced by shot peening: A numerical approach. J. Mater. Process. Technol. 2001, 110, 277–286. [Google Scholar] [CrossRef]
  16. Bhuvaraghan, B.; Srinivasan, S.M.; Maffeo, B.; Prakash, O. Analytical solution for single and multiple impacts with strain-rate effects for shot peening. Comp. Model. Eng. Sci. 2010, 57, 137. [Google Scholar]
  17. Bhuvaraghan, B.; Srinivasan, S.M.; Maffeo, B.; McCLain, R.D.; Potdar, Y.; Prakash, O. Shot peening simulation using discrete and finite element methods. Adv. Eng. Softw. 2010, 41, 1266–1276. [Google Scholar] [CrossRef]
  18. Hu, D.Y.; Gao, Y.; Meng, F.C.; Song, J.; Wang, Y.F.; Ren, M.X.; Wang, R.Q. A unifying approach in simulating the shot peening process using a 3D random representative volume finite element model. Chin. J. Aeronaut. 2017, 30, 1592–1602. [Google Scholar] [CrossRef]
  19. Marini, M.; Fontanari, V.; Bandini, M.; Benedetti, M. Surface layer modifications of micro-shot-peened Al-7075-T651: Experiments and stochastic numerical simulations. Surf. Coat. Technol. 2017, 321, 265–278. [Google Scholar] [CrossRef]
  20. Tu, F.; Delbergue, D.; Klotz, T.; Bag, A.; Miao, H.; Bianchetti, C.; Brochu, M.; Bocher, P.; Levesque, M. Discrete element-periodic cell coupling model and investigations on shot stream expansion, Almen intensities and target materials. Int. J. Mech. Sci. 2018, 145, 353–366. [Google Scholar] [CrossRef]
  21. Bagherifard, S.; Ghelichi, R.; Guagliano, M. On the shot peening surface coverage and its assessment by means of finite element simulation: A critical review and some original developments. Appl. Surf. Sci. 2012, 259, 186–194. [Google Scholar] [CrossRef]
  22. Miao, H.Y.; Larose, S.; Perron, C.; Lévesque, M. On the potential applications of a 3D random finite element model for the simulation of shot peening. Adv. Eng. Softw. 2009, 40, 1023–1038. [Google Scholar] [CrossRef]
  23. Majzoobi, G.H.; Azizi, R.; Nia, A.A. A three-dimensional simulation of shot peening process using multiple shot impacts. J. Mater. Process. Technol. 2005, 164, 1226–1234. [Google Scholar] [CrossRef]
  24. Klemenz, M.; Schulze, V.; Rohr, I.; Löhe, D. Application of the FEM for the prediction of the surface layer characteristics after shot peening. J. Mater. Process. Technol. 2009, 209, 4093–4102. [Google Scholar] [CrossRef]
  25. Kubler, R.F.; Berveiller, S.; Bouscaud, D.; Guiheux, R.; Patoor, E.; Puydt, Q. Shot peening of TRIP780 steel: Experimental analysis and numerical simulation. J. Mater. Process. Technol. 2019, 270, 182–194. [Google Scholar] [CrossRef] [Green Version]
  26. Mylonas, G.I.; Labeas, G. Numerical modelling of shot peening process and corresponding products: Residual stress, surface roughness and cold work prediction. Surf. Coat. Technol. 2011, 205, 4480–4494. [Google Scholar] [CrossRef]
  27. Yang, Z.R.; Park, J.S.; Lee, Y. A strip holding system for finite element simulation of Almen strip testing. J. Mech. Sci. Technol. 2014, 28, 2825–2830. [Google Scholar] [CrossRef]
  28. David, K. The importance of work. Shot Peen. Mag. 2014, 31, 26–36. [Google Scholar]
  29. Hibbit, H.D.; Karlsson, B.I.; Sorensen, E.P. ABAQUS User Manual; Version 6.12; Simulia: Providence, RI, USA, 2012. [Google Scholar]
  30. Kim, T.; Lee, J.H.; Lee, H.; Cheong, S.K. An area-average approach to peening residual stress under multi-impacts using a three-dimensional symmetry-cell finite element model with plastic shots. Mater. Des. 2010, 31, 50–59. [Google Scholar] [CrossRef]
  31. Meo, M.; Vignjevic, R. Finite element analysis of residual stress induced by shot peening process. Adv. Eng. Softw. 2003, 34, 569–575. [Google Scholar] [CrossRef]
  32. Frija, M.; Hassine, T.; Fathallah, R.; Bouraoui, C.; Dogui, A.; de Génie Mécanique, L. Finite element modelling of shot peening process: Prediction of the compressive residual stresses, the plastic deformations and the surface integrity. Mat. Sci. Eng. A 2006, 426, 173–180. [Google Scholar] [CrossRef]
  33. Hong, T.; Ooi, J.Y.; Shaw, B.A. A numerical study of the residual stress pattern from single shot impacting on a metallic component. Adv. Eng. Softw. 2008, 39, 743–756. [Google Scholar] [CrossRef]
  34. Meguid, S.A.; Shagal, G.; Stranart, J.C. 3D FE analysis of peening of strain-rate sensitive materials using multiple impingement model. Int. J. Impact Eng. 2002, 27, 119–134. [Google Scholar] [CrossRef]
  35. Meguid, S.A.; Maricic, L.A. Finite element modeling of shot peening residual stress relaxation in turbine disk assemblies. J. Eng. Mater. Technol. 2015, 137, 031003. [Google Scholar] [CrossRef]
  36. Zimmermann, M.; Schulze, V.; Baron, H.U.; Löhe, D. A novel 3D finite element simulation model for the prediction of the residual stress state after shot peening. In Proceedings of the 10th International Conference on Shot Peening, Tokyo, Japan, 15–18 September 2008. [Google Scholar]
  37. Bagherifard, S.; Ghelichi, R.; Guagliano, M. A numerical model of severe shot peening (SSP) to predict the generation of a nanostructured surface layer of material. Surf. Coat. Technol. 2010, 204, 4081–4090. [Google Scholar] [CrossRef]
  38. Ullah, H.; Ullah, B.; Muhammad, R. Dynamic numerical simulation of plastic deformation and residual stress in shot peening of aluminum alloy. Struct. Eng. Mech. 2017, 63, 1–9. [Google Scholar]
  39. SAE. Test. Strip, Holder and Gage for Shot Peening; Society of Automotive Engineers, Inc.: Warrendale, PA, USA, 2004; p. J442. [Google Scholar]
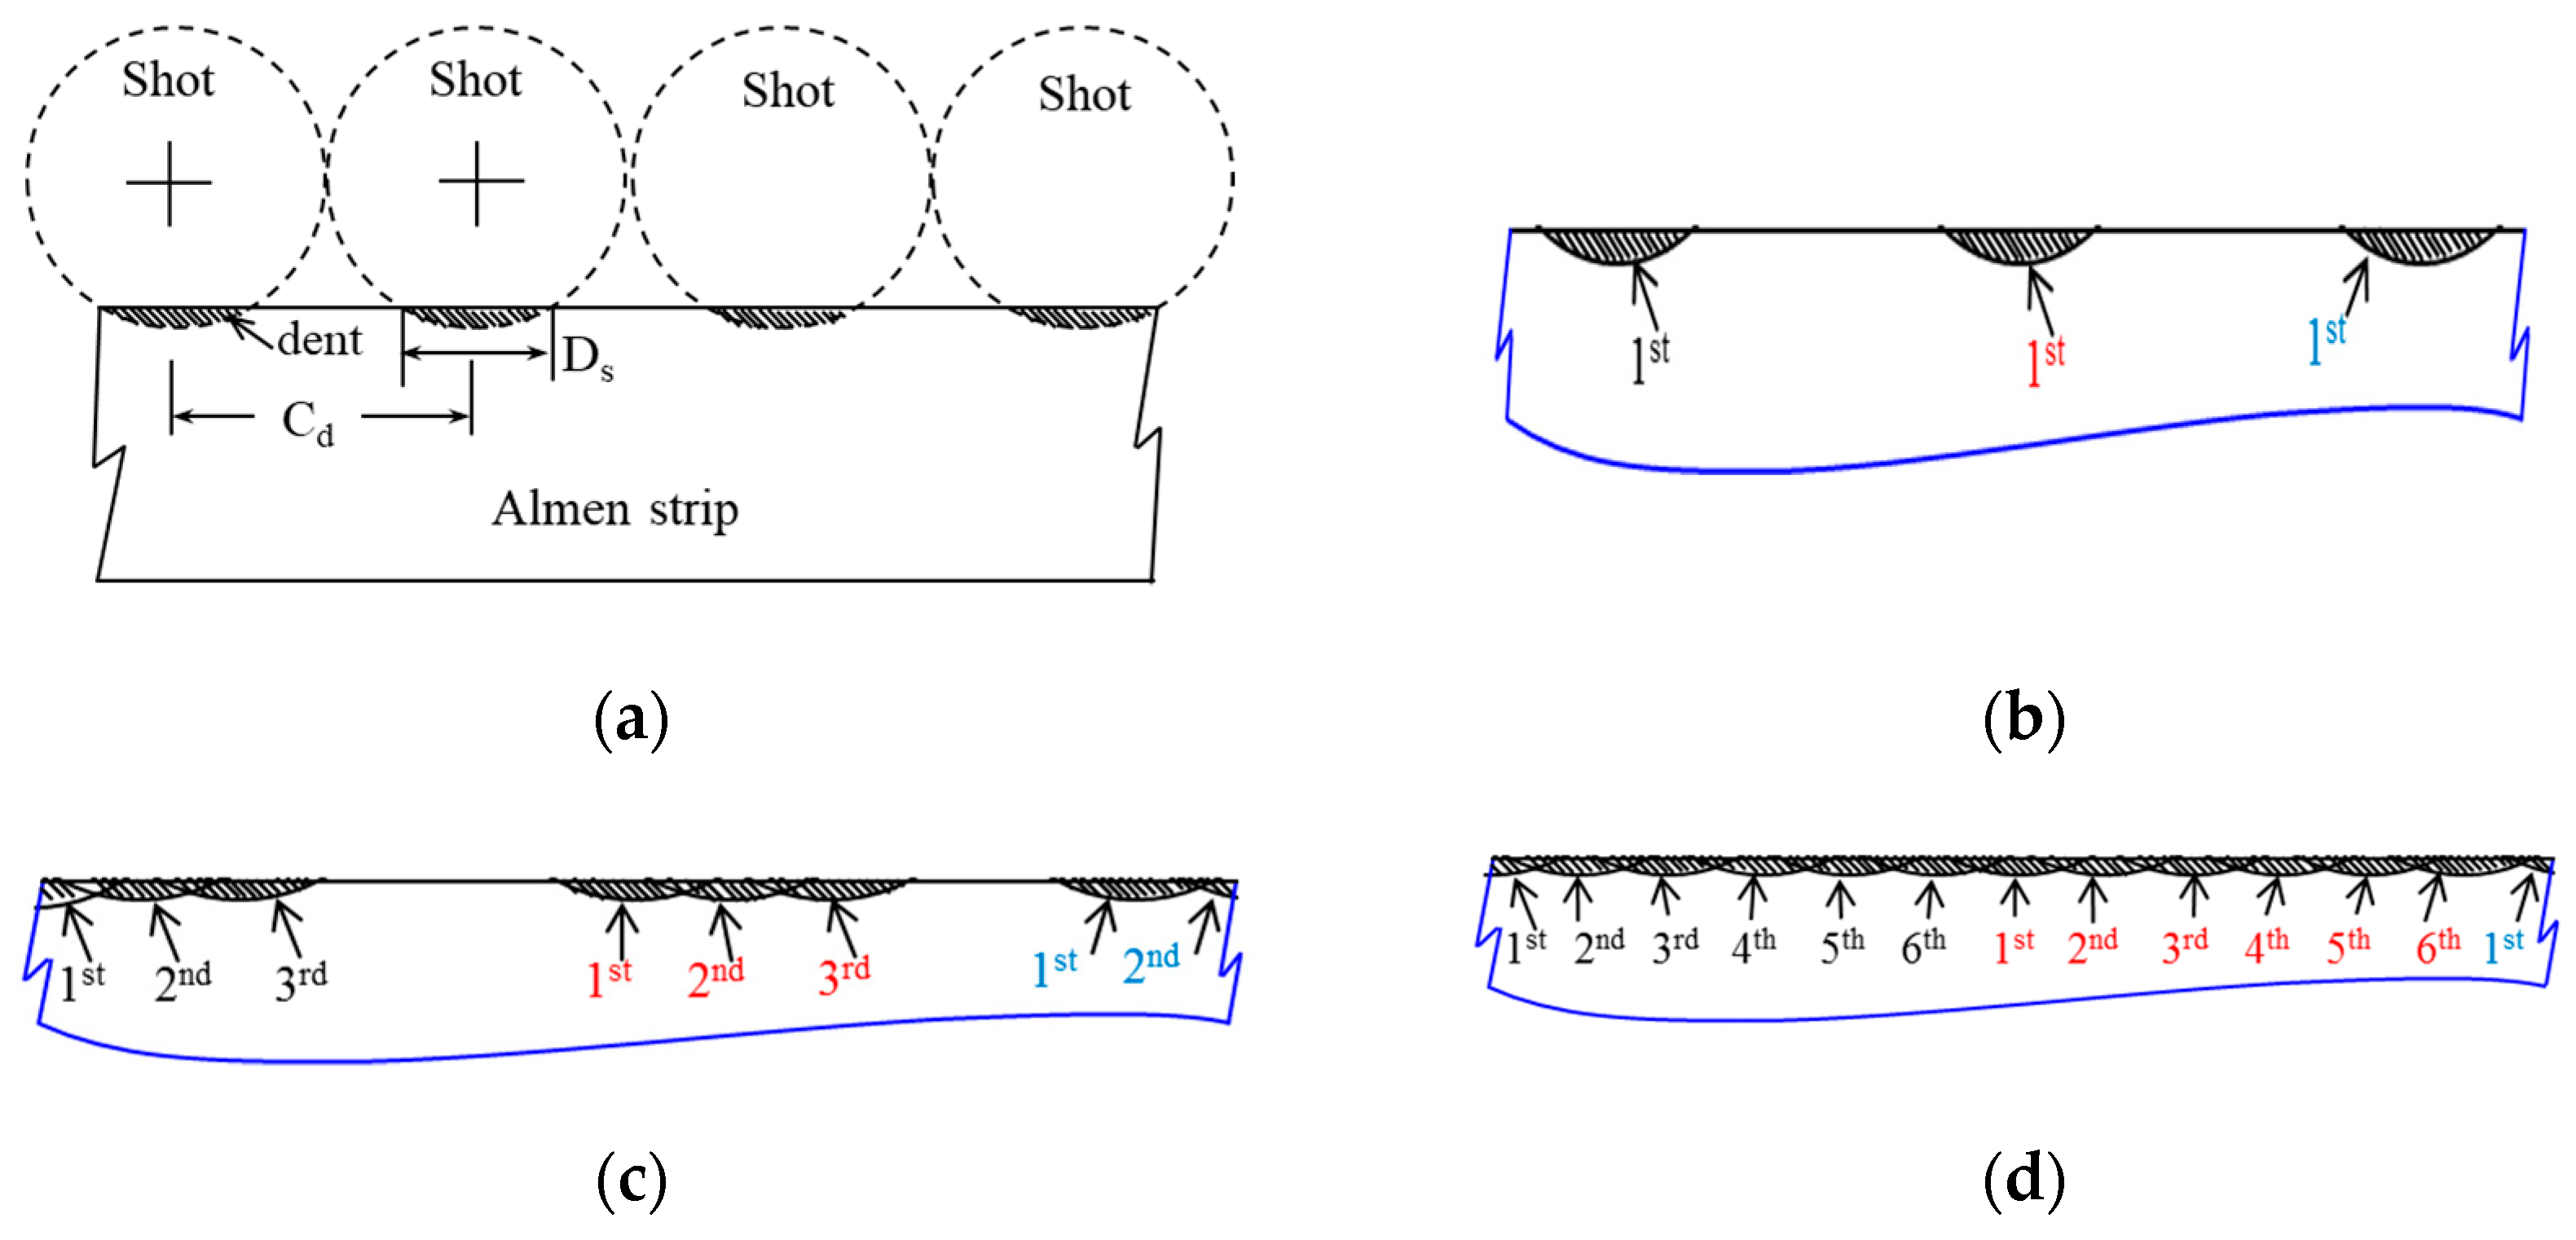
Figure 1. Schematic of dent size on the surface of Almen strip in 1-cycle (100% peening coverage). (a) the first row impacts the Almen strip surface, (b) the dent position of the first-row impact, (c) the dent position of the third-row impact, (d) the dent position of the 1-cycle.
Applsci 10 00105 g001
Figure 2. (a) Boundary condition of the Almen strip when a modified Almen strip holder is used; (b) Enlarged meshes at a part.
Applsci 10 00105 g002
Figure 3. Variation of yield strength with strain rate.
Applsci 10 00105 g003
Figure 4. Schematic of dimple (dent or indentation) diameter on the Almen strip by a single shot.
Applsci 10 00105 g004
Figure 5. The impact sequence and position for 100% peening coverage at 1-cycle.
Applsci 10 00105 g005
Figure 6. Impact velocity is calculated by measuring the distance a shot traveled. (a) A high-speed camera is employed to measure the impact velocity, (b) measure the distance between the two balls to get the impact velocity.
Applsci 10 00105 g006
Figure 7. Variations of the Almen strip deflection profile at different impact velocities. (a) with impact velocity 25 m/s, (b) with impact velocity of 30 m/s, (c) with impact velocity of 35 m/s.
Applsci 10 00105 g007aApplsci 10 00105 g007b
Figure 8. Variations of the saturation curves of the arc height at different impact velocities.
Applsci 10 00105 g008
Figure 9. Variations of the Almen intensity with various peening coverage at different dent size. (a) 0.125mm, (b) 0.14mm, (c) 0.16mm.
Applsci 10 00105 g009aApplsci 10 00105 g009b
Figure 10. Residual compressive stress profiles for different impact velocity and peening coverage. (a) 0.125mm, (b) 0.14mm, (c) 0.16mm.
Applsci 10 00105 g010aApplsci 10 00105 g010b
Figure 11. Residual compressive stress variation of different peening coverage. (a) surface residual compressive stress, (b) Maximum residual compressive stress.
Applsci 10 00105 g011
Table 1. Mechanical properties of SAE 1070 steel.
PropertyValue
Density7800 kg/m3
Poisson’s Ratio0.29
Young’s Modulus205 GPa
Yield Strength1268 MPa
Ultimate Strength1422 MPa
Elongation8.2%